Article

Revisiting Popular Frameworks of Geometric Thinking: The Case of Mariah’s Thinking About Hierarchical Relationships and Diagrams

School of Teacher Education, Florida State University, Tallahassee, FL 32306-4459, USA
*
Author to whom correspondence should be addressed.
Educ. Sci. 2025, 15(10), 1283; https://doi.org/10.3390/educsci15101283
Submission received: 25 August 2025 / Revised: 22 September 2025 / Accepted: 23 September 2025 / Published: 25 September 2025
(This article belongs to the Section STEM Education)

Abstract

Understanding hierarchical geometric relationships represents an important step in the development of geometric thinking. However, researchers have reported challenges in the teaching of this topic to both K–12 students and preservice teachers. Prominent frameworks regarding geometric thinking may influence researchers to focus on certain aspects while ignoring others. Most notably, the roles of hierarchical diagrams and explicitly stated inclusive definitions in the process of learning hierarchical geometric relationships have received insufficient attention. We conducted a teaching experiment with a preservice teacher whom we call Mariah. Over the course of the sessions, she made substantial progress in her thinking about hierarchical geometric relationships. We present the results in the form of two arguments, which we summarize as follows: (a) it is possible for a learner to entertain definitions and their consequences without necessarily changing their conceptions of the shapes involved; and (b) communication with diagrams is nontrivial and can be intertwined with learners’ conceptualizations of relationships among shapes; furthermore, learners’ conceptualizations of hierarchical relationships do not necessarily follow trivially from their conceptions of the shapes involved. We offer implications for the teaching of hierarchical relationships and for further research into the learning of hierarchical relationships.

1. Introduction

Geometry is a foundational branch of mathematics crucial in developing spatial reasoning, critical thinking, and problem-solving skills, beginning in the elementary grades (NCTM, 2000; Clements & Sarama, 2014). Geometric thinking has been a topic of interest in mathematics education research for many decades, dating back to the doctoral work of Dina and Pierre Van Hiele. The Van Hiele (2004) model identifies levels that mark important milestones in the learning of geometry. Of particular interest is the transition from analysis to informal deduction, at which point learners make logical inferences about shapes based on their properties. These include inferences regarding hierarchical relationships (e.g., to think of a square as a type of rectangle), which depend on formal definitions (Van Hiele, 2004). Hierarchical geometric relationships are emphasized in standards documents in many countries, including Canada, China, New Zealand, South Africa, South Korea, and the United States (Abdullah & Shin, 2019; Department of Basic Education, 2011; Ministry of Education, 2024; Ontario Ministry of Education, 2020; National Governors Association Center for Best Practices [NGA] & Council of Chief State School Officers [CCSSO], 2010; Zhou et al., 2022).
Other than the Van Hiele model, the most prominent framework applicable to the topic of hierarchical geometric relationships is that of figural concepts, owing to Fischbein (1993). Fischbein built on the work of Tall and Vinner (1981) regarding concept definitions and concept images. He emphasized the contrast between figural and conceptual aspects of geometric shapes, highlighting the potential for conflict between the two. Fujita and Jones carried this work further with a specific focus on hierarchical geometric relationships (Fujita, 2008, 2012; Fujita & Jones, 2007).
Both research and instruction regarding hierarchical geometric relationships tend to involve the use of diagrams to represent and communicate about such relationships (e.g., Jones, 2000; Brunheira & da Ponte, 2019). However, there is inconsistency in the terminology and conventions associated with hierarchical diagrams. In particular, the term “Venn diagram” has conflicting uses across fields (Kimmins & Winters, 2015). Furthermore, despite the ubiquity of hierarchical diagrams in instruction regarding hierarchical geometric relationships, we do not find attention in the literature to learners’ interpretations and use of such diagrams. In this manuscript, we distinguish between two types of diagrams that both often go by the name “Venn diagram.” For this reason, we introduce alternative terminology for these two types of diagrams.
Research indicates challenges in the teaching and learning of hierarchical geometric relationships in studies of both K–12 students and preservice teachers (PSTs) (Brunheira & da Ponte, 2019; Fujita & Jones, 2007; Jones, 2000). Fujita and Jones (2007) frame the challenge of supporting PSTs’ learning of this topic in terms of Van Hiele Levels, especially the transition from analysis to informal deduction. They also draw on Fischbein’s theory of figural concepts to explain the challenges that make it difficult to accomplish that transition.
We draw from the literature to understand the challenges associated with hierarchical geometric relationships and how these challenges might be overcome. The literature highlights the point that PSTs often think about some properties of quadrilaterals exclusively rather inclusively: for example, they may say that parallelograms are not allowed to have right angles (Fujita & Jones, 2007). This tendency presents a difficulty because mathematical sources tend to use inclusive definitions (e.g., the angles of a parallelogram are not restricted) (e.g., de Villiers, 1994; Florida Department of Education, 2023; Wolfram, 2025); as a result, PSTs’ thinking is often at odds with mathematical conventions. In our view, the literature regarding thinking and learning about hierarchical geometric relationships provides the following: (a) a theoretical framing of the problem and learning goal; (b) findings related to challenges or difficulties associated with achieving that learning goal; and (c) instructional recommendations aimed at that learning goal. As the case presented in this article illustrates, we believe that more attention should be paid to certain aspects of the learning process, especially learners’ interpretation and use of definitions and diagrams.
The present study is thus motivated by empirical, methodological, and theoretical interests. Empirically, we are interested in documenting the details of the process by which a PST (for whom we use the pseudonym “Mariah”) made the successful transition from analysis to informal deduction, specifically in terms of hierarchical classification of specific quadrilaterals. Methodologically, we are interested in how the prominent frameworks of geometric thinking in the literature can help us to understand Mariah’s learning process and whether any modification to those frameworks seems warranted in light of her case. Theoretically, we are interested in how to productively conceptualize the teaching and learning of hierarchical geometric relationships, especially in a way that accounts for the roles of definitions and diagrams in that process.

2. Conceptual Framework

We draw on the most prominent frameworks of geometric thinking, which we summarize below. We also make use of an important distinction regarding types of definitions. Finally, distinctions regarding types and interpretations of diagrams are also central to this study, so we define two different types of diagrams that often go by the same name: “Venn diagram”.

2.1. Frameworks of Geometric Thinking

Much of the literature in geometry education uses the Van Hiele (2004) model, which frames geometric thinking as consisting of five levels, the first three of which are relevant to the elementary grades: visualization, analysis, and informal deduction (Van Hiele, 2004). At the visual level, learners think about figures based on appearance. A learner may consider a shape to be a “square” because it resembles other shapes that are called “square.” At the analysis level, learners begin to consider figures as belonging to classes of shapes, based on properties that are common to all shapes of the same name. At the informal deduction level, learners identify relationships between shapes based on their properties and make logical inferences.
Fischbein’s theory of figural concepts (Fischbein, 1993) frames understanding of geometric figures as mental representations with two aspects, figural and conceptual. The figural aspect refers to the visual form one associates with a figure, while the conceptual aspect refers to the geometric properties that define a figure. Fischbein argues that students must interact with both aspects; however, there may be tension between them (e.g., associating parallelograms with acute and obtuse angles, despite the definition allowing for right angles).
Building on the work of Fischbein (1993), Fujita and Jones (2007) offer a theoretical framing specific to thinking and learning about hierarchical geometric relationships. Central to this theoretical framing are two constructs: personal figural concept and formal figural concept. Personal figural concepts combine learners’ concept images and concept definitions for a given shape. Formal figural concepts are formal or authoritative definitions of shapes, like those found in a mathematics textbook.
We also draw upon the work of de Villiers (1994) regarding the issue of classification of quadrilaterals. He discussed two contrasting approaches: partitional and hierarchical classification. In partitional classification, each subset of the set of quadrilaterals is treated as disjoint from the others. For example, quadrilaterals with two pairs of parallel sides are called parallelograms—unless they have right angles, in which case they are called rectangles and are not considered parallelograms. In hierarchical classification, by contrast, rectangles are treated as a special type of parallelogram. Thus, the approach to classification is closely related to the kinds of definitions used. Partitional classification goes hand in hand with exclusive definitions. For example, a parallelogram might be defined as a quadrilateral with two pairs of parallel sides and pairs of acute and obtuse angles. This definition excludes rectangles. Definitions that lend themselves to hierarchical classification are inclusive. For example, if a parallelogram is simply defined as a quadrilateral with two pairs of parallel sides, then nothing prevents rectangles from being included in the set of parallelograms. De Villiers notes that partitional classification is not incorrect; it represents an alternative approach to classification. He goes on to argue that there are advantages to hierarchical classification. The distinction between partitional and hierarchical classification, and relatedly between exclusive and inclusive definitions, informs our conceptualization of the teaching and learning of hierarchical geometric relationships.

2.2. Set–Subset Diagrams vs. Compare-and-Contrast Diagrams

The use of diagrams is common in instruction regarding hierarchical geometric relationships (e.g., Whitacre et al., 2025b; Brunheira & da Ponte, 2019; Jones, 2000). Furthermore, diagrams feature prominently in the case we will present of Mariah’s thinking and learning about hierarchical relationships. However, differences in interpretation of diagrams and associated terminology can lead to miscommunication. For that reason, it is important to address two different kinds of diagrams, which often go by the same name.
The term “Venn diagram” appears frequently in mathematics education sources, including policy documents, curriculum materials, and research articles (e.g., Brunheira & da Ponte, 2019; Common Core Standards Writing Team, 2013; Florida Department of Education, 2023; Houghton Mifflin Harcourt, 2010). Kimmins and Winters (2015) made an important contribution to the teacher education literature by pointing out that “Venn diagram” has a different meaning in language arts education than it does in mathematics education. They call the usage in language arts a kind of “graphic organizer” (p. 486). Kimmins and Winters define the meaning of “Venn diagram” in language arts more formally as follows:
In language arts, the circles in a Venn diagram typically represent things that can be compared and contrasted. For example, the items could be characters in a story, philosophies of teaching, or classes of animals. In this usage, the characteristics are placed in the circles, with characteristics that both share placed in the overlapping portion of the circles and characteristics unique to one placed in the nonoverlapping portion of the appropriate circle. This serves to highlight similarities and dissimilarities of the items being compared. (pp. 486–487)
Kimmins and Winters define the meaning of “Venn diagram” in mathematics as follows:
In contrast, in the subject area of mathematics, the circles typically represent not things but their attributes or characteristics. The things are typically mathematical objects, such as numbers or geometric figures. The objects themselves, or representations of the objects, are placed in the circles instead of characteristics of the objects being placed in the circles. In this case, the Venn diagram is used to sort the objects into sets, or in other words, to classify the objects according to whether they possess the characteristics represented by the circles. (p. 487)
Given these two different meanings, Kimmins and Winters found the term “Venn diagram” to be a source of miscommunication between a teacher educator and a group of teachers. Likewise, we have found this term to be a source of miscommunication in our work with preservice teachers (Whitacre et al., 2025a, 2025b). To avoid miscommunication with readers of this manuscript, we use unique names to distinguish these two types of diagrams.
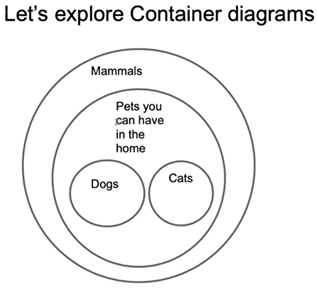
We use the term set–subset diagram to refer to diagrams that are populated by objects and are used to represent hierarchical, or set–subset relationships. Such diagrams can be arranged in a variety of ways, depending on the number of sets involved and how they are related to one another. These kinds of diagrams are often called “Venn diagrams” in mathematics education sources (e.g., Common Core Standards Writing Team, 2013; Nelson, 2008).1 Figure 1a offers an example of what we mean by a set–subset diagram.
We use the term compare-and-contrast diagram to refer to overlapping circles used for highlighting similarities and differences. These are populated by descriptive words. Thus, our use of “compare-and-contrast diagram” is consistent with the typical meaning of “Venn diagram” in language arts (Fogarty, 2007; Kimmins & Winters, 2015). Figure 1b offers an example of what we mean by a compare-and-contrast diagram.
In Figure 1a, the large circle represents the set of mammals. The smaller circles represent the sets of cats and dogs, which are subsets of the set of mammals. Note that the circles for cats and dogs do not overlap. If they did, it would indicate that some animals can be considered both cats and dogs. In Figure 1b, the circles for cats and dogs do overlap. This arrangement of circles is a requirement for a compare-and-contrast diagram. In this case, the fact that cats and dogs are both mammals is communicated by writing “mammals” in the overlapping region. In the set–subset diagram, the same fact is communicated by using “Mammals” as the label for the large circle, which encompasses “Cats” and “Dogs” and other types of mammals. Note also that the set–subset diagram is populated by objects, including cats and dogs, whereas the compare-and-contrast diagram is populated by words.

3. Literature Regarding Thinking and Learning About Hierarchical Geometric Relationships

Returning to thinking and learning about hierarchical geometric relationships, the literature provides (a) a theoretical framing, (b) findings related to challenges or difficulties, and (c) instructional recommendations. We present a synthesis of what we gain from the literature in terms of those three aspects. We then question some assumptions evident in the literature, which motivate the present study.

3.1. Theoretical Framing in the Literature

A big-picture framing is provided by the Van Hiele levels, especially the contrast between analysis and informal deduction. According to Van Hiele theory, learners must proceed sequentially through the levels of geometric thinking. These transitions involve making the products of thought at one level the objects of thought at the next. In the case of the transition from analysis to information deduction, the products of thought at the analysis level are properties of shapes. These become objects of thought as learners engage in activities that involve reasoning about the implications of properties or sets of properties (Crowley, 1987).
Further theorization related to hierarchical geometric relationships is provided by Fischbein and colleagues (Fischbein, 1993; Mariotti & Fischbein, 1997), together with the work of Fujita and Jones (2007) regarding figural concepts (as outlined previously). As an illustration of this framing, Mariotti and Fischbein (1997) analyze a 6th-grade classroom discussion regarding parallelepipeds. They characterize this discussion in terms of miscommunication arising from a conflict between figural and conceptual aspects:
Although a predominance of the figural component, not even in this case, can we speak of pure figural thinking. In fact, the characterisation of a parallelepiped in terms of its rectangular faces requires the intervention of the conceptual component; this conceptualisation is adequate to describe the parallelepiped, as it appears, and to distinguish it from other solids, but it is inadequate to include the parallelepiped within the more general class of prisms. Because of the need of settling the disagreement, the conceptual component is mobilised and suddenly, Chiara (69) shifts to a new point of view. She attempts to characterize the parallelepiped by means of the geometrical property of parallelism of faces. (p. 230)
An evident theme in this literature is the conceptualization of a kind of competition between figural and conceptual aspects and the need for the conceptual to prevail or take precedence. Related to this framing is the implicit association of figural with exclusive and conceptual with inclusive.

3.2. Findings Reported in the Literature

On the one hand, studies focused on the results of interventions that employ instructional approaches informed by the Van Hiele theory generally report positive results on broad measures of geometric thinking (Naufal et al., 2021). On the other hand, studies that focus specifically on thinking and learning related to hierarchical geometric relationships reveal challenges. They do this through reporting the results of assessment studies focused on levels of geometric thinking (e.g., Decano, 2017; Fujita & Jones, 2007; Mensah et al., 2023; Pickreign, 2007), as well as through reporting the results of interventions and/or documenting aspects of the learning process (Brunheira & da Ponte, 2019; Bulut & Bulut, 2012; Jones, 2000).

3.2.1. Studies of Learners’ Thinking About Quadrilaterals

Fujita and Jones (2007) report challenges in learners’ reasoning about hierarchical geometric relationships, which they attribute to the influence of prototypical images of shapes on learners’ interpretations and claims regarding hierarchical classification. For example, the authors reported that the vast majority of PSTs in their study could draw a correct example of a parallelogram (96.8%), a square (97.5%), and a rectangle (98.1%); however, far fewer provided definitions of these shapes that were considered correct (58.9%, 38%, and 21.5%, respectively). One major reason for definitions being considered incorrect was that many participants wrote exclusive definitions (e.g., specifying that a rectangle must have two long sides and two short sides) rather than inclusive definitions. Fujita and Jones emphasize the point that the drawings the participants produced were correct examples of the quadrilaterals; at the same time, these images seemed to strongly influence PSTs’ written definitions. This phenomenon is easy to understand: When asked to draw an example of a rectangle, PSTs drew an oblong rectangle. When asked to define rectangle, they implicitly defined oblong rectangle, thus defining rectangle in a way that excluded squares. In other words, the PSTs often seemed to have in mind exclusive definitions for quadrilaterals that are conventionally defined inclusively.
Fujita and Jones emphasize potential conflicts between figural and conceptual aspects. They cite evidence that PSTs might know the formal definition of a shape and yet be overly influenced by prototypical images associated with that shape, leading to responses that are considered incorrect. They explain that this prototype phenomenon (Hershkowitz, 1989) leads learners to implicitly attach non-critical visual attributes to their definitions, such as assuming parallelograms cannot have right angles or that rectangles must have two longer and two shorter sides. Therefore, while learners might know the formal definition of a shape, their reasoning about hierarchical relationships may be driven more by their concept images (i.e., by the “figural” aspect).
Pickreign (2007) analyzed PSTs’ “personal definitions” of rectangle and rhombus, based on written responses (p. 2). He regarded most of the PSTs’ responses as incorrect, especially for rhombus. Many incorrect responses were characterized by exclusivity (e.g., stating that rectangles have two long sides and two short sides). Pickreign drew the unwarranted conclusion that most PSTs in his study were at the visualization level, the first of the Van Hiele levels (a claim with which Fujita and Jones (2007) disagree, as do we). It is noteworthy that Pickreign’s impression seemed to largely be determined by the fact that many PSTs simply favored exclusive definitions.

3.2.2. Studies Focused on the Learning of Hierarchical Geometric Relationships

Jones (2000) reports substantial progress in 12-year-old students’ learning about the properties of geometric figures when working in a dynamic geometry environment. However, in the final phase of instruction, when students were expected to fill in a diagram representing a hierarchy of quadrilaterals, their responses to the teachers’ questions still indicated partitional thinking:
Teacher: Why is a square a special sort of rectangle?
Russell: Because they’ve both got right angles [at the vertices] but with a rectangle [indicating one that is not a square] one of the sides is bigger than the other. (p. 77)
Clearly, Russell’s response treats “rectangle” as meaning oblong rectangle, in which case a square is not a special sort of rectangle. Jones acknowledges “issues to do with… the language used for class inclusions” and the fact that Russell’s response implied an exclusive definition of rectangle (p. 79). This example highlights the need for explicit discussion of types of definitions, inclusive vs. exclusive, which was not reported in Jones’ description of the instructional sequence used in that study.
Brunheira and da Ponte (2019) report on a teaching experiment focused on classification of quadrilaterals and prisms. They report progress in PSTs’ understanding of classification and that there was “a lower influence of prototypical images” (p. 65) in the study of prisms, which came after the study of quadrilaterals. They note, “However, the final evaluation test showed that the prospective teachers still had misunderstandings,” some of which they attribute to issues with “logical reasoning” (p. 65).
Taken together, these studies identify challenges in the teaching and learning of hierarchical geometric relationships. A common thread that we see among them is the contrast between partitional and hierarchical classification, which is often framed as a conflict between figural and conceptual aspects.

3.2.3. Instructional Recommendations from the Literature

We find in the literature recommended instructional activities intended to facilitate the transition from analysis to informal deduction. These include orienting learners to essential properties of shapes, to reasoning from definitions, and to engaging in argumentation. This process includes the use of formal definitions, logical arguments, and abstract representations such as hierarchical diagrams (Crowley, 1987; Fischbein, 1993; Van Hiele, 2004). Van Hiele emphasized exploration and argumentation so that learners have opportunities to establish geometric relationships based on their thinking, rather than being told what the correct relationships are supposed to be. Recommended activities to facilitate the transition from analysis to informal deduction involve opportunities for logical, or if-then, reasoning (van de Walle et al., 2019). Such activities include using definitions, presenting and following informal arguments, and using diagrams (Crowley, 1987). Fischbein stressed that learners should be made aware of conflicts between figural and conceptual aspects and should be asked to perform geometric tasks “according to the definition” (p. 155).
In the study described by Jones (2000), there is no indication that definitions of the quadrilaterals were ever provided to students or that official definitions that the class would use were otherwise established. However, the tasks in Phase 3 (which focused on hierarchical relationships) assumed specific hierarchical relationships and asked students to justify those relationships (e.g., “Why is a square a special sort of rectangle?” (p. 77)). We interpret the recommendation from Van Hiele as rather the opposite: definitions are needed, and students should be invited to reason and arrive at their own conclusions about hierarchical relationships, based on those definitions. It seems to us no wonder that Russell and the other students in the study responded as they did to questions regarding hierarchical relationships: They had in mind exclusive definitions and yet were trying to appease the teacher at the same time.

3.2.4. Questioning Assumptions Evident in the Literature

We find in the literature a set of assumptions regarding the challenges that arise in the learning of hierarchical geometric relationships. Authors assume that the challenges reported can be explained as follows: Learners’ personal figural concepts (PFCs) for shapes, driven by the figural aspects of their concept images, often conflict with the official definitions of those shapes. Furthermore, learners’ conceptualizations of the relationships between shapes follow from their PFCs for the shapes. Thus, issues with the claims learners make about relationships between shapes (i.e., claims that do not accord with those made by authoritative mathematical sources) are due primarily to learners’ “limited” PFCs for the shapes (Fujita, 2008, 2012; Fujita & Jones, 2007). A clear example of the above assumptions comes from Fujita and Jones (2007):
When we classify quadrilaterals, we exercise our own personal figural concepts, and the result depends on what personal figural concepts of quadrilaterals we have… For example, if one’s personal figural concept of parallelograms excludes rhombuses from the images of parallelograms, one may not accept a rhombus is a special type of parallelogram. (p. 6).
This quote clearly illustrates the assumption that learners’ claims regarding classification follow from their PFCs. It also frames the goal of instruction in terms of convincing learners to “accept” the canonical claims about hierarchical relationships.
Given this view of the problem, authors assume that the solution lies in changing learners’ PFCs of the relevant shapes: If learners’ PFCs change to align with the official definitions of the shapes (given the assumption that learners’ conceptualizations of relationships between shapes should follow from their PFCs), then learners’ conceptualizations of the relationships between shapes should shift to align with the authoritative mathematical claims about those relationships. This point is illustrated by the following quote from Fujita (2008): “Through the development, images and concepts would be harmonised, and learners would be able to use them flexibly to solve various problems in geometry” (p. 33). The idea is that resolving conflicts between figural and conceptual aspects will enable learners to successfully learn hierarchical geometric relationships. This view is also evident in the study of Jones (2000) and in the analysis offered by Mariotti and Fischbein (1997).
Conceptualizing the learning of hierarchical geometric relationships in terms of competition between figural and conceptual aspects (which hopefully eventually gives rise to a harmonious relationship between these aspects) is one option. An alternative framing is the contrast between partitional and hierarchical classification, which goes hand in hand with the distinction between exclusive and inclusive definitions. In our view, the learner who favors partitional classification is not positioned as being at a lower level of thinking or as experiencing an internal conflict; rather, the salient challenge involved in the learning of hierarchical geometric relationships is miscommunication. We find it noteworthy that types of definitions (inclusive vs. exclusive) are rarely made explicit to learners in these studies. In some cases, definitions are not discussed explicitly, and yet learners are expected to (learn to) reason about hierarchical relationships in ways that are consistent with the unstated definitions (Mariotti & Fischbein, 1997; Jones, 2000).
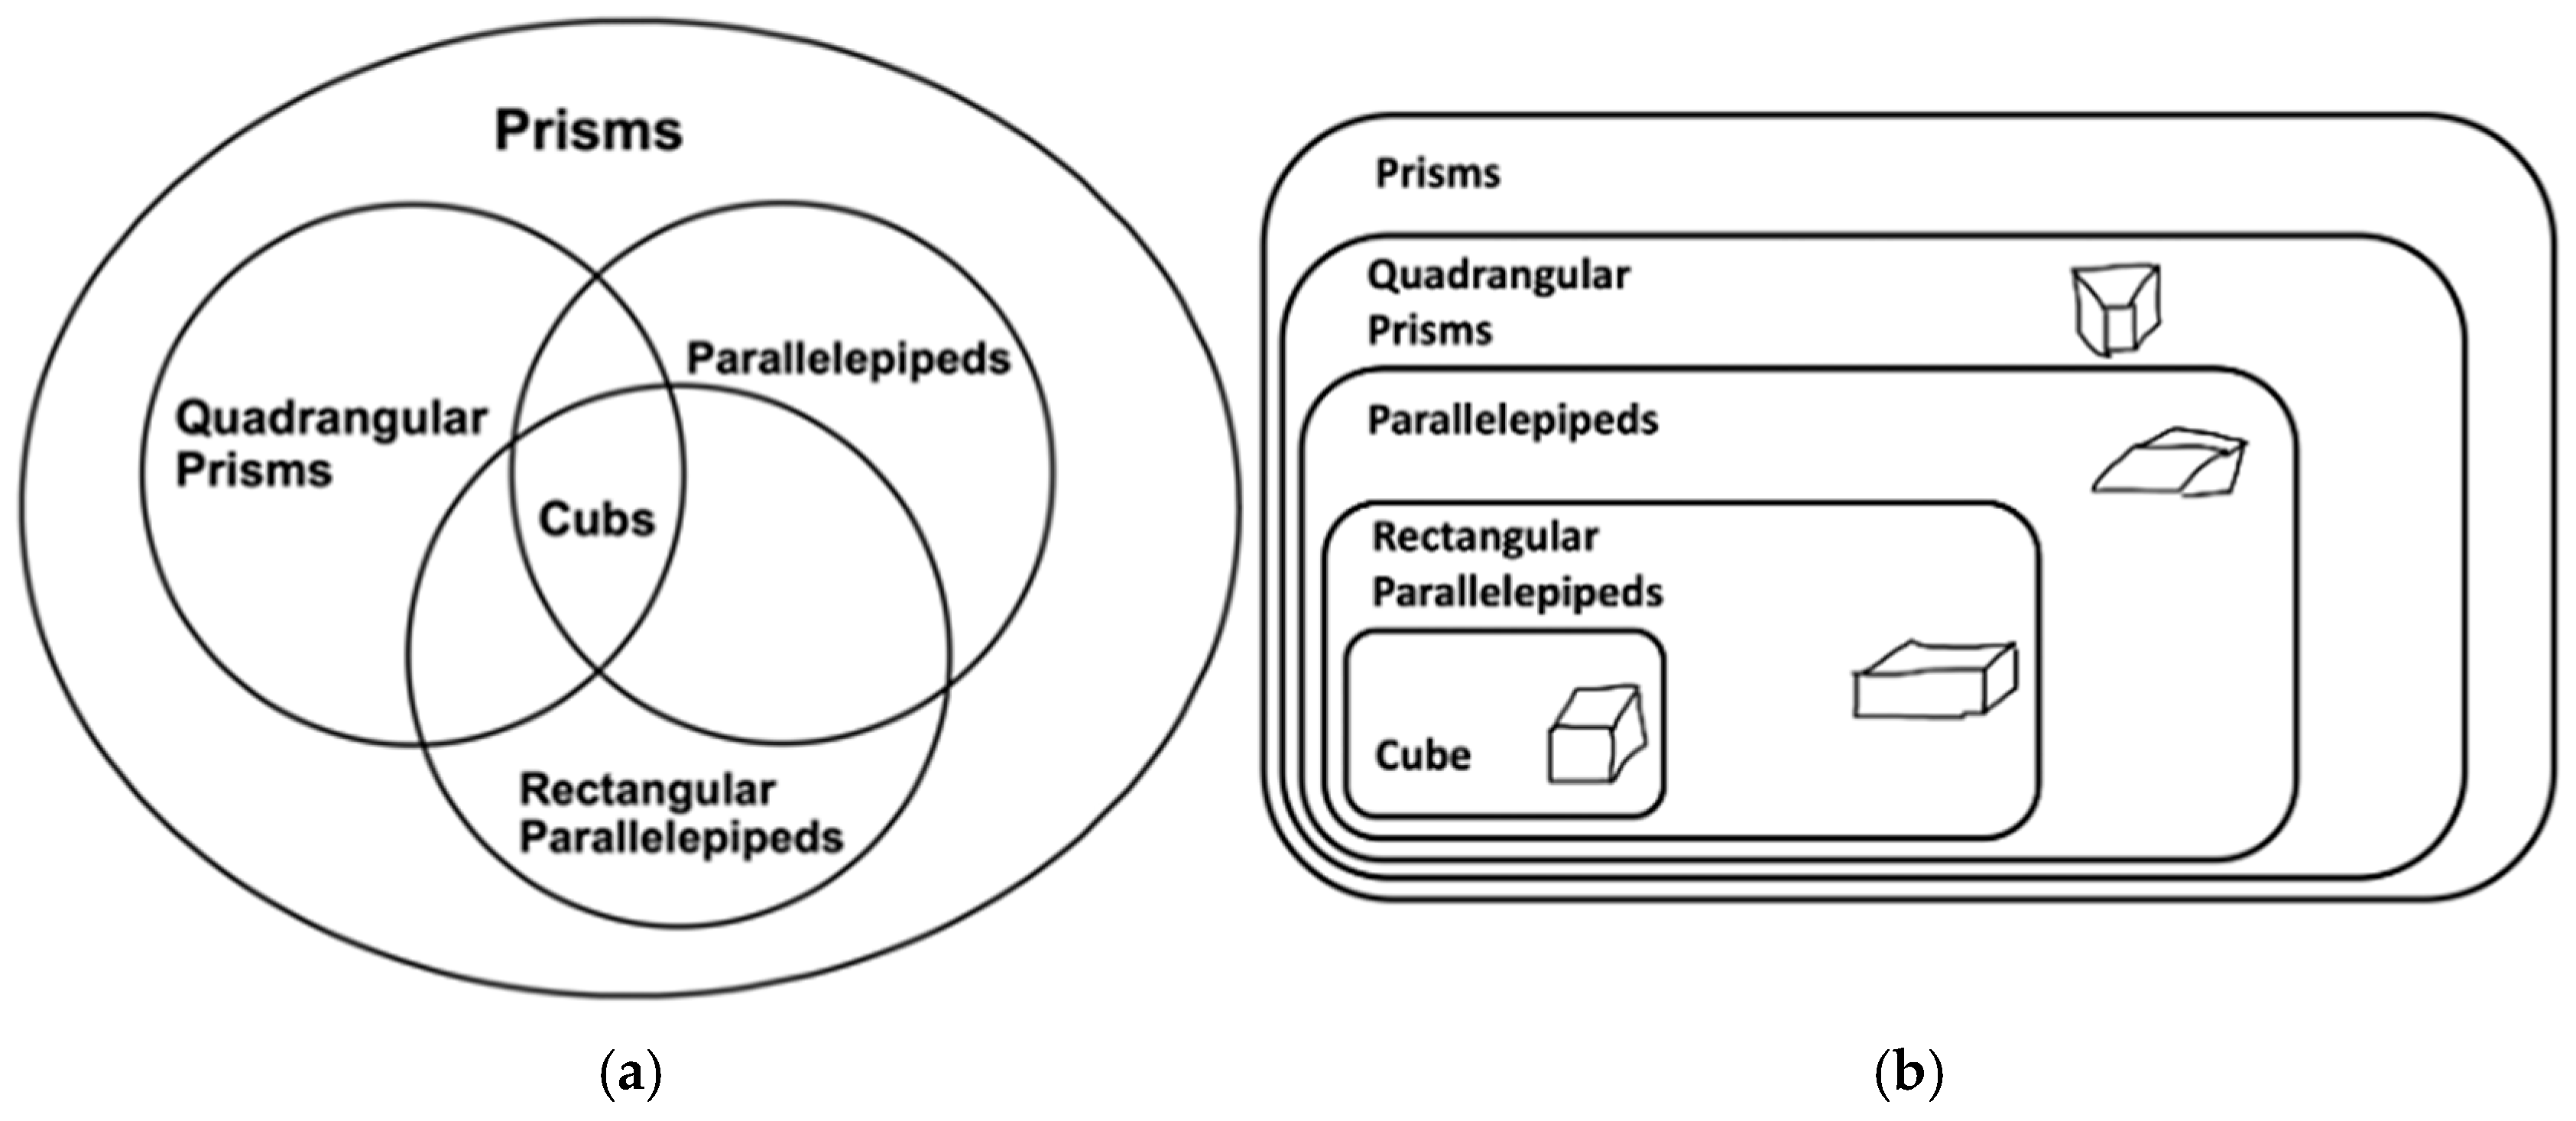
There is some acknowledgement in the literature of challenges not directly related to learners’ PFCs, such as “language interpretation and logical reasoning” (Brunheira & da Ponte, 2019). However, these aspects have not been the focus of research in this area. In many cases, there seems to be an implicit assumption that the words and diagrams used to communicate about relationships are understood similarly by instructors and learners alike. Because this assumption is implicit, it is not spelled out. However, evidence for it comes from the fact that authors have focused on learners’ PFCs and classification claims without attending to other aspects of communication. The clearest example comes from Brunheira and da Ponte (2019). Reporting results of a classroom teaching experiment, the authors share a PST’s responses to the following classification task: “Construct a Venn diagram that includes the following classes of solids: quadrangular prisms, cubes, parallelepipeds, prisms, rectangular parallelepipeds” (p. 76). They present Júlia’s work (Figure 2: “first attempt” on the left and “final answer” on the right) as evidence of progress in her thinking about classification of prisms.
Our impression of Júlia’s work, informed by extensive study of PSTs’ thinking about diagrams (Whitacre et al., 2025a, 2025b), together with the distinction identified by Kimmins and Winters (2015), is that it indicates a shift in her interpretation of “Venn diagram.” It seems to us that what likely changed from Júlia’s first attempt to her final answer was her interpretation of the instructor’s expectation regarding what type of diagram she should create, not necessarily a shift in her thinking about the hierarchical relationships involved. She was told to produce a “Venn diagram,” so her first attempt was a diagram that met that description for her (a compare-and-contrast diagram). Evidently, through interaction with the instructor, she realized that the expectation was to produce a set–subset diagram instead, and so she did so. There is no evidence presented that Júlia’s thinking about prisms or relationships between prisms changed.
We raise these issues regarding assumptions because the case that we will present highlights two important points: (a) communication with diagrams is nontrivial and, in fact, can be intertwined with learners’ conceptualizations of relationships; learners’ conceptualizations of hierarchical relationships, especially those that are not simple set–subset relationships, do not necessarily follow trivially from their PFCs for the shapes involved; (b) learners can entertain definitions and their consequences without necessarily changing their personal definitions for the shapes; they can reason logically about the consequences of definitions, whether or not they prefer or agree with the definitions involved.2
We owe a debt of gratitude to the many authors who have contributed to the literature regarding hierarchical geometric relationships. We build on their work in the present study. Our contribution lies in highlighting the above assumptions and in presenting a case that provides grounds for questioning these assumptions, as well as investigating new questions. We hope to spark further discussion in the literature and further progress in understanding the teaching and learning of this important and fascinating mathematical topic.

4. Materials and Methods

We aimed to document Mariah’s learning process and to critically examine the tools available for doing so. We employed PFCs to document Mariah’s thinking and learning in a fine-grained manner. At the same time, we maintained some intellectual distance from the conceptualization of geometric thinking and learning found in the literature. Specifically, a substantial modification in the application of the PFC construct was necessary to make sense of Mariah’s case, as will be clear from the results presented.
Below, we describe the participant, as well as the instructional sequence. We then formally state our research questions and describe our methods of data collection and analysis.

4.1. Setting and Participant

The data for this study come from a teaching experiment (Steffe & Thompson, 2000) conducted in the summer of 2022. We conducted individual sessions with Mariah (pseudonym). She was 18 years old and identified as a Black, Caribbean-American woman. Mariah had been accepted into an Elementary Education program at a large research university in the Southeastern United States. The sessions took place in the summer before she began the program.
The instructor was 44 years old and identified as a White male. He was a faculty member in the Elementary Education program and a member of the research team. The instructor’s role during the sessions was concerned with communication and clarification. He posed tasks and asked questions. As part of the instructional sequence, he also shared information in the form of terminology and definitions. He did not impose or suggest any answers regarding hierarchical relationships. It was up to Mariah to share her thinking about those relationships during each session.
The instructional sequence consisted of three lessons, spanning three one-hour sessions. The sessions were conducted via Zoom and involved Google Slides and Desmos Geometry. The target task for the unit was to construct a set–subset diagram relating several types of quadrilaterals (parallelograms, rectangles, rhombi, squares, and trapezoids) based on their official definitions, to explain those relationships in terms of defining properties, and to explain how the relationships were represented in the diagram. This set of quadrilaterals was chosen based on the state standards. Specifically, the intention was to align with MA.5.GR.1.1 (Florida Department of Education, 2023). The literature indicates that the target task tends to be quite challenging for PSTs (Brunheira & da Ponte, 2019; Fujita & Jones, 2007).

4.2. Instructional Sequence

The instructional sequence used in this study was extracted and revised from the geometry unit the instructor used in a mathematics education course in Spring Semester 2022. The course addresses mathematical knowledge for teaching (Ball et al., 2008) with a focus on fractions, decimals, geometry, and measurement. The complete geometry unit addresses various aspects of elementary geometry content and pedagogy. The summer 2022 teaching experiment was streamlined to focus on hierarchical relationships. The teaching experiment afforded the opportunity to closely study the thinking and learning of an individual PST about hierarchical relationships and related matters (e.g., diagrams to represent those relationships) in the context of an instructional sequence.
The instructional approach was informed by recommendations from the literature. These include the use of Desmos Geometry as a dynamic geometry environment, which allowed Mariah to explore the properties of quadrilaterals by manipulating dynamic constructions, or “shape makers” (Jones, 2000; Zembat & Gürhan, 2023). These opportunities for exploration are especially important for shapes that tend to be less familiar to PSTs, such as rhombi and trapezoids (Pickreign, 2007). Mariah considered relationships based on the properties she noticed, and she created diagrams to represent those relationships (Crowley, 1987). Relationships were discussed in a carefully designed sequence (Fujita & Jones, 2007). The instructor made Mariah aware of inclusive and exclusive definitions and invited her to consider their implications for classification (Fujita & Jones, 2007). Importantly, the instructor did not impose claims regarding hierarchical relationships. Mariah was responsible for thinking and sharing her thinking about hierarchical relationships (Van Hiele, 2004). By design, the instructor did inform Mariah about the official definitions of quadrilaterals from the state standards, so that she could reason about hierarchical relationships and make arguments based on established definitions (Crowley, 1987; Fischbein, 1993; Van Hiele, 2004).
Lesson 1: Mariah discussed what “Venn diagram” meant to her. She generated diagrams and shared her interpretations of various diagrams. These initial discussions were designed to raise important distinctions. We expect PSTs to associate the term “Venn diagram” with compare-and-contrast diagrams, rather than set–subset diagrams (Whitacre et al., 2025b). We aimed to bring Mariah’s attention the fact that the term “Venn diagram” is used in different ways. This fact served as motivation to adopt invented terminology. Mariah suggested names for diagrams of the two types discussed. (Generically in this article, we refer to these as “compare-and-contrast” and “set–subset” diagrams, but Mariah chose her own terminology for diagram types.) Naming these diagram types was intended to facilitate communication moving forward.
Mariah generated examples of diagrams to represent non-mathematical and then mathematical relationships. She was given the contexts of (a) apples and oranges and (b) ice cream and chocolate chip ice cream. These were meant to offer examples of different kinds of relationships and set up possible analogies to help support Mariah in discussing and representing geometric relationships. As a refresher regarding properties, Mariah manipulated quadrilateral constructions in Desmos Geometry (first square and rectangle, then parallelogram and rhombus). After manipulating the constructions and discussing their behavior in relation to properties of the shapes, Mariah created diagrams to represent the square–rectangle relationship and rhombus–parallelogram relationships. This sequence is used for the following reasons: (a) square and rectangle are the most familiar quadrilaterals to PSTs; (b) as Fujita and Jones (2007) point out, the square–rectangle and rhombus–parallelogram relationships are easier for PSTs to recognize because the prototypical images of the shapes look alike; and (c) there is a potential analogy between the square–rectangle and the rhombus–parallelogram relationships.
Lesson 2: After a brief recap of Lesson 1, Mariah was shown two possible definitions each (one inclusive, one exclusive) for “rectangle” and “parallelogram.” Mariah shared her interpretations of the definitions and indicated which one she agreed with for each shape. The instructor introduced the distinction between inclusive and exclusive definitions. Mariah determined which definition was which based on familiarity with the terms “inclusive” and “exclusive” in other contexts. The instructor presented examples of set–subset diagrams in various contexts, and Mariah shared her interpretations of these. Building on the ice cream context from Lesson 1, the instructor asked Mariah to make a set–subset diagram representing the relationships between ice cream, mint ice cream, chocolate chip ice cream, and mint chocolate chip ice cream, treating these categories inclusively (based on given definitions). This context was used to set up a potential analogy that Mariah might make to the rectangle–rhombus–square relationship.
Mariah worked to create a diagram to represent the rectangle–rhombus–square relationship. This was a challenging task. She worked through several different options before eventually arriving at her final answer. A design issue we noted was that “rectangle” and “parallelogram” definitions had been discussed and settled at the beginning of the lesson, but definitions of “square” and “rhombus” had not been made explicit. Providing and explicit definition for “rhombus” helped Mariah to complete the task.
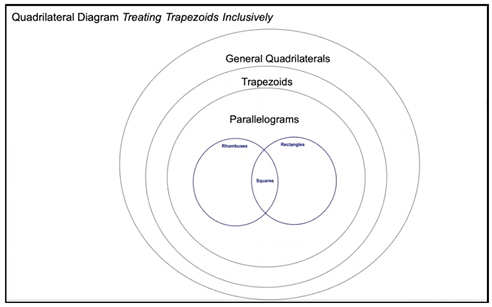
Lesson 3: Mariah explored trapezoids, beginning with a construction in Desmos Geometry. Mariah considered both inclusive and exclusive definitions for “trapezoid.” The instructor informed her that there is not a consensus definition of “trapezoid” across mathematical sources; however the glossary in the state standards used the inclusive definition. Mariah worked to determine and represent the hierarchical relationships between quadrilaterals, parallelograms, rectangles, rhombi, squares, and trapezoids. She used definitions consistent with those in the state standards. She made diagrams accounting for both the inclusive and exclusive definitions of “trapezoid.” To accomplish this target task, Mariah was responsible for deciding on the relationships and how to represent them in diagrams. She also explained the relationships in detail, based on the formal definitions of each type of quadrilateral.

4.3. Research Questions, Data Collection, and Analysis

Initially, we asked the following two-part research questions: How did Mariah’s personal figural concepts change over the course of the teaching experiment? How did her claims about hierarchical relationships between quadrilaterals change over the course of the teaching experiment? Videos of the Zoom sessions were transcribed. Our analytic process ultimately consisted of two distinct phases: (a) initial analysis to answer the above research question and (b) additional analysis to answer emergent questions.

4.3.1. Initial Analysis Focusing on Mariah’s PFCs of Quadrilaterals and Related Claims About Hierarchical Relationships

We used the transcript from each session to gather all instances of Mariah’s statements that indicated her thinking about the properties of specific quadrilaterals. In an additional pass through the same transcripts, we gathered all instances of Mariah’s statements that indicated her thinking about hierarchical relationships between quadrilaterals. For example, as part of our Session 1 analysis, we collected all instances of statements Mariah made about the properties of rectangles. We also collected all instances of claims Mariah made about the rectangle–square relationship. We produced summary characterizations of Mariah’s thinking about each type of quadrilateral within each session. We based our summaries on consistent patterns of usage. Sessions were treated as natural chronological breaks by default, so that we sought to characterize Mariah’s PFCs for each quadrilateral and her claims regarding quadrilateral relationships on a session-by-session basis. However, if an apparent shift occurred within a session, it marked an additional chronological break. In that case, we produced summary characterizations of Mariah’s relevant PFCs and claims about relationships for the periods before and after the relevant line of transcript. The first two authors discussed their interpretations of Mariah’s thinking in detail until they reached consensus regarding these summary characterizations.

4.3.2. Analysis to Answer Emergent Questions

The initial analytic process led to a set of emergent questions related to a focal episode from Lesson 2 that presented a puzzle. (The list of questions appears in the Results section). Mariah’s thinking about and difficulties with a particular task seemed surprising based on our analysis of the data related to prior tasks. Thus, we analyzed data from Lesson 2 in greater detail to answer the emergent questions as best we could, based on the available data and informed by the literature related to PFCs.
Solving the puzzle required us to broaden our analysis beyond Mariah’s thinking about the quadrilaterals involved. It became necessary to also account for Mariah’s interpretation and use of diagrams to represent relationships. Thus, we pivoted and decided to apply the construct of PFCs to account for Mariah’s thinking about diagrams in addition to her thinking about quadrilaterals, drawing on data from all three sessions. This move proved profitable, as it enabled us to arrive at satisfactory answers to the emergent questions. This analysis is presented in detail in the Results section.
We gathered all instances of Mariah creating and/or interpreting diagrams during the sessions. We coded these for the type of diagram produced (e.g., compare-and-contrast diagram, simple set–subset diagram, etc.) and/or the type of interpretation evident in Mariah’s response. See the Results for details. The complete chronology of Mariah’s thinking related to diagrams informed our analysis to answer the emergent questions. In addition, we gathered all transcript excerpts that were relevant to the emergent questions. These data sources enabled us to test possible interpretations of Mariah’s thinking about diagrams against all relevant evidence until we arrived at the most viable interpretations. The details are presented in Section 5.2.4.

5. Results

We present the results in the form of two main arguments, drawing on data from the teaching experiment with Mariah:
  • It is possible for a learner to entertain definitions and their consequences without necessarily changing their PFCs for the shapes. It is possible for a learner to reason logically about the consequences of definitions, whether or not they prefer or agree with the definitions involved.
  • Communication with diagrams is nontrivial and, in fact, can be intertwined with learners’ conceptualizations of relationships. Learners’ conceptualizations of hierarchical relationships, especially those that are not simple set–subset relationships, do not necessarily follow trivially from their PFCs for the shapes involved.
As elaborated later in the Discussion, we certainly do not regard Mariah as representative of any population. She is an individual. Her case provides an existence proof in support of the arguments outlined above.

5.1. Argument 1: Changes in PFCs vs. Becoming Aware of and Applying Definitions

In Session 1, it was clear from Mariah’s responses to the tasks that she thought of parallelograms exclusively with regard to angles and inclusively with regard to side length. Thus, she considered a rhombus a type of parallelogram, but she did not consider a rectangle a type of parallelogram. She also thought of rhombi exclusively with regard to angles, so that she did not consider a square a type of rhombus. See Table 1 for evidence in support of these claims.
Trapezoids were not discussed until Session 3. Early in Session 3, Mariah made it clear that she thought of trapezoids exclusively with regard to the number of pairs of parallel sides. She agreed with the exclusive definition (specifying “exactly one pair of parallel sides”) and not with the inclusive definition (“at least one pair of parallel sides”):
Education 15 01283 i001
M3.068—I: And, again, you might not have thought about trapezoids in a while, but does one of these better fit how you think about trapezoids?
M3.069—M: … I think the bottom one because usually, I wouldn’t think of like, rectangles, or parallelograms, or squares or anything as trapezoids. So, the bottom one kind of, it—it kind of only fits trapezoid, and that’s what I think when I think of a trapezoid.
In contrast with the initial PFCs described above, by the end of Session 3, Mariah was able to construct a diagram (in Google Slides) relating trapezoids, parallelograms, rectangles, rhombi, and squares. Her diagram agreed with the official definitions of each of the quadrilaterals. Mariah gave explanations regarding these relationships in which she applied the inclusive definitions of trapezoid, parallelogram, and rhombus. Examples of these explanations are shown in Table 2.
Mariah’s diagrams and associated explanations indicated that she was now treating trapezoids inclusively with regard to the number of pairs of parallel sides, which contrasted with her thinking from earlier in the session. She was also treating parallelograms inclusively with regard to angle, which she had not done in Session 1. Likewise, she was treating rhombi inclusively with regard to angle, because she considered a square a type of rhombus.
Applying the lens of PFCs, a researcher could claim that Mariah’s PFCs for rhombus, parallelogram, and trapezoid changed over the course of the teaching experiment. A researcher could further argue that her claims regarding hierarchical relationships changed as a consequence. Such an account would be consistent with the literature on this topic. However, we do not believe that the above account accurately reflects what occurred in Mariah’s case.
We argue instead that Mariah was capable of entertaining definitions and their implications. It is true that she initially thought of parallelograms exclusively with regard to angle. But it is unclear whether the figural aspect of her PFC for parallelograms changed. What is clear is that she became aware of the distinction between inclusive and exclusive definitions. She also became aware (due to the instructor informing her) that the official definition of parallelogram in the state standards was inclusive with regard to angle. Subsequently and without difficulty, she was able to reason that a rectangle qualified as a type of parallelogram, according to the inclusive definition of parallelogram. She was likewise able to reason that a square qualified as a type of rhombus, once she was given the inclusive definition of rhombus. Whether the figural aspect of her PFCs changed in any way is not evident from the data; and we question the relevance in any case.
More compelling evidence in support of our argument comes from the fact that Mariah was likewise able to entertain the exclusive definition of rectangle when invited to do so. The instructor presented Mariah with two possible definitions of rectangle. Mariah indicated that she agreed with the inclusive definition (which was consistent with her claims about rectangles and squares from Session 1). She also related the inclusive definition to her set–subset diagram for the rectangle–square relationship, which she had created in Session 1. The instructor asked Mariah whether her diagram would still make sense if they used the exclusive definition of rectangle instead. She said, “in that case, then I feel like the square couldn’t be inside the circle because it’d be two long, two short [sides] and square doesn’t have two long, two short. It has all four sides equal” (M2.046). Thus, the square would not be considered a type of rectangle if we used the exclusive definition of rectangle.
It was clear in the context that Mariah had been asked to entertain the exclusive definition of rectangle as a hypothetical. But she was equally able to reason according to that definition as she was to reason according to the inclusive definitions of parallelogram and trapezoid. The only difference apparent in our data is that Mariah continued to apply the definitions that the instructor indicated were the official definitions from the standards (or were equivalent to the official definitions, modulo slight differences in wording).
Thus, from our perspective, Mariah demonstrated her ability to reason logically about hierarchical relationships based on clearly stated definitions. This perspective provides a satisfactory and parsimonious explanation of Mariah’s thinking about simple set–subset relationships throughout the three sessions. We see no need to make claims based on competition between figural and conceptual aspects of her thinking, and such claims would be difficult to support with evidence.
Therefore, we conclude that it is possible for a learner to entertain definitions and their consequences without necessarily changing their PFCs for the shapes. Furthermore, it is possible for a learner to reason logically about the consequences of definitions, whether or not they prefer or agree with the definitions involved. Mariah initially expressed agreement with the exclusive definition of trapezoid. She also preferred to use the exclusive definition for her tree diagram (for which she was given the option). Yet she had no difficulty applying the inclusive definition when asked to do so.

5.2. Argument 2: The Role of Diagrams in Reasoning About Three-Way Relationships

As we mentioned above, Argument 1 is sufficient to account for Mariah’s thinking about simple set–subset relationships (i.e., pairwise relationships involving one set and one subset). Our second main argument is based on Mariah’s thinking about three-way relationships. The three-way quadrilateral relationship of interest is the rectangle–rhombus–square relationship.

5.2.1. Relevant Details from Session 1

We know from the evidence presented in Argument 1 above that Mariah’s PFC of rectangle was inclusive regarding side length and her PFC of parallelogram was inclusive regarding side length but exclusive regarding angle. Thus, she considered a square a type of rectangle and a rhombus a type of parallelogram, but she did not consider a rectangle a type of parallelogram. Mariah specifically explained the parallelogram–rhombus relationship as follows:
M1.222—M: I feel like they’re also kind of the genre and the sub-genre which is very useful with the Container Diagrams [Mariah’s invented name for set–subset diagrams]. So, similar to ice cream and chocolate chip ice cream. I feel like a parallelogram is the broader and then you can get more specific using other characteristics such as equal sides for the rhombi.
Table 3 summarizes Mariah’s initial PFCs for the types of diagrams discussed in Session 1. Mariah’s PFC of “Venn Diagram” was a compare-and-contrast diagram, as described in Figure 1. She indicated that she had not had a name for “Container Diagram” previously, although she was familiar with such diagrams. We note that Mariah’s PFC of Container Diagram, as best we can tell from the evidence in Session 1, was limited to the simple case of a small circle within a larger circle, representing a subset of a set (or, in Mariah’s words, a “subgenre” and a “genre”).

5.2.2. Prelude to the Focal Episode

An important and challenging aspect of Session 2 concerned the use of overlap within a set–subset diagram. During discussion of various examples of diagrams, Mariah seemed to indicate a set–subset interpretation of overlap. In discussion of mammals, cats, and dogs, Mariah drew the Dogs and Cats circles in her set–subset diagram separately. She said that she did not think they should overlap:
Education 15 01283 i004
M2.122—M: Umm, if there is overlap, I would just feel like it’s like kind of combining the Compare and Contrast diagram with the Container Diagram. So, that’s probably why I just did the other circle just to make it like all Container.
She said that if someone wanted to show another characteristic that cats and dogs have in common besides just being mammals, they could create a larger circle around Cats and Dogs and within the Mammals circle for that characteristic. Note: it is possible that at this point Mariah thought overlap could not happen within a Container diagram. However, Mariah and the instructor subsequently discussed examples of Container diagrams that did include overlap.
Regarding the example diagram depicting multiples of 2 and 8, Mariah noticed that the multiples of 8 listed (8, 16, and 24) did not appear in both regions, only the region labeled “Multiples of 8.” She indicated that this made sense to her:
Education 15 01283 i005
M2.128—M: So, 8, 16 and 24 are, they’re multiples of two, but they’re also multiples of eight. So rather than listing them in multiples of two and multiples of eight, they just listed them and multiples of eight since included within multiples of two.
M2.129—I: Okay, because it’s a Container?
M2.130—M: Yeah, that kind of suggests that all multiples of eight are multiples of two.
In the case of multiples of 3 and 5, she seemed to convey a set–subset interpretation of overlap:
M2.133—M: Yeah, so in here, I kind of feel like it’s the same thing, just like a different layout with like a different comparison, I guess. Because multiples of 3 are like 15 and 30, which are both multiples of three, but they’re also multiples of five. So, rather than list them in both, they put them in the overlap, which means they’re both multiples of three and multiples of five.
M2.145—M: Because in the other one, not all multiples of three are multiples of five and not all multiples of five are multiples of three. So, they couldn’t really be included within each other. So, they kind of have to put them where there’s overlap.
When presented with empty overlapping circles labeled “Red things” and “Vehicles,” Mariah had no difficulty listing items that would belong in each of the three regions:
M2.167—M: Like list out some things? So, red like, an apple’s a red. I mean apple is red. Like a red crayon is red, or yeah, and then like vehicles, and if you want to be like, specific, but like, we can put like, say me put like a school bus and overlap could be like a fire truck because it’s a red and it is a vehicle.
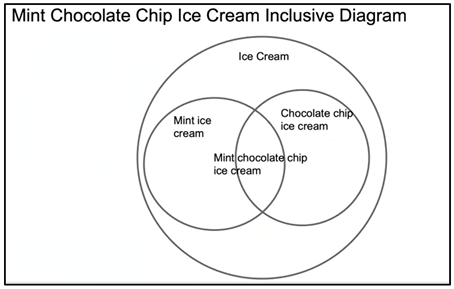
The instructor asked Mariah to make a Container Diagram for ice cream, mint ice cream, chocolate chip ice cream, and mint chocolate chip ice cream, defining these ice cream flavors inclusively (“So, we’re gonna think inclusively about this… So for example, if we think about like, how we would define mint ice cream… We’re not saying that it isn’t allowed to have other ingredients.”). For this task, Mariah produced the diagram below without any apparent conceptual difficulty:
M2.2.18—M: Mint chocolate chip. It won’t fit, but it’s supposed to go in this middle section.
M2.219–I: Yeah, okay, I get it. Alright, can you talk about the decision that you made here?
Education 15 01283 i006
M2.220—M: Yes. So, I started off with a big circle ice cream, because all of them are considered ice cream, and then I kind of did the Overlapping Container Diagram rather than the entire Container Diagram for both because the mint chocolate chip ice cream is an overlap of mint ice cream and chocolate chip ice cream. But, like chocolate chip ice cream couldn’t really fit into the mint ice cream bubble but I don’t think really mint could fit into the chocolate chip, that’s why I didn’t really like circle, circle, circle. And then I put mint ice cream on the outside because it has its own property like mint flavored ice cream, and chocolate chip ice cream with chocolate types, and they overlap where mint chocolate chip ice cream is because it’s mint flavored ice cream with chocolate chips.
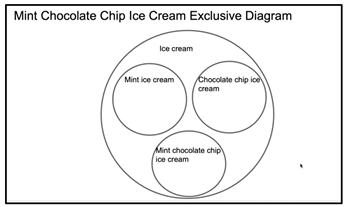
As a follow-up, the instructor asked Mariah what the diagram would look like if the ice cream flavors were defined exclusively instead. Mariah produced the following diagram. She explained,
Education 15 01283 i007
M2.236—M: Yeah, so since they’re all exclusive definitions, I didn’t really feel like you could contain any within each other, and they couldn’t really overlap. Because, like we said, like mint ice cream has to be strictly mint; it can’t have like chocolate chips. So, like there will be no overlap. And chocolate chip ice cream has to be just chocolate chip, like with vanilla; it can’t be like mint ice cream. So, they’re still all ice cream, so they’re contained within the ice cream circle, but they’re all separate subsets.
Mariah’s diagrams and explanations summarized above seemed to indicate consistent set–subset interpretations, including for set–subset diagrams with overlap. That fact made Mariah’s thinking about the following task quite a surprising puzzle.

5.2.3. Focal Episode: Resolving the Rectangle–Rhombus–Square Relationship

It seemed up to this point that Mariah had been able to expand her PFC of Container Diagrams to those including overlap. She had little difficulty with any of the tasks in Session 2 until she was asked to consider and represent the rectangle–rhombus–square relationship. Up to that point, her discussion of relationships among quadrilaterals had been limited to pairwise relationships, consistent with the simple Container Diagrams discussed in Session 1. Now she had to find a way to describe and represent the relationships among three types of quadrilaterals. Mariah went through a succession of four diagrams before arriving at her final answer to the rectangle–rhombus–square task. We discuss each attempt and what it reveals about Mariah’s PFCs of Container Diagrams and of the quadrilaterals involved, especially rhombi.
Before creating a diagram, Mariah indicated how she was thinking about the relationships involved. She was clear that she regarded square as a subgenre of rectangle. She also recognized “some relationship between the square and the rhombus,” noting that both have “four equal sides.”
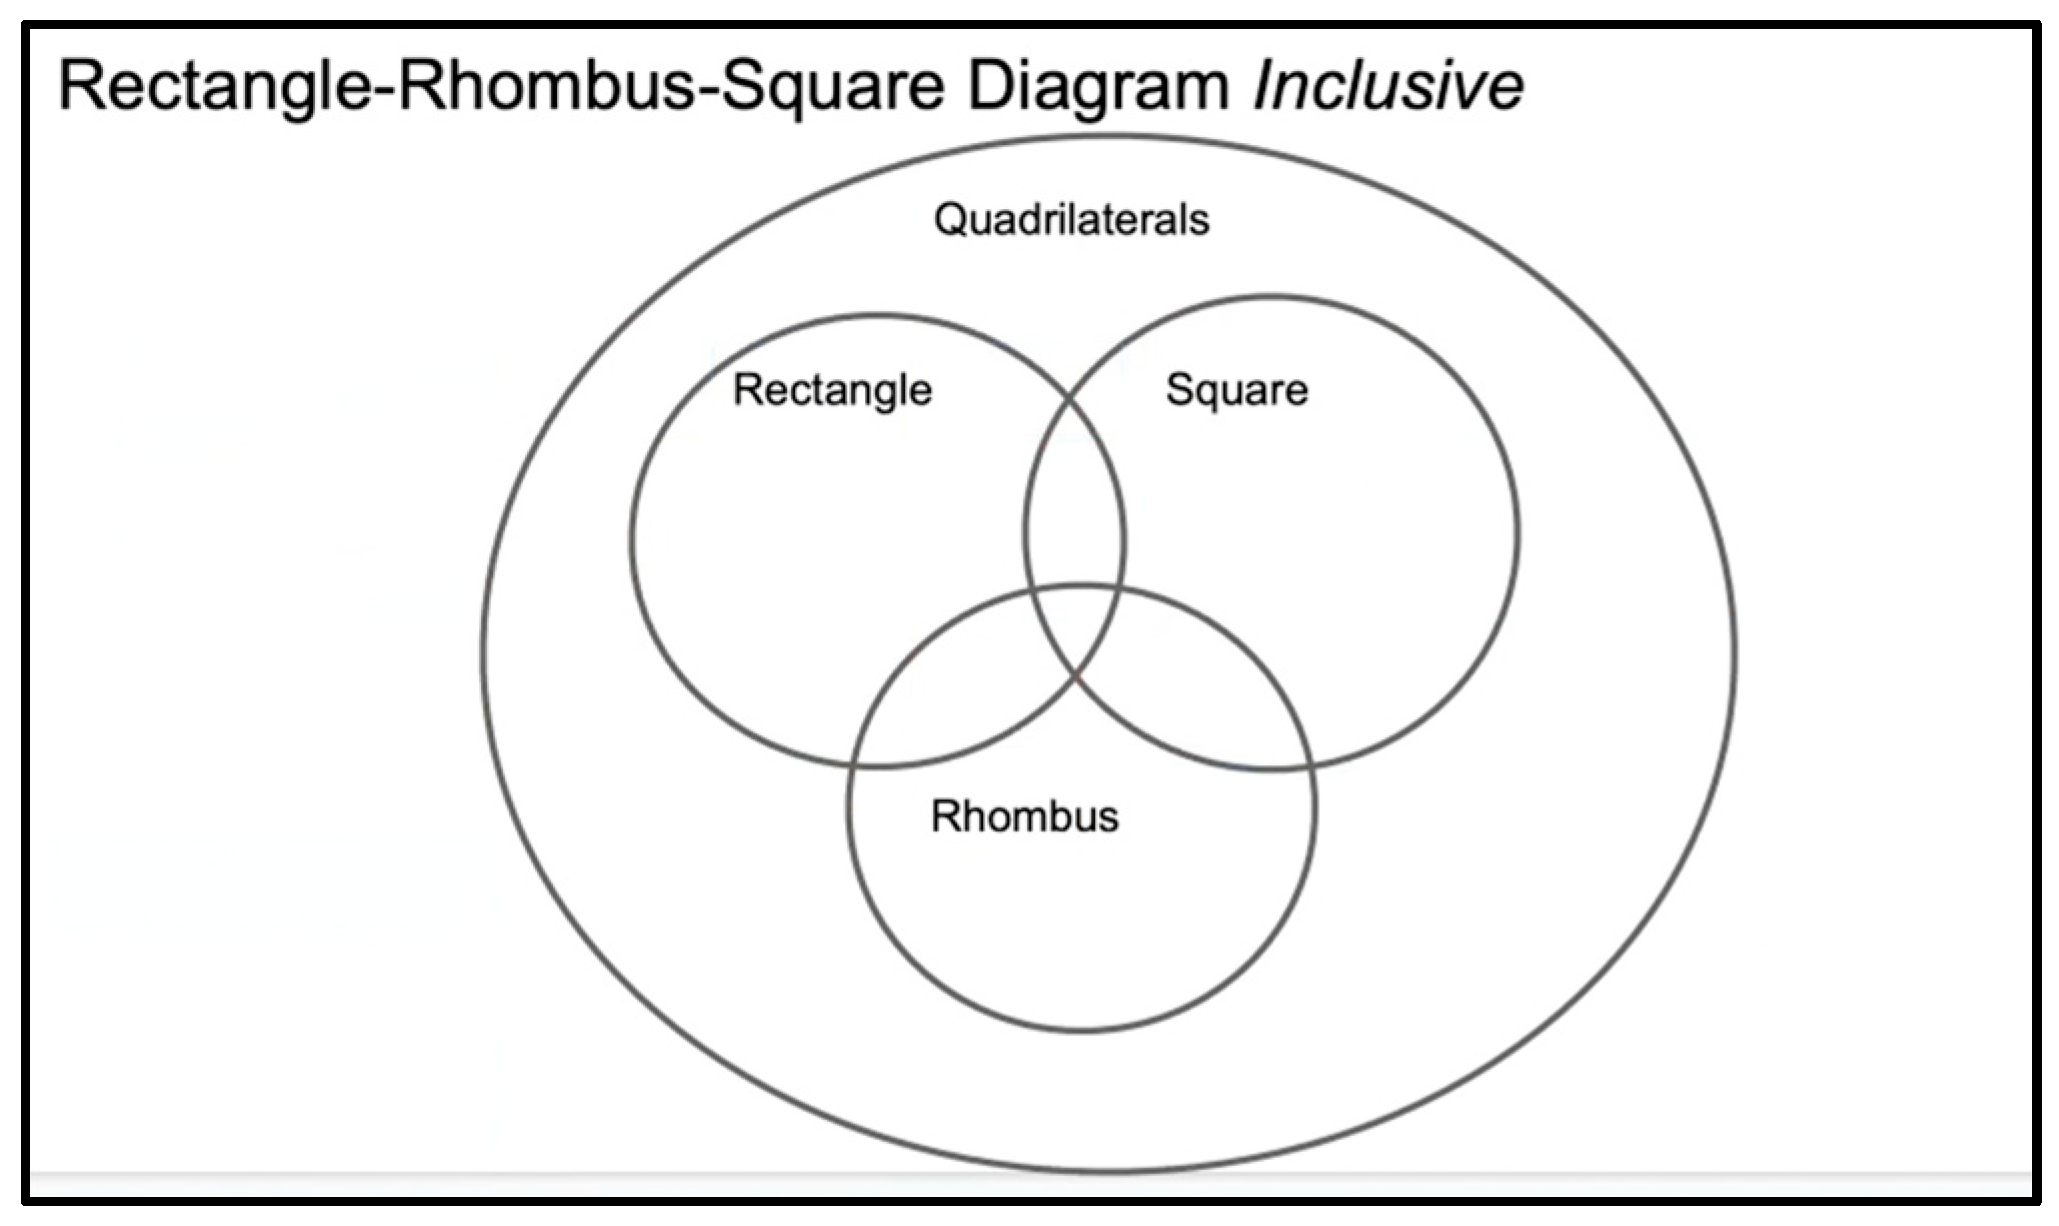
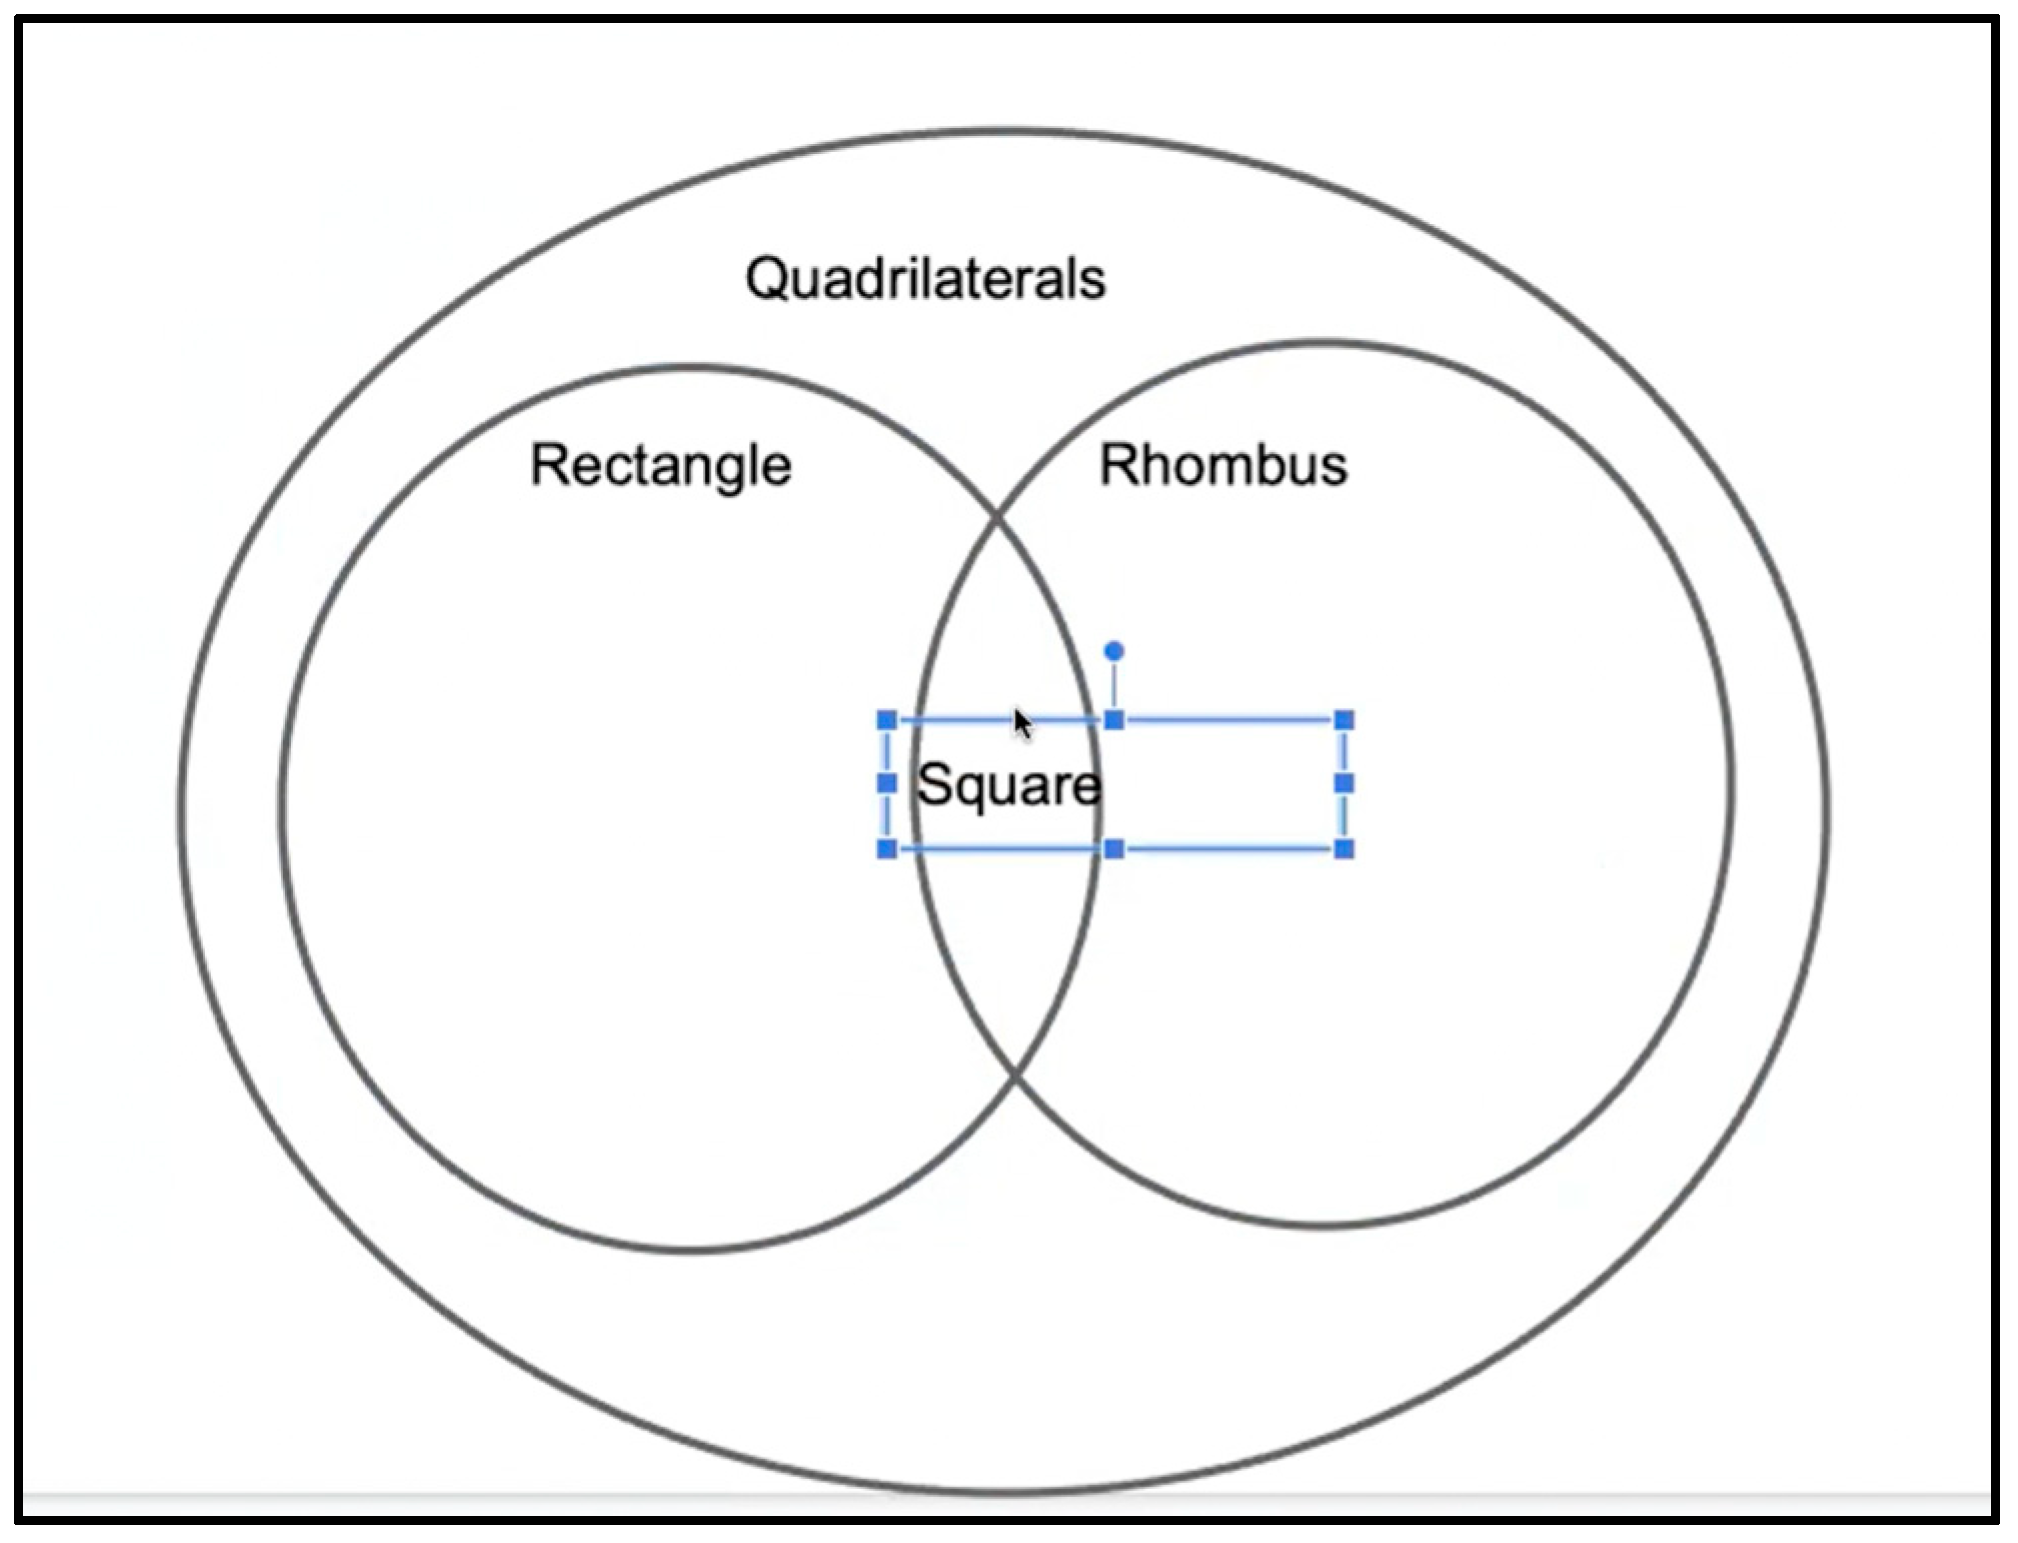
Mariah was instructed to “make a Container Diagram using the definitions we have for these [quadrilaterals], that are inclusive.” Yet her first version (Figure 3) did not seem to be a Container Diagram at all. She drew three partially overlapping circles labeled Rectangle, Square, and Rhombus, exactly as one would do in a compare-and-contrast diagram. When the instructor asked, “Okay, tell me about your diagram,” Mariah spontaneously abandoned this version, saying, “Hold on! Let me think real quick. I’m trying to think of how I did it in my brain [pause] um, hold on [pause] like I came up with a new idea.” The instructor invited Mariah to save this diagram on the current slide and create a new slide to show her new idea.
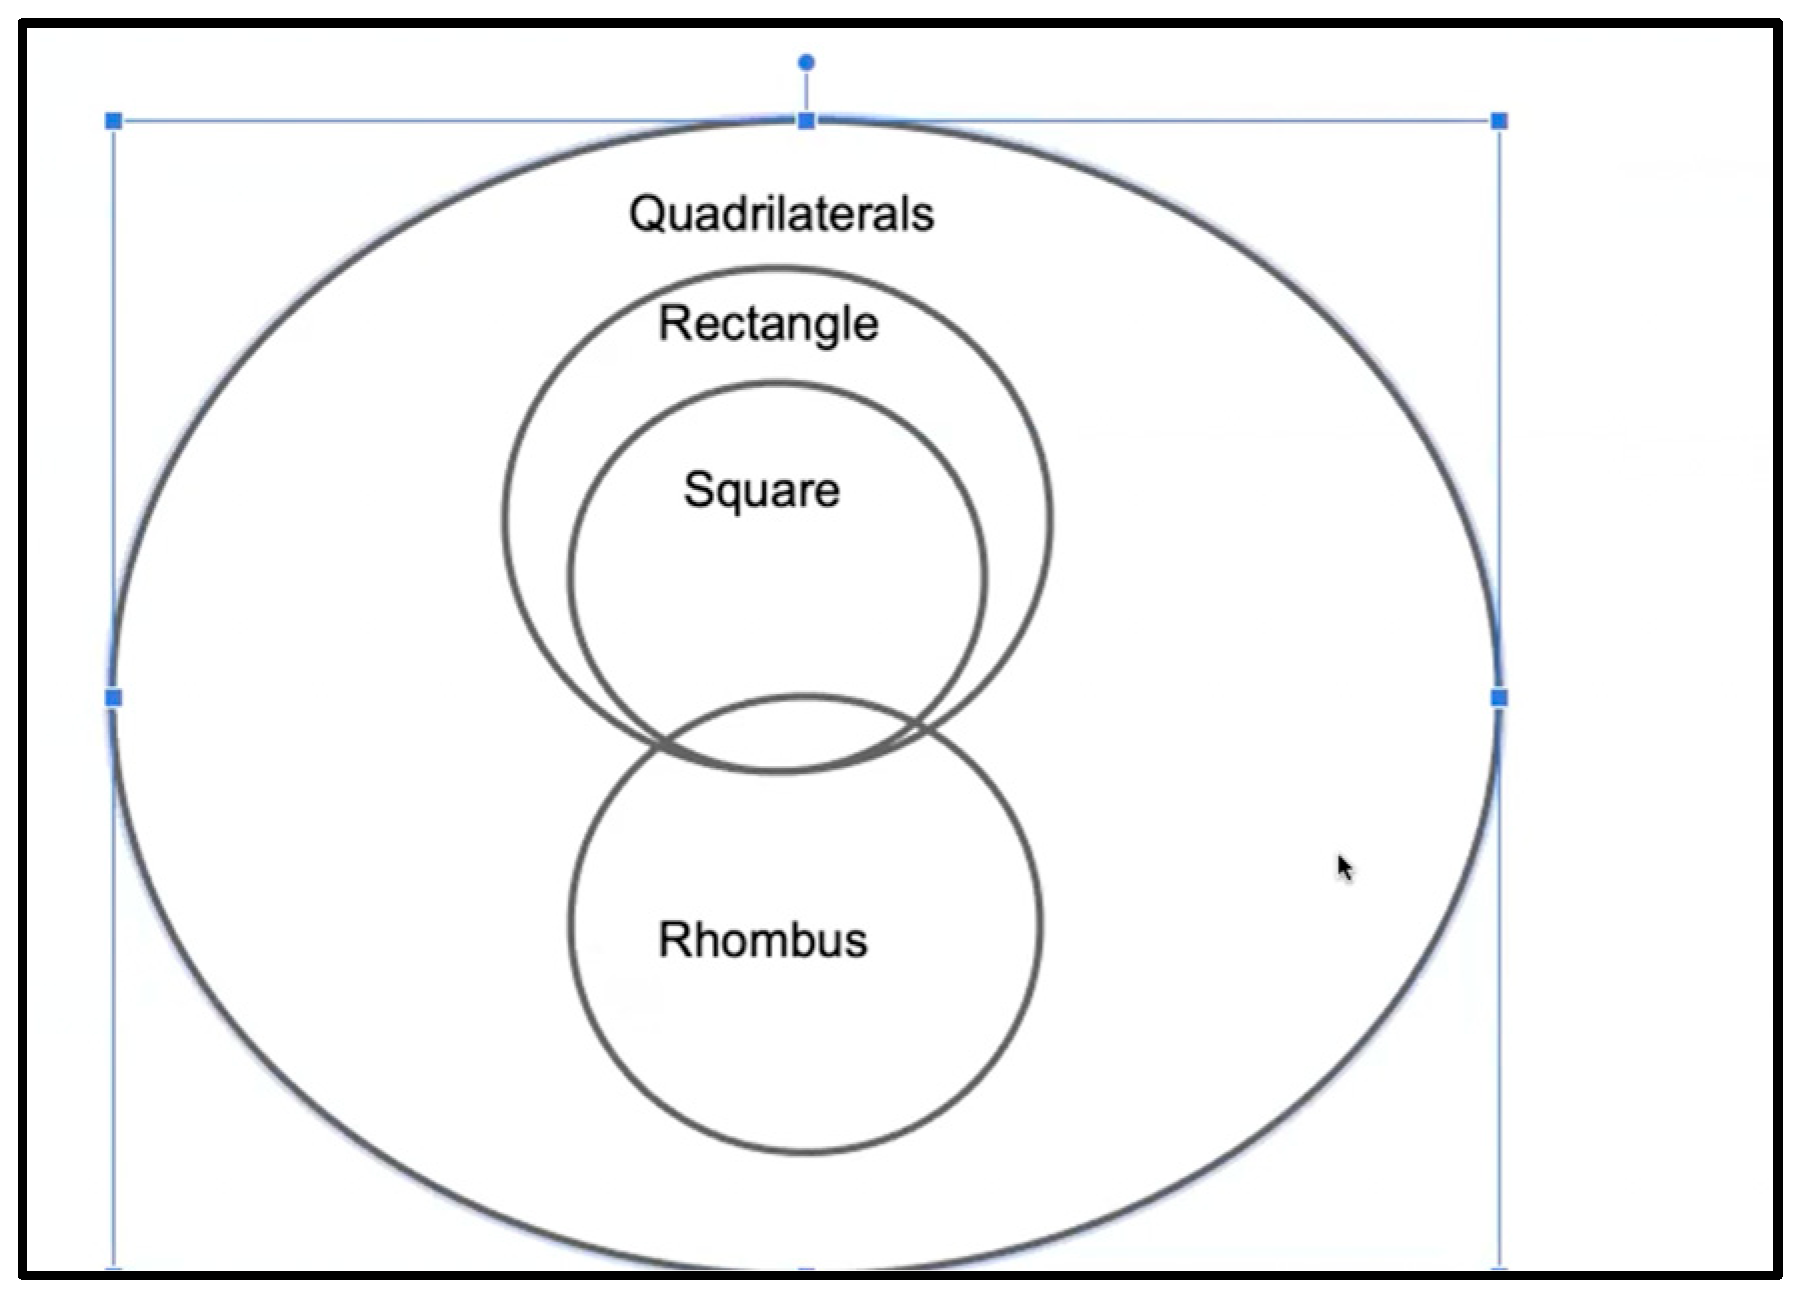
Mariah’s second version (Figure 4) seemed to more consistent with the relationships she had indicated initially. She explained,
M2.265—M: So, I did quadrilaterals, the four sided shape to the top, because all of them are considered quadrilaterals and then I have a circle for rectangle and then within that circle, rectangle, I have squares, because squares are like a subset of rectangles, they have the four right angles, and they have the four sides, but they’re just have all four sides equal.
She continued,
M2.266—M: And then I did rhombus at the bottom because I don’t feel like it fits within square and rectangle, but I did it kind of overlapping the section where square and rectangle both are. Because I feel like all four of them have those parallel sides. The only re—the only like area that I’m kind of like shaded in is that, umm, the square and the rhombus, but also have specific, like the four equal sides, which I guess you can kind of make the circle bigger maybe [Pause, Mariah moves some words and shapes in the diagram], and then squared out a little, a little rhombus too, where it’s like specifically overlapping and square and rectangle here. Both have well, I guess. Yeah. And then they all have two pairs of parallel sides and then square and the rhombus also share the four equal sides and so that will be in that area, which ideally there wouldn’t be the two little slivers right here. of rectangle circle.
Mariah explained why she had abandoned her first version in favor of the second:
M2.276—M: Yeah. So, here, the reason I changed it is because of this kind of area [She points to the overlapped area between Rectangle and Rhombus in the diagram], where I don’t see anything that the rectangle and rhombus just them to have in common. But they all have something in common with the square, and the rhombus and square have something in common. So that’s kind of—and I kind of want square inside the rectangle, because I feel like the square is a subset of a rectangle. So, this just makes more sense in my brain.
Mariah’s second version seemed to combine features of both types of diagrams. It represented square as a subgenre of rectangle with a simple Container Diagram. At the same time, it used overlap to show that rhombus had “something in common” with square and rectangle, as in a compare-and-contrast diagram. There was no indication that Mariah had in mind types of quadrilaterals that would inhabit the overlapping regions. Instead, in response to the instructor’s questions about what would be in those regions, Mariah referred to properties:
M2.287—I: What about in the football shaped region? Because that one’s not labeled, what would be in there?
M2.288—M: I think that would just be the four equal sides. So, it’d be kind of still in the square’s circle, but it would be also sharing with this little football overlap.
M2.289—I: But I mean, what was the name of that shape? What do those shapes look like in there?
M2.290—M: Squares and rhombuses—rhombi—and, but I feel like rectangles couldn’t be in there because it’s all the four equal sides. So, that’d just be an overlap of square and rhombi—what they have in common.
We know that Mariah associated overlap with representing commonalities, as in a compare-and-contrast diagram. Thus, even though she was supposed to be creating a Container Diagram for this task, and she had shown in previous tasks that she could interpret overlap in set–subset terms, her Version 2 was a hybrid diagram, incorporating features of both types of diagrams. In the language of Tall and Vinner (1981), aspects of both concept images seemed to be evoked at the same time.
Despite the initial instruction to use inclusive definitions, some of Mariah’s statements indicated that she was thinking about the angles of rhombi exclusively. Referring to the shape makers in Desmos Geometry, she said the following:
M2.294—M: Okay. Hold on. So, here I think these, like the common the commonality between them two, is that, like all sides are equal on the square and then also like equal in rhombus and of course, you could change the rhombus into square, here. But then I feel like it wouldn’t really be a rhombus anymore. It’d just be a square still.
The instructor realized that they had not explicitly considered the inclusive definition of a rhombus. Official, inclusive definitions of parallelogram and rectangle had been discussed, and the instructor had said to use inclusive definitions for the task, but an inclusive definition of rhombus had not previously been written down. The instructor clarified the relevant definitions, listing them together on the slide with the task instructions:
Rectangle: Quadrilateral with four right angles
Square: Quadrilateral with four right angles and four congruent sides
Rhombus: Quadrilateral with four congruent sides
Mariah subsequently applied the given definition of rhombus in her thinking about the task.
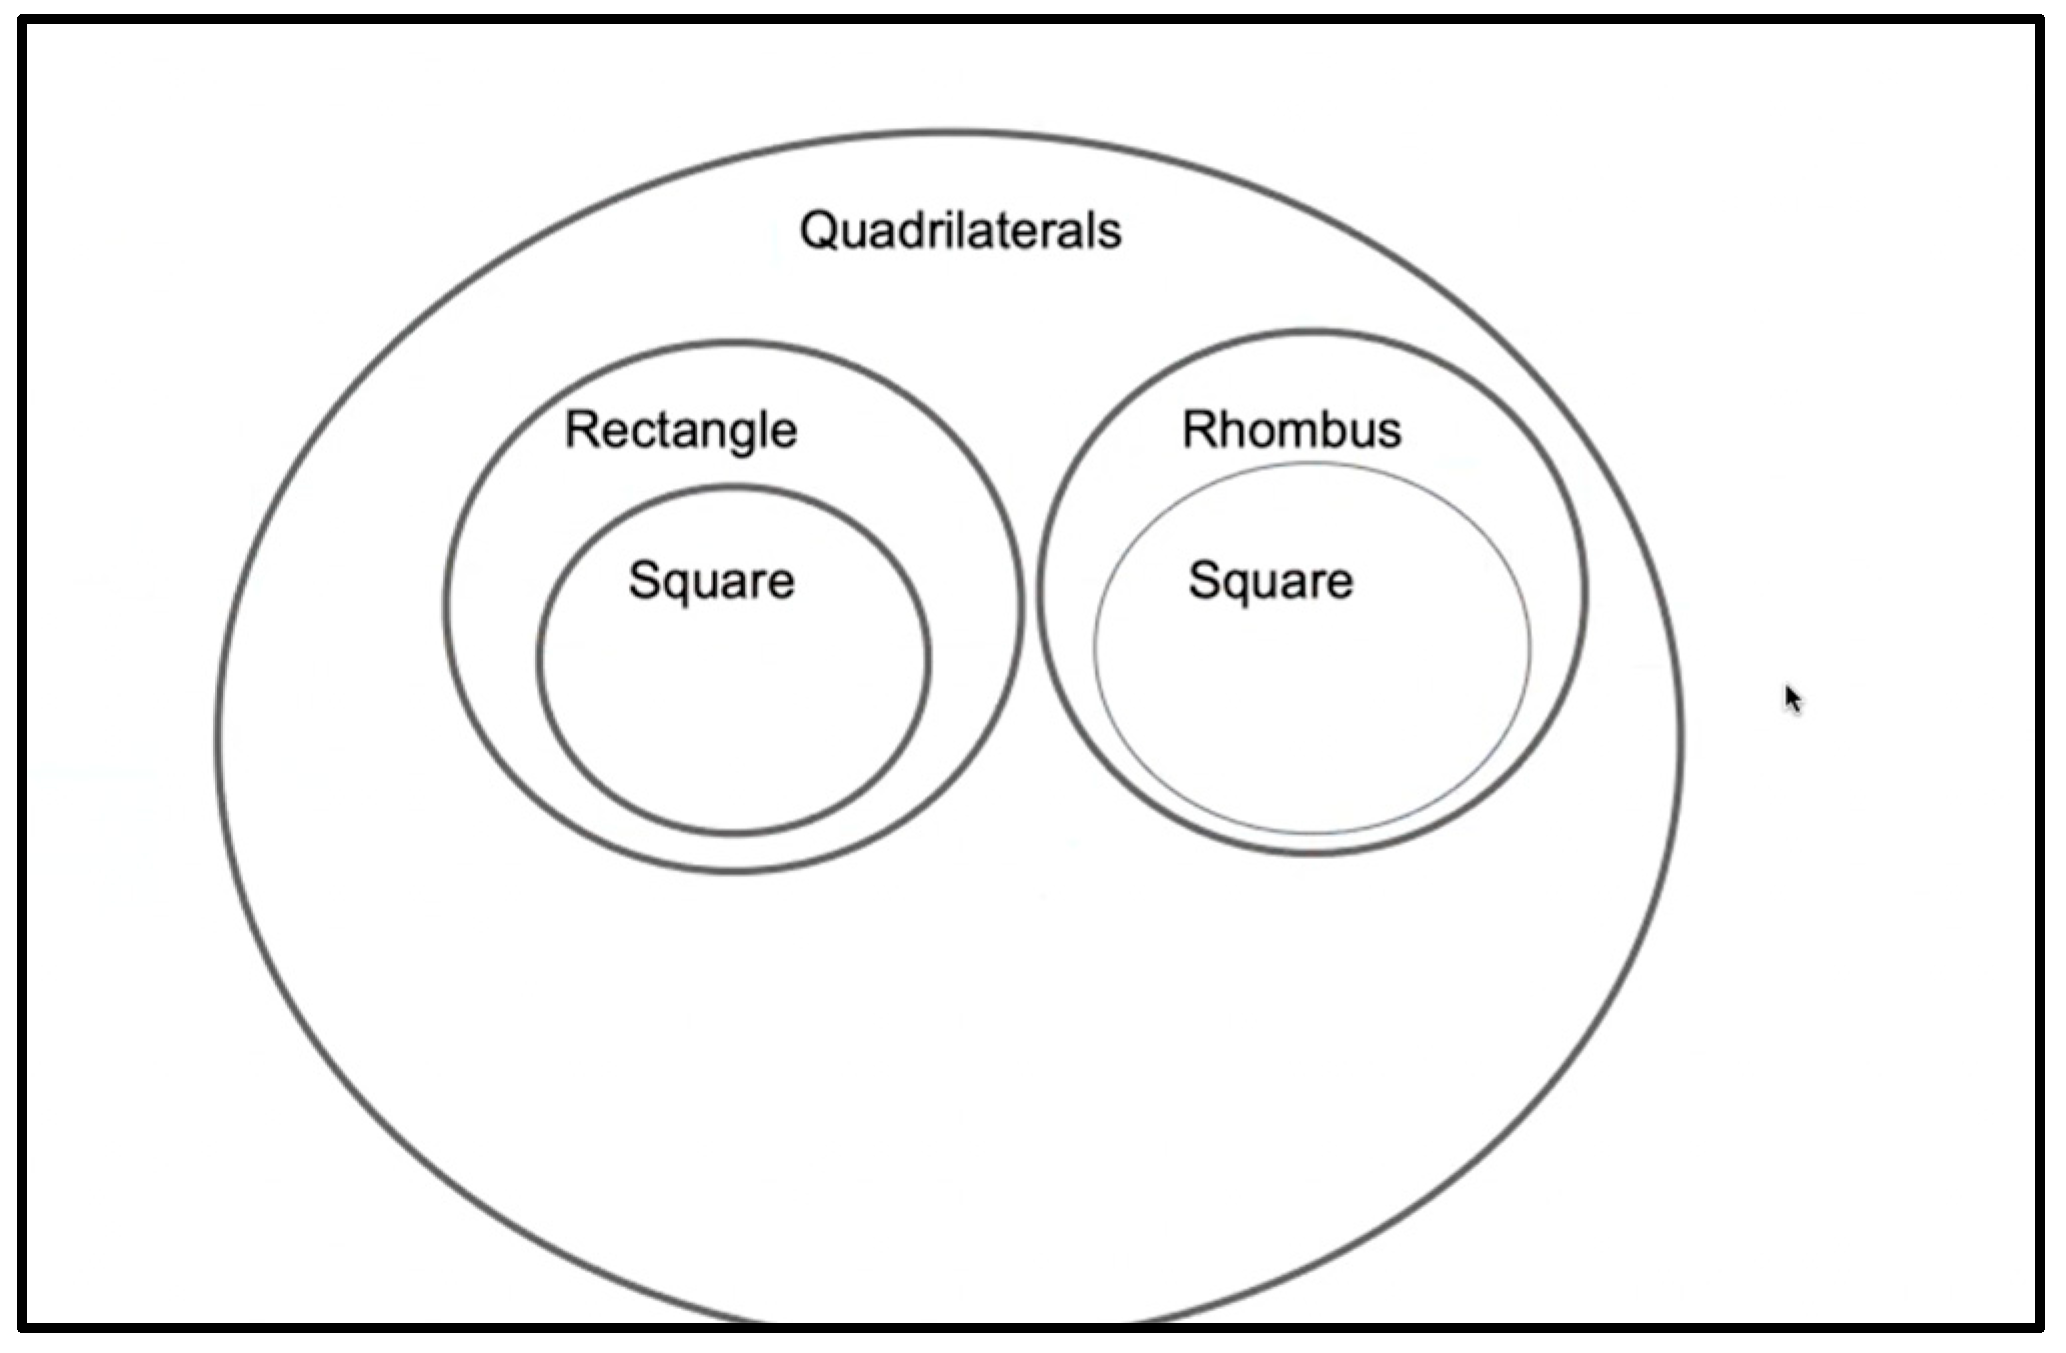
Although it might seem that the definition of rhombus would not be relevant to the type of diagram—the instruction from the start had been to produce a Container Diagram—Mariah’s Version 3 (Figure 5) was clearly a Container Diagram, no longer a hybrid. The difference between it and the Container Diagrams she had produced in earlier tasks was that it consisted of two simple Container Diagrams side by side, one representing the square–rectangle relationship and the other representing the square–rhombus relationship. Mariah explained that according to the definitions, a square was a type of rectangle, and a square was a type of rhombus. Thus, her diagram represented both of those simple set–subset relationships. It did not address the rectangle–rhombus relationship. (Mariah was not claiming that rectangles and rhombi were simply separate types of quadrilaterals with no other relationship between them. Rather, she had not yet found a way to represent all the relevant relationships in one diagram).
M2.311—M: I kinda feel like it can be quadrilaterals and then a rectangle, which has four sides and four right angles. And the square also has four right angles, four sides, and then it’s also congruent, so the sides are congruent. So, it would be a specific subset of rectangles.
M2.312—M: And then a rhombus is just four congruent sides. So, it’d be in the quadrilateral circle, but it’d be separate from rectangles because it doesn’t have four right angles. But the square has four congruent sides. It just has another specific thing, which is four right angles, so it can be included within a rhombus too.
M2.313—I: Okay, I see how you’re thinking about that. So, square is a special type of rectangle, and square is also a special type of rhombus.
M2.314—M: Yes.
M2.315—I: Is it okay that the squares are in two different places?
M2.316—M: I don’t really know, I guess, because I don’t really see a way to overlap it. And have it showing like this relationship where it can be like a square can be considered a rhombus. Because like if you put like the other one where it’s like this [referring back to her second version], I feel like this [her second version] doesn’t really show that the square can be considered a rhombus.
Because Mariah seemed to be stuck at this point, the instructor invited her to look back at previous slides and consider how those relationships had been represented. Mariah considered the previous diagrams and realized that she could use overlap within a Container Diagram. She finally produced her Version 4 (Figure 6) and explained,
M2.325—M: So, the quadrilateral is four-sided shapes: rectangle and rhombi are both four-sided shapes. The rectangle has its own properties, which is four right angles. The rhombus has its own property, which is the four congruent sides. And the square is kind of where they overlap, with a square has both four right angles and four congruent sides.
She also explained the relationship in clear if-then statements: “If the shape is a rectangle, then it has four right angles. If the first shape is a rhombus, then it has four congruent sides. And if it has four right angles and four congruent sides, then it’s a square.” Mariah called Version 4 her “final answer.”
Mariah’s Version 4 was a Container Diagram involving partially overlapping circles. It took multiple attempts and substantial time and effort for her to arrive at this version. Based on Mariah’s explanations, she clearly did not have a stable conceptualization of the rectangle–rhombus–square relationship throughout the episode. In other words, it is not that she knew the relationship she wanted to convey and only had difficulty figuring out how to do so in a Container Diagram. Rather, the complete nature of the rectangle–rhombus–square relationship was a significant realization for her, and the nature of that relationship and the way of representing it seemed to occur to her at the same time.
The above episode raises several interesting questions about Mariah’s thinking, especially regarding the roles of definitions and diagrams. We discuss these questions below.

5.2.4. Unpacking the Focal Episode

Given that Mariah had previously interpreted and created Overlapping Container Diagrams, why was it difficult for her to realize that the same type of diagram fit the rectangle–rhombus–square relationship? More specifically, we asked the following emergent questions:
  • Why did Mariah use overlap in her first two rectangle–rhombus–square diagrams to represent commonalities as in a compare-and-contrast diagram when she was asked to produce a Container Diagram instead? In particular, being that Mariah quickly abandoned Version 1 in favor of Version 2, why did she create a hybrid diagram in Version 2?
  • Why had Mariah been able to interpret overlap in examples of Container Diagrams in previous tasks?
  • Why had Mariah been able to create an Overlapping Container Diagram for ice cream flavors without any apparent difficulty?
  • What specific challenges did Mariah overcome to produce her final version of the rectangle–rhombus–square diagram?
We believe we can satisfactorily answer these questions based on the available evidence. Our explanations follow.
Emergent Question 1: Why did Mariah create a hybrid diagram in Version 2? In Session 1, Mariah had created a Compare and Contrast diagram for apples and oranges, focusing on the similarities and differences between the two types of fruit. For ice cream and chocolate chip ice cream, she had created a Container Diagram instead. Thus, her choice of diagram type had been driven by her conceptualization of the relationship under consideration. Apples were not a type of orange, and oranges were not a type of apple. So, instead of creating a Container Diagram, she compared and contrasted the two types of fruit. On the other hand, chocolate chip ice cream was clearly a type of ice cream, and Mariah indicated that the choice of a Container Diagram made sense in that case, because it showed a genre–subgenre relationship.
Thus, we conjecture the following: Until she was shown an explicit (inclusive) definition of rhombus, Mariah’s conceptualization of the rhombus–square relationship was determined by her PFCs for the two shapes, according to which a rhombus had to have acute and obtuse angles. Therefore, a rhombus was not a type of square, and a square was not a type of rhombus. In that case, the relationship between rhombi and squares was analogous to the relationship between apples and oranges: there were some commonalities, but there was not a genre–subgenre relationship. Mariah’s way of representing commonalities was through a Compare and Contrast Diagram. In short, Mariah’s PFC of rhombus (which was exclusive regarding angles) determined her conceptualization of the relationship between rhombi and squares, and her conceptualization of that relationship drove the type of diagram she created.
In this case, Mariah was asked to represent the relationships between rectangles, rhombi, and squares. She used a Container Diagram to represent the rectangle–square relationship and combined it with a Compare and Contrast Diagram to represent the rhombus–square relationship, resulting in a hybrid diagram (Figure 4). Both choices were driven by her conceptualization of the pairwise relationship to be represented.
Emergent Question 2: Why had Mariah been able to interpret overlap in examples of Container Diagrams in previous tasks? Prior to the focal episode, it seemed that Mariah had been able to interpret overlap in Container Diagrams in set–subset terms. But had she really? We note that the distinction in meaning between overlap in a compare-and-contrast diagram and overlap in a set–subset diagram is a bit subtle, especially when the diagrams under consideration are not filled with drawings of objects or with words describing objects. Mariah’s diagrams for quadrilateral relationships included only category labels. Previous discussions had addressed diagrams with objects represented (e.g., number multiples, vehicles such as fire trucks). Nonetheless, in related research, we have found that it is not difficult for PSTs to interpret overlap in a set–subset diagram by evoking the notion of what the categories have in common, from their experience with compare-and-contrast diagrams (Whitacre et al., 2025a).
Thus, set–subset diagrams including overlap that were provided by the instructor for discussion purposes might not have seemed to conflict with or otherwise challenge Mariah’s PFCs of the diagram types. It might be that she simply did not notice any distinction in the interpretation of overlap. It still represented what the categories had “in common” (a phrase that Mariah used repeatedly during the focal episode). It seems that whether the things in common were objects or descriptive words was not a distinguishing feature in Mariah’s PFCs of the diagram types. Mariah had indicated that objects should appear in unique locations, but it is likewise the convention in compare-and-contrast diagrams that descriptive words appear in unique locations. So, this is a point of compatibility, not a distinguishing feature.
Therefore, we conclude that Mariah had been able to interpret overlap in set–subset diagrams in previous tasks by evoking the interpretation of overlap as representing similarities or commonalities from her PFC of Compare and Contrast Diagrams. She had not noticed any difference in the interpretation of overlap. Thus, her PFC of Container Diagrams had not changed.
Emergent Question 3: Why had Mariah been able to create an Overlapping Container Diagram for ice cream flavors without any apparent difficulty? Mariah had created what she herself called an “Overlapping Container Diagram” for ice cream flavors, with the overlap being populated by mint chocolate chip ice cream. What made the task in the focal episode so different for her? For one, not only were the ice cream flavors defined inclusively, but the names of the ice cream flavors indicated their hierarchical relationships. Mint chocolate chip ice cream is clearly a type of chocolate chip ice cream because the word “mint” is an adjective describing the noun “chocolate chip ice cream.” Likewise, mint chocolate chip ice cream is a type of mint ice cream with the additional characteristic that it has chocolate chips. Thus, the names make the hierarchy explicit. Quadrilateral names are quite different. There are unique names for several types of quadrilaterals that do not indicate their hierarchical relationships to one another. Evidently, the names of the ice cream flavors helped to make the nature of their three-way relationship apparent to Mariah.
To elaborate, quadrilaterals are given special names that are not simply lists of their properties (analogous to lists of ingredients). Chocolate chip ice cream is ice cream with chocolate chips. People could call it “Dalmatian ice cream” if they chose to, but that is not the convention. Its name indicates its properties. Mint ice cream could be called “zombie ice cream” or “hulk ice cream” instead. Again, it is commonly called mint. Thus, it is named for the essential property that defines it. If quadrilaterals were named in the analogous fashion, a square could be called a “right-angled equilateral quadrilateral.” People would call rectangles “right-angled quadrilaterals” and rhombi “equilateral quadrilaterals.” Then it would be obvious that a “right-angled equilateral quadrilateral” is both a “right-angled quadrilateral” and an “equilateral quadrilateral.” That would make the rectangle–rhombus–square task comparable to the task involving ice cream flavors. The special names that are used for quadrilaterals create a degree of separation from the definitions. Working directly from the words in the definitions makes the overlap relationship apparent. Working from the names obscures it.
Emergent Question 4: What specific challenges did Mariah have to overcome to produce her final version of the rectangle–rhombus–square diagram? The focal episode spanned ~23 min, in which Mariah worked through four different diagram versions. Clearly this was a challenging task for her. What specific challenges did Mariah have to overcome to arrive at her final version?
Mariah’s Version 2 was a hybrid diagram that used overlap to show similarities. Version 3 coincided with a shift in her conceptualization of the rectangle–rhombus–square relationship: from one that necessitated comparing and contrasting to one that could be described purely in set–subset terms. In other words, she had just made progress by stepping away from the use of overlapping circles. Therefore, it must have been quite counterintuitive for her to realize that the set–subset diagram she needed to represent the rectangle–rhombus–square relationship was one that included overlapping circles.
We saw in the episode involving ice cream flavors that Mariah did perceive the possibility of using overlap in a Container Diagram. The evidence from that episode indicates that she interpreted that overlap in set–subset terms. Why then was it difficult for her to realize that she should create the same kind of diagram for the rectangle–rhombus–square relationship? Evidently, because the nature of that three-way relationship was not obvious, like it had been in the case of ice cream flavors. She simply did not conceptualize the rectangle–rhombus–square relationship in the way represented by Figure 6 until she created Figure 6. In other words, whereas it was obvious that mint chocolate chip ice cream was the “overlap” of mint ice cream and chocolate chip ice cream, it was not obvious that square was the “overlap” of rectangle and rhombus.

5.2.5. Summary of Argument 2

Based on the above analysis, we conclude that communication with diagrams is nontrivial and, in fact, can be intertwined with learners’ conceptualizations of relationships. Learners’ conceptualizations of hierarchical relationships, especially those that are not simple set–subset relationships, do not necessarily follow trivially from their PFCs for the shapes involved.

6. Discussion

In this study, we applied a prominent framework of geometric thinking to the case of a PST’s learning of hierarchical geometric relationships. This topic has been identified as a challenging one, and we did not find in the literature a complete solution or answer to the question of how to teach it effectively. Our interests and motivations were theoretical, methodological, and empirical in nature. We wanted to solve the practical problem of how to teach this topic effectively—in our case, how to support a PST’s learning of the topic. We were interested in a theoretically grounded conceptualization of the learning of the topic, and we were interested in how PFCs might enable us to explain a PST’s learning of the topic, especially in terms of challenges that arose along the way.
The literature regarding the learning of hierarchical geometric relationships has focused on learners’ thinking about the shapes involved (e.g., a learner’s PFC for rectangle). We have not seen sufficient attention paid to the diagrams used to represent relationships. As we illustrated, to adequately account for Mariah’s learning process, it was necessary for us to analyze her PFCs of diagrams in addition to her PFCs of quadrilaterals. Without taking into account Mariah’s thinking about diagrams, we could not explain important details of her case, especially pertaining to the focal episode and emergent questions. Thus, a novel aspect and contribution of our study is that we applied PFCs to diagrams in addition to quadrilaterals—and that doing so enabled us to explain thinking that we could not explain otherwise.
An assumption of the PFC literature seems to be that learners’ PFCs for individual shapes should explain their thinking about relationships between shapes. In Mariah’s case, we found that this was true of pairwise relationships but not of a three-way relationship. Mariah’s conceptualizations of the square–rectangle and rhombus–parallelogram relationships discussed in Session 1 followed trivially from her PFCs for the quadrilaterals involved. However, in Session 2, even with written definitions of rectangle, rhombus, and square in front of her, the nature of the rectangle–rhombus–square relationship was not obvious to Mariah. The square–rectangle and square–rhombus relationships were clear, but coordinating the categories of rectangle, rhombus, and square posed an additional challenge. Mariah’s ability to overcome this challenge seemed to be entwined with her thinking about the diagram that would represent the relationship. In other words, it was not that she fully conceptualized the three-way relationship and then created a diagram to represent it. Rather, the realization of the nature of the relationship coincided with the idea of using an “Overlapping Container Diagram” to represent that relationship (i.e., to viewing square as the “overlap” of rectangle and rhombus).
The PFC literature also seems to assume that learners’ concept definitions must change or be replaced to afford progress in reasoning about hierarchical relationships. At least in Mariah’s case, we are not convinced that this is so. The example of trapezoids makes this point clearly: Mariah’s PFC for trapezoid specified a single pair of parallel sides. She became aware of the distinction between inclusive and exclusive definitions. In Session 3, she entertained both inclusive and exclusive definitions of trapezoid. She had no difficulty reasoning about the hierarchical relationships that followed, depending on the choice of definition. Her personal definition of trapezoid did not necessarily change. In fact, she still indicated a preference for the exclusive definition. Yet she was capable of reasoning logically about hierarchical relationships based on explicit definitions, whether or not those agreed with her personal definitions. Note that this ability is the distinguishing feature of the informal deduction level in the Van Hiele model—not simply knowing the correct definitions and the correct hierarchical relationships but rather being able to reason from definitions about their logical implications (Van Hiele, 2004).
We acknowledge the limitations of case-study research. Obviously, Mariah is an individual. We do not claim that she is representative of all elementary PSTs, let alone all learners. Her case serves as an existence proof, which supports the two main arguments that we presented. Note that the phrasing of the arguments (e.g., “It is possible…”) is consistent with the nature of the evidence: if a claim is true of Mariah’s case, then clearly it is possible. How frequently such phenomena occur is a question that the present study is not designed to answer.
In related research, we have documented changes in the thinking/communicating of additional PSTs in teaching-experiment sessions. We have also conducted surveys and interviews that provide additional insight into PSTs’ thinking about quadrilateral properties and relationships, as well as their interpretation and use of diagrams (Whitacre et al., 2025a, 2025b). We encourage further research regarding PSTs’ thinking and learning related to hierarchical geometric relationships. More broadly, we encourage further research into learners’ geometric thinking and learning that devotes greater attention to the roles of definitions and diagrams in those processes.
We address instructional implications directly in a related manuscript (Whitacre et al., 2025b). Here, we briefly note that the instructional approach involved making Mariah aware of important distinctions. Central to the unit were the distinction between two types of diagrams (set–subset diagrams vs. compare-and-contrast diagrams) and the distinction between two types of definitions (inclusive vs. exclusive definitions). We regard these explicit distinctions as crucial to effective communication during the unit. We regard clear, effective communication as crucial to supporting progress in geometric thinking.
We hope that Mariah’s case promotes productive conversations in the literature on geometric thinking. Our work owes a debt of gratitude to previous studies, especially those concerning hierarchical geometric relationships and PFCs. We find the frameworks in the literature useful. Our contribution is to shine a light on aspects of thinking and learning about hierarchical relationships that have received less attention in the literature. We invite responses to our arguments, as well as further research into the roles of definitions and diagrams in the process of learning about hierarchical relationships.

Author Contributions

Conceptualization, I.W., A.K. and D.C.-R.; Methodology, I.W. and A.K.; Formal analysis, I.W. and A.K.; Investigation, I.W. and A.K.; Writing—original draft, I.W. and A.K.; Writing—review & editing, I.W., A.K. and D.C.-R.; Project administration, I.W. All authors have read and agreed to the published version of the manuscript.

Funding

This research received no external funding.

Institutional Review Board Statement

The study was conducted in accordance with the Declaration of Helsinki, and approved by the Institutional Review Board of Florida State University (Study ID 00003140, approved 25 April 2022).

Informed Consent Statement

Informed consent was obtained from the research participant.

Data Availability Statement

The original contributions presented in this study are included in the article. Further inquiries can be directed to the corresponding author.

Acknowledgments

We thank Mariah for her participation.

Conflicts of Interest

The authors declare no conflicts of interest.

Notes

1
These are also sometimes called “Euler diagrams” (e.g., Hub & Dawkins, 2018). In fact, our usage of “set–subset diagram” is more consistent with the diagrams of Euler than those of Venn (1880). However, that point is neither here nor there. Our concern lies not in the history of diagrams but in facilitating clear communication with both preservice teachers and readers of our work in the world today.
2
In fact, doing so is what the informal deduction level is all about—not accepting certain definitions and the relationships that follow from them, but reasoning logically based on definitions (Crowley, 1987; Van Hiele, 2004). The case in point is being able to entertain both definitions of trapezoid and reason logically about the consequences of the choice of definition, not to accept the inclusive definition and reject the exclusive definition.

References

  1. Abdullah, A. H., & Shin, B. (2019). A comparative study of quadrilaterals topic content in mathematics textbooks between Malaysia and South Korea. Journal on Mathematics Education, 10(3), 315–340. [Google Scholar] [CrossRef]
  2. Ball, D. L., Thames, M. H., & Phelps, G. (2008). Content knowledge for teaching: What makes it special? Journal of Teacher Education, 59(5), 389–407. [Google Scholar] [CrossRef]
  3. Brunheira, L., & da Ponte, J. P. (2019). From the classification of quadrilaterals to the classification of prisms: An experiment with prospective teachers. Journal of Mathematical Behavior, 53, 65–80. [Google Scholar] [CrossRef]
  4. Bulut, N., & Bulut, M. (2012). Development of pre-service elementary mathematics teachers’ geometric thinking levels through an undergraduate geometry course. Procedia—Social and Behavioral Sciences, 46, 760–763. [Google Scholar] [CrossRef]
  5. Clements, D. H., & Sarama, J. (2014). Learning and teaching early math: The learning trajectories approach (2nd ed.). Routledge. [Google Scholar]
  6. Common Core Standards Writing Team. (2013). Progressions for the common core state standards in mathematics (draft). Grades K–5, geometry. Institute for Mathematics and Education, University of Arizona. Available online: https://achievethecore.org/content/upload/ccss_progression_gk6_2014_12_27.pdf (accessed on 24 May 2025).
  7. Crowley, M. L. (1987). The Van Hiele model of the development of geometric thought. In M. M. Lindquist (Ed.), Learning and teaching geometry, K–12, 1987 Yearbook of the national council of teachers of mathematics. NCTM. [Google Scholar]
  8. Decano, R. S. (2017). Cognitive development of college students and their achievement in geometry: An evaluation using Piaget’s theory and Van Hiele’s levels of thinking. American Journal of Applied Sciences, 14(9), 899–911. [Google Scholar] [CrossRef]
  9. Department of Basic Education. (2011). Curriculum and assessment policy statement, grades 7–9: Mathematics. Available online: https://www.education.gov.za/Portals/0/CD/National%20Curriculum%20Statements%20and%20Vocational/CAPS%20SP%20%20MATHEMATICS%20GR%207-9.pdf?ver=2015-01-27-160141-373 (accessed on 24 May 2025).
  10. de Villiers, M. (1994). The role and function of a hierarchical classification of quadrilaterals. For the Learning of Mathematics, 14(1), 11–18. [Google Scholar]
  11. Fischbein, E. (1993). The theory of figural concepts. Educational Studies in Mathematics, 24, 139–162. [Google Scholar] [CrossRef]
  12. Florida Department of Education. (2023). Florida’s B.E.S.T. standards for mathematics. Available online: https://cpalmsmediaprod.blob.core.windows.net/uploads/docs/standards/best/ma/mathbeststandardsfinal.pdf (accessed on 24 May 2025).
  13. Fogarty, R. (2007). Literacy matters: Strategies every teacher can use (2nd ed.). Corwin Press. [Google Scholar]
  14. Fujita, T. (2008). Learners’ understanding of the hierarchical classification of quadrilaterals. Proceedings of the British Society for Research into Learning Mathematics, 28(2), 31–36. [Google Scholar]
  15. Fujita, T. (2012). Learners’ level of understanding of the inclusion relations of quadrilaterals and prototype phenomenon. Journal of Mathematical Behavior, 31, 60–72. [Google Scholar] [CrossRef]
  16. Fujita, T., & Jones, K. (2007). Learners’ understanding of the definitions and hierarchical classification of quadrilaterals: Towards a theoretical framing. Research in Mathematics Education, 9(1–2), 3–20. [Google Scholar] [CrossRef]
  17. Hershkowitz, R. (1989). Visualization in geometry—Two sides of the coin. Focus on Learning Problems in Mathematics, 11(1), 61–76. [Google Scholar]
  18. Houghton Mifflin Harcourt. (2010). Go math! Grade 3 common core edition: Standards practice book for home or school. Houghton Mifflin Harcourt. [Google Scholar]
  19. Hub, A., & Dawkins, P. C. (2018). On the construction of set-based meanings for the truth of mathematical conditionals. The Journal of Mathematical Behavior, 50, 90–102. [Google Scholar] [CrossRef]
  20. Jones, K. (2000). Providing a foundation for deductive reasoning: Students’ interpretations when using dynamic geometry software and their evolving mathematical explanations. Educational Studies in Mathematics, 44, 55–85. [Google Scholar] [CrossRef]
  21. Kimmins, D. L., & Winters, J. J. (2015). Caution: Venn diagrams ahead! Teaching Children Mathematics, 21(8), 484–493. [Google Scholar] [CrossRef]
  22. Mariotti, M. A., & Fischbein, E. (1997). Defining in classroom activities. Educational Studies in Mathematics, 34(3), 219–248. [Google Scholar] [CrossRef]
  23. Mensah, N. B., Odro, E. M., & Williams, D. A. (2023). Examination of 9th graders’ levels of geometric thinking. International Journal of Research in Education and Science, 9(3), 688–703. [Google Scholar] [CrossRef]
  24. Ministry of Education. (2024). New Zealand curriculum: Mathematics and statistics. Available online: https://newzealandcurriculum.tahurangi.education.govt.nz/getting-in-shape---level-3-4-geometry/5637200362.p (accessed on 24 May 2025).
  25. National Governors Association Center for Best Practices & Council of Chief State School Officers. (2010). Common core state standards for mathematics. Available online: https://learning.ccsso.org/wp-content/uploads/2022/11/ADA-Compliant-Math-Standards.pdf (accessed on 24 May 2025).
  26. Naufal, M. A., Abdullah, A. H., Osman, S., Abu, M. S., & Ihsan, H. (2021). Reviewing the Van Hiele Model and the application of metacognition on geometric thinking. International Journal of Evaluation and Research in Education, 10(2), 597–605. [Google Scholar] [CrossRef]
  27. NCTM. (2000). Principles and standards for school mathematics. NCTM. [Google Scholar]
  28. Nelson, D. (2008). The Penguin dictionary of mathematics. Penguin Books. [Google Scholar]
  29. Ontario Ministry of Education. (2020). The Ontario curriculum, grades 1–8: Mathematics. Available online: https://www.dcp.edu.gov.on.ca/en/curriculum/elementary-mathematics/grades/g6-math/strand-e/e1 (accessed on 24 May 2025).
  30. Pickreign, J. (2007). Rectangles and rhombi: How well do preservice teachers know them? Issues in the Undergraduate Mathematics Preparation of School Teachers, 1, 1–7. [Google Scholar]
  31. Steffe, L. P., & Thompson, P. W. (2000). Teaching experiment methodology: Underlying principles and essential elements. In A. E. Kelly, & R. A. Lesh (Eds.), Handbook of research design in mathematics and science education (pp. 267–306). Routledge. [Google Scholar]
  32. Tall, D., & Vinner, S. (1981). Concept image and concept definition in mathematics with particular reference to limits and continuity. Educational Studies in Mathematics, 12, 151–169. [Google Scholar] [CrossRef]
  33. van de Walle, J. A., Karp, K. S., & Bay-Williams, J. M. (2019). Elementary and middle school mathematics: Teaching developmentally (10th ed.). Pearson Education, Inc. [Google Scholar]
  34. Van Hiele, P. M. (2004). The child’s thought and geometry. In T. P. Carpenter, J. A. Dossey, & J. L. Koehler (Eds.), Classics in mathematics education research (pp. 60–68). National Council of Teachers of Mathematics. [Google Scholar]
  35. Venn, J. (1880). On the diagrammatic and mechanical representation of propositions and reasonings. Philosophical Magazine, 10(59), 1–18. [Google Scholar] [CrossRef]
  36. Whitacre, I., Kamaldar, A., & Caro-Rora, D. (2025a). Investigating preservice elementary teachers’ reasoning about set–subset, compare-and-contrast, and hybrid diagrams [Manuscript submitted for publication]. School of Teacher Education, Florida State University. [Google Scholar]
  37. Whitacre, I., Kamaldar, A., & Caro-Rora, D. (2025b). Supporting and documenting advances in preservice elementary teachers’ hierarchical geometric discourse [Manuscript submitted for publication]. School of Teacher Education, Florida State University. [Google Scholar]
  38. Wolfram. (2025). Wolfram MathWorld. Available online: https://mathworld.wolfram.com/ (accessed on 24 May 2025).
  39. Zembat, I. O., & Gürhan, S. (2023). Fostering a student’s abstraction of the relationship between parallelogram and trapezoid within quadrilateral hierarchy. Investigations in Mathematics Learning, 15(4), 241–265. [Google Scholar] [CrossRef]
  40. Zhou, L., Liu, J., & Lo, J.-J. (2022). A comparison of U.S. and Chinese geometry standards through the lens of van Hiele levels. International Journal of Education in Mathematics, Science, and Technology, 10(1), 38–56. [Google Scholar] [CrossRef]
Figure 1. Examples of set–subset and compare-and-contrast diagrams: (a) A set–subset diagram showing that cats and dogs are both types of mammals; (b) a compare-and-contrast diagram listing similarities and differences between cats and dogs, including the fact that both are types of mammals.
Education 15 01283 g001
Figure 2. Authors’ recreation of Brunheira and da Ponte’s (2019) Figure 11 (p. 76): (a) Júlia’s first attempt; (b) Júlia’s final answer.
Education 15 01283 g002
Figure 3. Mariah’s first version of a rectangle–rhombus–square diagram.
Education 15 01283 g003
Figure 4. Mariah’s second version of a rectangle–rhombus–square diagram.
Education 15 01283 g004
Figure 5. Mariah’s third version of a rectangle–rhombus–square diagram.
Education 15 01283 g005
Figure 6. Mariah’s fourth version of a rectangle–rhombus–square diagram.
Education 15 01283 g006
Table 1. Mariah’s Initial Personal Figural Concepts of the Quadrilaterals Discussed in Session 1.
QuadrilateralMariah’s Personal Figural ConceptEvidence from Session 1 Transcripts
SquareA square has four equal sides and four right angles. It is not allowed to be oblong.M1.076—M: Ok, the rectangle has four sides, four right angles, but that, the square is more specific to where the four sides are equal.
RectangleA rectangle has four sides and four right angles. It is allowed to be equilateral.M1.080—M: Oh, parallel. Yeah. And there are two sides are parallel. And four right angles.
M1.180—M: Yes. So, like what the rectangle, we can change it, and we can change the sides into a figure that’s square. So, like the definition of the rectangle, it’s just more broad, which allows for more room to be, but the square is specific to where it cannot be changed into a rectangle.
ParallelogramA parallelogram has four sides, two pairs of parallel sides, two acute angles, and two obtuse angles. It is allowed to have sides of equal length. It is not allowed to have right angles.M1.207—M: …The parallelogram can have two different length sides. But it’s still like the two sides are parallel and they’re kind of at an angle also. like those shapes you can kinda–
M1.218—M: For both of them [referring to parallelogram and rhombus], I saw that they have like two acute angles, two obtuse angles, they both have four sides, and they both have two pairs of parallel sides like the top and the bottom in parallel, the two sides are parallel.
M1.219—M: …like for the parallelogram, like the two, the top and the bottom are equal, and the sides are equal, but they’re not necessarily the same length.
RhombusA rhombus has four equal sides, two pairs of parallel sides, two acute angles, and two obtuse angles. It is not allowed to have right angles.M1.207—M: Yeah, so I feel like the rhombus is kind of like the square where it has four equal sides.
M1.218—M: For both of them [referring to parallelogram and rhombus], I saw that they have like two acute angles, two obtuse angles, they both have four sides, and they both have two pairs of parallel sides like the top and the bottom in parallel, the two sides are parallel.
M1.219—M: But for the rhombus, all the sides are equal…
Table 2. Mariah’s Application of Inclusive Definitions of Trapezoid, Parallelogram, and Rhombus.
Quadrilateral RelationshipMariah’s Explanations from Session 3
Trapezoid–parallelogram
relationship
Education 15 01283 i002
M3.221—I: Okay, and how did you decide to put trapezoids there?
M3.222—M: So, for our inclusive definition of trapezoids, we just said one pair of parallel sides, and we already said the circle of parallelograms all shapes included within that circle had two pairs parallel sides. So, if it’s at least one, then it would just be a broader circle. So, there’s some like trapezoids to just to one– there’s just some shapes with just one pair of parallel sides and that would be on the outside like this area [She points to the ring labeled “Trapezoids”] and then once you move onto two, you go into here [She points to the region labeled “Parallelograms”] and then it gets more specific as you go.
Types of ParallelogramsEducation 15 01283 i003
M3.243—M: …the parallelogram branches off even more, and it [referring to one of the branches] has four right angles. And this one has four equal sides. So, the four right angles is the rectangle, four equal sides is a rhombus. But then there’s one category that’s included under the two and so, I kind of connected them both to the square down here, because the square has four—um, four right angles and four equal sides.
Table 3. Mariah’s Initial Personal Figural Concepts of the Diagram Types Discussed in Session 1.
Diagram TypeMariah’s Personal Figural ConceptEvidence from Session 1 Transcripts
“Venn diagram”A “Venn diagram” consists of two overlapping circles and is used for comparing and contrasting. Similarities are listed in the overlapping region. Differences are listed in the non-overlapping regions.M1.021—I: What is a Venn diagram to you?
M1.022—M: Umm, usually, I feel like it’s like two overlapping circles and like, it discusses the differences on the non-overlapping parts and the similarities of two different things…
“Compare and Contrast Diagram”Same as above. In response to the instructor’s request, Mariah renamed “Venn Diagram” as “Compare and Contrast Diagram.”M1.090—I: …And because “Venn diagram” could actually mean different things to different people, can we make up a name for this kind of diagram too?
M1.091—M: Umm, I feel well [Pause], I feel like we just call this compare and contrast diagram.
“Container Diagram” (Mariah’s invented name for set–subset diagram)A “Container Diagram” consists of a big circle with a small circle inside it. The big circle is for the “genre”, and the small circle is for the “subgenre.” The subgenre has the characteristics of the genre, plus something more specific.M1.072—M: So usually, like, the smaller circle is, it’s like, has the same characteristics as the bigger circle, but it’s more specific than the bigger circle.
M1.088—I: Could you make up a name for it?
M1.089—M: [Pause] Maybe like container diagram.
M1.122—M: Yeah, so in the bigger circle, I put ice cream and I said it’s a sweet frozen desert. And then in the little circle, I put chocolate chip ice cream and I said has chocolate chips. But by putting the chocolate chip ice cream in a little circle, I mean that it’s still a part of the ice cream genre. It’s just a specific type of ice cream.
Disclaimer/Publisher’s Note: The statements, opinions and data contained in all publications are solely those of the individual author(s) and contributor(s) and not of MDPI and/or the editor(s). MDPI and/or the editor(s) disclaim responsibility for any injury to people or property resulting from any ideas, methods, instructions or products referred to in the content.