Systematic Review

Learning Analytics with Small Datasets—State of the Art and Beyond

by
Ngoc Buu Cat Nguyen
1,* and
Thashmee Karunaratne
2
1
School of Business, Economics and IT, University West, Gustava Melins Gata 2, 461 32 Trollhättan, Sweden
2
Institution of Learning, Royal Institute of Technology—KTH, Brinellvägen 68, 114 28 Stockholm, Sweden
*
Author to whom correspondence should be addressed.
Educ. Sci. 2024, 14(6), 608; https://doi.org/10.3390/educsci14060608
Submission received: 15 April 2024 / Revised: 27 May 2024 / Accepted: 4 June 2024 / Published: 5 June 2024
(This article belongs to the Section Technology Enhanced Education)

Abstract

:
Although learning analytics (LA) often processes massive data, not all courses in higher education institutions are on a large scale, such as courses for employed adult learners (EALs) or master’s students. This places LA in a new situation with small datasets. This paper explores the contemporary situation of how LA has been used for small datasets, whereby we examine how the observed LA provisions can be validated in practice, which opens up possible LA solutions for small datasets and takes a further step from previous studies to enhance this topic. By examining the field of LA, a systematic literature review on state-of-the-art LA and small datasets was conducted. Thirty relevant articles were selected for the final review. The results of the review were validated through a small-scale course for EALs at a Swedish university. The findings revealed that the methods of multiple analytical perspectives and data sources with the support of contexts and learning theories are useful for strengthening the reliability of results from small datasets. More empirical evidence is required to validate possible LA methods for small datasets. The LA cycle should be closed to be able to further assess the goodness of the models generated from small datasets.

1. Introduction

Rapid and robust analytical methods that allow students’ academic performance and throughput to be optimized have become significant in higher education institutions (HEIs) in recent years [1]. Learning analytics (LA) in HEIs builds on the basis of data generated from learners’ interactions with technological devices or system-based platforms, accordingly, to seek to comprehend and enhance learning and the environments in which it occurs [2]. The majority of LA techniques are based on machine learning algorithms, which oftentimes require big data to produce reliable prediction models with high accuracy. Thus, it is common for analytics to be effectively applied to massive courses operated fully online (MOOCs), not only due to the size of the data it accumulates but also due to the ability and flexibility that LA provides to support individual learners in a course with massive participation. However, not all courses in HEIs have a large number of students. Many courses in universities, such as master’s programs or professional development programs, have traditionally been directed towards specialized disciplines and have small groups of students, often less than 50 [3]. This leads to a question about the potential of LA for small classes, hence the small number of data subjects. However, in the field of LA, contemporary research has not been focusing on the applications in such courses, despite similar demands [4]. Hence, how small groups of learners in a social–technical context can benefit from LA is a conundrum to resolve, as learning in this context occurs through the complex processes and interactions of various factors, artifacts, and environments [5], specifically if the group comprises employed adult learners (EALs) [6]. Due to this complexity, the assessment of learners should concentrate on not only the learning outcomes but also the entire process of how learners learn [7]. To address and take sides in the complex learning of a small number of learners, process-oriented support for the integration of data across multiple sources is essential [8].
In order to apply LA to small datasets, we need to overcome the problem of high data dimensionality, as there are too many factors affecting EALs’ learning. Using machine learning techniques such as data fusion, information fusion, or principal component analysis to reduce data dimensionality is viewed as a “blunt instrument”, since these algorithms are grounded in mathematical theories rather than human behavior theories [9]. Thus, variables are better selected following established theories or learning design (LD) [10] in educational contexts where human judgement is key [11], which leads to richer and more likely useful meanings of LA results with a certain socio-technical context [9]. Moreover, feature selection can be based on ad hoc guesswork or significant experience in the educational field [12].
Scholars in the LA field have struggled with small datasets for some time [13]. Accordingly, LA results and applications generated from small datasets are usually supposed to be unreliable, tentative, insufficient, or biased [14,15]. However, this should not be a reason to conclude on the inapplicability of LA to small datasets, in contrast with an increasing need for using LA for small datasets. Drawn from the above-mentioned gaps between the demand and the availability of LA applications for small datasets, this paper explores possible ways forward from the literature of LA and educational methods built on small datasets. The following two primary research questions are set up:
RQ1: How has learning analytics been applied to small datasets in the contemporary literature?
RQ2: Do the observed learning analytics provisions work in actual small-scale courses?
In answering the first question, a systematic literature review (SLR) was performed to examine the contemporary applications of LA on small datasets. The observations and outcomes from the SLR became the inputs for this case study to validate the existing solutions, thereby triangulating and reflecting on the gaps between the SLR and practice, namely, the case study, and vice versa, using this case study to fulfill the SLR results.
This case study was informed by complexity theory to capture EALs’ complex learning, support variable selection in LA, and guide the LA process from analyzing simple and single learning activities to an aggregated analysis of the EALs’ learning in the course. Due to the distinct characteristics of EALs and the complexity of their learning, research on EALs is limited [16]. Thus, this study is considered an exploratory investigation of both the group of EALs and the applications of LA for this learners’ group, represented as a small dataset. This paper opens a way forward from the current literature by justifying the findings and curating possible methods through a case study, thereby enhancing the applicability of LA to small datasets.

2. Background

2.1. LA and Small Datasets

Over the years, the community of LA practices has encountered the limitations of small datasets and a lack of work considering how LA might be used on a small scale [4,17]. In the previous literature, small data were commonly considered when associated with actual effects [1] or in studies applying multimodal learning analytics (MMLA) or simulations [18]. These studies have the trait of using controlled environments or technical devices to conduct experiments on predetermined subjects to gather data and draw early conclusions. Many MMLA studies have small sample sizes, which reflects how difficult it is for researchers to obtain data on a large scale [19]. MMLA studies are often carried out in complex set-ups using advanced technologies such as cameras, wearables, audio recorders, or sensing devices in order to capture teaching and learning processes, which may result in the impractical and cumbersome deployment of such approaches in real-time learning environments [19].
There are different perspectives on small datasets. By virtue of the variable broad data landscape influencing learning, some studies with several hundred students or several thousand data records were deemed to be small datasets [20], while other studies with less than 50 students stated that their datasets were small [21]. In light of this reality, this study follows the studies of Yan et al. [3] and Van Goidsenhoven et al. [21] in viewing datasets with less than 50 learners in a single course as small datasets. Courses for EALs are often offered online or in a blended format, with an emphasis on synchronous meetings. Learning within learning management systems (LMSs) is therefore regarded as an add-on. Due to the scarcity of interaction, these courses’ LMS course pages are generally quiet [22].
Yan et al. [3] revealed that 71% of predictive analytics studies were conducted with a small-scale sample (n < 50). In addition to the size of the dataset becoming inadequate to train good predictive models, small datasets can be subjected to issues that lie on the other side of the problem spectrum, such as model overfitting, data shortages for training and testing, data splitting, model selection, or class imbalance. These problems result in the overarching problem of generalization. As a result, the effects of small datasets often align with exploratory research or preliminary findings. In line with small datasets in MMLA research, ethical challenges such as distribution equality and the risks of bias are raised [3].

2.2. The Learning of EALs as a Complex System

The learning of EALs is complex in the sense that every learner has a unique demography, motivation, goals, personal and work background, knowledge level, learning styles, and learning interests. The age of EALs in the same course may widely vary, typically between the twenties and sixties. When entering an HEI, EALs look for practical aspects to be able to deal with work-related or life-related challenges that they feel unsatisfied with or to sustain their employability [6]. EALs are active employees who engage in continuing education and training, or professional development, rather than initial occupational preparation or pre-employment training. Learning for EALs is viewed as a supplementary tool to help them approach their career or job-related goals while their actual time is spent working. Hence, courses for EALs often have a small number of learners.
According to Arrow et al. [23], groups of EALs are complex systems interacting with smaller systems, which are the individuals embedded in them, and with larger systems, which can be universities, departments, or LMSs. Each EAL is a complex system with many interactions among different factors within their learning environment. Small-scale courses for EALs act as complex systems nested in other complex systems at different levels to form a highly dynamic learning environment for EALs. This complexity requires the dynamics of LD for EALs. Following Goggins et al. [9], complex systems can be shaped from the “bottom-up” using simple information. Thus, we examine immanent LA possibilities for a small group of EALs with a focus on simple, theoretically informed, and low-level interactions that contribute to higher levels of complexity.

3. Methods

In this study, the two research questions were investigated in two steps. Firstly, an SLR was performed to summarize the knowledge of how LA has been applied to small datasets. The outcomes of the SLR provided the LA methods for empirically studying a case of a small-scale course (small dataset). This was to verify how valid and applicable the existing knowledge of LA methods on small datasets is, in contrast to common LA methods for big data.

3.1. SLR

We investigated how the LA community embarks on this inquiry through search results by drawing insights about the upside and downside of small datasets toward LA results, which contexts include small datasets, and which features are selected to solve the LA problems. The SLR process was carried out based on the PRISMA framework [24].

3.1.1. Article Search Strategy and Selection Procedure

To ensure the rigor of this study, a literature search was conducted in SCOPUS, the ACM Digital Library, and the Journal of Learning Analytics (JLA). Amongst them, the JLA and ACM, including the International Learning Analytics and Knowledge Conference (LAK), serve as the main forums for LA research while SCOPUS, which is a widely multi-disciplinary database, was selected to reduce the risk of losing potential valuable insights other than the LA outlets. Table 1 presents the procedure information for this SLR. The search protocol included small dataset as a main keyword, since it was presumed that if the studies emphasized datasets which are small, the methods applied to learn from those data would necessarily and sufficiently address the methodological need to learn from small datasets. ACM and SCOPUS offer an advanced search engine that allows complex search queries; thus, we could consider all relevant keywords to make the search combination more comprehensive. The returned results were within the time span of 2012 to 2022 or 2023. Only scientific and peer-reviewed papers were considered. Regarding JLA, the search engine did not work well with a complex search query. Hence, we skipped the “learning analytics” and “teaching analytics” keywords since JLA was primarily used for LA and teaching analytics. We performed two searches separately, first with “small data” and second with “small sample”. The other inclusion criteria could not be considered due to the few papers returned. The ACM and JLA yielded a modest number of results; thus, the search scope was drawn from the entire databases whereas SCOPUS was limited to the extent of title, abstract, and keywords to increase the relevance of the study.
Overall, 115 hits were returned from the databases. Figure 1 displays the screening and selection in this SLR. There was one duplicate found, and there were no particular papers about LA and small data, so we performed a full-text screening of all the papers to refine the relevant papers and knowledge that we aimed for. Accordingly, 66 hits were excluded, namely 2 work-in-progress papers, 1 poster, 1 lecture note, 14 papers with a large sample, 1 inapplicable access paper, and irrelevant papers. The next step was assessing the eligibility of the 48 remaining papers. Sixteen hits were excluded in this step, for we set the criterion for the size of the small datasets in this study as less than 55 (which is close to the number considered a small dataset in the previous literature, as mentioned in Section 2.1, and ensured the quality of this SLR in terms of the number of final selected articles). Two irrelevant hits were removed. Finally, 30 papers were selected for analysis; to wit, 27 hits from the ACM, 2 hits from the JLA, and 1 hit from SCOPUS.

3.1.2. Data Coding and Analysis

A document analysis approach was followed for the coding and analysis of the documents. The selected papers were carefully read and coded in Excel in the following columns: title, country, subject, type of learning, solutions for small data, implementation type, method, algorithm, data, applications, impact, future work, contribution, and target. Reading and scrutinizing of the papers were repeated many times during coding and analysis to ensure the correct categorization.
The Futures Wheel technique was applied in this SLR to think through the possible impacts of the current situation and organize our thoughts about future tendencies of LA and small datasets [25]. Based on the Excel categorization, it became simpler to sketch, map, and locate the items and impacts in this Futures Wheel. The first Futures Wheel was sketched with detailed and specific items and impacts. The second Futures Wheel was afterwards developed and perfected by grouping the related features and generalizing the names premised on the first Futures Wheel.

3.2. Empirical Study

The main concern of this empirical investigation is whether the findings from the SLR can be replicated or extended in an authentic context (a case study). One course for EALs at a Swedish university was chosen for this case study. The EALs were between the ages of thirty-four and fifty-nine, coming from different companies. The course syllabus and curriculum were built based on current employers’ demands. We chose this course for two reasons. Firstly, this course usually has a small number of learners every year since it aims for people with specialized knowledge in engineering, which fits the focus on the small dataset in this study. Secondly, the versatility of learning activities in this course can be observed through log data. Following the Swedish national system of student administration for HEIs (Ladok), there were twenty learners registered for the course, of which seven learners did not complete the course, one did not start, and the rest completed it. There were no failed cases or low grades. The course was conducted in a blended format, with one physical and three online meetings. The course offered 3.5 credits, equivalent to approximately ninety-three learning hours, and lasted from the middle of December 2019 to the end of March 2020. The learners were expected to study on weekends, evenings, and in their spare time while still working full time.
We used a mixed-method approach in this empirical study: an in-depth interview and LA methods. The mixed-method approach helped measure the quality of the course design by examining whether the EALs’ learning patterns met the educator’s expectations.
The in-depth interview served as the first step of this approach to explore the educator’s expectations and plans when designing the course for EALs. The interview was conducted online with the educator and lasted longer than one hour, including notetaking, recording, and obtaining approval.
In the next step, based on the available dataset and the LD of this course, proper LA methods found in the SLR were selected to analyze the dataset of this course. The data from the LMS were used for visualization, followed by statistical tests. The size of the data was equal to the number of learners, which was twenty.
Data Visualization: The quantitative data extracted from two systems included (1) Canvas log data and (2) Ladok final results. Canvas log data contain course page views, assignment submissions, discussions, and an access report. To prepare for the data extraction, permission from the company was obtained. Regarding ethics and data privacy, the student ID field was anonymized by hiding two digits when it was displayed in the charts. The URLs were mostly pruned, and only the necessary content, such as title and category name, was shown. The titles of assignments, discussion threads, and files were translated into English.
Statistical Tests: The statistical tests reinforced the observations from the data visualization. Due to the small sample size, the Fisher exact test was used for the comparison of two independent proportions [26]. The test examined a binary outcome (early or non-early engagement) obtained from two groups (the learners completing versus not completing the course) in the learning activities of submitting assignments, participating in discussion threads, and viewing learning materials. Early engagement was classed as when the learners first posted, viewed, or submitted in December 2019. Doing so in January and February 2020 was classed as non-early engagement.

4. Results

4.1. Findings of the SLR

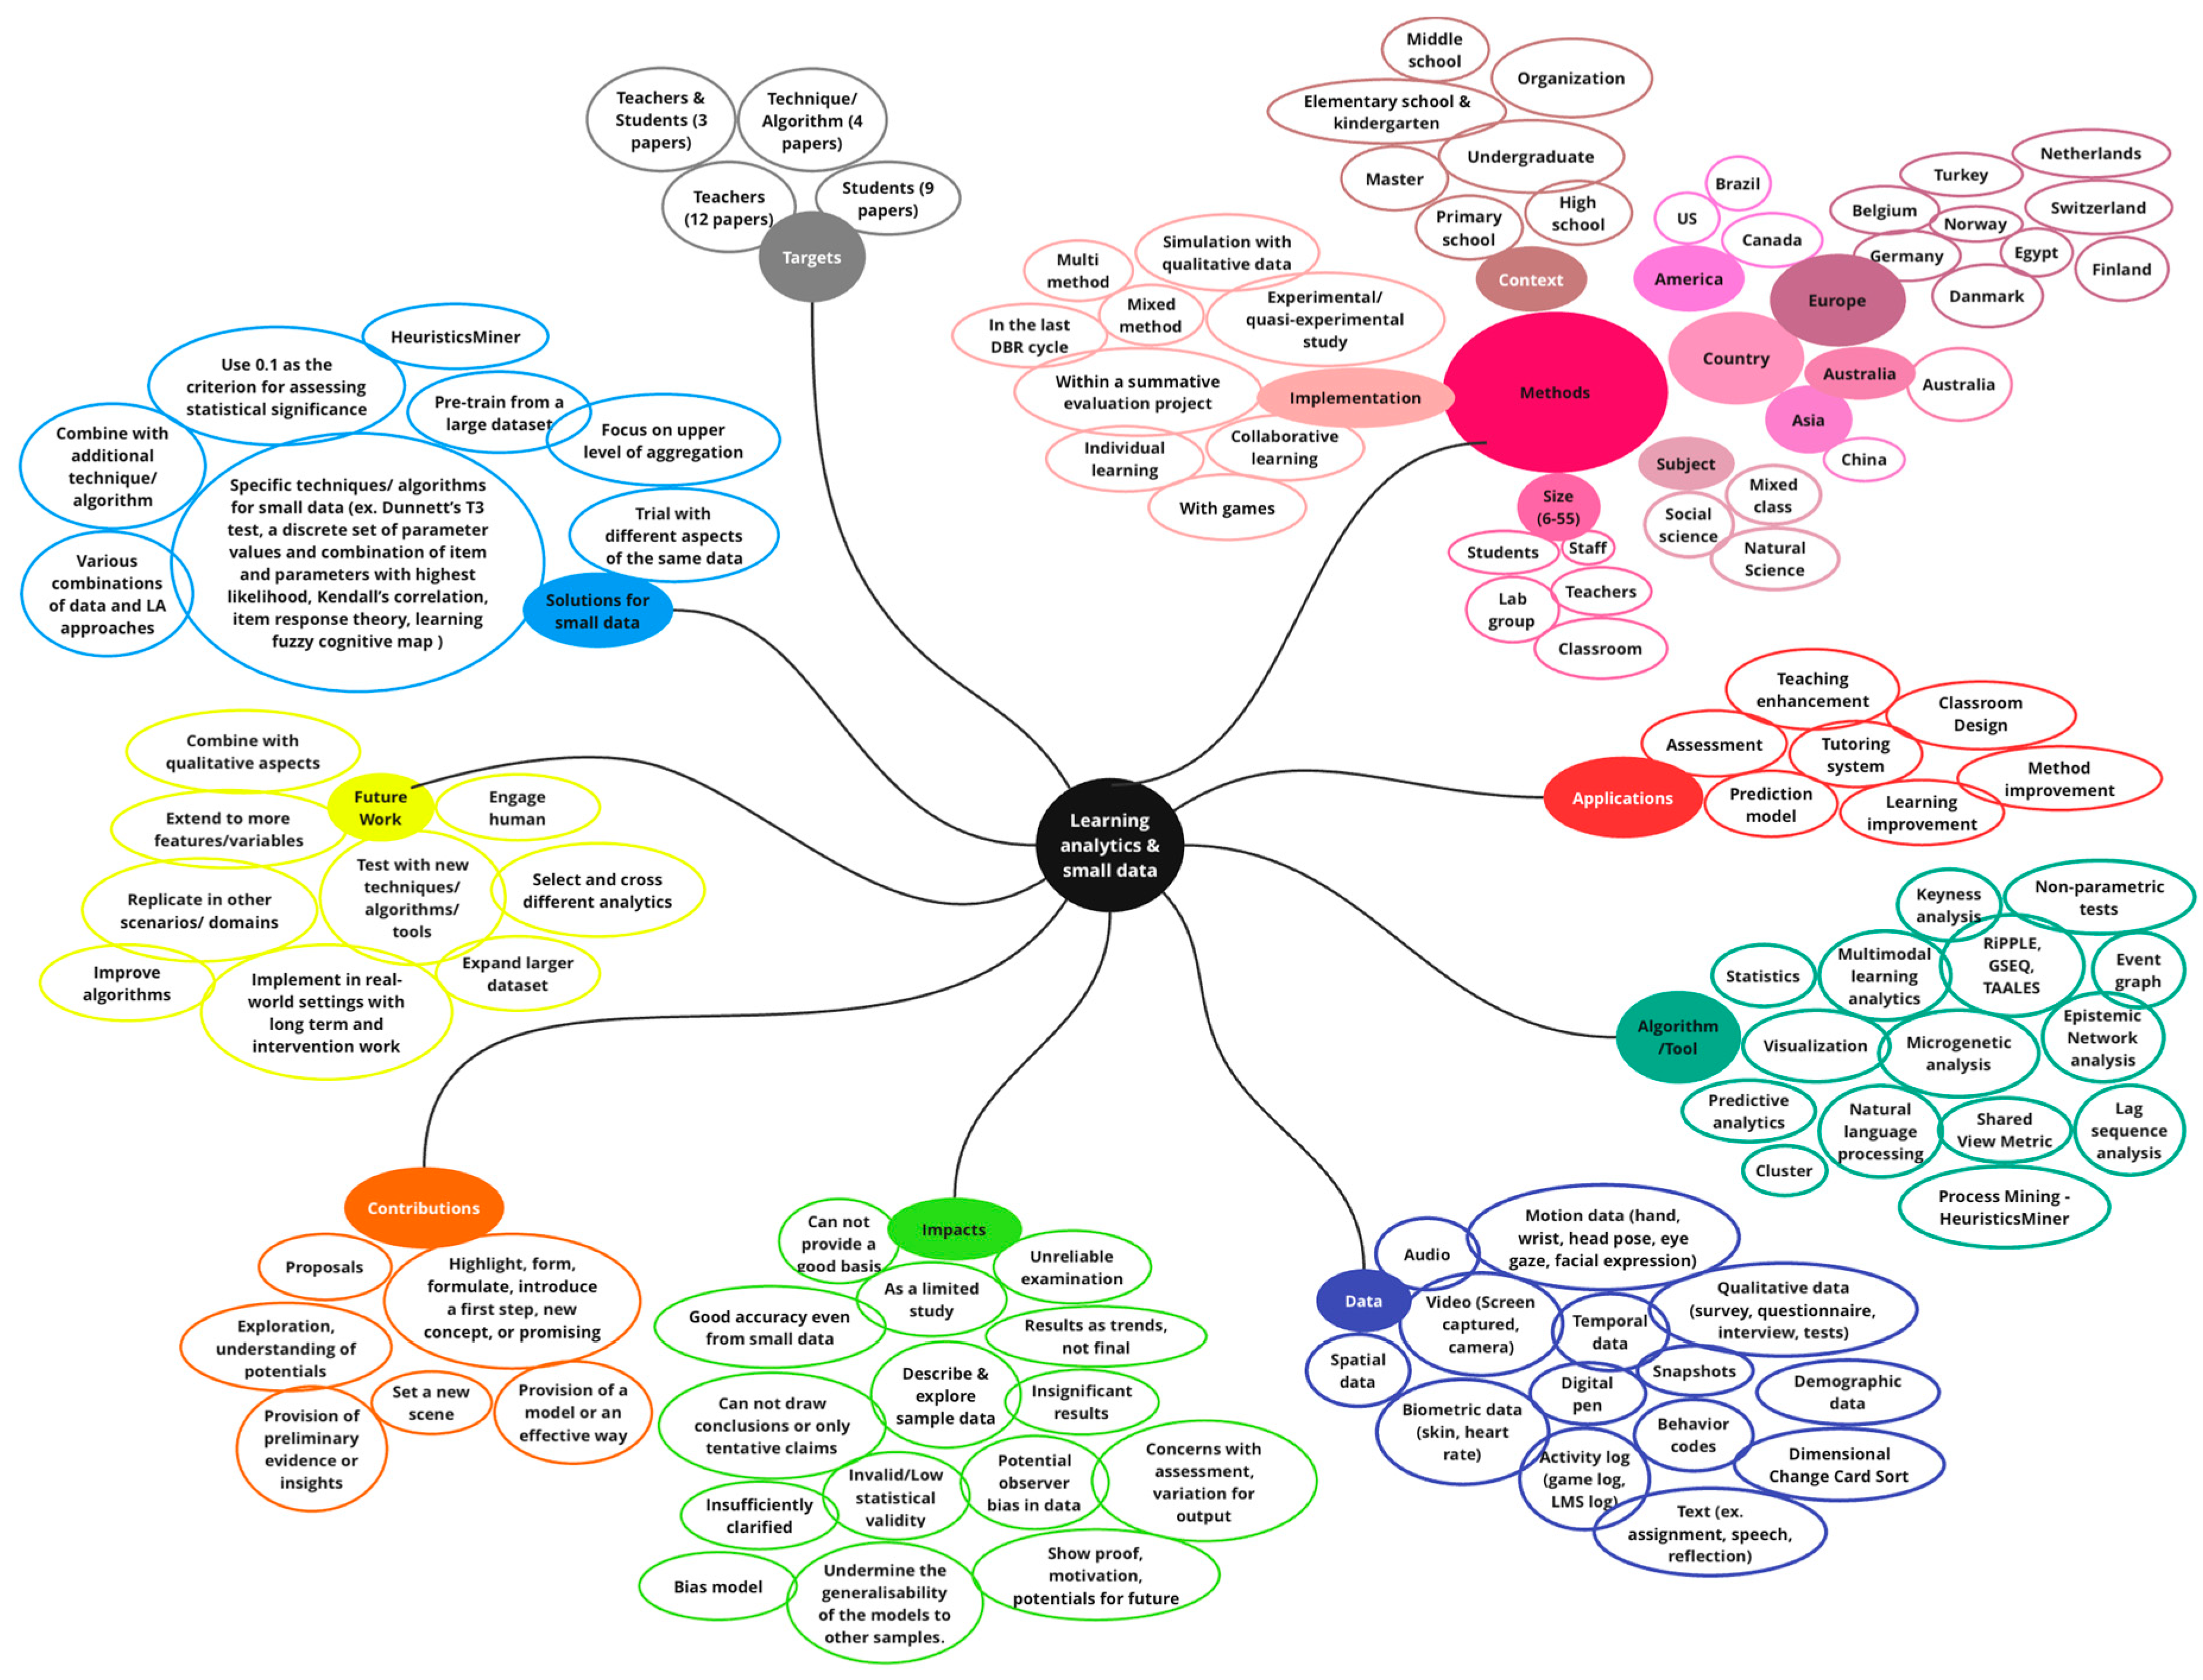
The findings of the SLR are presented according to the following aspects: methods, applications, algorithms/tools, data, impacts, contributions, future work, solutions for small data, and targets. In the methods aspect, the details followed included implementation, context, country, subject, and the size of dataset. All of these aspects, delivered as an overarching picture of LA in relation to small datasets, are described in Figure 2. Originating from these details, this section provides the existing LA methods and techniques for small datasets and how they have been used in previous studies. This section answers RQ1.
Among the selected papers, only 13 papers showcased solutions that were explicitly for small data. The rest of the papers did not classify the methods specifically for small datasets, but they recognized that the datasets were small. Specifically, pre-training with large datasets was one solution used before applying models to small datasets [27]. The other LA methods recommended encompassed trialing with different aspects of the same dataset [28] or using various combinations of learning data and LA approaches [21].
That is to say, in order to trial different aspects of the same datasets and combine various data and LA approaches, several authors applied implementations such as MMLA, games, simulations, experiments, common LA techniques, and multi- or mixed methods. Table 2 summarizes the statistics of the implementations. Data examined in the articles included biometric data (galvanic skin response, skin conductance, heart rate, or dimensional change card sort for measurements of executive cognitive control), traces of physical behaviors or cognitive/emotional states (hand–wrist movement, head pose, facial expression, eye gaze; spatial data while moving; data from digital pens; or data from cameras or recording), log data (learning activities, temporal data, or text from assignments), and qualitative data (questionnaires, surveys, interviews, pre- and post-tests, or demographic data).
The methods that used biometric and trace data were mostly MMLA methods, since these data were generated by cameras, microphones, digital pens, or wearable devices. The common algorithms and techniques used in MMLA are, for example, clustering, correlation, prediction, and analyses of motion, movement, location, and surroundings. The contexts in which MMLA can be applied were designed as either ten-hour tasks, eight school weeks, long-time sessions, or a couple of stages such as completing questionnaires or specific tasks, attending lectures, interacting with simulations, or having hand-annotated events. The kinds of student groups engaged with MMLA in the articles included primary schools, high schools, universities, and organizations. The participants were equipped with the necessary devices or applications, situated in a controlled environment designed for the studies, and were required to perform specific learning tasks either in groups or individually, whereby the respective data were generated based on their actions. The conditions for controlled environments included same-gender groups with varying performance capabilities [29], assigned groups based on academic progression in the previous school year, and assigned random home groups [15]. Advanced technology devices and complex controlled settings may be the reasons why MMLA is used for small groups as pilot studies.
Regarding common LA techniques such as visualization, clustering, text analysis (e.g., topic modeling, epistemic network analysis (ENA), keyness analysis, and the word-embedding model), and statistics (descriptive, regression, or correlation), they can be combined or utilized separately, but for different kinds of data. Text analysis methods are applied to text data, including transcribed group conversations, speeches, notes, responses, and written assignments. These learning activities can be designed as a specialized course, a module, or a simulation. Language did not seem to be a barrier since the texts in the studies were in Danish, Finnish, and English. The purpose of topic modeling is to find out the underlying topics from texts [28], while the word-embedding model is an automatic classification used together with deep networks for conversation analysis, which can result in good accuracy even with a small dataset [27]. The aim of ENA is to assess the quality of discourse in the text, whereas keyness analysis identifies significantly frequent linguistic words. Turning to clustering, to generate sufficient data for clustering, some authors, when designing their studies, for example, set up hierarchical coding schemes [14] or design multifold learning activities to generate enough interaction data [30]. Some articles suggested performing archetype clustering to support hierarchical clustering [31] or using agglomerative hierarchical clustering with Euclidian distance measure and Ward’s criterion [30] to improve the quality of the outcomes. The purpose of clustering is to identify distinguished groups or patterns hidden in datasets. Statistical analysis is the other commonly used method which investigates the relationship between various measures or examines independent variables which provide the best prediction [32]. In the case of small datasets, the articles suggested supplementing significance tests with effect size measures to enhance the results [18], using the ϕ corr method to improve performances for regression and classification [33], using 0.1 instead of 0.05 as the criterion for assessing statistical significance [34], using Dunnett’s T3 test [35], using a discrete set of parameter values and a combination of items and parameters with the highest likelihood [36], using nonparametric tests [15], or using Kendall’s correlation [37]. Prediction methods are popular for small datasets [13]. The measures in this regard are chiefly predicting performance, dropout, retention, building models, or recommendation systems [38]. The algorithms learning fuzzy cognitive map (LFCM) and two-parameter logistic ogive function (2PL) of item response theory (IRT) were specifically implemented with small datasets. LFCM is an approach to student performance prediction and works well on limited sample sizes, although its predictive power is not as good as other techniques (e.g., regression) [38]. The aim of 2PL-IRT is to build a model to predict student behavior in rule-based e-tutoring systems [36]. Generally, MMLA and common LA have overlapping algorithms and techniques; however, MMLA differs from common LA techniques primarily in that it is not restricted to click-stream analysis of keyboard-based computer interaction but considers multiple natural communication modalities and can be applied to both computer-mediated and interpersonal learning activities [39].
Simulations tended to combine interactions with the simulations and the reflections of participants. In some studies, there were pre-tests before the actual activity to compare the knowledge of participants before and after simulations. Through interacting with simulations, the studies explored the potential and capabilities of various topics such as assessments of science epistemology [40], learning the concept of feedback loops among elementary students [18], or assessments of the quality of collaboration across multiple device platforms in a single shared space [41]. These studies did not apply any restrictions such as contexts, groups, data types, or fields, but required a good and circumspect research design which covered the measurements of research questions with supported simulations that played a significant part in exploring the measures through data.
Game-based learning is another method that some articles in the corpus focused on and tended to integrate with qualitative data. However, the learners were primary- and middle-school students. Similar to simulations, these studies did not have restrictions on certain subjects, data, or settings; however, in order to help students meet the learning objectives or fortify specific skills, games need to be in line with the learning objectives. The objectives of the studies were to support memorizing multiplication facts [42], algorithmic thinking [31], learning fractions [43], or students’ visual attention [35].
(Quasi-) Experiments are apt to divide groups to act in various conditions to inspect the differences in the outcomes produced from different conditioned environments. These studies used either several algorithms to analyze the same data, analyze multiple data aspects, or a combination of quantitative and qualitative data generated from multiple activities in the experiments. The purposes of experiments in general included, for instance, scrutinizing the concrete learning processes of students (e.g., the problem-solving process) [44], investigating the impact of a digital artifact (e.g., educational recommender system, digital pen) [33,34], or evaluating a skill (e.g., computational thinking) [45]. It is remarked that experiments usually require a checking condition such as a skill, an artifact, or an intangible condition. One of the typical algorithms applied in the experiment implementation type was process mining (e.g., HeuristicsMiner, microgenetic analysis, Fuzzy Miner, and lag sequence analysis). The aim of process mining algorithms is to find touchless learning flows or process paths, for example, if groups of students with different study goals follow different learning strategies and different study activities [30], or to detect the significance status of the probability of one behavior occurring after another [45].
Table 3 shows a synthesis of the above-mentioned LA methods and algorithms which handle small datasets.
Both negative and positive dispositions of small data influencing results were observed, yet the negative conclusions tended to transcend the positive standpoints. Small data resulted in, for example, uncertainty, limitations of the study, invalid or low statistical validity, provision of a weak basis, undermining generalizability, insignificant results, or potential observer bias in the data. In addition, the studies with small samples of data subjects suggested corrective measures such as setting a new scene, exploring or understanding the potential of LA applications or techniques, or providing preliminary evidence or insights. Evidently, strong conclusions or claims could not be found in these papers due to the fact that a small dataset is viewed as a limitation instead of a real situation in which a solution should be sought. The opposite viewpoints for small data in LA were about showing models with good accuracy or showing proofs, motivations, or potentials for future research.
As a way forward, most of the papers suggested expanding the studies to be able to generalize the results and the efficacy of the LA models. Extending to more features or variables, improving algorithms through adjusting relevant factors (e.g., thresholds, parameters, or mining methods), and testing new techniques, algorithms, or tools with the purpose of increasing precision and generalizability were the other options for future directions. Some articles provided recommendations for replicating the studies in other scenarios or domains, or combining them with additional data collection, such as qualitative aspects, to create a more fruitful conversation around data bias.

4.2. Results from Empirical Study

The empirical case study was set up to evaluate the findings of the SLR in practice. There are a few concrete takeaways from the SLR, namely MMLA, applications of mixed methods or multiple methods, aggregation of different aspects of the same dataset, using various combinations of learning data and LA approaches, or pre-training using a large dataset. Based on these findings, we chose the methods which were appropriate to our empirical case and dataset to examine the effectiveness of the suggested solutions for small datasets. Accordingly, the selected methods included a mixed-methods approach with various analytical perspectives on the dataset, LA methods (visualizations and statistical tests), and a p-value of 0.1 for the significance of the statistical tests. We additionally used the Fisher exact test due to the conformity with our data to explore the correlations among data attributes and enhance the visualization findings.

4.2.1. Foundation for Data Variable Selection

The interview with the educator provided the context and the course design, which were viewed as the foundation for data variable selection. There were both face-to-face and online learning activities, but only those which could be digitally measured were described in this paper.
Firstly, the course provided instructions for the lectures and seminars on Canvas beforehand, so the learners could prepare for the lectures and seminars. The educator noted that although the information was presented in the course plan at the beginning of the course, the learners could not afford to regularly check the course plan as EALs also have other commitments, as confirmed by the relevant literature [6]. Thus, the educator repeated the information before every lecture and seminar.
Secondly, assignment submissions and discussion forums were designed before lectures to capture how the learners perceived and what they thought about after reading the literature. The learners were expected to participate in the discussions and assignments even if the activities were not mandatory.
Thirdly, the elective lectures were recorded because of the students who could not participate in the lectures or who wanted to watch them again.
Based on the learning activities and available data on Canvas, the variables of page views, assignment submissions, discussions, and viewing materials were selected for the LA analysis.

4.2.2. Analysis of Student Interactions

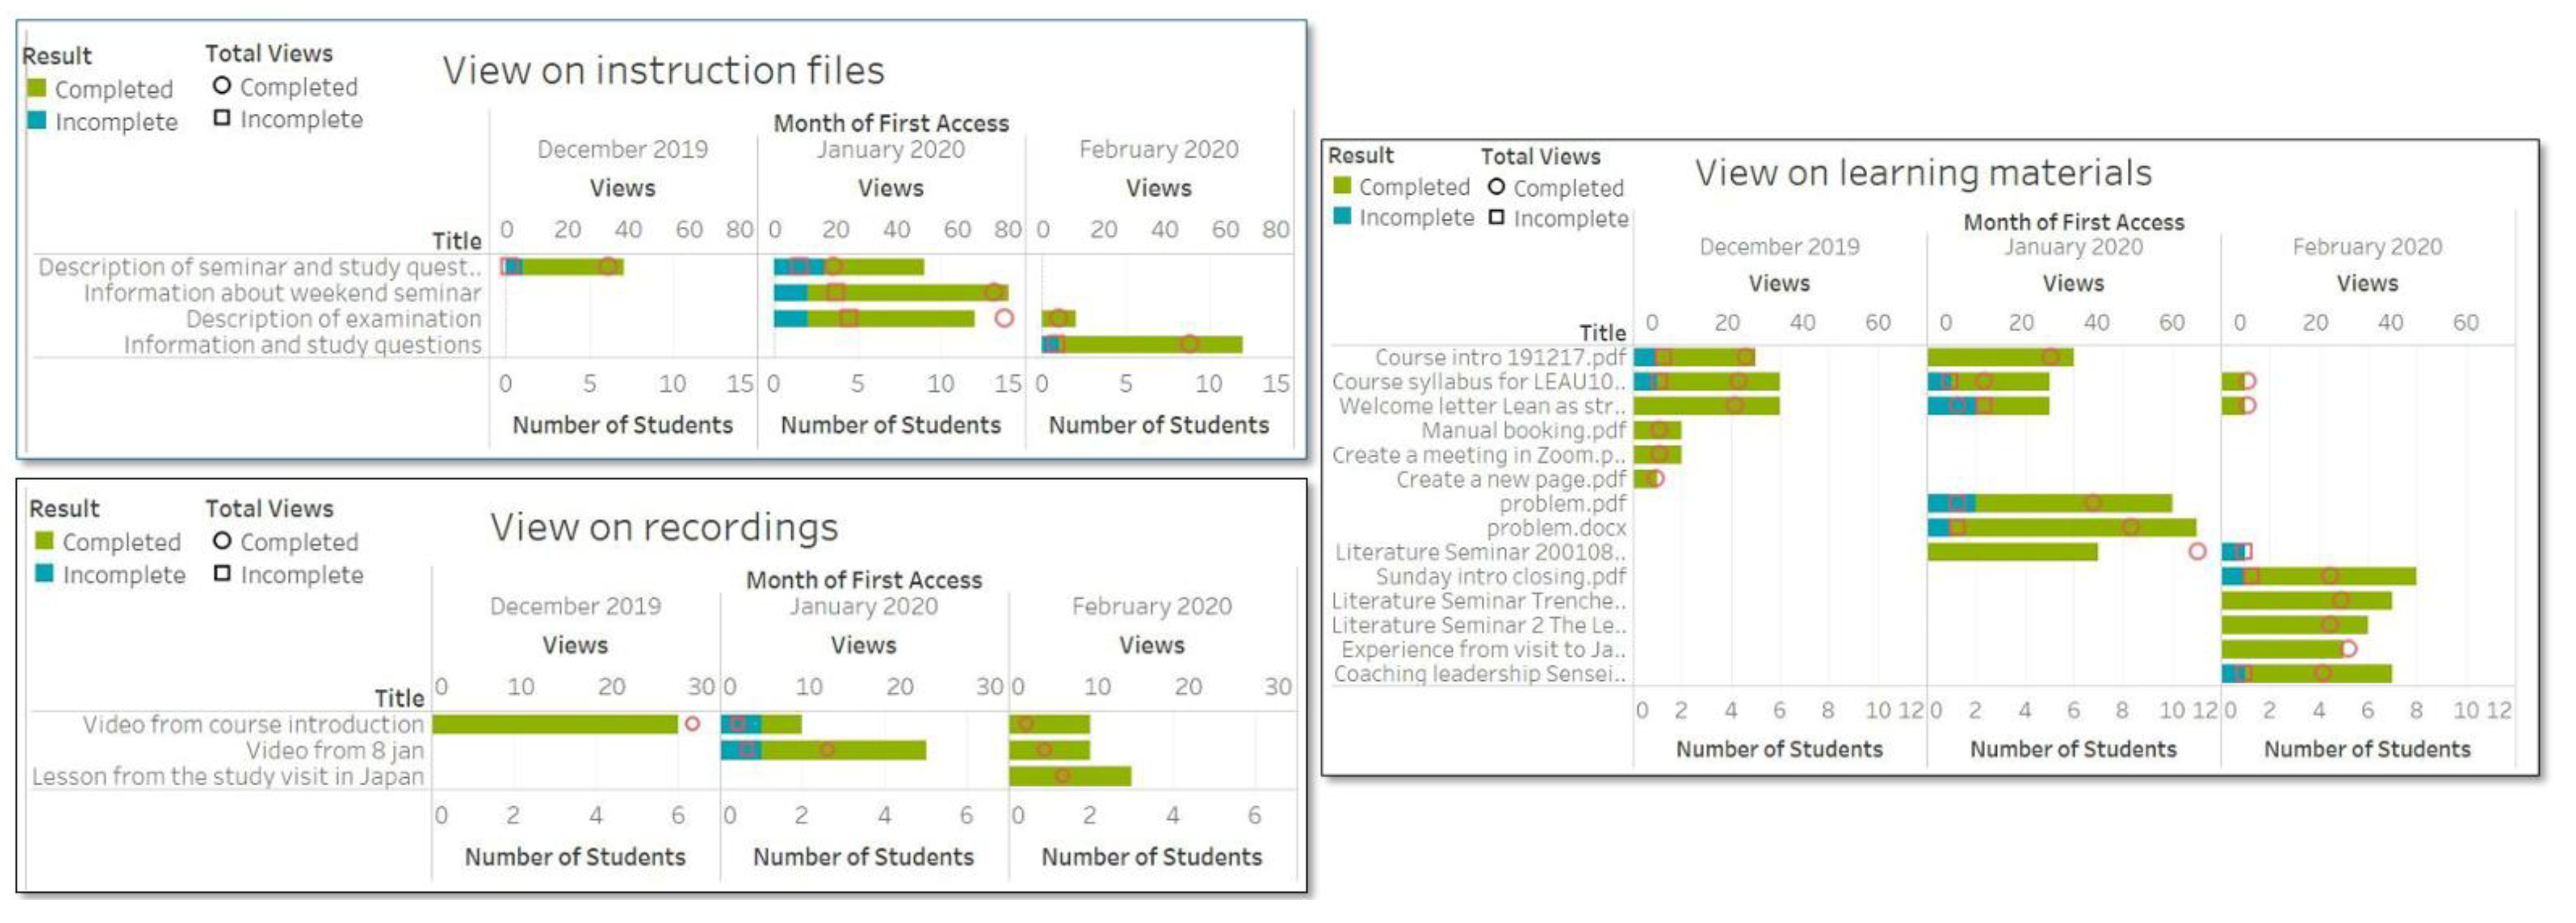
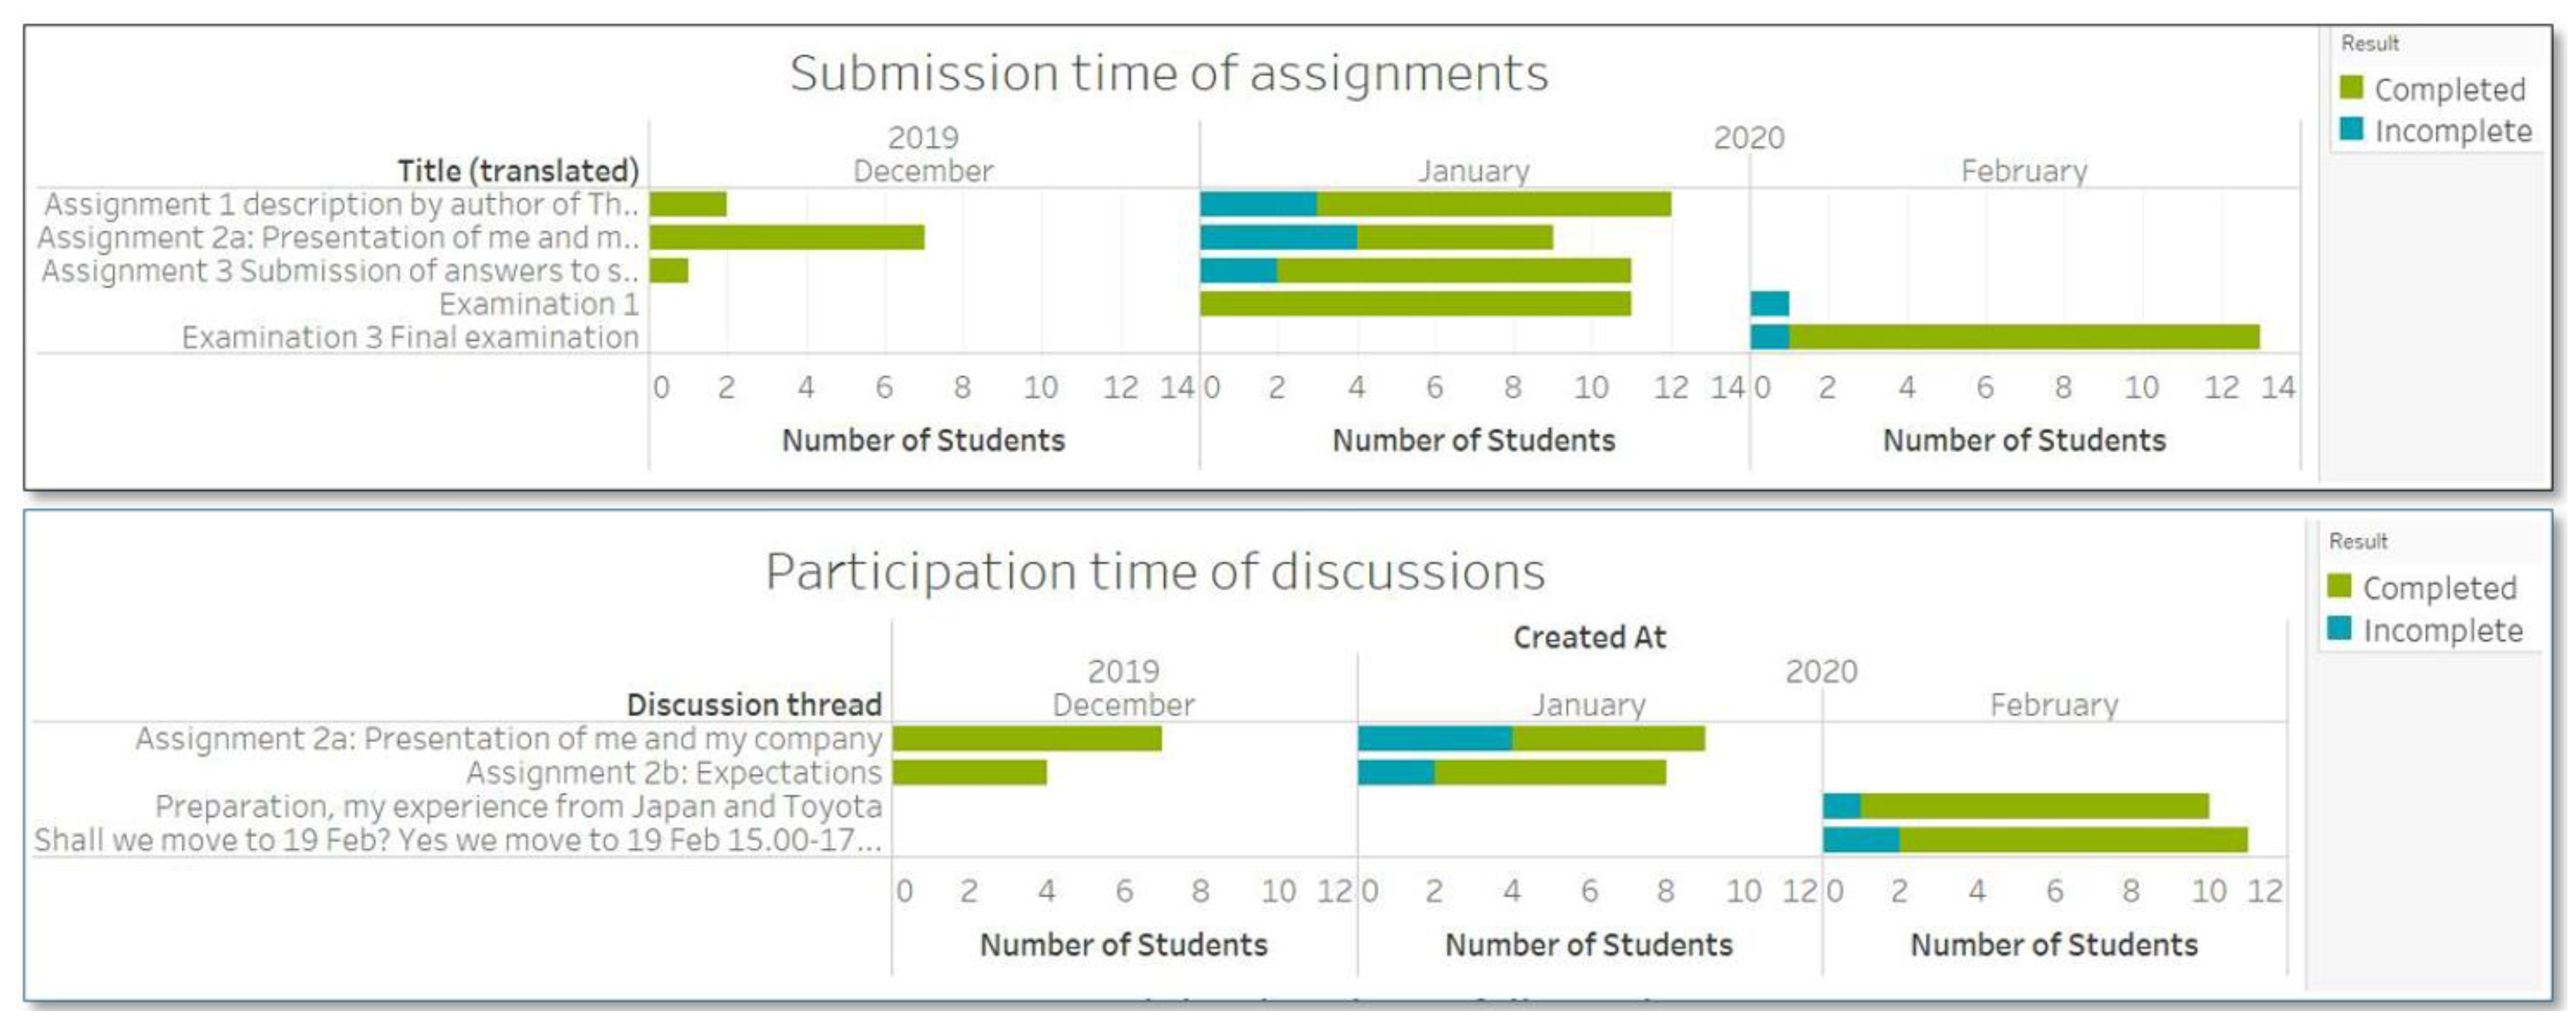
The interactions of EALs were analyzed in a few categories. Figure 3 alludes to the view activity of instruction files, recordings, and learning materials. Figure 4 summarizes the submission times of assignments and examinations as well as the participation times of discussions. Both of the figures divulged that the learners who completed the course have started interacting with Canvas (i.e., view resources and participate in discussions) earlier than those who did not finish the course.
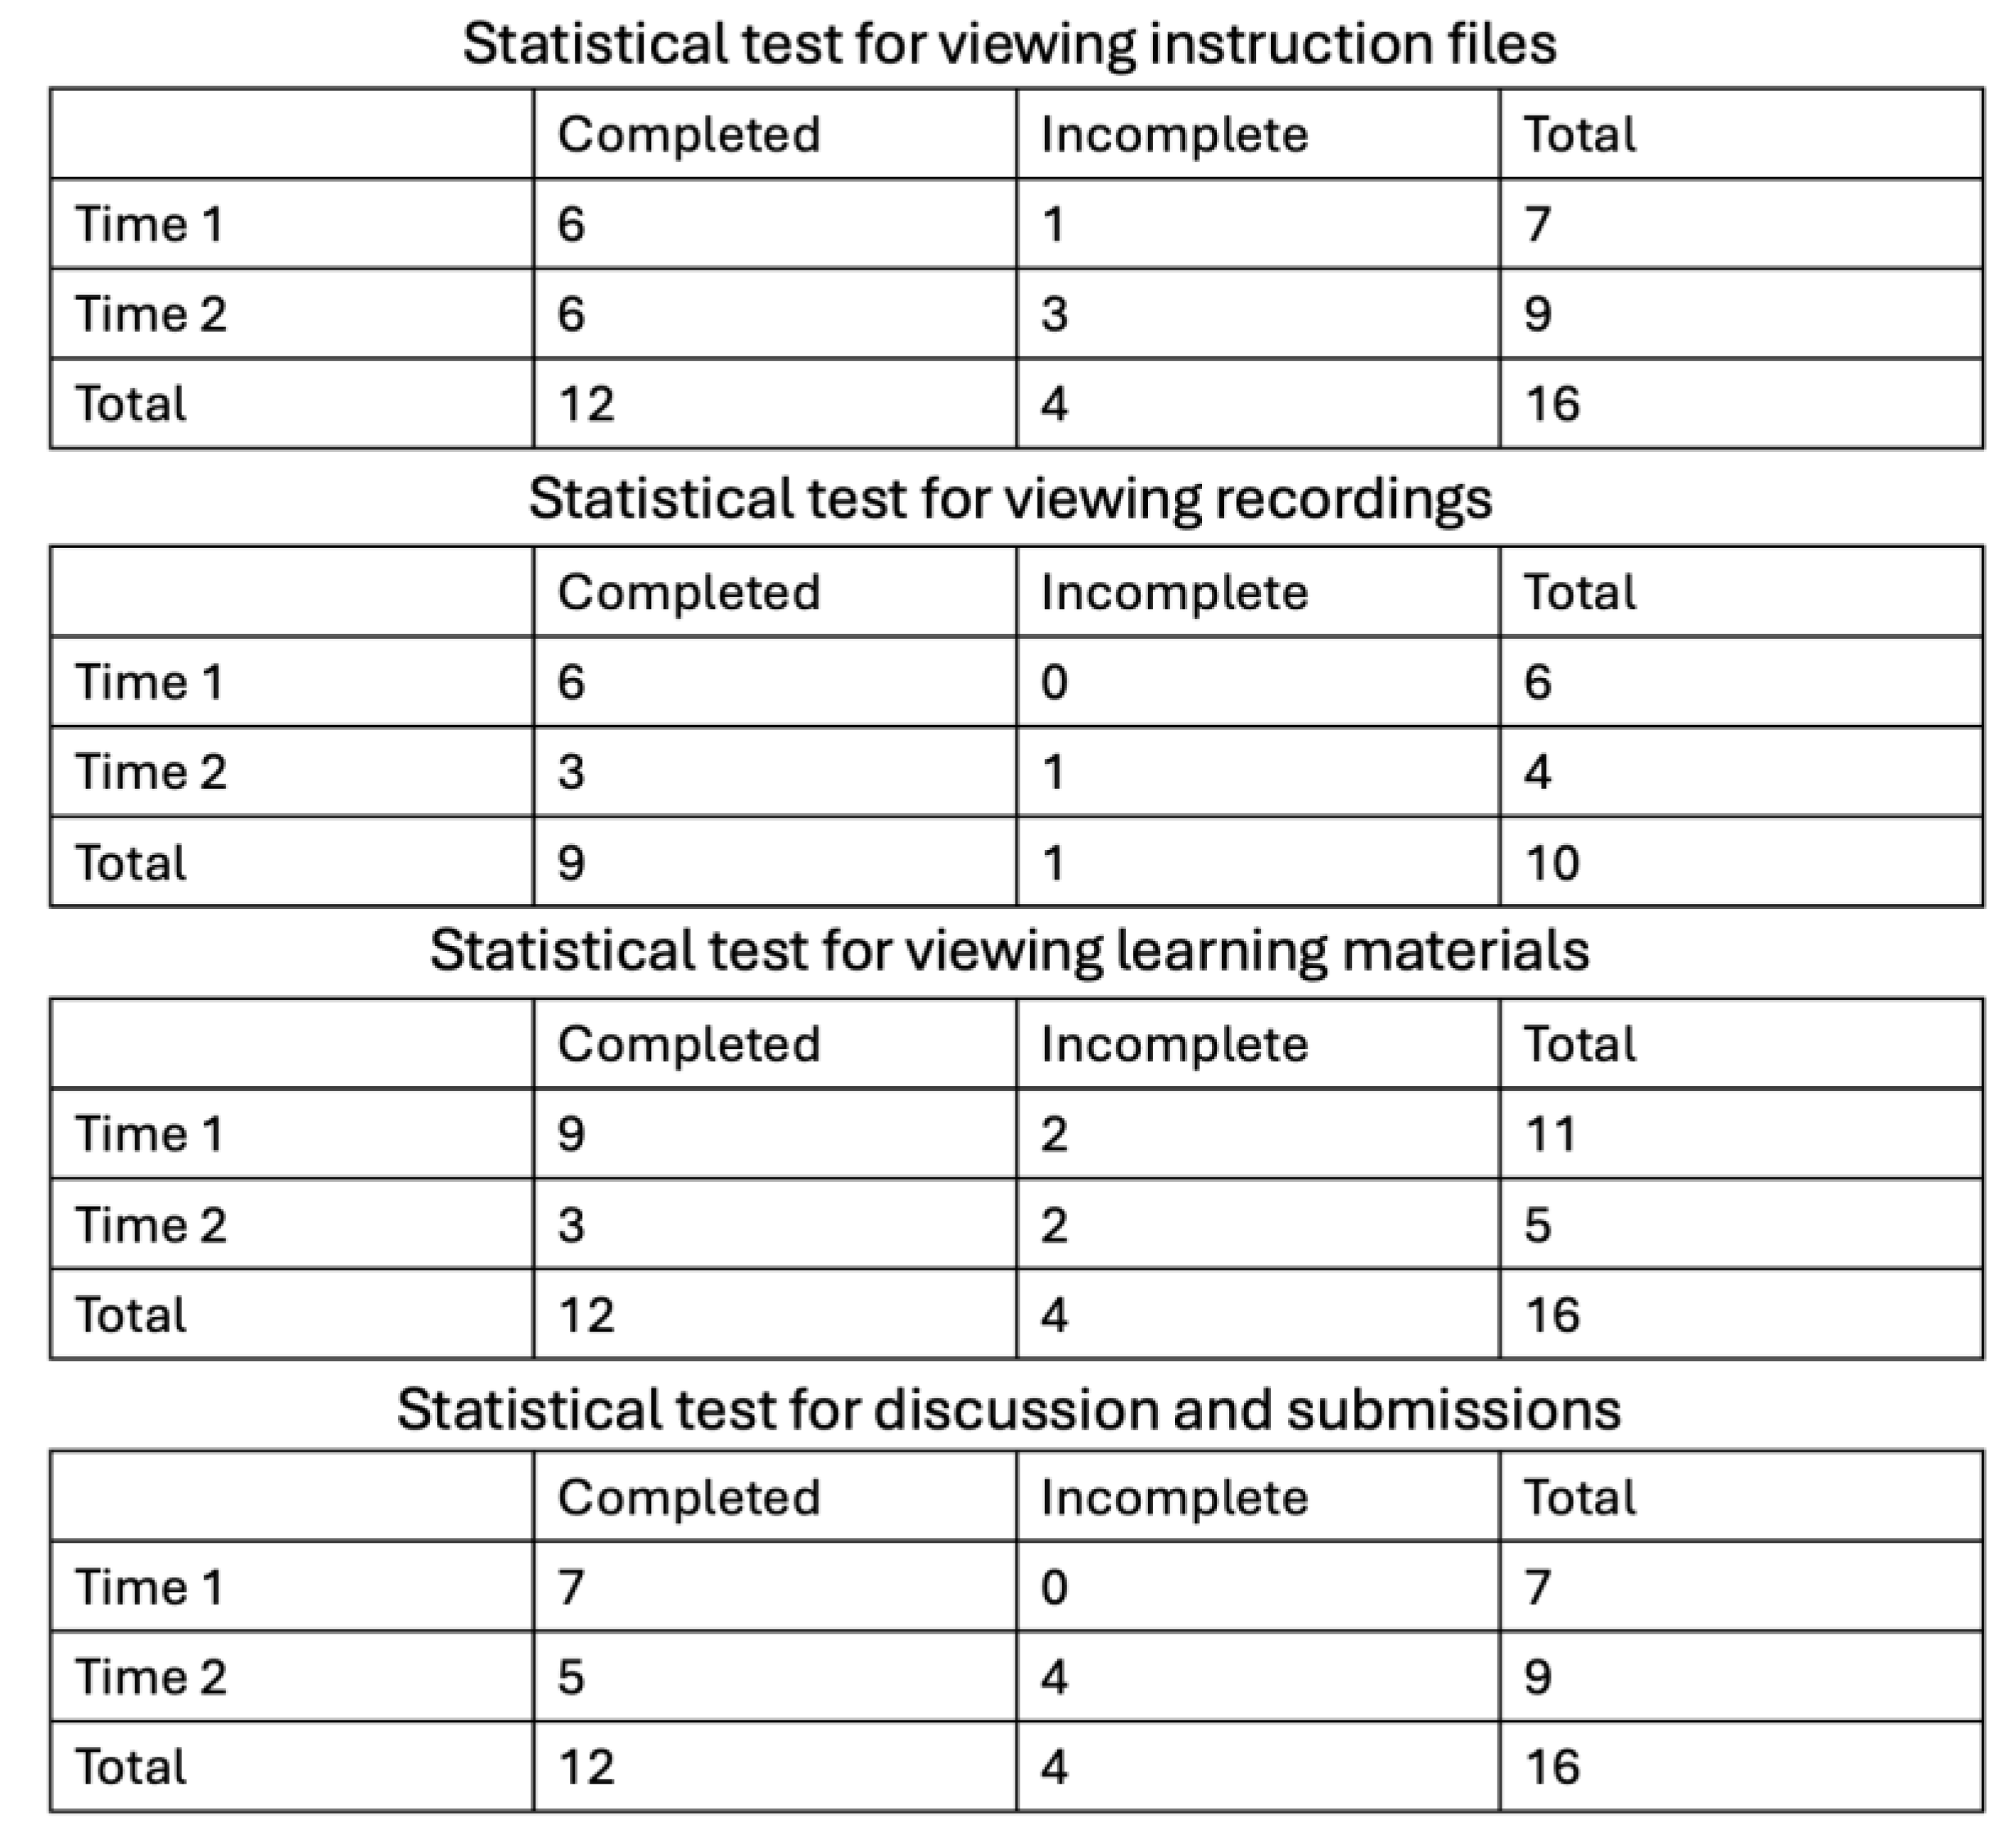
The statistical significance of the relations between the view activity (instruction files, recordings, and learning materials), participation in assignments and discussions, and course completion was tested using the Fisher exact test. Hence, the p-values (two-sided) for the Fisher exact tests in order in the tables in Figure 5 are 0.585, 0.4, 0.547, and 0.088. The null hypothesis for these statistical tests is that “there is no correlation between early engagement and course completion”. The tests for viewing instruction files, recordings, and learning materials showed statistically insignificant p-values (>0.1), while the test for engaging in the discussion threads and submissions generated a significant p-value (<0.1). The data visualization revealed the initial findings of the correlation between early engagement in various learning activities and course completion, whereas the statistics divulged one significant test amongst four tests.

4.2.3. Time Investment in Different Categories of Canvas and Course Completion

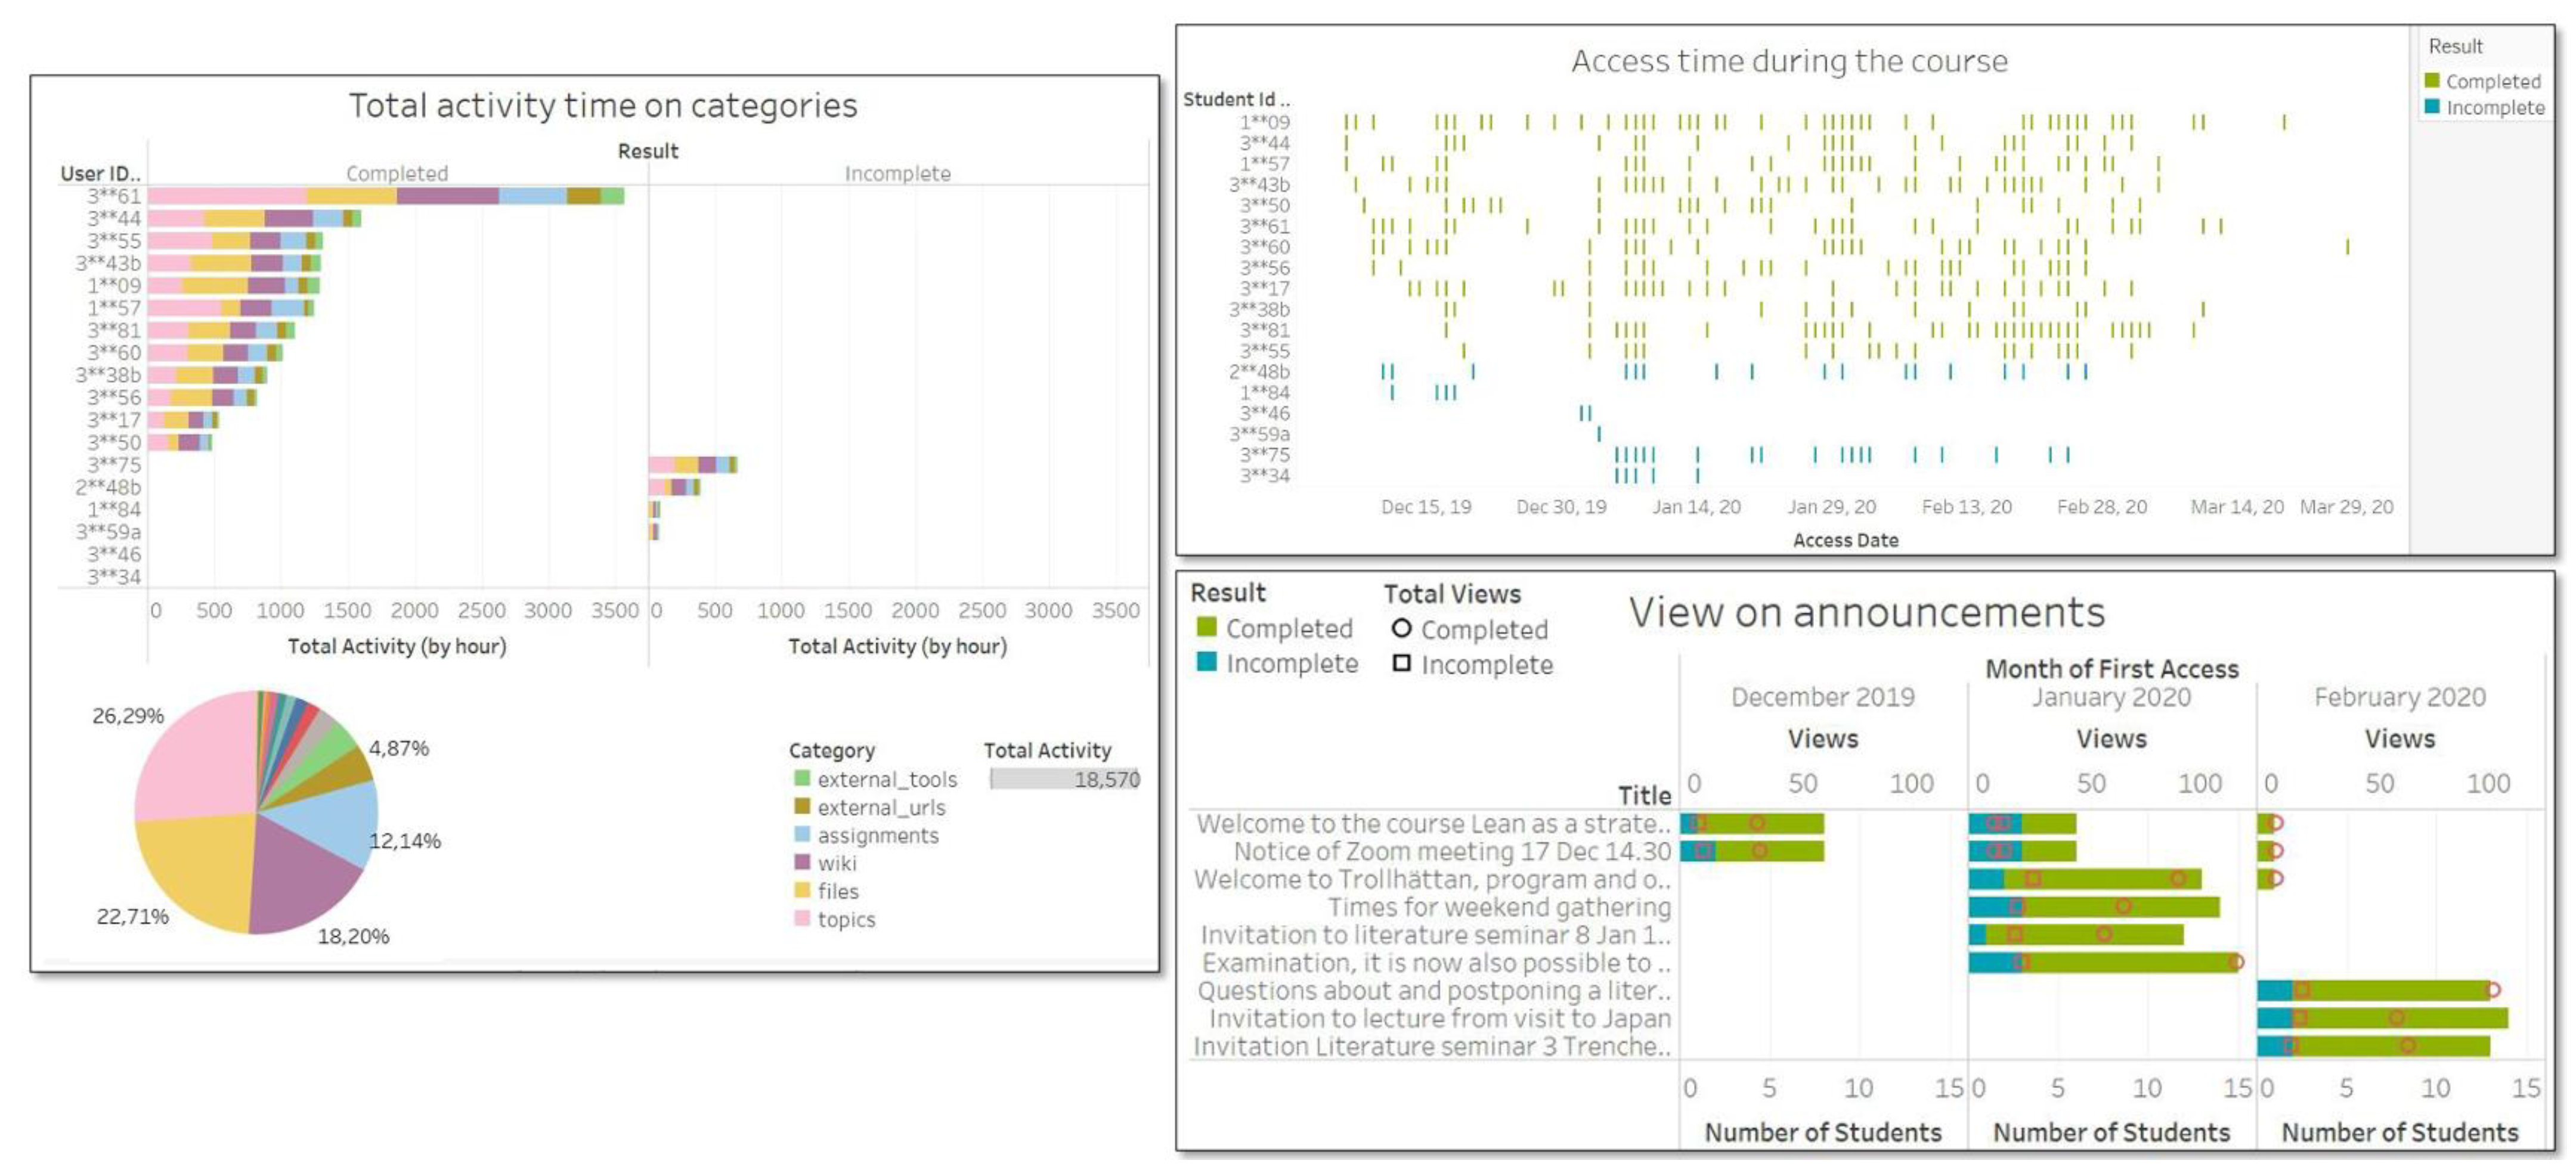
Figure 6 reveals that the EALs spent most of their learning time on Wiki, Topics, Files, and Assignments. These categories showed that EALs focused primarily on grasping the information and knowledge from the learning materials, assignments, announcements, and discussion threads. Moreover, the learners completing the course spent a significant amount of time on their studies or interacting with the learning platform. Two learners in the group of learners who did not finish the course had the same overall activity time as the learners who completed the course, while the rest spent no time or much less time studying than the group that completed the course. There is one outlier, which is student 3**61 with a substantial amount of activity time. Due to these exceptional cases, the connection between time investment in different categories of Canvas and course completion is relatively loose and cannot certainly be concluded.

4.2.4. Access Frequency and Course Completion

Figure 6 presents the points of time at which each learner accessed the course page. Each pipe is a determined point of time. The learners completing the course had a regular access pattern throughout the course, although there were time gaps in the timeline. Turning to the learners who did not complete the course, two cases had similar access patterns to the group completing the course, while the other cases logged in a couple of times at the beginning of the course and dropped out. Due to the two exceptional cases, the alignment between access frequency and course completion cannot be determined.

4.2.5. Addressing the Empirical Findings with the LD

If we only stop at showing the results of the data visualization and statistical tests, this empirical study runs into the drawback of small datasets shown by the SLR with weak findings. Thus, we continued to intertwine these LA findings with the LD; the results nonetheless highlight the observable pitfalls in the existing LD to raise awareness for the educator.
First, the number of students engaging in learning activities was average to small. Specifically, seven students viewed the materials for seminars (Figure 3), which is fewer than the thirteen students who viewed the announcements and the twelve students who participated in discussions (Figure 4 and Figure 6). Low engagement with viewing the learning materials shows the need for reviewing this activity for course reformation.
Figure 6 unveils some categories with low access. This may be an observation which needs to be considered during the course reformation. The visualizations, followed by the tests of significance, yielded insights into the moderate-to-low engagement of the learners in the course. The learners with identifiers 1**84, 3**34, 3**46, and 3**59a accessed the course page a couple of times at the beginning (Figure 6). Given that the course activities were performed in an online setting, the access data show that these learners looked through the course at the beginning and then dropped out. In Figure 5, compared to the number of learners in the courses, the number of recording views was low. The disposition is similar for views on materials and engagement in discussions and assignments. There were a considerable number of learners in both groups who did not participate in the elective discussions and assignments or view the learning materials. There were time gaps throughout the course. These observations show that the level of engagement in the course needs to be leveraged.
Furthermore, one significant statistical test also draws attention towards the correlation between early engagement in discussions and assignments and course completion. This would be a good insight for the educator to consider strengthening and encouraging early engagement in learning activities.
From these interpretations, it is noticeable that the LA results provide educators with insights into what has happened in their courses, thereby raising awareness for educators and facilitating possible intervention. To understand further why a specific student behaves in particular ways, it is necessary to have more applicable and available data for analysis, which leads to the need for redesigning the current LD. This aspect is considered for future research.

5. Discussions

5.1. RQ2: Do the Observed Learning Analytics Provisions Work in Actual Small-Scale Courses?

Among the findings from the SLR, we selected the appropriate methods for the empirical study based on the case context and the available datasets. The selected methods included combinations of data and LA methods [21] through a mixed method of understanding LD, visualizations, and statistical tests, trialing with different aspects of the same dataset [28] embodied through the various visualizations, and choosing a p-value of 0.1 for significance tests [34]. We used one more method, the Fisher exact test, for small datasets in our empirical study, which was not reported in the SLR.
Although the empirical findings were not comprehensive enough to make impactful generalizations from this study, addressing the empirical findings based on the LD and the theories of EALs’ learning provides insightful views of learners’ behaviors to the educator and evidence of the effectiveness of combining LA, LD, and learning theories. The method of combining LA, LD, and learning theories is not found in the SLR outcomes as a solution for small datasets but is considered for future work in several papers. Furthermore, Fancsali [10] and Siemens and Baker [11] extrapolated the use of established theories or remarkable experience in educational contexts as the basis for selecting data dimensions. This case study proved the inverse, using theories and experience to understand the meanings of the LA results.
The combinations of data and LA methods and trialing with different aspects of the same dataset were achieved in this case through various data dimensions and two data sources, followed by a combination of visualizations and statistical tests. The outcomes showed possibilities for obtaining a deeper understanding and assessment of this case through multi-faceted perspectives. We synthesized our results from multiple perspectives to reach the conclusion of moderate-to-low engagement in the course. Additionally, the Fisher exact test and the p-value of 0.1 helped explore one significant statistical test from this small dataset, which would not have been found if the p-value was 0.05 as usual.
The selected LA methods were effective in our authentic case study by revealing understandings of learners’ behaviors and measuring the quality of the LD in this course. Insightful perspectives were raised to drive the educator to make the necessary changes in the LD. Therefore, these methods can be applied to similar courses with a similar number of learners.

5.2. What Works and What Does Not Work

The SLR consolidated the issue of LA with small datasets in various educational contexts from kindergarten to master’s level and in organizations, whereas the empirical study showed the impact of this issue in the context of HEIs. For meaningful LA applications on small datasets, one analytical aspect is not enough to provide any insights but needs an aggregation of multiple analytical aspects. This case study systematically summarized the issues regarding the applicability of the results from the SLR. Once the LA results are interpreted together with the LD and the learning theories, educators can use the results as advice to improve their courses and support learners. While the SLR reveals that results from small datasets are often unreliable, the empirical study shows that weak results with multiple insightful analytical angles still lead to sufficient and efficient insights which are used as advice or recommendations. In this way, small datasets are able to provide useful insights to improve learning and teaching.
The SLR disclosed several prediction models based on small datasets, but the accuracy of these models was not high enough to be applied in reality. Prediction algorithms typically require big data to train and test models; thus, small datasets have limitations unless there is additional information supplementing the model outcomes. On one hand, pre-training with larger datasets can solve this [27]. On the other hand, the limitations of small datasets can be fulfilled by MMLA approaches. MMLA focuses on an aggregation of multiple techniques, such as gesture sensing, cameras, bio-sensors, or eye tracking, that capture all human activities. MMLA contributes to a deeper understanding of complex learning processes [3]. Multiple data dimensions and perspectives recommended as solutions for small datasets provide various angles of the complex learning process to allow educators to perform a comprehensive assessment. This empirical study applied heterogeneous analytical perspectives which create rich insights to come to an overarching assessment of EALs’ learning patterns and LD effectiveness. In this way, the SLR findings are helpful as these research designs, such as multi-methods, mixed methods, simulations with qualitative data, experiments, or games, offer different ways to approach and capture complex learning trajectories. However, we could not apply MMLA in this case study due to the lack of tracking of physical behaviors or cognitive/emotional states.

6. Conclusions

As small-scale courses and the need for using analytics for these courses in HEIs have been increasing, this paper explores the current state of the art of analytics methods on small datasets by conducting an SLR in the LA field followed by examining the observed LA methods in a case study of a small-scale course for EALs. The results showed the LA techniques and methods which have potential to process small datasets and create sufficient and insightful results. The results are viewed as advice for improving teaching and learning. We envision that this research can support LA researchers in handling small datasets, thus contributing to bridging the gap on how to apply LA to small datasets. Due to the limitation of the available data constrained by the LD of this studied course, only the learning activities that can be measured by data and the applicable observed methods from the SLR are utilized in this paper.

6.1. Implications for Research

The number of papers returned from the SLR showed that LA applications for small datasets have not been sufficiently looked into by the LA community. Currently, many HEIs have courses with a small number of learners, such as courses for EALs, courses for specialized master’s programs, or courses for under-represented students. These groups of learners with specific characteristics usually have a complex learning process. The need for more empirical evidence to examine the verified possibilities of LA for small datasets is utterly necessary.
Each EAL is a complex entity. Many EALs form a complex cohort with interactions and dynamics among individuals which cannot be reduced to any single learner in the cohort [9]. Through this study, we present a way to understand the complex learning trajectories of EALs by gathering analyses of simple and single learning activities such as viewing learning materials, participating in discussions and assignments, or accessing the course page. Simultaneously, LA researchers may need to understand EALs from multiple perspectives rather than applying traditional and single LA techniques. When a small amount of data is considered as a weakness of LA algorithms and methods, other factors are necessarily counterbalanced, which is the purpose of using multiple analytical perspectives to enrich and broaden vision from small datasets.
The findings also revealed a noticeable preference for using MMLA. A relevant question is if MMLA fits small datasets better. This, however, needs more studies to be probed.
A notable issue is that the LA cycle is rarely completed in the studies considered for the SLR, i.e., the studies are limited by the validation of the models for improved learning. Most of the papers in this SLR stopped at the step of analyzing data or building models without moving forward to interventions premised on the LA results. This may also be the reason why we were unable to further assess the goodness of the models generated from small datasets in practice.

6.2. Implications for Practice

Small data result in dilemmas such as reliability of results, validity of models, and limitations with the study outcomes that only focused on analysis and conclusions without verification of the models’ effectiveness. Nevertheless, our empirical study showed that this issue can be resolved by combining with qualitative data such as the LD, the insights and experiences of educators, and supplementary theories for not only selecting data dimensions and analytical directions but also interpreting and understanding the LA results afterward. The empirical study also showed that heterogeneous and varied analytical insights increase the validity of the results from small data. MMLA applies a similar approach to achieve holistic insights into issues when analyzing multiple kinds of data. However, as with most data mining applications, the results generated are considered as advice or recommendations rather than final decisions. When it comes to final decisions, it needs human judgement and human intervention.
Despite the inherent limitations of small datasets and the debates around this topic, this study investigated possible LA solutions from the SLR and proved the effectiveness of some solutions in the empirical study. We want to illuminate the possibilities of LA solutions for small datasets due to an increasing need for using LA in small-scale courses in HEIs to support educators in improving teaching and learning. Due to the limitations of the LD, which led to the limitations of the dataset, we could not analyze further than what could be explored from the inherent dataset. For future research, the alignment of LD and LA should be considered for course (re)design to enrich datasets and generate more insightful results. Additionally, this empirical study examined EALs’ learning when the course was finished. As mentioned in the introduction, real-time process-oriented support can be useful for supporting EALs’ complex learning. This should be considered for future study.

Author Contributions

Conceptualization, N.B.C.N. and T.K.; methodology, N.B.C.N.; software, N.B.C.N.; validation, N.B.C.N.; formal analysis, N.B.C.N.; writing original draft preparation, N.B.C.N.; writing-review and editing: N.B.C.N. and T.K.; visualization, N.B.C.N.; supervision, T.K. All authors have read and agreed to the published version of the manuscript.

Funding

This research received no external funding.

Conflicts of Interest

The authors declare no conflict of interest.

References

  1. Bodily, R.; Verbert, K. Trends and issues in student-facing learning analytics reporting systems research. In Proceedings of the Seventh International Learning Analytics & Knowledge Conference, Vancouver, BC, Canada, 13–17 March 2017; pp. 309–318. [Google Scholar]
  2. SoLAR. What is Learning Analytics? Available online: https://www.solaresearch.org/about/what-is-learning-analytics/ (accessed on 10 July 2022).
  3. Yan, L.; Zhao, L.; Gasevic, D.; Martinez-Maldonado, R. Scalability, sustainability, and ethicality of multimodal learning analytics. In Proceedings of the LAK22: 12th International Learning Analytics and Knowledge Conference, Online, USA, 21–25 March 2022; pp. 13–23. [Google Scholar]
  4. Kitto, K.; Lupton, M.; Davis, K.; Waters, Z. Incorporating student-facing learning analytics into pedagogical practice. In Proceedings of the 33rd International Conference of Innovation, Practice and Research in the Use of Educational Technologies in Tertiary Education (ASCILITE 2016), Adelaide, Australia, 28–30 November 2016; Australasian Society for Computers in Learning in Tertiary Education (ASCILITE): Tugun, Australia, 2016; pp. 338–347. [Google Scholar]
  5. Barab, S.A.; Hay, K.E.; Yamagata-Lynch, L.C. Constructing networks of action-relevant episodes: An in situ research methodology. J. Learn. Sci. 2001, 10, 63–112. [Google Scholar] [CrossRef]
  6. Hefler, G.; Markowitsch, J. Formal adult learning and working in Europe: A new typology of participation patterns. J. Workplace Learn. 2010, 22, 79–93. [Google Scholar] [CrossRef]
  7. Kumar, V.S.; Gress, C.L.; Hadwin, A.F.; Winne, P.H. Assessing process in CSCL: An ontological approach. Comput. Hum. Behav. 2010, 26, 825–834. [Google Scholar] [CrossRef]
  8. Hmelo-Silver, C.E.; Jordan, R.; Liu, L.; Chernobilsky, E. Representational tools for understanding complex computer-supported collaborative learning environments. In Analyzing Interactions in CSCL: Methods, Approaches and Issues; Springer: Berlin/Heidelberg, Germany, 2010; pp. 83–106. [Google Scholar]
  9. Goggins, S.P.; Xing, W.; Chen, X.; Chen, B.; Wadholm, B. Learning Analytics at” Small” Scale: Exploring a Complexity-Grounded Model for Assessment Automation. J. Univers. Comput. Sci. 2015, 21, 66–92. [Google Scholar]
  10. Fancsali, S.E. Variable construction for predictive and causal modeling of online education data. In Proceedings of the 1st International Conference on Learning Analytics and Knowledge, Banff, AB, Canada, 27 February–1 March 2011; pp. 54–63. [Google Scholar]
  11. Siemens, G.; Baker, R.S.D. Learning analytics and educational data mining: Towards communication and collaboration. In Proceedings of the 2nd International Conference on Learning Analytics and Knowledge, Vancouver, BC, Canada, 29 April–2 May 2012; pp. 252–254. [Google Scholar]
  12. Tair, M.M.A.; El-Halees, A.M. Mining educational data to improve students’ performance: A case study. Int. J. Inf. 2012, 2, 140–146. [Google Scholar]
  13. Hellas, A.; Ihantola, P.; Petersen, A.; Ajanovski, V.V.; Gutica, M.; Hynninen, T.; Knutas, A.; Leinonen, J.; Messom, C.; Liao, S.N. Predicting academic performance: A systematic literature review. In Proceedings of the Companion of the 23rd Annual ACM Conference on Innovation and Technology in Computer Science Education, Larnaca, Cyprus, 2–4 July 2018; pp. 175–199. [Google Scholar]
  14. Almeda, M.V.; Scupelli, P.; Baker, R.S.; Weber, M.; Fisher, A. Clustering of design decisions in classroom visual displays. In Proceedings of the Fourth International Conference on Learning Analytics and Knowledge, Indianapolis, IN, USA, 24–28 March 2014; pp. 44–48. [Google Scholar]
  15. Yan, L.; Martinez-Maldonado, R.; Zhao, L.; Deppeler, J.; Corrigan, D.; Gasevic, D. How do teachers use open learning spaces? Mapping from teachers’ socio-spatial data to spatial pedagogy. In Proceedings of the LAK22: 12th International Learning Analytics and Knowledge Conference, Online, 21–25 March 2022; pp. 87–97. [Google Scholar]
  16. MacKinnon-Slaney, F. The adult persistence in learning model: A road map to counseling services for adult learners. J. Couns. Dev. 1994, 72, 268–275. [Google Scholar] [CrossRef]
  17. Li, K.-C.; Wong, B.T.-M. Trends of learning analytics in STE (A) M education: A review of case studies. Interact. Technol. Smart Educ. 2020, 17, 323–335. [Google Scholar] [CrossRef]
  18. Andrade, A. Understanding student learning trajectories using multimodal learning analytics within an embodied-interaction learning environment. In Proceedings of the Seventh International Learning Analytics & Knowledge Conference, Vancouver, BC, Canada, 13–17 March 2017; pp. 70–79. [Google Scholar]
  19. Chua, Y.H.V.; Dauwels, J.; Tan, S.C. Technologies for automated analysis of co-located, real-life, physical learning spaces: Where are we now? In Proceedings of the 9th International Conference on Learning Analytics & Knowledge, Tempe, AZ, USA, 4–8 March 2019; pp. 11–20. [Google Scholar]
  20. Caprotti, O. Shapes of educational data in an online calculus course. J. Learn. Anal. 2017, 4, 76–90. [Google Scholar] [CrossRef]
  21. Van Goidsenhoven, S.; Bogdanova, D.; Deeva, G.; Broucke, S.V.; De Weerdt, J.; Snoeck, M. Predicting student success in a blended learning environment. In Proceedings of the Tenth International Conference on Learning Analytics & Knowledge, Frankfurt, Germany, 23–27 March 2020; pp. 17–25. [Google Scholar]
  22. Nguyen, N.B.C. Improving Online Learning Design for Employed Adult Learners. Eur. Conf. e-Learn. 2022, 21, 302–309. [Google Scholar] [CrossRef]
  23. Arrow, H.; McGrath, J.E.; Berdahl, J.L. Small Groups as Complex Systems: Formation, Coordination, Development, and Adaptation; Sage Publications: Thousand Oaks, CA, USA, 2000. [Google Scholar]
  24. Sarkis-Onofre, R.; Catalá-López, F.; Aromataris, E.; Lockwood, C. How to properly use the PRISMA Statement. Syst. Rev. 2021, 10, 117. [Google Scholar] [CrossRef]
  25. Glenn, J.C. The Futures Wheel. In Futures Research Methodology—Version 3; The Millennium Project: Washington, DC, USA, 2009; p. 19. [Google Scholar]
  26. Kim, H.-Y. Statistical notes for clinical researchers: Sample size calculation 2. Comparison of two independent proportions. Restor. Dent. Endod. 2016, 41, 154–156. [Google Scholar] [CrossRef]
  27. Lämsä, J.; Uribe, P.; Jiménez, A.; Caballero, D.; Hämäläinen, R.; Araya, R. Deep networks for collaboration analytics: Promoting automatic analysis of face-to-face interaction in the context of inquiry-based learning. J. Learn. Anal. 2021, 8, 113–125. [Google Scholar] [CrossRef]
  28. Gibson, A.; Kitto, K. Analysing reflective text for learning analytics: An approach using anomaly recontextualization. In Proceedings of the Fifth International Conference on Learning Analytics and Knowledge, Poughkeepsie, NY, USA, 16–20 March 2015; pp. 275–279. [Google Scholar]
  29. Scherer, S.; Weibel, N.; Morency, L.-P.; Oviatt, S. Multimodal prediction of expertise and leadership in learning groups. In Proceedings of the 1st International Workshop on Multimodal Learning Analytics, Santa Monica, CA, USA, 26 October 2012; pp. 1–8. [Google Scholar]
  30. Beheshitha, S.S.; Gašević, D.; Hatala, M. A process mining approach to linking the study of aptitude and event facets of self-regulated learning. In Proceedings of the Fifth International Conference on Learning Analytics and Knowledge, Poughkeepsie, NY, USA, 16–20 March 2015; pp. 265–269. [Google Scholar]
  31. Horn, B.; Hoover, A.K.; Barnes, J.; Folajimi, Y.; Smith, G.; Harteveld, C. Opening the black box of play: Strategy analysis of an educational game. In Proceedings of the 2016 Annual Symposium on Computer-Human Interaction in Play, Austin, TX, USA, 16–19 October 2016; pp. 142–153. [Google Scholar]
  32. Mangaroska, K.; Vesin, B.; Giannakos, M. Cross-platform analytics: A step towards personalization and adaptation in education. In Proceedings of the 9th International Conference on Learning Analytics & Knowledge, Tempe, AZ, USA, 4–8 March 2019; pp. 71–75. [Google Scholar]
  33. Barz, M.; Altmeyer, K.; Malone, S.; Lauer, L.; Sonntag, D. Digital pen features predict task difficulty and user performance of cognitive tests. In Proceedings of the 28th ACM Conference on User Modeling, Adaptation and Personalization, Online, 12–18 July 2020; pp. 23–32. [Google Scholar]
  34. Abdi, S.; Khosravi, H.; Sadiq, S.; Gasevic, D. Complementing educational recommender systems with open learner models. In Proceedings of the Tenth International Conference on Learning Analytics & Knowledge, Frankfurt, Germany, 23–27 March 2020; pp. 360–365. [Google Scholar]
  35. Lu, W.; He, H.; Urban, A.; Griffin, J. What the Eyes Can Tell: Analyzing Visual Attention with an Educational Video Game. In Proceedings of the 2021 ACM Symposium on Eye Tracking Research and Applications, Virtual Event, 25–27 March 2021; pp. 1–7. [Google Scholar]
  36. Roijers, D.M.; Jeuring, J.; Feelders, A. Probability estimation and a competence model for rule based e-tutoring systems. In Proceedings of the 2nd International Conference on Learning Analytics and Knowledge, Vancouver, BC, Canada, 29 April–2 May 2012; pp. 255–258. [Google Scholar]
  37. Raca, M.; Tormey, R.; Dillenbourg, P. Sleepers’ lag-study on motion and attention. In Proceedings of the Fourth International Conference on Learning Analytics and Knowledge, Indianapolis, IN, USA, 24–28 March 2014; pp. 36–43. [Google Scholar]
  38. Mansouri, T.; ZareRavasan, A.; Ashrafi, A. A learning fuzzy cognitive map (LFCM) approach to predict student performance. J. Inf. Technol. Educ. Res. 2021, 20, 221–243. [Google Scholar] [CrossRef]
  39. Oviatt, S. Problem solving, domain expertise and learning: Ground-truth performance results for math data corpus. In Proceedings of the 15th ACM on International Conference on Multimodal Interaction, Sydney, Australia, 9–13 December 2013; pp. 569–574. [Google Scholar]
  40. Peffer, M.E.; Kyle, K. Assessment of language in authentic science inquiry reveals putative differences in epistemology. In Proceedings of the Seventh International Learning Analytics & Knowledge Conference, Vancouver, BC, Canada, 13–17 March 2017; pp. 138–142. [Google Scholar]
  41. Diederich, M.; Kang, J.; Kim, T.; Lindgren, R. Developing an in-application shared view metric to capture collaborative learning in a multi-platform astronomy simulation. In Proceedings of the LAK21: 11th International Learning Analytics and Knowledge Conference, Irvine, CA, USA, 12–16 April 2021; pp. 173–183. [Google Scholar]
  42. Lazem, S.; Jad, H.A. We play we learn: Exploring the value of digital educational games in Rural Egypt. In Proceedings of the 2017 CHI Conference on Human Factors in Computing Systems, Denver, CO, USA, 6–11 May 2017; pp. 2782–2791. [Google Scholar]
  43. Martin, T.; Aghababyan, A.; Pfaffman, J.; Olsen, J.; Baker, S.; Janisiewicz, P.; Phillips, R.; Smith, C.P. Nanogenetic learning analytics: Illuminating student learning pathways in an online fraction game. In Proceedings of the Third International Conference on Learning Analytics and Knowledge, Leuven, Belgium, 8–13 April 2013; pp. 165–169. [Google Scholar]
  44. Hartmann, C.; Rummel, N.; Bannert, M. Using HeuristicsMiner to Analyze Problem-Solving Processes: Exemplary Use Case of a Productive-Failure Study. J. Learn. Anal. 2022, 9, 66–86. [Google Scholar] [CrossRef]
  45. Shen, W.; Zhan, Z.; Li, C.; Chen, H.; Shen, R. Constructing Behavioral Representation of Computational Thinking based on Event Graph: A new approach for learning analytics. In Proceedings of the 6th International Conference on Education and Multimedia Technology, Guangzhou, China, 13–15 July 2022; pp. 45–52. [Google Scholar]
Figure 1. PRISMA flow diagram of the screening and selection.
Education 14 00608 g001
Figure 2. The Futures Wheel of LA and small datasets from the SLR findings.
Education 14 00608 g002
Figure 3. View activity.
Education 14 00608 g003
Figure 4. Participation time of assignments and discussions.
Education 14 00608 g004
Figure 5. Statistical data.
Education 14 00608 g005
Figure 6. Total activity time on categories—Access time during the course—Viewing announcements.
Education 14 00608 g006
Table 1. Details of SLR.
DatabasesSearch QueriesInclusion CriteriaResults
ACM Digital Library(“teaching analytics” OR “learning analytics”) AND (“small data” OR “small sample”)Between 2012 and 2022, short papers, research articles, journal papers92
SCOPUSBetween 2012 and 2023, conference and journal papers18
Journal of Learning Analytics“small data”Entire database2
“small sample”3
Total115
Table 2. Summary of implementation methods.
ImplementationsNumber of Papers
Simulation3
Mixed-method3
Multi-method1
MMLA9
Common LA9
Game4
Experiment/Quasi-experiment4
Table 3. A synthesis of the LA methods and algorithms used for small datasets.
Implementation
Methods/Generic
Algorithms
Specific AlgorithmsFunctions/Applicability
MMLA Works in various levels of education and organizations, applied to multiple natural communication modalities
Text analysisTopic modelingExplores underlying topics from text data
Word-embedding modelAutomatic classification, should combine with deep networks for conversation analysis
Epistemic network analysisAssesses the quality of discourse in texts
Keyness analysisIdentifies significantly frequent linguistic words
ClusteringSet up hierarchical coding schemeIdentifies distinguished groups or patterns hidden in data
Design multifold learning activities
Use archetype clustering to support hierarchical clustering
Use agglomerative hierarchical clustering with Euclidian distance measure and Ward’s criterion
Statistical analysisSupplement significance tests with effect size measuresInvestigates relations between various measures or examines independent variables
Use the ϕ corr for regression and classification
Use 0.1 instead of 0.05 for statistical significance
Dunnett’s T3 test
Use a discrete set of parameter values and a combination of parameters with the highest likelihood
Nonparametric tests
Kendall’s correlation
PredictionLearning fuzzy cognitive mapPredicts student performance
Two-parameter logistic ogive function of item response theoryPredicts student behaviors in rule-based e-tutoring systems
Pre-training with large datasets
Process miningHeuristicsMinerFinds touchless learning flow or process paths
Microgenetic analysis
Fuzzy miner
Lag sequence analysis
Simulations
-
Combine interactions with the simulations and the reflections of participants
-
No restrictions on contexts, groups, data types, or fields
-
Require a good and circumspect research design covering the essential measurements with supported simulations
Game-based learning
-
No restrictions on certain subjects, data, or settings
-
Games need to be in line with learning objectives
(Quasi-)Experiments
-
Divide groups to act in various conditions to inspect the differences in the outcomes produced from different conditioned environments
-
Require a checking condition such as a skill, an artifact, or an intangible condition
Disclaimer/Publisher’s Note: The statements, opinions and data contained in all publications are solely those of the individual author(s) and contributor(s) and not of MDPI and/or the editor(s). MDPI and/or the editor(s) disclaim responsibility for any injury to people or property resulting from any ideas, methods, instructions or products referred to in the content.