Abstract
The face-to-face education system around the world unexpectedly collapsed in March 2020 due to the COVID-19 pandemic. The priority education process became remote education and activities related to self-study and self-education. This paper investigates how university students’ performance has been influenced by remote learning during the lockdown period. Academic performance is evaluated by measuring the time required to complete specific homework in statistical data processing. Comparisons of performance are made for before, during and after the pandemic period. This study examines a population of third-year university students majoring in Materials Science and Engineering. The students were asked to complete a specific homework requiring the processing and evaluation of random laboratory data using analytical software. The delivery times of the completed homework before, during and after the lockdown period are compared. It has been found that although the students had to spend more time on their task during the pandemic, their relative performance remained unchanged and was comparable to that of pre-pandemic. After the end of the lockdown period, an increase in academic performance was noted. Our results suggest that the sudden transition to remote education may have been beneficial for the long-term performance of a group of selected university students in data processing and evaluation. The findings support the idea that teachers and their institutions should be willing to use a variety of teaching methods. The inclusion of remote learning methods in university instruction is encouraged.
1. Introduction
In March 2020, the World Health Organization (WHO) declared a global pandemic [1]. As a result of the pandemic, on-site classes in schools were suspended [2]. Teaching suddenly turned to remote learning [3,4]. Due to the lockdown, teaching methods had to be quickly changed and adapted to remote education. Some teaching was also transformed into self-education that included the individual study of electronic materials. During online learning and self-learning, students were given the opportunity to progress in their education at their own pace, as they did not have to commute to school daily. Thus, education became more flexible in terms of place and time [5]. However, online learning also negatively impacted student performance, as they lacked a direct and immediate contact with their teacher. Many studies investigated the effects of remote education during the COVID-19 pandemic on students’ performance [6,7,8,9]. In general, academic performance was found to be negatively influenced by the lockdown [9]. In primary and secondary schools, teachers, students and their parents most often reported disorganization, motivation and behavioral changes as major influences on underperformance [10,11,12]. Fear of COVID-19 has been noted to be a major stressor in early 2020 [13]. Furthermore, the uncertainty associated with early exposure to COVID-19 was found to be a risk factor for anxiety and sleep disorders [11]. In terms of education, many students in middle- and low-income countries objectively suffered from the lack of technical equipment and the instability of the network connection required for home schooling [14,15,16,17]. They also lacked the e-learning skills necessary for remote education. As a result, the negative influences of isolation due to the COVID-19 pandemic have made self-learning more difficult. On a global scale, some students even failed to complete their studies for these objective reasons [18,19].
In university settings, the impact of remote education has been less straightforward. The impact of the COVID-19 pandemic on the academic performance of college students has been found to be ambiguous with negative and positive experiences reported in the scholarly literature [20]. Although some studies found that online education was superior to on-site education, other investigations reported no or very little difference in academic performance before and during the pandemic [21,22]. University students faced difficulties with respect to focus and concentration as much as primary and secondary school students. They also experienced the technical demands of distance education, such as the lack of suitable equipment and a stable network connection. However, they also reported positive effects of remote education including flexibility in time and place.
The academic performance and success of students has traditionally been evaluated using grades and test scores. However, during online teaching and remote education, students often need more time and concentrated effort to understand course materials and complete specific tasks. Therefore, time management skills are crucial to the individual’s learning progression [23]. Time management plays a critical role in student academic achievement and performance. A remarkable relationship between undergraduate students’ time management behavior and academic performance was found [24]. Effective time management leads to better academic achievements as it reduces stress levels and anxiety. Effective time management strategies include clear goal setting and priority definition. However, effective time management is only possible through self-motivation [23]. Remote education brings several new prospects, including greater flexibility and the possibility of self-education [5,25]. For example, the self-study of electronic materials allows students to progress individually. As such, it can help improving the motivation, creativity and responsibility. These soft skills are important for the future career prospects of university undergraduates. As most universities have now transitioned back to in-person education, there is a great opportunity to investigate the long-term impacts of remote education during the COVID-19 pandemic on the academic achievements of students.
This article aims to compare the pre-pandemic, pandemic and post-pandemic performance of university students in laboratory data processing and visualization. Most previous studies have discussed the impact of remote learning on students who have not experienced online education before. Our study, however, also includes the so-called COVID-19 generation, the generation of young people directly impacted by the pandemic. Studies of the COVID-19 generation are new to the scholarly literature [20,26]. Due to the limited number of studies, the reported outcomes of exposure to remote learning during the pandemic are often ambiguous. For example, a previous study reported that the distinction between full in-presence programs and hybrid courses produces a mismatch between actual performance and measured performance [20]. The mismatch is related to the change in assessment methods and/or parameters. It is argued that the negative effect on actual performance could have been offset on the surface by the more relaxed assessment systems being adapted during the pandemic [20]. Therefore, generation COVID-19 can be regarded as less prepared compared to their pre-pandemic peers, regardless of their similar average marks. This may produce a stigma by fostering a widespread perception that those who studied in the pandemic years are less capable compared with their older peers with the same degrees or marks. The research conducted so far revealed that the influential role is played by social support from friends, family and teachers [26]. As society is now transitioning back to pre-pandemic times, many questions related to the effects of remote education on young generation arise. These questions include the impact of remote learning on the overall academic performance and self-regulation skills of university students.
The present study compares the academic performance and time management skills of university students before, during and after the pandemic. As such, it helps to assess the long-term effects of online learning on independent problem solving. It is hypothesized that the academic performance of the COVID-19 generation has been positively influenced by the wide implementation of remote education during the pandemic.
2. Methodology
2.1. Study Participants
The analyzed group comprised third-year university students majoring in the discipline of materials science and engineering. The 3rd-year students were selected as a representative group as they had already gained practical experience in independent problem solving in their previous education. Furthermore, the chosen group of students included generation COVID-19, i.e., students who directly experienced remote learning in a university setting during their previous education. The number of students enrolled in the course each year is shown in Figure 1. The subject with the code PSE201_6B is taught at the Slovak University of Technology in Bratislava, Faculty of Materials Science and Technology, in Trnava. It is taught in the winter term (September to December). The subject deals with the processing, evaluation and visualization of data using a computer.
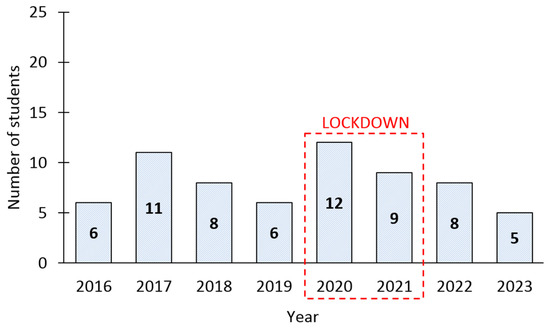
Figure 1.
Number of students enrolled in the course on the statistical processing and visualization of laboratory data.
The students’ performance was evaluated in the subject of statistical processing and visualization of laboratory data. The subject of data analysis on a computer allows the submission of tasks in an electronic form. As such, data on the delivery date can be easily recorded.
2.2. Definition of Students’ Homework
The students were given identical tasks. The task consisted of digitizing a curve. Each student had their own graph image that had to be digitized and split into a set of data points (pixels). The procedure of the task was as follows:
- Split the given experiment curve into a set of individual data points;
- Find a polynomial equation that best fits the given curve using a least squares analysis;
- Find the correlation coefficient of the regression equation;
- Plot the ideal curve using the regression equation;
- Calculate and display the difference between the original and the ideal curve.
The homework procedure was identical for all students; however, each student had their own curve that they had to process. The students received new data sets every year. The answer sheets uploaded into the academic system were checked against a volume of previously submitted homework, thereby preventing electronic copying of previously submitted answer sheets.
The students were free to choose a software for data digitization. The range of software available included WinDIG Digitizer, GetData Digitizer and Graph Digitizer Scout in their respective versions available at the time of the experiment (2016–2023). All students chose Graph Digitizer Scout. The students could also choose software for data processing. The choices were Microsoft Excel, OpenOffice Calc, LibreOffice Calc, Quattro Pro, Origin and MatLab. Everyone chose Microsoft Excel.
Figure 2 shows examples of the completed homework. The answer sheets shown in the figure were delivered by three students with different performances. In Figure 2a, the assignment is complete and correct. As such, the student achieved a 100% score. Figure 2b shows a result of a student with medium performance (the score is 40%). Finally, Figure 2c illustrates incomplete and incorrect homework, which achieved a final score of 0%.
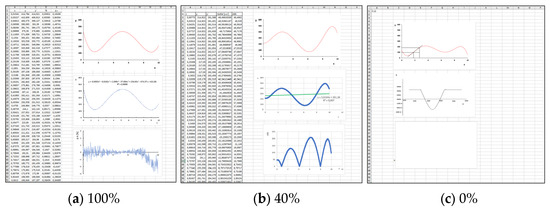
Figure 2.
Examples of delivered student answer sheets with different scores provided. In each graphic, the red curve is the curve to be analyzed. The blue and black curves represent the delivered students’ results.
2.3. Analysis of Students’ Performance
To evaluate the students’ performance before, during and after the pandemic, it was necessary to find common indicators. The student performance analysis was based on data recorded in the school’s academic information system. The system allows the recording of exact dates of publication of the task definition, and each individual student’s download time, upload time and final score achieved. Data were analyzed for years 2016 to 2023. A summary of the analytical data for the performance analysis is given in Table 1. There are no data for years earlier than 2016 since the students submitted their work physically (printed on a paper) before then. Furthermore, the download time data are missing from 2016 to 2019, because the homework definition was announced on-site and presented to all students at the same time.

Table 1.
Data available for analysis.
Most studies of homework effectiveness relate time spent on homework to test performance [27]. The usual deadline for delivering complete works in the pre-pandemic year was 7 days. However, during the pandemic, the period was extended to 21 days. In the following years, different deadlines were used to find the optimal value (Table 1). To compensate for the difference in deadlines, relative time performance was calculated in accordance with the following equation:
In Equation (1), T represents the relative time performance in %, p is the publication date of the task definition, d is the deadline date, t1 is the download date and t2 is the upload date. The difference (d − p) is the deadline length, i.e., 7 days in 2016–2019, 21 days in 2020, 12 days in 2021, 14 days in 2022 and 21 days in 2023. The difference (t2 − t1) is the time each student spent on their homework.
The students’ performance was also measured by the relative scores achieved for the completed homework (Figure 2). The scores achieved were combined with the time performance to compare the overall students’ performance before, during and after the lockdown period.
3. Results
Figure 3 shows the proportion of face-to-face lessons taught in the classroom. In the pre-pandemic and post-pandemic years, 100% lessons were taught on-site. However, during the pandemic years, only 15 and 25% of the lessons were taught in person. These lessons were mostly introductory lectures delivered at the start of the semester. The on-site learning during the pandemic took place in late September and early October, that is, before the general closure of Slovak universities was established. In 2020 and 2021, universities were closed for on-site education between October and May, i.e., most of the time during the academic year.
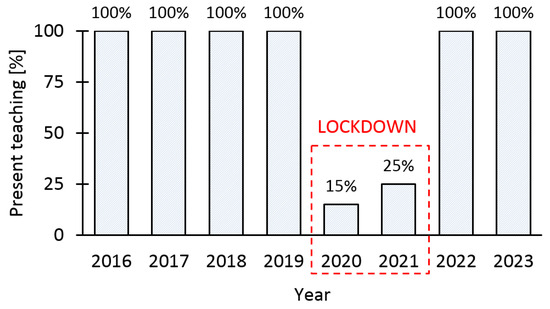
Figure 3.
Proportion of on-site teaching hours before, during and after the pandemic.
3.1. Performance Measured by Achieved Scores
A traditional way to evaluate student performance is by comparing achieved scores. Figure 4 compares the average scores achieved by the students for their delivered answer sheets in each year. Standard deviations are included. The figure shows that the student’s scores achieved during pandemic years was comparable to those in the pre-pandemic years. However, a slight improvement in performance was noted in the post-pandemic years.
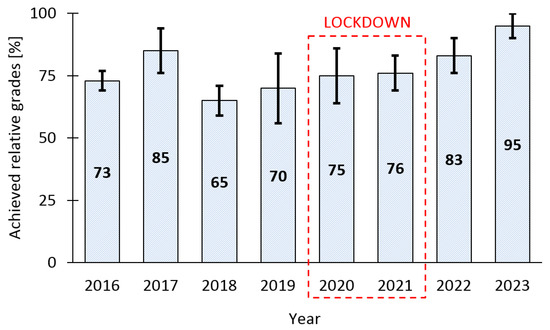
Figure 4.
Achieved relative grades of students for their homework delivered during 2016–2023.
3.2. Performance Measured by Delivery Times
Figure 5 depicts the data on the time of delivery of completed homework for the pre-pandemic years 2016 to 2019. Each curve represents one year. Each data point on the curve represents one student. Most students submitted their homework within the last day. An exception was year 2017, when approximately 50% of students submitted their answer sheets 4 days ahead of the deadline.
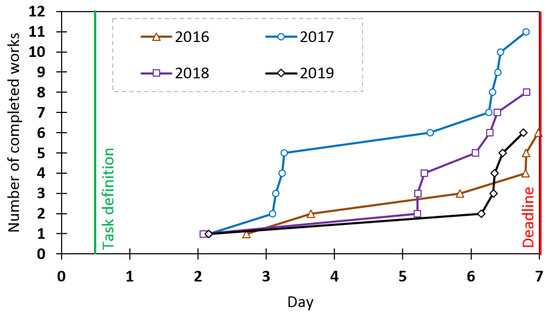
Figure 5.
The delivery times for complete homework for the years 2016 to 2019.
The changed study conditions during the pandemic may have affected the students’ performance, as they could have needed more time to read, understand and complete the defined task [28,29]. Therefore, the time frame to deliver the complete homework was extended to 21 days. Figure 6 displays data on all students who completed homework in the pandemic year 2020. The download curve represents the specific time at which the students downloaded and read the assignment. The upload curve represents the time of submission of the completed answer sheet. Each point on the download and upload curves represents a specific student. The points on the download and upload curves are interconnected by arrows to indicate the working time of each student. The area between the download and upload curves represents the performance of the entire group. The smaller the area, the better the performance of the group. Each tick mark on the x-axis represents the start of the day (0:00 a.m.). Days marked in red font represent public holidays.
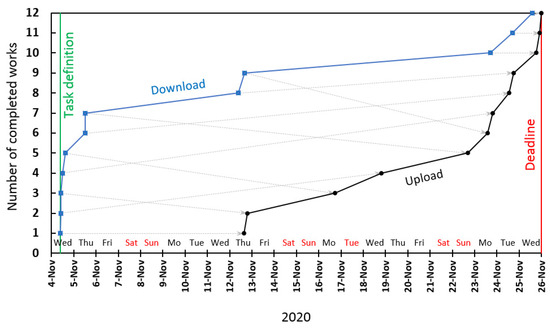
Figure 6.
The download and upload times of complete homework in 2020.
As can be seen in Figure 6, most students downloaded and read their assignment on the day of publication. However, most students uploaded the completed work shortly before the deadline. As such, they needed more time to read, understand and complete the assignment. The longest time between the download and upload was 19 days and 8 h. The shortest time was 9 h and 23 min. The average time needed to complete the task for the whole group was 10 days and 10 h.
The time performance data for 2021 are shown in Figure 7. Unlike for 2020, there is a significant lag between the date of publication of the assignment and the actual download time. In 2021, only one student from the group read the assignment on the day of publication. All students uploaded their complete work less than 2 days before the deadline.
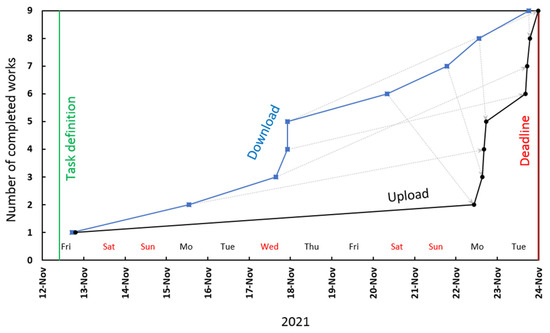
Figure 7.
The download and upload times of complete works in 2021.
The area between the download and upload curve is significantly smaller compared with that for 2020 (Figure 6). This result shows that the students were more efficient, that is, they needed less time to read, understand and complete the task.
The time performance data for post-pandemic years 2022 and 2023 are shown in Figure 8 and Figure 9, respectively. A positive change in student behavior can be noted. Most of the students downloaded their task assignments within a week after publication. Furthermore, they completed and uploaded their work several days before the deadline. As such, the time required to complete homework was significantly reduced.
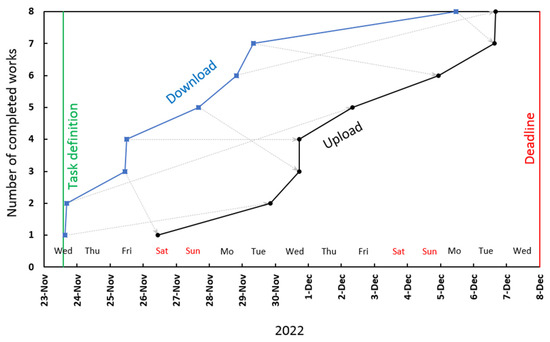
Figure 8.
The download and upload times of complete homework in 2022.
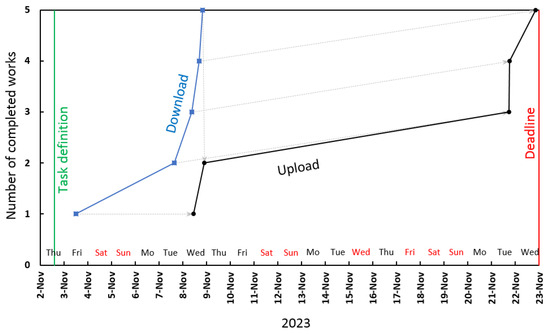
Figure 9.
The download and upload times of complete homework in 2023.
The relative time performance of the students was calculated in accordance with Equation (1). The calculated relative time performance for 2016–2023 is shown in Figure 10. A marked difference between the post-pandemic, pandemic and pre-pandemic years can be seen. In the pandemic and pre-pandemic years, the relative time performance was very low. It was close to 20% on average. In the post-pandemic years, however, it increased considerably. The relative time performance has been elevated to 66% and 54% in the years 2022 and 2023, respectively.
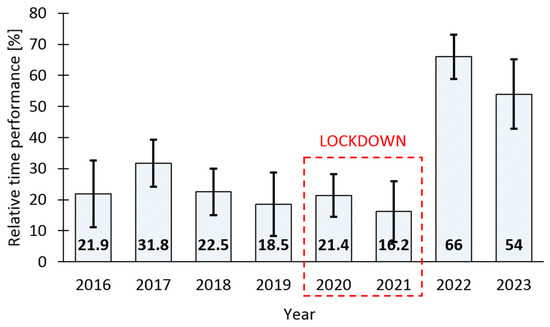
Figure 10.
A comparison of the average time performance for pre-pandemic, pandemic and post-pandemic years.
3.3. Combined Performance
When analyzing the overall performance of the students, it was necessary to match the time performance with the achieved score. As such, the time performance was combined with the achieved score to yield overall performance. The following formula was used to calculate overall performance:
P = T + S
In Equation (2), P is overall performance, T is time performance and S is the achieved score. If a student completed their homework in a very short time, they received a T value close to 100%. If their answer sheet was also complete and correct, they received an additional score of 100%. As such, an individual could reach a maximum performance value of 200%. Figure 11 shows the overall performance of all students. The performance is divided into individual scores and delivery times. It can be noted that in the pandemic and pre-pandemic years, overall performance was relatively low. However, in the post-pandemic years, the overall performance of individual students considerably increased.
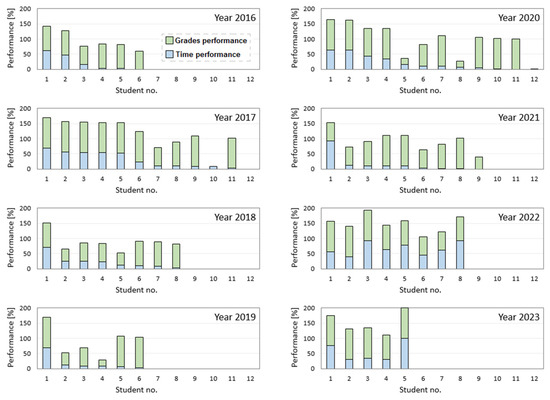
Figure 11.
The combined performance (scores and delivery times) of individual students.
Based on data in Figure 11, the average overall performance of the group was calculated. Figure 12 shows the overall average performance of the whole group. Standard deviations are included. The figure shows that overall performance, i.e., the delivery time for the homework and the score combined, was significantly improved in 2022 and 2023. The increase in performance was more than 50%.
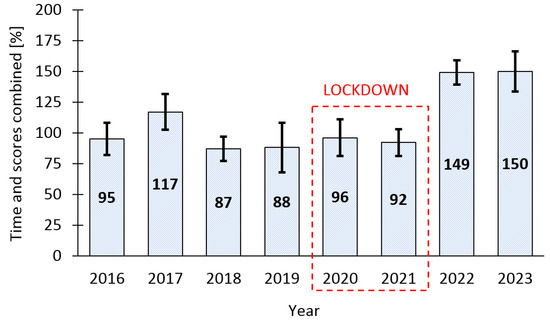
Figure 12.
Average overall student performance in different years.
4. Discussion and Concluding Remarks
This study analyzed the performance of students before, during and after the COVID-19 pandemic. It provided an opportunity to compare the performance of students who never experienced lockdown with those who previously experienced lockdown and were already familiar with online learning (the so-called COVID-19 generation). This study compared the performance in terms of scores achieved and the time required to complete specific homework in data visualization and processing. In the pandemic and pre-pandemic years, the relative time performance was very low. It was close to 20% on average. In the post-pandemic years, however, it increased markedly. Relative time performance was elevated to 66% and 54% in the years 2022 and 2023, respectively (Figure 10).
Evaluating performance by grades and achieved scores is the simplest method. However, it does not consider the time required to complete the defined tasks. As such, it does not evaluate the ability of students to deal with time constraints. Our study shows that after the lockdown, there was an overall increase in the time performance. Furthermore, overall performance, i.e., the delivery time for the completed homework and the score combined, significantly improved in 2022 and 2023 (Figure 12). The increase in overall performance was more than 50%. This shows that the students were able to cope with time constraints more efficiently compared to pre-pandemic and pandemic years. Therefore, the long-term exposure to online learning, including the self-study of e-materials, has had a positive effect on their academic performance.
When comparing the performance in terms of scores and delivery times in 2019 and 2020, a slight increase is noticeable, but statistically insignificant. However, after analyzing all the data available (2016–2023), the post-pandemic years 2022 and 2023 emerge as the global maximum for the highest performance in school grades and homework time performance (Figure 12). In the combined analysis, a significant increase in overall performance was noticed.
The scholarly discussion of the efficiency of in-class versus online learning in university settings is somewhat ambiguous [20]. Some researchers found increased performance in face-to-face learning while others reported increased performance through online learning. The first-time experience of the lockdown period was very likely stressful [11,16,30]. It could have led to isolation and uncertainty among both teachers and students. Therefore, the performance of students during the pandemic could have been low. However, exposure to online learning methods during 2020 and 2021 ultimately increased the performance of post-pandemic students. The pandemic thus created a unique situation in which students had more time to focus on their homework. The lockdown period apparently taught the students to work independently and act more responsibly. The self-regulation skills of students, such as those of setting a clear study goal and choosing an appropriate learning strategy, are crucial to their academic progression [31,32]. The results of our study show that these skills can be positively improved during remote education. Our findings are consistent with those of Ilozor et al. [33]. The authors found that there was a positive correlation between participation hours and the point scores the students achieved in an asynchronous online class at Eastern Michigan University during the pandemic. As such, teachers should be encouraged to motivate their students toward self-learning and self-regulation during online teaching. Instructors should be actively engaged during remote education as they act as motivators. The promotion of a motivating style of instruction from teachers is crucial during remote learning [34]. An effective blended learning strategy can be developed, as recently demonstrated in the context of teaching physical and analytical chemistry to students of chemical engineering [35]. A five-component blended learning strategy referred to as Discover, Learn, Practice, Collaborate, and Assess (DLPCA) has been described [35]. In DLPCA, the asynchronous part of the teaching was conducted through the broadcasting of pre-recorded instruction videos on YouTube to allow students to study and progress with learning at their own pace. The synchronous part of the teaching was carried out using video conferencing platforms, including Google Meet and Zoom. The subsequent analysis of teaching and learning performance was based on three factors: (i) the student’s learning experience, (ii) the student’s academic performance and (iii) the observations of the instructor [35]. The study showed that DLPCA had a positive impact on both students and instructors. The identified challenges were mostly technical, as they were related to the speed of the internet, the stability of the connection, and the instructor’s familiarity with internet-based teaching tools, such as video conferencing and broadcasting. Therefore, instructors should be encouraged to use these platforms and experiment with their education strategies. They must find efficient ways of improving their interaction with students and of maintaining student interest and engagement during online classes. The study also showed that most students were satisfied with the DLCPA strategy. Therefore, it can be regarded as an effective alternative to traditional onsite undergraduate chemistry lecture courses. A mathematical curriculum can also be redesigned for blended learning [36]. The widespread use of modern information and communication technology makes online learning more sustainable. It allows teachers and students to interact in multiple modes [17,37]. Furthermore, teaching approaches can be flexibly adapted and suited to students with diverse needs and structured into parallel or successive phases of blended learning [36]. Information and communication equipment, such as laptops and tablets, and various online tools can be used by small groups of students, with shared access to e-learning study materials and working remotely with their teachers across various fields [38].
The survival of the higher education system depends on its adaptability, resilience and sustainability [39]. The COVID-19 pandemic was both an opportunity and challenge for university education, as previously discussed by several authors [40,41,42,43,44]. Although online education provided multiple benefits for both students and teachers, including better time management and flexibility, the sudden shift to emergency online education caused a deterioration in communication skills [45]. Less social interaction with peers ultimately led to depression, anxiety and stress. Due to the sudden transition to remote education in early 2020, many students and teachers initially declared a preference for face-to-face teaching [46,47]. A dialogue, teacher initiative and efficient course design were the key factors in the success of online courses during the pandemic [42,48,49]. It is obvious that face-to-face education cannot be fully replaced by online learning in medical, technical and natural science disciplines [50,51]. In dentistry, for example, e-learning is only applicable to theoretical lessons [51]. Due to the lack of physical communication and interaction, most students prefer a blended method. Therefore, hybrid learning is considered a more sustainable alternative compared to entirely online or on-site education [52]. The recommendations for sustainable post-pandemic education include the unified selection of digital learning tools across courses, better support and training for teachers [43]. If these recommendations are followed, wider implementation of hybrid learning methods in university settings can be expected.
Although the results reported in this brief report are encouraging and promote the use of online methods in teaching, it should be noted that a relatively small number of students were analyzed. Because of small number of participants involved in the study (5–12 students, Figure 1), a statistical analysis of errors was not possible. The presence of a significantly smarter or, conversely, lazy student may significantly affect the performance of a small group. Furthermore, the relatively small size of the group created a more cohesive team and allowed the teacher to have a more individual-tailored approach. The entire analysis is also burdened by missing data for the pre-pandemic years (download dates, Table 1). Therefore, the results reported in this short paper should be taken as preliminary results. A study involving a larger group of participants and comparing their performance in more than two consecutive post-pandemic years is necessary to further verify the observed positive trend. As many universities are now resuming on-site education, there is a great opportunity to study the effects of online learning during the pandemic on the performance of the COVID-19 generation. We hope that there will be more academic studies on this important aspect in the coming years.
Author Contributions
Conceptualization, M.P. (Matej Pašák) and M.P. (Marián Palcut); methodology, M.P. (Matej Pašák); validation, M.P. (Matej Pašák); formal analysis, M.P. (Matej Pašák) and M.P. (Marián Palcut); investigation, M.P. (Matej Pašák); resources, M.P. (Marián Palcut); data curation, M.P. (Matej Pašák); writing—original draft preparation, M.P. (Matej Pašák); writing—review and editing, M.P. (Marián Palcut); visualization, M.P. (Matej Pašák) and M.P. (Marián Palcut); supervision, M.P. (Matej Pašák) and M.P. (Marián Palcut); project administration, M.P. (Marián Palcut). All authors have read and agreed to the published version of the manuscript.
Funding
This work was supported by the Slovak Research and Development Agency—project no. APVV-20-0124, and the grant agency VEGA of the Ministry of Education, Science, Research and Sport of the Slovak republic—project no. 1/0531/22.
Institutional Review Board Statement
The data used in this study were collected and anonymized by teachers according to the university policy. The data are not traceable to participating individuals. The procedure complies with the general data protection regulation (GDPR).
Informed Consent Statement
Informed consent was obtained from all individual participants included in the study.
Data Availability Statement
Data are contained within the article.
Conflicts of Interest
The authors declare no conflicts of interest.
References
- Adhikari, G. Intuition on virology, epidemiology, pathogenesis, and control of COVID-19. Nov. Res. Microbiol. J. 2020, 4, 955–967. [Google Scholar] [CrossRef]
- Sahu, P. Closure of Universities Due to Coronavirus Disease 2019 (COVID-19): Impact on Education and Mental Health of Students and Academic Staff. Cureus 2020, 2019, 4–9. [Google Scholar] [CrossRef] [PubMed]
- Khalil, R.; Mansour, A.E.; Fadda, W.A.; Almisnid, K.; Aldamegh, M.; Al-Nafeesah, A.; Alkhalifah, A.; Al-Wutayd, O. The sudden transition to synchronized online learning during the COVID-19 pandemic in Saudi Arabia: A qualitative study exploring medical students’ perspectives. BMC Med. Educ. 2020, 20, 285. [Google Scholar] [CrossRef]
- Iglesias-Pradas, S.; Hernández-García, Á.; Chaparro-Peláez, J.; Prieto, J.L. Emergency remote teaching and students’ academic performance in higher education during the COVID-19 pandemic: A case study. Comput. Hum. Behav. 2021, 119, 106713. [Google Scholar] [CrossRef]
- Al-Mawee, W.; Kwayu, K.M.; Gharaibeh, T. Student’s perspective on distance learning during COVID-19 pandemic: A case study of Western Michigan University, United States. Int. J. Educ. Res. Open 2021, 2, 100080. [Google Scholar] [CrossRef]
- Mahdy, M.A.A. The Impact of COVID-19 Pandemic on the Academic Performance of Veterinary Medical Students. Front. Vet. Sci. 2020, 7, 594261. [Google Scholar] [CrossRef]
- Vautier, A.; Enns, K.; Cadaret, C. Impacts of the COVID-19 Pandemic on Student Performance and Perceptions of Learning. NACTA J. 2023, 67, 109–116. [Google Scholar] [CrossRef]
- Cavanaugh, J.; Jacquemin, S.; Junker, C. A look at student performance during the COVID-19 pandemic. Qual. Assur. Educ. 2023, 31, 33–43. [Google Scholar] [CrossRef]
- Cortés-Albornoz, M.C.; Ramírez-Guerrero, S.; García-Guáqueta, D.P.; Vélez-Van-Meerbeke, A.; Talero-Gutiérrez, C. Effects of remote learning during COVID-19 lockdown on children’s learning abilities and school performance: A systematic review. Int. J. Educ. Dev. 2023, 101, 102835. [Google Scholar] [CrossRef]
- Ghanamah, R.; Eghbaria-Ghanamah, H. Impact of COVID-19 pandemic on behavioral and emotional aspects and daily routines of Arab israeli children. Int. J. Environ. Res. Public Health 2021, 18, 2946. [Google Scholar] [CrossRef]
- Casagrande, M.; Favieri, F.; Tambelli, R.; Forte, G. The enemy who sealed the world: Effects quarantine due to the COVID-19 on sleep quality, anxiety, and psychological distress in the Italian population. Sleep Med. 2020, 75, 12–20. [Google Scholar] [CrossRef] [PubMed]
- Sundarasen, S.; Chinna, K.; Kamaludin, K.; Nurunnabi, M.; Baloch, G.M.; Khoshaim, H.B.; Hossain, S.F.A.; Sukayt, A. Psychological impact of COVID-19 and lockdown among university students in malaysia: Implications and policy recommendations. Int. J. Environ. Res. Public Health 2020, 17, 6206. [Google Scholar] [CrossRef] [PubMed]
- Mertens, G.; Gerritsen, L.; Duijndam, S.; Salemink, E.; Engelhard, I.M. Fear of the coronavirus (COVID-19): Predictors in an online study conducted in March 2020. J. Anxiety Disord. 2020, 74, 102258. [Google Scholar] [CrossRef] [PubMed]
- Clark, A.E.; Nong, H.; Zhu, H.; Zhu, R. Compensating for academic loss: Online learning and student performance during the COVID-19 pandemic. China Econ. Rev. 2021, 68, 101629. [Google Scholar] [CrossRef] [PubMed]
- Acheampong, J.O. The impact of COVID-19 on students’ academic performance: The case of the university of Ghana business school. Cogent Educ. 2023, 10, 2186011. [Google Scholar] [CrossRef]
- Aristovnik, A.; Keržič, D.; Ravšelj, D.; Tomaževič, N.; Umek, L. Impacts of the COVID-19 Pandemic on Life of Higher Education Students: A global perspective. Sustainability 2020, 12, 8438. [Google Scholar] [CrossRef]
- Sá, M.J.; Serpa, S. The COVID-19 pandemic as an opportunity to foster the sustainable development of teaching in higher education. Sustainability 2020, 12, 8525. [Google Scholar] [CrossRef]
- Pertegal-Felices, M.L.; Valdivieso-Salazar, D.A.; Espín-León, A.; Jimeno-Morenilla, A. Resilience and Academic Dropout in Ecuadorian University Students during COVID-19. Sustainability 2022, 14, 8066. [Google Scholar] [CrossRef]
- de la Cruz-Campos, J.C.; Victoria-Maldonado, J.J.; Martínez-Domingo, J.A.; Campos-Soto, M.N. Causes of academic dropout in higher education in Andalusia and proposals for its prevention at university: A systematic review. Front. Educ. 2023, 8, 1130952. [Google Scholar] [CrossRef]
- Bonacini, L.; Gallo, G.; Patriarca, F. Unraveling the controversial effect of Covid-19 on college students’ performance. Sci. Rep. 2023, 13, 15912. [Google Scholar] [CrossRef] [PubMed]
- Elzainy, A.; El Sadik, A.; Al Abdulmonem, W. Experience of e-learning and online assessment during the COVID-19 pandemic at the College of Medicine, Qassim University. J. Taibah Univ. Med. Sci. 2020, 15, 456–462. [Google Scholar] [CrossRef] [PubMed]
- El Said, G.R. How Did the COVID-19 Pandemic Affect Higher Education Learning Experience? An Empirical Investigation of Learners’ Academic Performance at a University in a Developing Country. Adv. Hum.-Comput. Interact. 2021, 2021, 6649524. [Google Scholar] [CrossRef]
- Nasrullah, S.; Khan, M.S.; Nasrullah, S.; Khan, M.S. The Impact of Time Management on the Students’ Academic Achievements. Int. Peer-Rev. J. 2015, 11, 66–72. Available online: www.iiste.org (accessed on 30 December 2023).
- Rashid, A.; Sharif, I.; Khan, S.; Malik, F. Relationship Between Time Management Behavior and Academic Performance of University Students. J. Bus. Soc. Rev. Emerg. Econ. 2020, 6, 1497–1504. [Google Scholar] [CrossRef]
- Dost, S.; Hossain, A.; Shehab, M.; Abdelwahed, A.; Al-Nusair, L. Perceptions of medical students towards online teaching during the COVID-19 pandemic: A national cross-sectional survey of 2721 UK medical students. BMJ Open 2020, 10, e042378. [Google Scholar] [CrossRef] [PubMed]
- Hostinar, C.E.; Velez, G. Generation COVID: Coming of Age Amid the Pandemic. Curr. Opin. Psychol. 2023, 55, 101725. [Google Scholar] [CrossRef]
- Neilson, W. Homework and performance for time-constrained students. Econ. Bull. 2005, 9, 1–6. [Google Scholar]
- Conto, C.A.; Akseer, S.; Dreesen, T.; Kamei, A.; Mizunoya, S.; Rigole, A. Potential effects of COVID-19 school closures on foundational skills and Country responses for mitigating learning loss. Int. J. Educ. Dev. 2021, 87, 102434. [Google Scholar] [CrossRef]
- Smith, J.; Guimond, F.A.; Bergeron, J.; St-Amand, J.; Fitzpatrick, C.; Gagnon, M. Changes in students’ achievement motivation in the context of the COVID-19 pandemic: A function of extraversion/introversion? Educ. Sci. 2021, 11, 30. [Google Scholar] [CrossRef]
- Ahmed, M.Z.; Ahmed, O.; Aibao, Z.; Hanbin, S.; Siyu, L.; Ahmad, A. Epidemic of COVID-19 in China and associated Psychological Problems. Asian J. Psychiatr. 2020, 51, 102092. [Google Scholar] [CrossRef]
- Trautwein, U.; Köller, O. The Relationship Between Homework and Achievement—Still Much of a Mystery. Educ. Psychol. Rev. 2003, 15, 115–145. [Google Scholar] [CrossRef]
- Guven, M.; Babayigit, B.B. Self-regulated learning skills of undergraduate students and the role of higher education in promoting self-regulation. Eurasian J. Educ. Res. 2020, 2020, 47–70. [Google Scholar] [CrossRef]
- Ilozor, B.D.; Efuntoye, O.T.; Das, R.R. Evaluating Students’ Performance Relative to Their Time Investment in an Asynchronous Online Class. J. Technol. Manag. Appl. Eng. 2023, 39, 2–13. [Google Scholar] [CrossRef]
- Moè, A.; Consiglio, P.; Katz, I. Exploring the circumplex model of motivating and demotivating teaching styles: The role of teacher need satisfaction and need frustration. Teach. Teach. Educ. 2022, 118, 103823. [Google Scholar] [CrossRef]
- Lapitan, L.D.; Tiangco, C.E.; Sumalinog, D.A.G.; Sabarillo, N.S.; Diaz, J.M. An effective blended online teaching and learning strategy during the COVID-19 pandemic. Educ. Chem. Eng. 2021, 35, 116–131. [Google Scholar] [CrossRef]
- Stahl, G. Redesigning mathematical curriculum for blended learning. Educ. Sci. 2021, 11, 165. [Google Scholar] [CrossRef]
- Ionescu, C.A.; Paschia, L.; Gudanescu Nicolau, N.L.; Stanescu, S.G.; Neacsu Stancescu, V.M.; Coman, M.D.; Uzlau, M.C. Sustainability analysis of the e-learning education system during pandemic period—COVID-19 in Romania. Sustainability 2020, 12, 9030. [Google Scholar] [CrossRef]
- Gerhátová, Ž.; Perichta, P.; Palcut, M. Project-based teaching of the topic ‘energy sources’ in physics via integrated e-learning—Pedagogical research in the 9th grade at two primary schools in Slovakia. Educ. Sci. 2020, 10, 371. [Google Scholar] [CrossRef]
- Bozkurt, A. Resilience, Adaptability, and Sustainability of Higher Education: A Systematic Mapping Study on the Impact of the Coronavirus (COVID-19) Pandemic and the Transition to the New Normal. J. Learn. Dev. 2022, 9, 1–16. [Google Scholar] [CrossRef]
- Adedoyin, O.B.; Soykan, E. Covid-19 pandemic and online learning: The challenges and opportunities. Interact. Learn. Environ. 2023, 31, 863–875. [Google Scholar] [CrossRef]
- Mohammad, R.F.; Hinduja, P.; Siddiqui, S. Unveiling the path to sustainable online learning: Addressing challenges and proposing solutions in Pakistan. Int. J. Educ. Manag. 2024, 38, 136–157. [Google Scholar] [CrossRef]
- Tsang, J.T.Y.; So, M.K.P.; Chong, A.C.Y.; Lam, B.S.Y.; Chu, A.M.Y. Higher education during the pandemic: The predictive factors of learning effectiveness in COVID-19 online learning. Educ. Sci. 2021, 11, 446. [Google Scholar] [CrossRef]
- Munir, H. Reshaping Sustainable University Education in Post-Pandemic World: Lessons Learned from an Empirical Study. Educ. Sci. 2022, 12, 524. [Google Scholar] [CrossRef]
- Mahajan, R.; Kumar, S.; Agrawal, M. Online teaching effectiveness: Lessons from Indian universities during the Covid-19 pandemic. Glob. Bus. Organ. Excell. 2023, 43, 135–151. [Google Scholar] [CrossRef]
- Gherheș, V.; Stoian, C.E.; Fărcașiu, M.A.; Stanici, M. E-learning vs. Face-to-face learning: Analyzing students’ preferences and behaviors. Sustainability 2021, 13, 4381. [Google Scholar] [CrossRef]
- Alonso-García, M.; Garrido-Letrán, T.M.; Sánchez-Alzola, A. Impact of COVID-19 on educational sustainability. Initial perceptions of the university community of the university of cádiz. Sustainability 2021, 13, 5938. [Google Scholar] [CrossRef]
- Kulikowski, K.; Przytuła, S.; Sułkowski, Ł. E-learning? Never again! On the unintended consequences of COVID-19 forced e-learning on academic teacher motivational job characteristics. High. Educ. Q. 2022, 76, 174–189. [Google Scholar] [CrossRef]
- Al-Adwan, A.S.; Albelbisi, N.A.; Hujran, O.; Al-Rahmi, W.M.; Alkhalifah, A. Developing a holistic success model for sustainable e-learning: A structural equation modeling approach. Sustainability 2021, 13, 9453. [Google Scholar] [CrossRef]
- Markauskaite, L.; Carvalho, L.; Fawns, T. The role of teachers in a sustainable university: From digital competencies to postdigital capabilities. Educ. Technol. Res. Dev. 2023, 71, 181–198. [Google Scholar] [CrossRef] [PubMed]
- Gombkötő, N.; Štempeľová, I.; Takáč, O. Evaluating Sustainable Online Education: A Cross-Disciplinary Analysis of IT Device Utilization among Slovakian and Hungarian University Students. Sustainability 2024, 16, 699. [Google Scholar] [CrossRef]
- Antoniadou, M.; Rahiotis, C.; Kakaboura, A. Sustainable Distance Online Educational Process for Dental Students during COVID-19 Pandemic. Int. J. Environ. Res. Public Health 2022, 19, 9470. [Google Scholar] [CrossRef] [PubMed]
- Jain, S.; Aggarwal, P.; Sharma, N.; Sharma, P. Fostering sustainability through education, research and practice: A case study of TERI University. J. Clean. Prod. 2013, 61, 20–24. [Google Scholar] [CrossRef]
Disclaimer/Publisher’s Note: The statements, opinions and data contained in all publications are solely those of the individual author(s) and contributor(s) and not of MDPI and/or the editor(s). MDPI and/or the editor(s) disclaim responsibility for any injury to people or property resulting from any ideas, methods, instructions or products referred to in the content. |
© 2024 by the authors. Licensee MDPI, Basel, Switzerland. This article is an open access article distributed under the terms and conditions of the Creative Commons Attribution (CC BY) license (https://creativecommons.org/licenses/by/4.0/).