
The Impact of a Combination of Flipped Classroom and Project-Based Learning on the Learning Motivation of University Students


Abstract
1. Introduction
1.1. Matching Labour Market Needs and Education Innovations
1.1.1. Quality of Education
1.1.2. Changing Needs of the Labour Market
1.1.3. Transition to Education 4.0
1.2. Design of Experiment
1.2.1. Flipped Classroom as a Learning Environment
1.2.2. Problem-Based Learning as an Innovative Learning Method
1.2.3. Learning Objective
1.2.4. The Quality of Education and Students’ Motivation
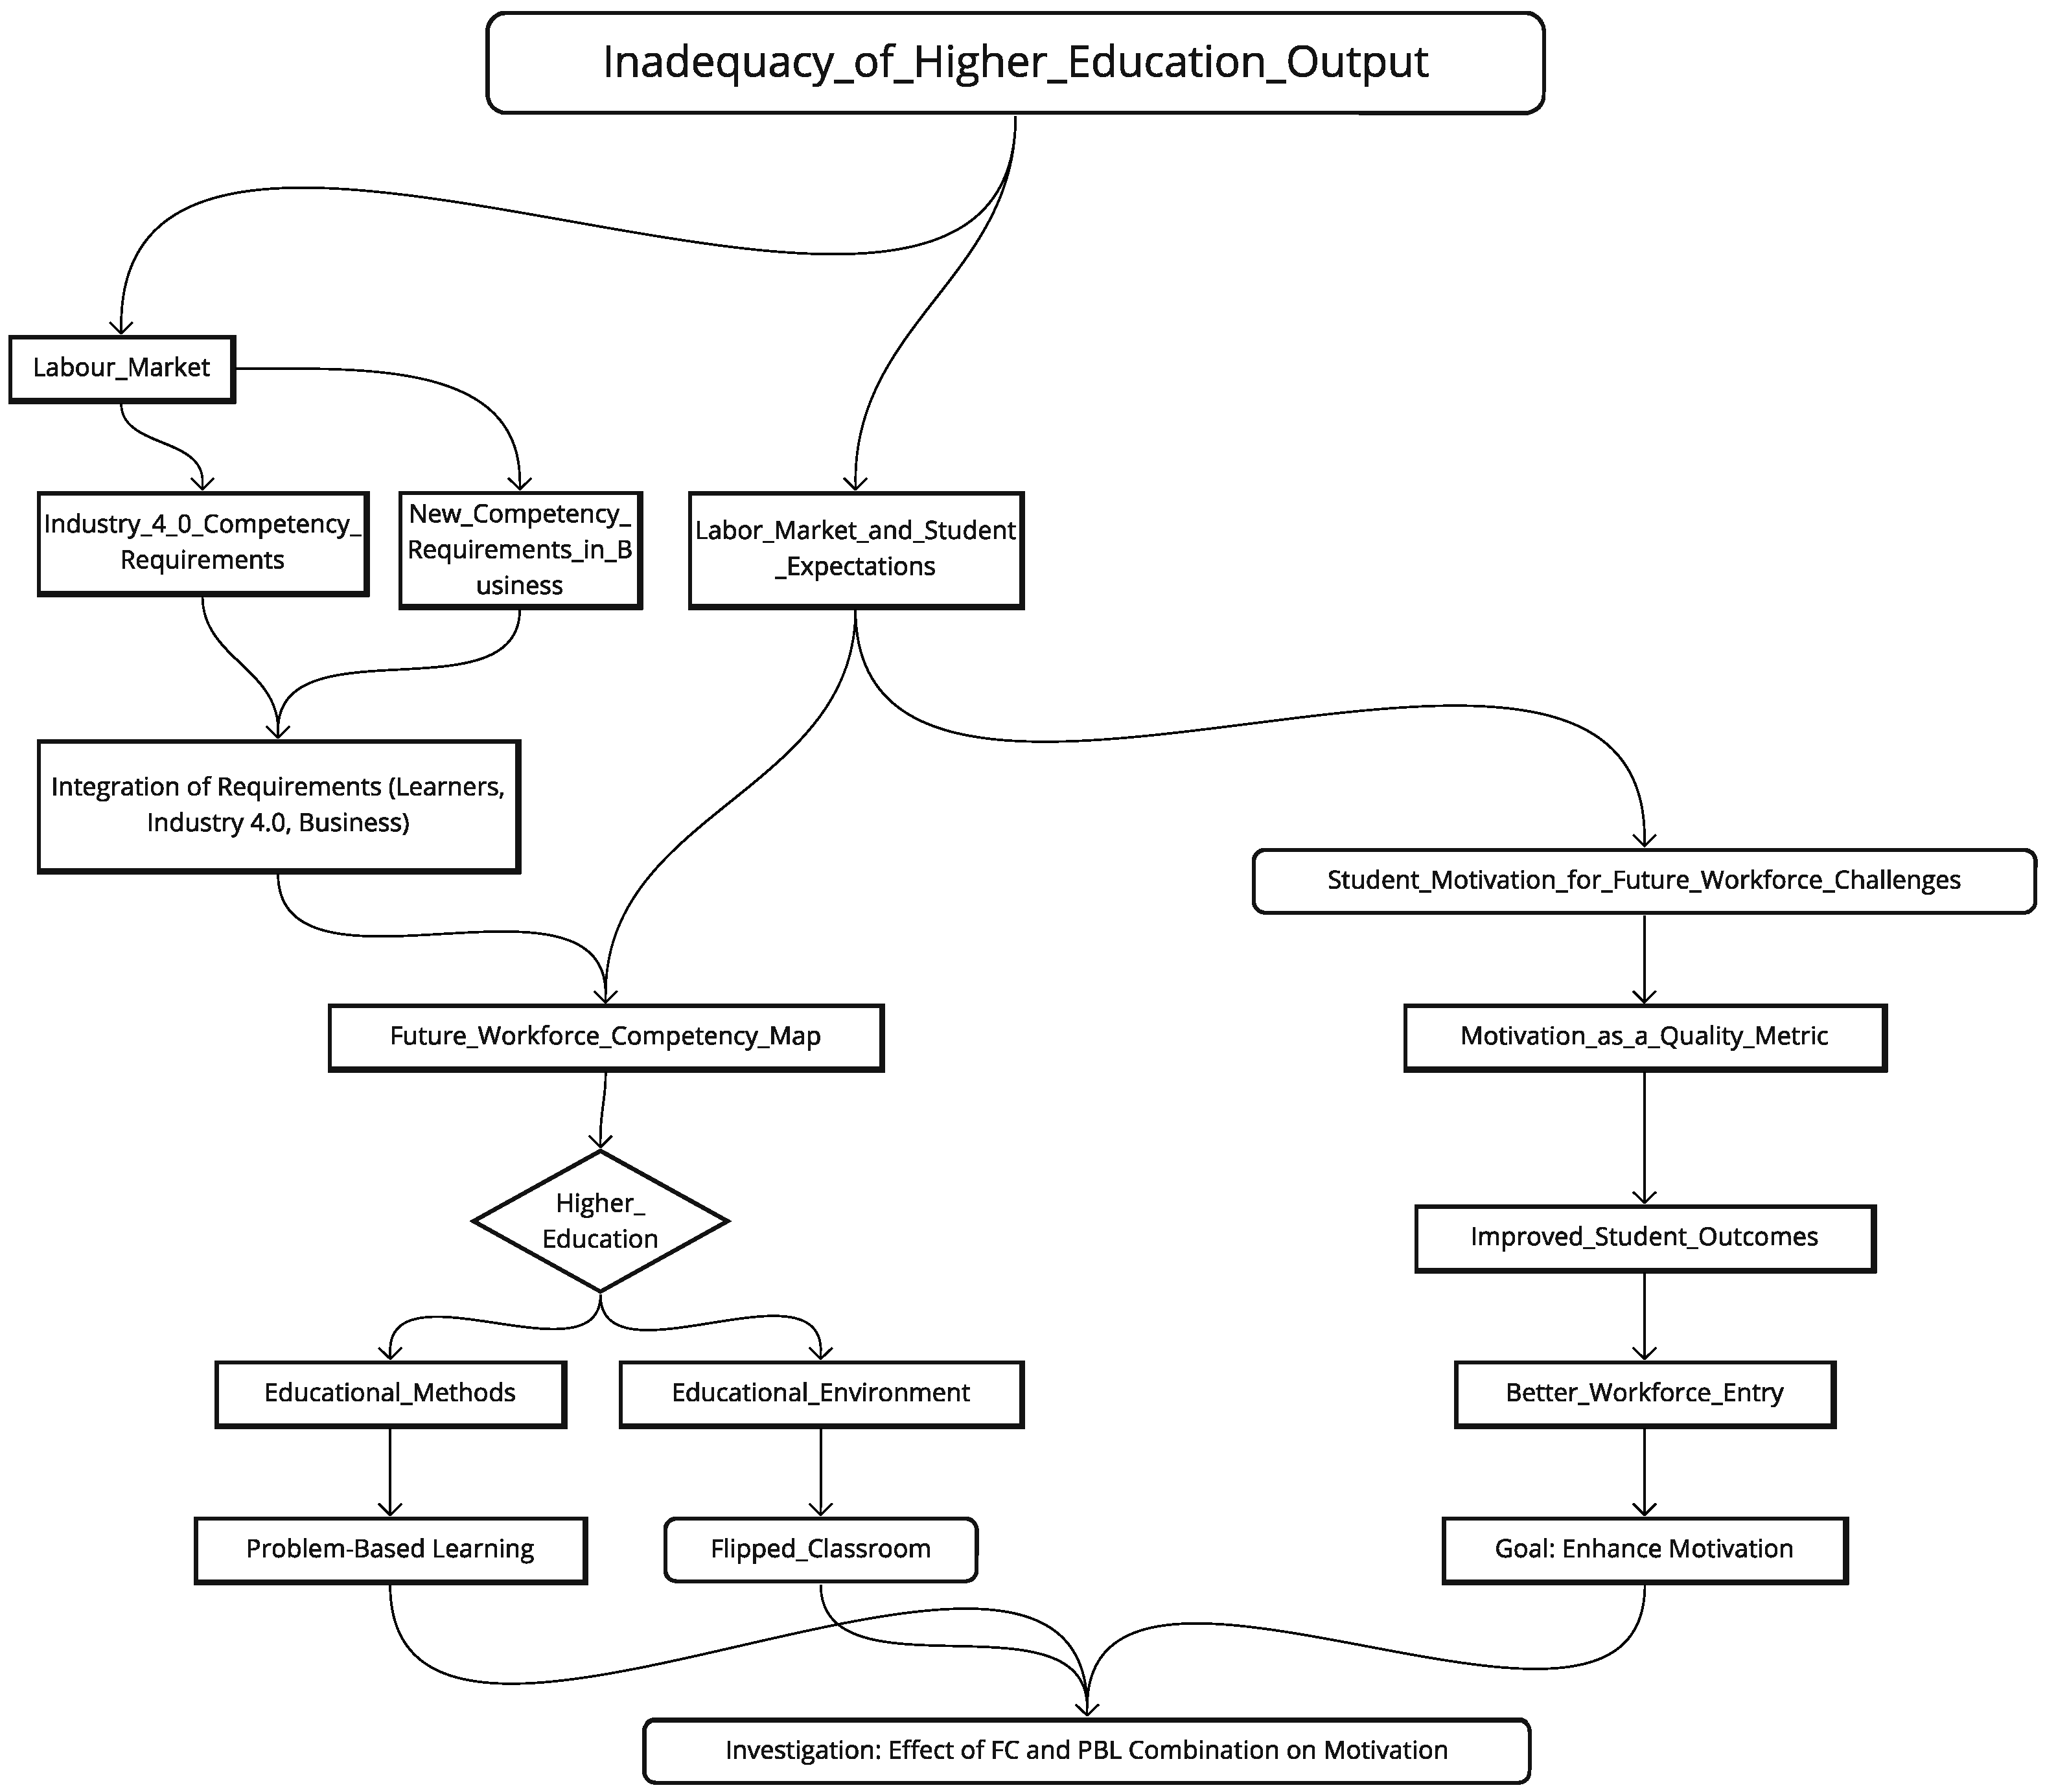
1.2.5. The Logical Structure of the Research
2. Materials and Methods
2.1. Methodology for the Selection of Participants
2.2. Methodology for Data Collection and Analysis
- Self-reflection: Self-reflection allows learners to assess their intrinsic motivation and well-being. This method combined features of the IMI and RPWS measurement tools to help students reflect on their motivation and feelings, thus encouraging them to learn. Our experience has shown that self-analysis has been beneficial; it helps students to learn. The method involves students completing a self-analysis task to analyse their soft and communication skills. Through this analysis, students understand their strengths and weaknesses [11]. The method’s difficulty is that the self-analysis task has to be completed separately for each learning objective.
- A 360-degree peer assessment: Student interactions and group dynamics were assessed using RPWS and SFSS analysis methods. This feedback helped us obtain a comprehensive picture of students’ interactions and motivation.
- The methods used include the following:
- Group analysis: the observation and evaluation of learners’ ability to cooperate in group tasks, including the level of learners’ commitment, contribution, and cooperation in achieving common goals, conducted by MSc students as group leaders;
- Peer evaluation allows learners to evaluate their peers’ contribution to the group work objectively and constructively. MSc students carried out the peer evaluation because they had an overview of the whole process and the actors involved;
- Self and peer assessment: it allows learners to reflect on their own and their peers’ progress in the affective domain [12].
- Teaching experiences: Student performance and behaviour were monitored in line with IMI and RPWS methods. This allowed for the identification of students’ motivational patterns. In line with the IMI and RPWS methods, we attempted to track students’ performance and behaviour through a two-phase structured process [13]. In the first phase, students were categorised according to predefined criteria (educational attainment, age, and previous learning performance). In the second phase, students participated in an additional assessment process, during which the most recent performance data were collected and analysed. Based on the results of these analyses, students were given a final ranking (i.e., a score from 1 to 5) reflecting their motivation to learn and their behavioural patterns. We followed students’ progress in real-time (every two weeks), comparing their initial scores with their subsequent performance. This allowed us to evaluate the effectiveness of our method and the changes in each student’s learning motivation patterns.
- Workflow observations and participation monitoring: elements of the SFSS methodology were used to identify the “flow” states and active participation. This helped to track changes in students’ motivation levels and engagement over time. Knowing the nine components of Csikszentmihalyi et al.’s [14] “flow” states, we adapted them here in our research and assessed the “flow” states based on only five components: attentional focus, the loss of self-awareness, the sense of control or competence, inner pleasure, and the perception of clear goals. Thissen et al. [15] investigated the “flow” states in the context of digital games. The study results showed that the “flow” state significantly positively affects participants’ sense of comfort and performance, supporting the psychological theory of “flow.” This means that the “flow” state plays an essential role in entertainment, education, and learning, where deep immersion and positive experiences contribute to increased motivation and performance. These components helped us to observe and assess the state of “flow” in students’ submitted work and the accompanying comments and cover letters in their online presentations. The quality of the students’ comments and the quality of their work can be used to identify which of these “flow” components were experienced during the learning process.
2.3. Ensuring the Authenticity and Validity of Our Data
3. Results
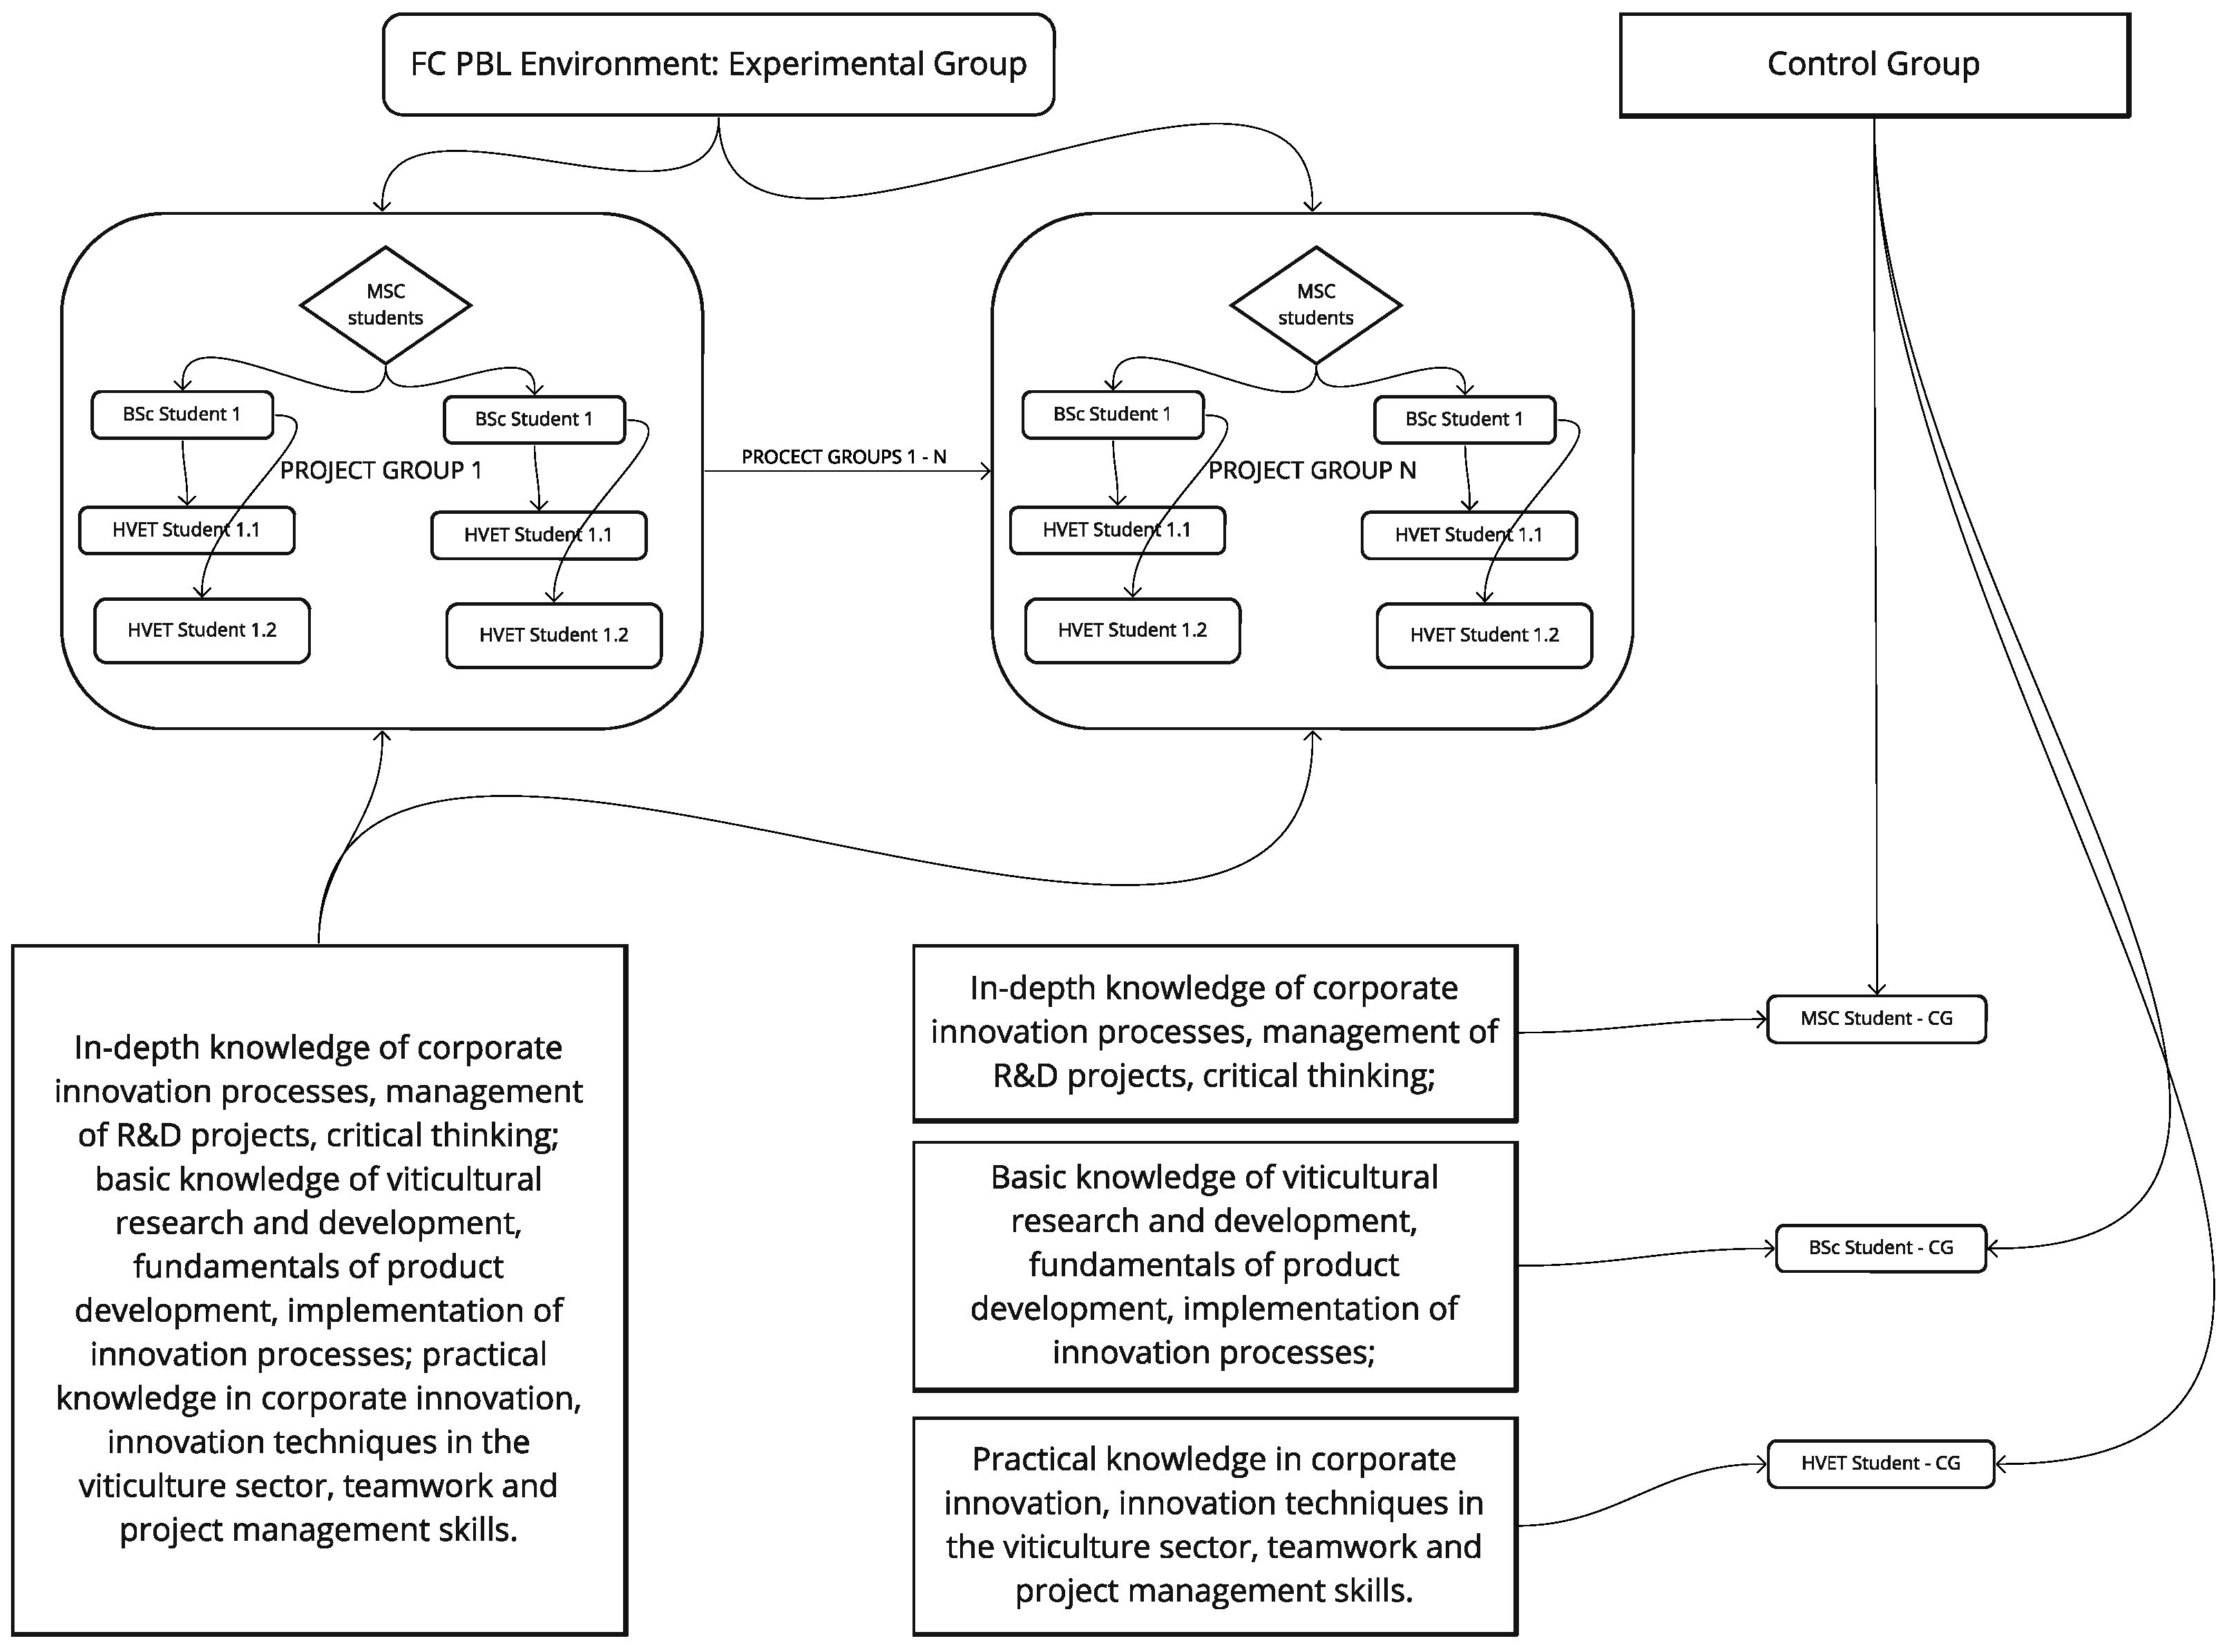
3.1. Group Training
3.1.1. Experimental Project Group Characteristics
3.1.2. Control Group Characteristics
3.1.3. Description of Data Sources and Data Analysis
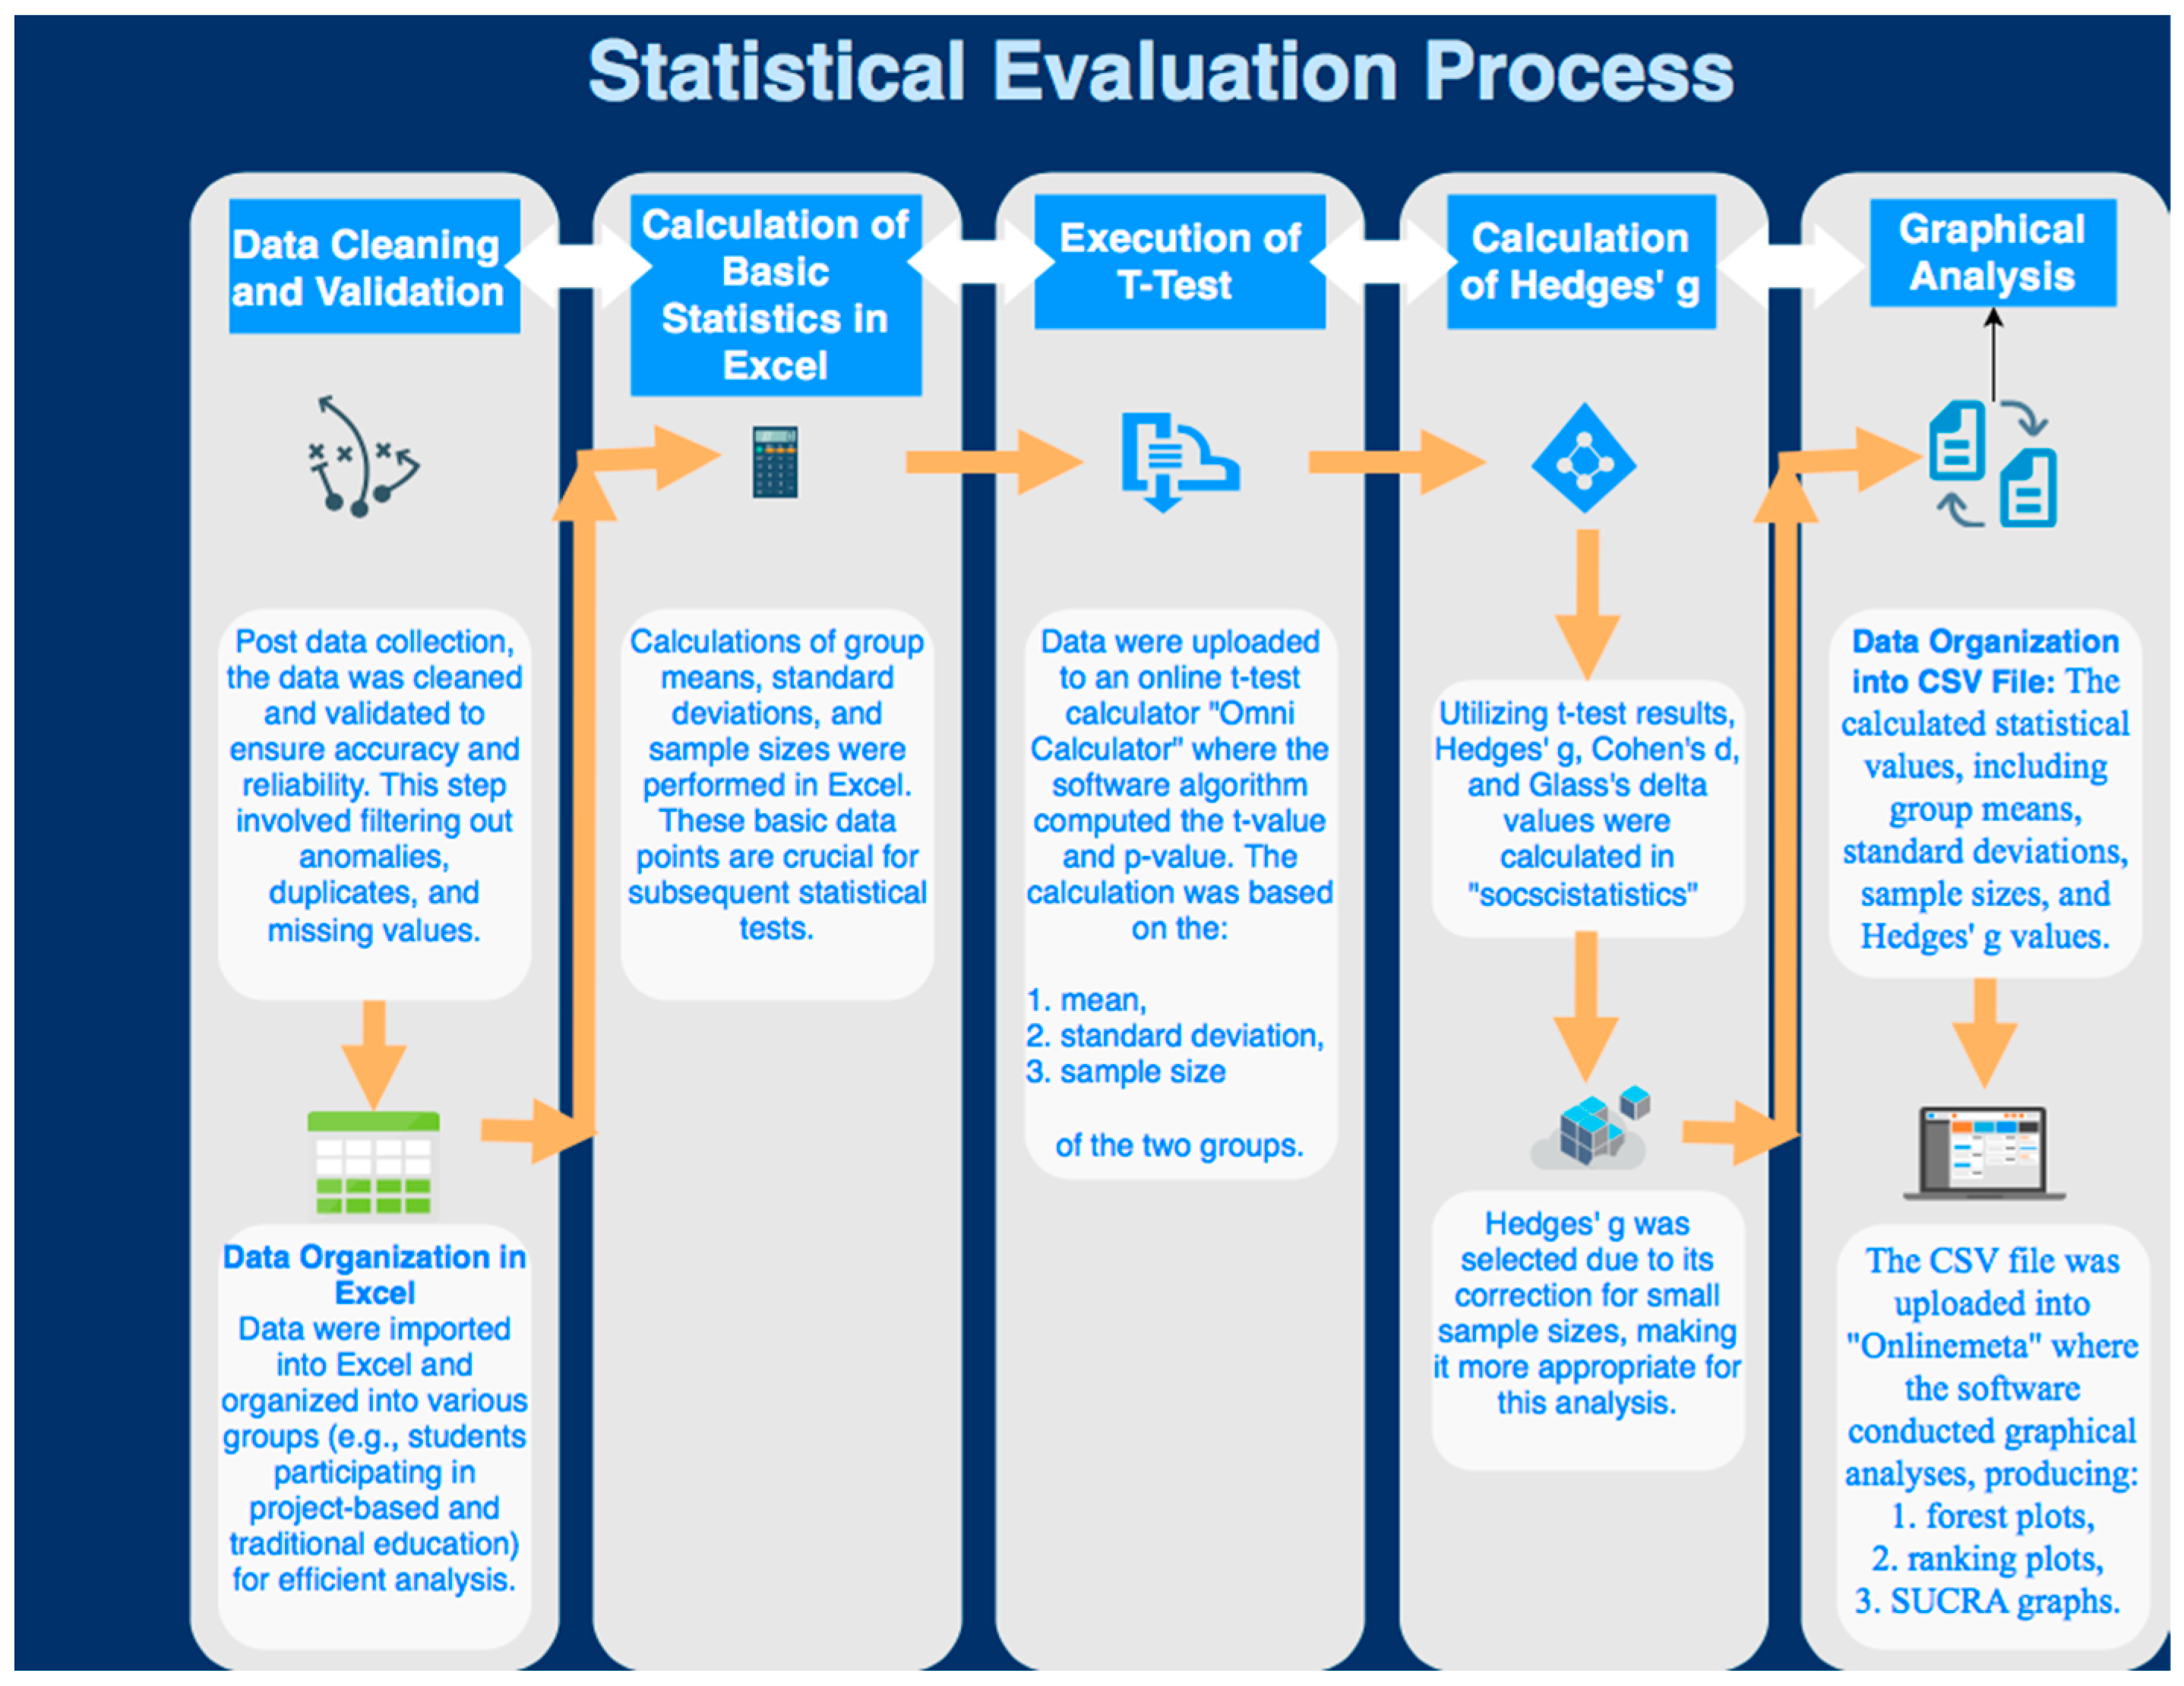
- Data cleaning and validation: The data are cleaned and validated after data collection to ensure accuracy and reliability. This step included the removal of anomalies, duplicates, and missing values.
- Data organisation in Excel: The data were imported into Excel and organised into different groups for efficient analysis (e.g., project-based and traditional education students). The first and second phases can be followed in the left column of Figure 3.
- Calculating basic statistics in Excel: Group averages, standard deviations, and sample sizes were calculated in Excel. There was no reason to use any other system for the task, so ease of access and use was the key. This may help the replicability of the experiment for other teaching and research groups.
- Conducting a t-test using online software: The data were uploaded to an online t-test calculator (https://www.omnicalculator.com/statistics/t-test accessed on 3 January 2024), where the software algorithm calculated the t-value and p-value. The calculation was based on the two groups’ mean, standard deviation, and sample size. Formula (2), the t-test formula, as follows, was used:
3.2. Statistical Results
3.2.1. Statistical Evaluation of the t-Test Results
- T-statistic: −1.746;
- p-value: 0.1000;
- The p-value is higher than the usual threshold for significance (usually 0.05), indicating that the difference between the two groups is not statistically significant.
- T-statistic: −5.555;
- p-value: 0.0001248;
- The very low p-value indicates that the difference between the two groups is statistically significant. The negative t-statistic indicates that the BSc group achieved better average results than the BSc control group.
- T-statistic: −2.051;
- p-value: 0.0485;
- The p-value is close to the conventional threshold of significance, suggesting that the difference between the two groups is statistically significant. The negative t-statistic indicates that the HVET group achieved better average scores than the HVET control group.
3.2.2. Impact Magnitude Analysis
- ·
- Learning outcome: there is no significant difference between the MSc group’s results for project-based (mean: 4.875) and non-project-based (mean: 4.700) teaching.
- ·
- Change in motivation: although there is a difference in motivation, it is not significant between project-based (mean: 4.600) and non-project-based (mean: 4.4286) education.
- ·
- Learning outcome: there is a significant difference between the BSc group’s results for project-based (mean: 4.700) and non-project-based (mean: 3.8571) education.
- ·
- Change in motivation: there is a significant difference in motivation between project-based (mean: 4.2500) and non-project-based (mean: 2.8333) education.
- ·
- Learning outcome: there is a measurable but not significant difference between project-based (mean: 4.6471) and non-project-based (mean: 4.1176) education for the HVET group.
- ·
- Change in motivation: the difference in change in motivation between project-based (mean: 4.1765) and non-project-based (mean: 3.4706) education is measurable but not significant.
3.2.3. Meta-Assignment
3.3. Interpreting the Results in Terms of Motivation to Learn
4. Discussion
4.1. Theoretical Background to Motivating Higher Education Students
- Encouraging positive behaviour and emphasising the value of work;
- Supporting autonomy;
- Facilitating imagination and result orientation.
4.2. Challenges to the Concept of Teaching
4.3. Education Strategies
4.4. Finding Solutions to Attract Students Who Drop Out
4.5. Horizontal and Vertical Comparisons between Groups
- The MSC group scored higher average scores in project-based and non-project-based teaching, indicating that they performed better than the BSC or HVET groups.
- For the BSC group, the average score of project-based learners was higher than that of traditional learners, which may indicate that project-based learning is more effective for them.
- The HVET group also had a higher average score for project-based education than the non-project-based group, demonstrating project-based education’s effectiveness.
4.6. Tests on the Effectiveness of the Experiment
- ·
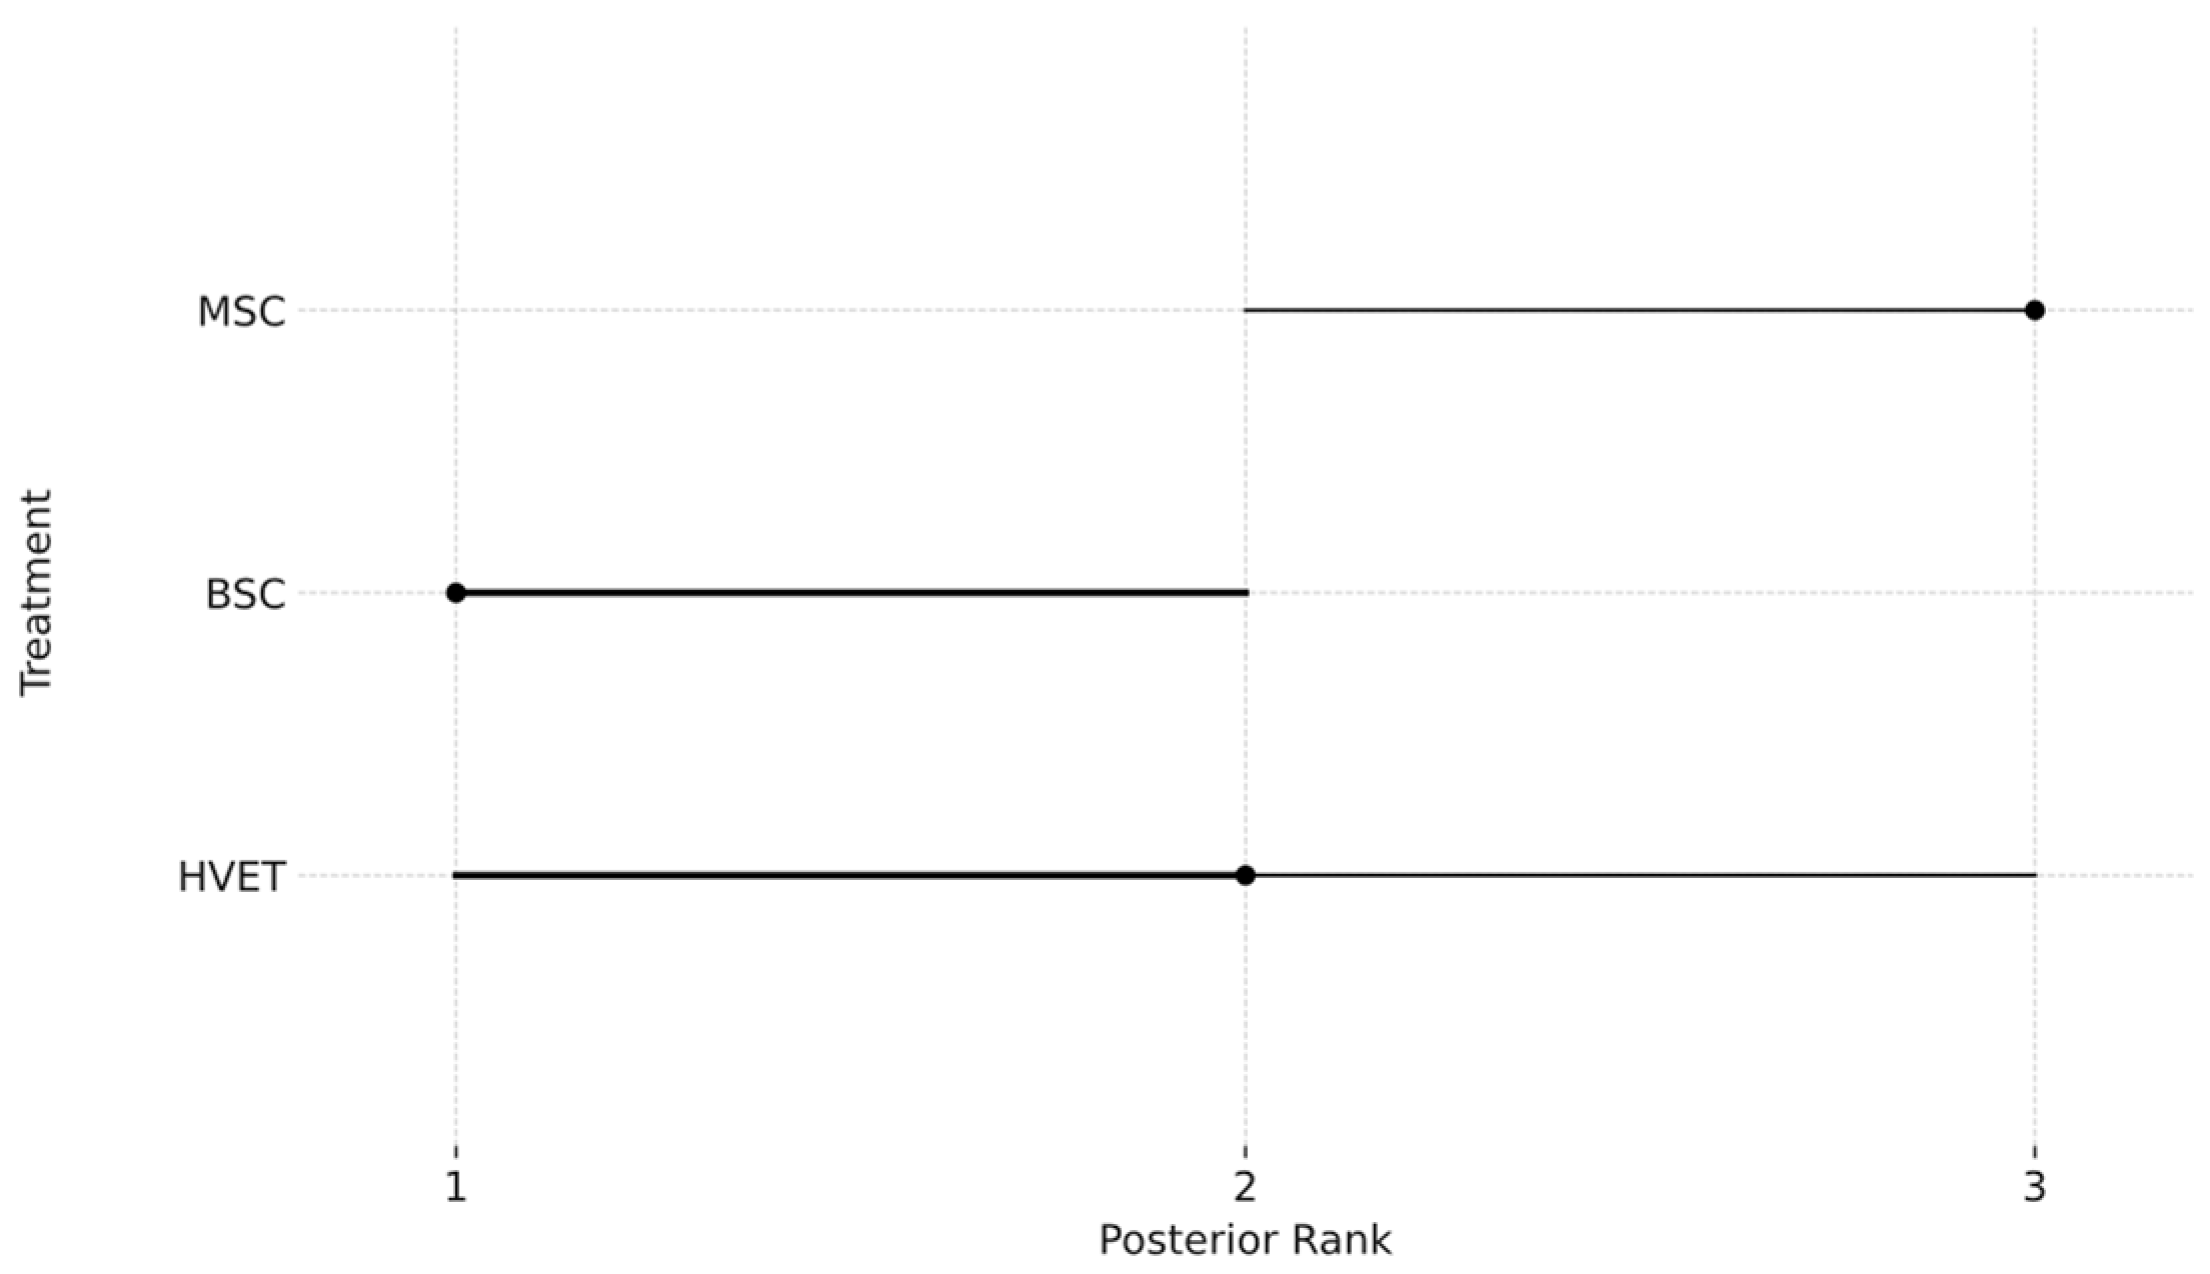
- MSc Group: In the graph, the score of the MSc group indicates that this group is the best post-ranking, which indicates that this group performed the best. The position of the dot and the interval line on the right-hand edge of the graph indicates that the MSc group is the most likely to have achieved the most favourable result.
- ·
- BSc Group: The BSc group is in the middle of the field regarding points and interval lines, with the second-best result. The width of the interval indicates uncertainty, but the central position of the point shows that the BSc group performs stably in the middle, i.e., for them, this training method is ideal.
- ·
- HVET group: The point and interval line of the HVET group is at the bottom of the graph, showing that this group was the least efficient. However, the end of the interval extends into the middle range, which may indicate uncertainty in the evaluation of the results, and it is advisable to extend and fine-tune the proxy method in the future.
4.7. The Role of Trainers in the Effectiveness of Experiments
4.8. Summary of Results from a Hypotheses Perspective
4.9. Presentation of the Limitations of the Research and Further Research Opportunities
5. Conclusions
Funding
Institutional Review Board Statement
Informed Consent Statement
Data Availability Statement
Conflicts of Interest
References
- Sharma, L.; Shree, S. Exploring the Online and Blended Modes of Learning for Post-COVID-19: A Study of Higher Education Institutions. Educ. Sci. 2023, 13, 142. [Google Scholar] [CrossRef]
- Karatsiori, M. In the pursuit of “Quality Education”: From ancient times to the digital era—Can there be a consensus? Cogent Educ. 2023, 10, 2286817. [Google Scholar] [CrossRef]
- Flores, E.; Xu, X.; Lu, Y. Human Capital 4.0: A Workforce Competence Typology for Industry 4.0. J. Manuf. Technol. Manag. 2020, 31, 687–703. [Google Scholar] [CrossRef]
- Bratianu, C.; Hadad, S.; Bejinaru, R. Paradigm Shift in Business Education: A Competence-Based Approach. Sustainability 2020, 12, 1348. [Google Scholar] [CrossRef]
- Kipper, L.M.; Iepsen, S.; Dal Forno, A.J.; Frozza, R.; Furstenau, L.; Agnes, J.; Cossul, D. scientific mapping to identify competencies required by industry 4.0. Technol. Soc. 2021, 64, 101454. [Google Scholar] [CrossRef]
- Williams, L.; Nixon, S.; Hennessy, C.; Mahon, E.; Adams, G. Inspiring to inspire: Developing teaching in higher education. Cogent Educ. 2016, 3, 1154259. [Google Scholar] [CrossRef]
- Miranda, J.; Navarrete, C.; Noguez, J.; Molina-Espinosa, J.-M.; Ramírez-Montoya, M.-S.; Navarro-Tuch, S.A.; Bustamante-Bello, M.-R.; Rosas-Fernández, J.-B.; Molina, A. The Core Components of Education 4.0 in Higher Education: Three Case Studies in Engineering Education. Comput. Electr. Eng. 2021, 93, 107278. [Google Scholar] [CrossRef]
- Muca, E.; Cavallini, D.; Raspa, F.; Bordin, C.; Bergero, D.; Valle, E. Integrating New Learning Methods into Equine Nutrition Classrooms: The Importance of Students’ Perceptions. J. Equine Vet. Sci. 2023, 126, 104537. [Google Scholar] [CrossRef] [PubMed]
- Omulu, F.A. Correlation of Employment Status, Motivation, and Achievement in Learning. J. Glasser 2024. Available online: https://lonsuit.unismuhluwuk.ac.id/glasser/article/view/17 (accessed on 12 February 2024).
- Blasco-Belled, A.; Alsinet, C. The architecture of psychological well-being: A network analysis study of the Ryff Psychological Well-Being Scale. Scand. J. Psychol. 2022, 63, 199–207. [Google Scholar] [CrossRef] [PubMed]
- Mohiuddin, K.; Islam, M.A.; Sharif, M.; Nur, S.; Talukder, M.S.; Alghobiri, M.A. Enumeration of Potential Teaching Methods in Higher Education: A Cross-Disciplinary Study. Educ. Res. Int. 2020, 2020, 8870412. [Google Scholar] [CrossRef]
- Baskoro, F.; Suprianto, B.; Anifah, L.; Indriyani, Y.A. Beyond Smart Devices: Fostering Critical, Communication and Collaborative Thinking in IoT-Based Sensor and Actuator Competence Learning Outcomes. TEM J. 2023, 12, 2396–2407. [Google Scholar] [CrossRef]
- Widera, P.; Welsing, P.M.J.; Danso, S.O.; Peelen, S.; Kloppenburg, M.; Loef, M.; Marijnissen, A.C.; van Helvoort, E.M.; Blanco, F.J.; Magalhães, J.; et al. Patients from existing cohorts across five European clinical centres were identified and enrolled into the IMI-APPROACH study using a two-stage recruitment process. Osteoarthr. Cartil. Open 2023, 5, 100406. [Google Scholar] [CrossRef]
- Csikszentmihalyi, M.; Csikszentmihalyi, I.S. Optimal Experience: Psychological Studies of Flow in Consciousness; Cambridge University Press: Cambridge, UK, 1988. [Google Scholar] [CrossRef]
- Thissen, B.A.K.; Menninghaus, W.; Schlotz, W. Measuring Optimal Reading Experiences: The Reading Flow Short Scale. Front. Psychol. 2018, 9, 2542. [Google Scholar] [CrossRef]
- Thacker, B.H.; Doebling, S.W.; Hemez, F.M.; Anderson, M.C.; Pepin, J.E.; Rodriguez, E.A. Concepts of Model Verification and Validation (LA--14167); Los Alamos National Lab.: Los Alamos, NM, USA, 2004. [Google Scholar] [CrossRef]
- Inegbedion, G.; Islam, M.M. youth motivations to study agriculture in tertiary institutions. J. Agric. Educ. Ext. 2020, 26, 497–512. [Google Scholar] [CrossRef]
- Abramovich, S.; Grinshpan, A.Z.; Milligan, D.L. Teaching Mathematics through Concept Motivation and Action Learning. Educ. Res. Int. 2019, 2019, 3745406. [Google Scholar] [CrossRef]
- Santos, A.I.; Serpa, S. Flipped classroom for an active learning. J. Educ. E-Learn. Res. 2020, 7, 167–173. [Google Scholar] [CrossRef]
- Matthews, A.; McLinden, M.; Greenway, C. Rising to the pedagogical challenges of the Fourth Industrial Age in the university of the future: An integrated model of scholarship. High. Educ. Pedag. 2021, 6, 1–21. [Google Scholar] [CrossRef]
- Ngereja, B.; Hussein, B.; Andersen, B. Does Project-Based Learning (PBL) Promote Student Learning? A Performance Evaluation. Educ. Sci. 2020, 10, 330. [Google Scholar] [CrossRef]
- Apriandi, D.; Retnawati, H.; Abadi, A.M. Factors Influencing Students’ Motivation in Learning: A Comprehensive Review. TEM J. 2022, 11, 1494–1499. [Google Scholar] [CrossRef]
- Almulla, M.A. The Effectiveness of the Project-Based Learning (PBL) Approach as a Way to Engage Students in Learning. SAGE Open 2020, 10, 1–15. [Google Scholar] [CrossRef]
- Guo, P.; Saab, N.; Post, L.S.; Admiraal, W. A Review of Project-Based Learning in Higher Education: Student Outcomes and Measures. Int. J. Educ. Res. 2020, 102, 101586. [Google Scholar] [CrossRef]
- Ozdamli, F.; Turan, B. Effects of a Technology Supported Project Based Learning (TS-PBL) Approach on the Success of a Mobile Application Development Course and the Students’ Opinions. TEM J. 2017, 6, 258–264. [Google Scholar] [CrossRef]
- Sanchez-De Miguel, M.; Orkaizagirre-Gomara, A.; Izagirre-Otaegi, A.; Badiola, I.; Ortiz de Elguea-Díaz, F.J.; Gomez-Gastiasoro, A.; Ferriz-Valero, A.; Goudas, M. Association among University Students’ Motivational Resilience, Perceived Competence and Classroom Climate from the Perspective of Self-Determination Theory. Educ. Sci. 2023, 13, 147. [Google Scholar] [CrossRef]
- Katal, A.; Singh, V.K.; Choudhury, T.; Imran, F. Enhancing Teaching and Learning through Peer Observation: An Indian Case Study. Educ. Res. Int. 2022, 2022, 7825178. [Google Scholar] [CrossRef]
- Wigfield, A.; Cambria, J.; Eccles, J.S. Motivation in education. In The Oxford Handbook of Human Motivation; Ryan, R.M., Ed.; Oxford University Press: Oxford, UK, 2012. [Google Scholar] [CrossRef]
- Eccles, J.S.; Wigfield, A. From expectancy-value theory to situated expectancy-value theory: A developmental, social cognitive, and sociocultural perspective on motivation. Contemp. Educ. Psychol. 2020, 61, 101859. [Google Scholar] [CrossRef]
- Wigfield, A. Expectancy-value theory of achievement motivation: A developmental perspective. Educ. Psychol. Rev. 1994, 6, 49–78. [Google Scholar] [CrossRef]

| Names of Different Groups | Group Features | Number of Students in the Two Academic Years (n) |
|---|---|---|
| MSC | control group | 10 |
| BSC | control group | 7 |
| HVET | control group | 17 |
| MSC | project group | 10 |
| BSC | project group | 8 |
| HVET | project group | 17 |
| MSC | all | 20 |
| BSC | all | 15 |
| HVET | all | 34 |
| project group | all | 35 |
| control group | all | 34 |
| total sample size | all | 69 |
| Treatment | Trt_Class | Average | Std.dev | n |
|---|---|---|---|---|
| MSC | result group no project | 4.7000 | 0.4583 | 10 |
| BSC | result group no project | 3.8571 | 0.6389 | 7 |
| HVET | result group no project | 4.1176 | 0.9630 | 17 |
| MSC | result group project | 4.8750 | 0.3307 | 10 |
| BSC | result group project | 4.7000 | 0.4583 | 8 |
| HVET | result group project | 4.6471 | 0.5882 | 17 |
| MSC | motivation change no project | 4.4286 | 0.7284 | 10 |
| BSC | motivation change no project | 2.8333 | 0.6872 | 7 |
| HVET | motivation change no project | 3.4706 | 1.1437 | 17 |
| MSC | motivation change project | 4.6000 | 0.4899 | 10 |
| BSC | motivation change project | 4.2500 | 0.4330 | 8 |
| HVET | motivation change project | 4.1765 | 0.6169 | 17 |
Disclaimer/Publisher’s Note: The statements, opinions and data contained in all publications are solely those of the individual author(s) and contributor(s) and not of MDPI and/or the editor(s). MDPI and/or the editor(s) disclaim responsibility for any injury to people or property resulting from any ideas, methods, instructions or products referred to in the content. |
© 2024 by the author. Licensee MDPI, Basel, Switzerland. This article is an open access article distributed under the terms and conditions of the Creative Commons Attribution (CC BY) license (https://creativecommons.org/licenses/by/4.0/).
Share and Cite
Köpeczi-Bócz, T. The Impact of a Combination of Flipped Classroom and Project-Based Learning on the Learning Motivation of University Students. Educ. Sci. 2024, 14, 240. https://doi.org/10.3390/educsci14030240
Köpeczi-Bócz T. The Impact of a Combination of Flipped Classroom and Project-Based Learning on the Learning Motivation of University Students. Education Sciences. 2024; 14(3):240. https://doi.org/10.3390/educsci14030240
Chicago/Turabian StyleKöpeczi-Bócz, Tamás. 2024. "The Impact of a Combination of Flipped Classroom and Project-Based Learning on the Learning Motivation of University Students" Education Sciences 14, no. 3: 240. https://doi.org/10.3390/educsci14030240
APA StyleKöpeczi-Bócz, T. (2024). The Impact of a Combination of Flipped Classroom and Project-Based Learning on the Learning Motivation of University Students. Education Sciences, 14(3), 240. https://doi.org/10.3390/educsci14030240