


Seeing Eye to Eye? Comparing Faculty and Student Perceptions of Biomolecular Visualization Assessments

 , , , , , , , , , and
Abstract
1. Introduction
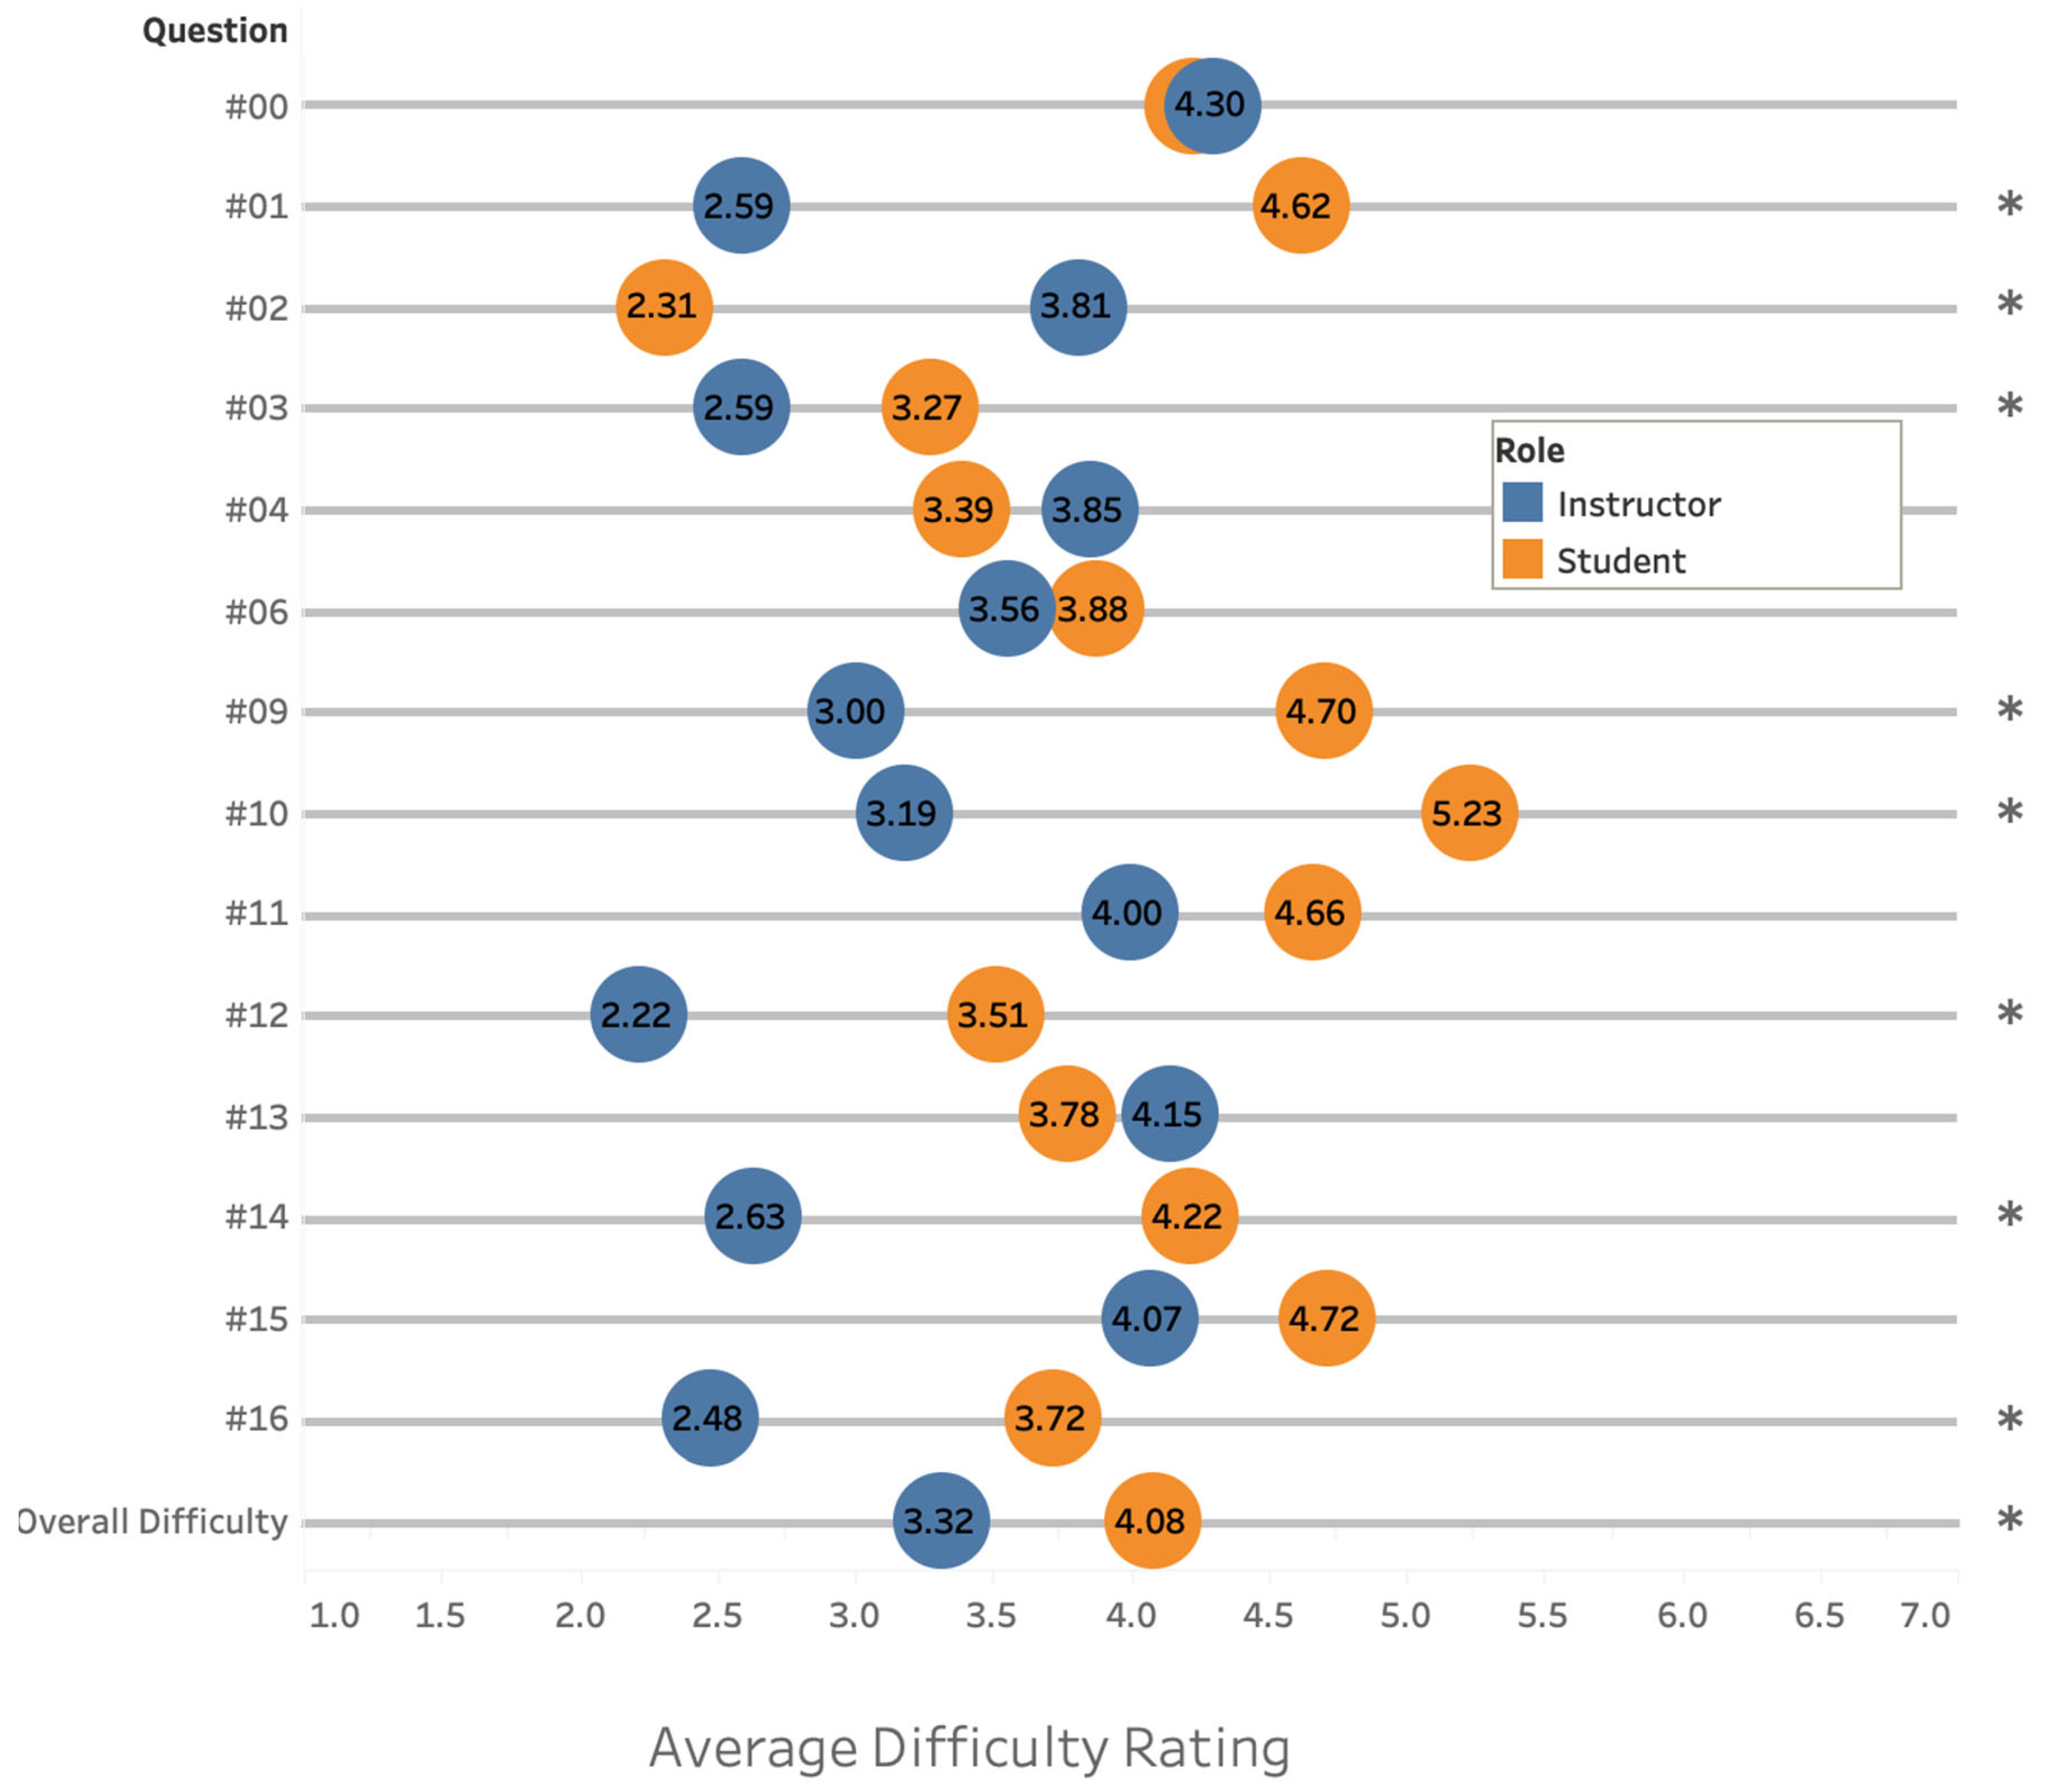
- RQ1: Which assessment items exhibit statistically significant disparities or agreements in perceptions of difficulty between instructors and students?
- RQ2: What differences in perceived difficulty persist between instructors and students even after controlling for race/ethnicity and gender?
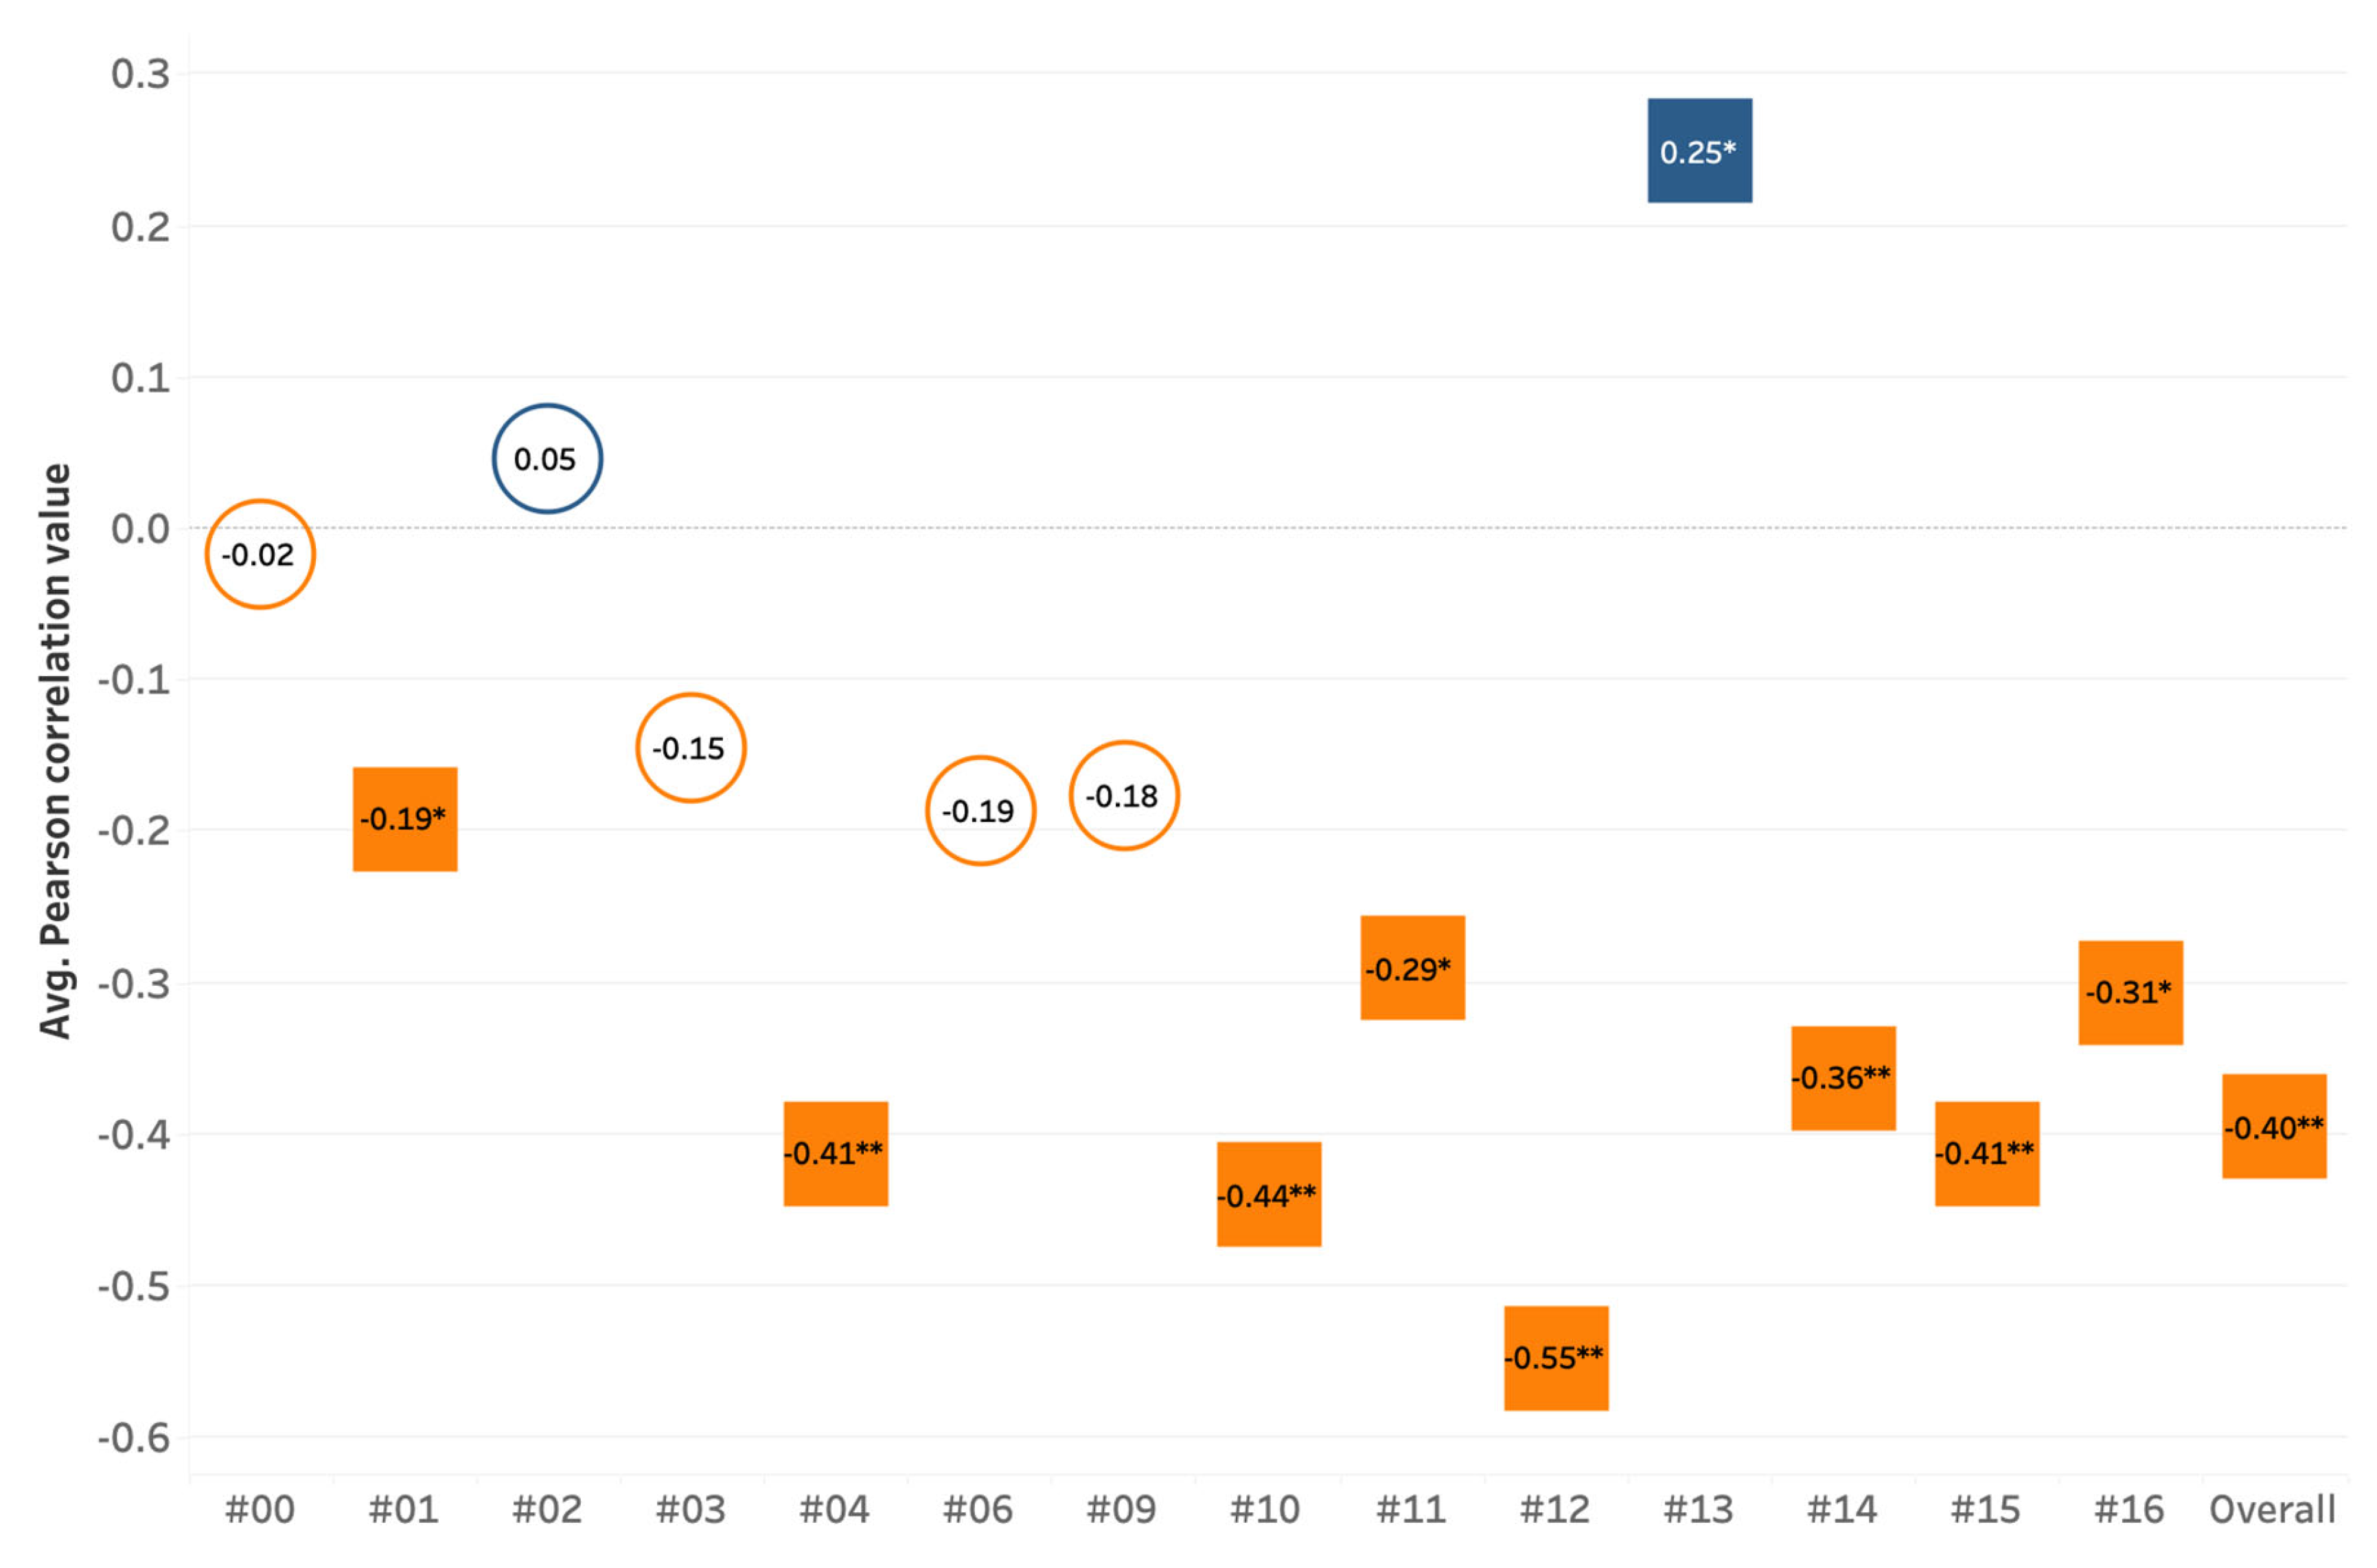
- RQ3: How does student perception of difficulty relate to performance on the assessment?
- RQ4: What predominant themes related to visual problem solving emerge from open-ended feedback that could guide visual literacy instruction and assessment?
2. Literature Review
3. Materials and Methods
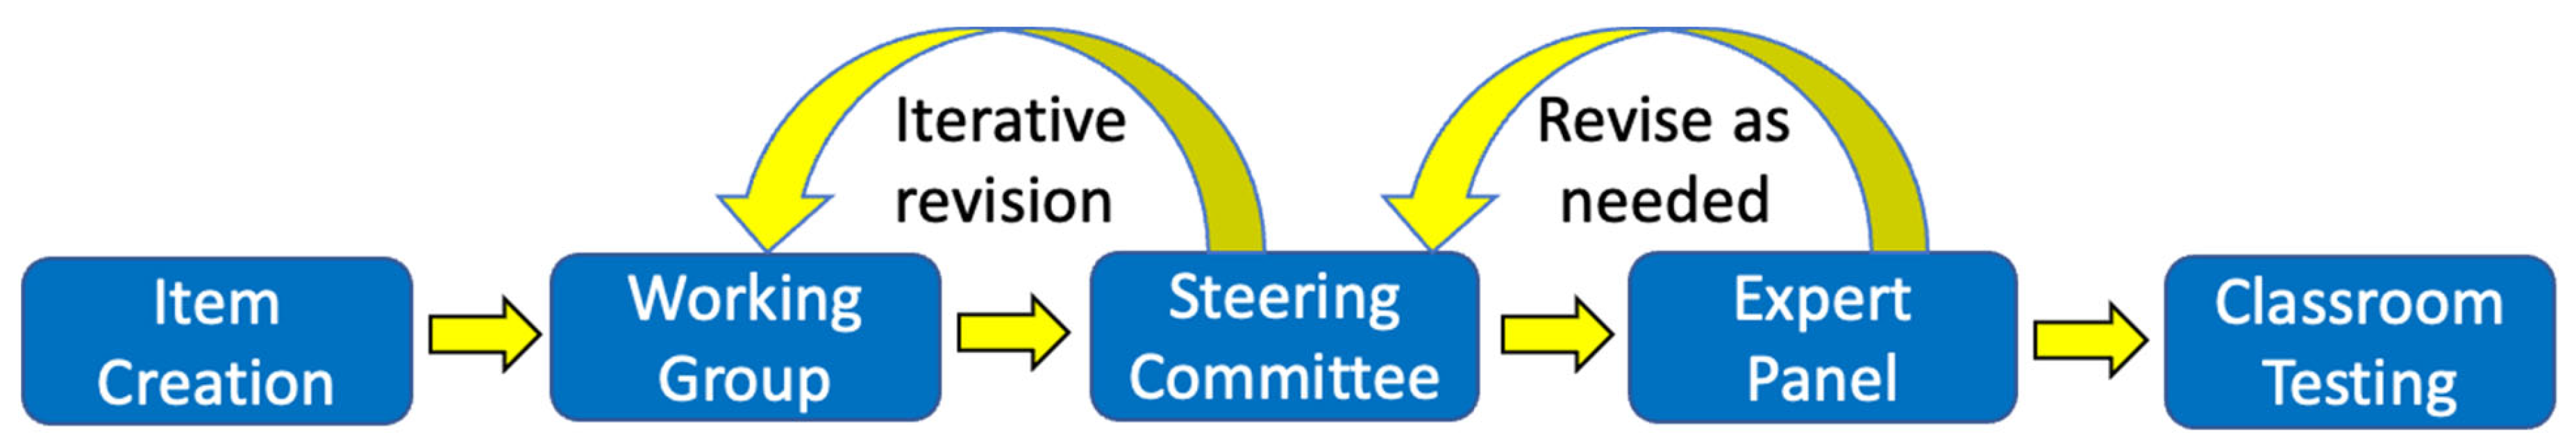
3.1. Assessment Development
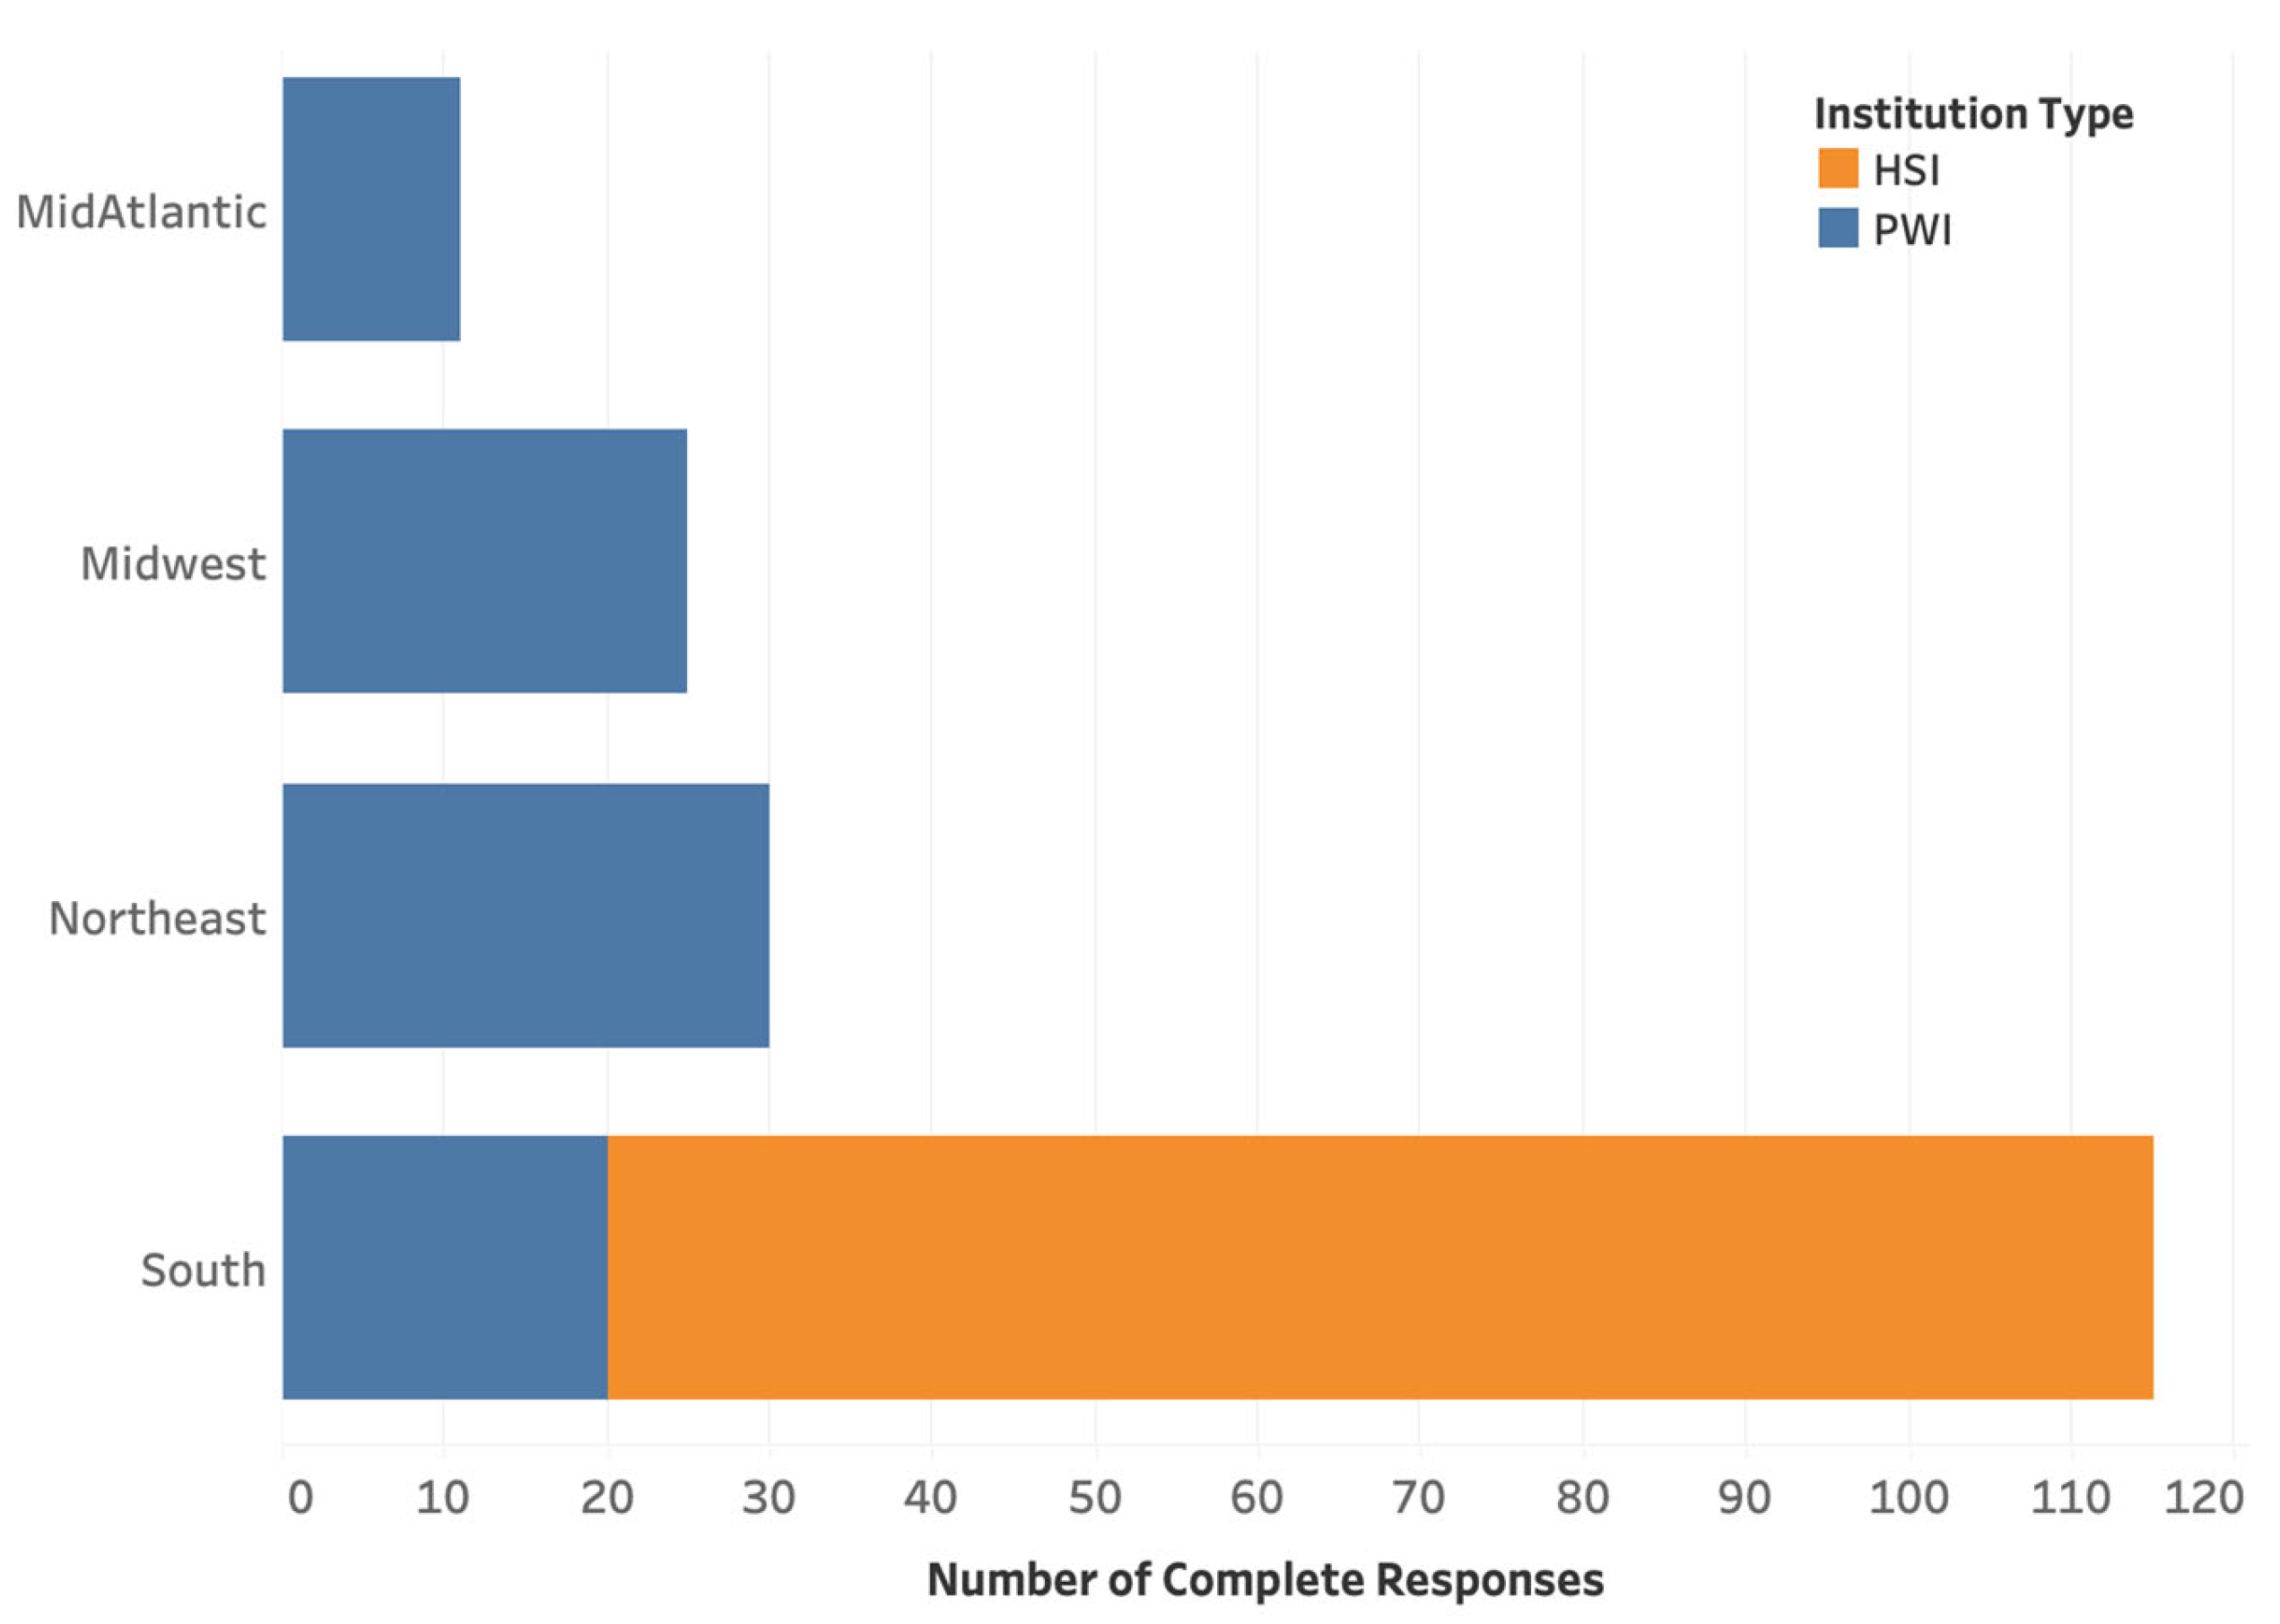
3.2. Survey Design and Administration
3.2.1. Student Survey
3.2.2. Faculty Survey
3.2.3. Data Analysis
4. Results and Discussion
Overview of Student Performance
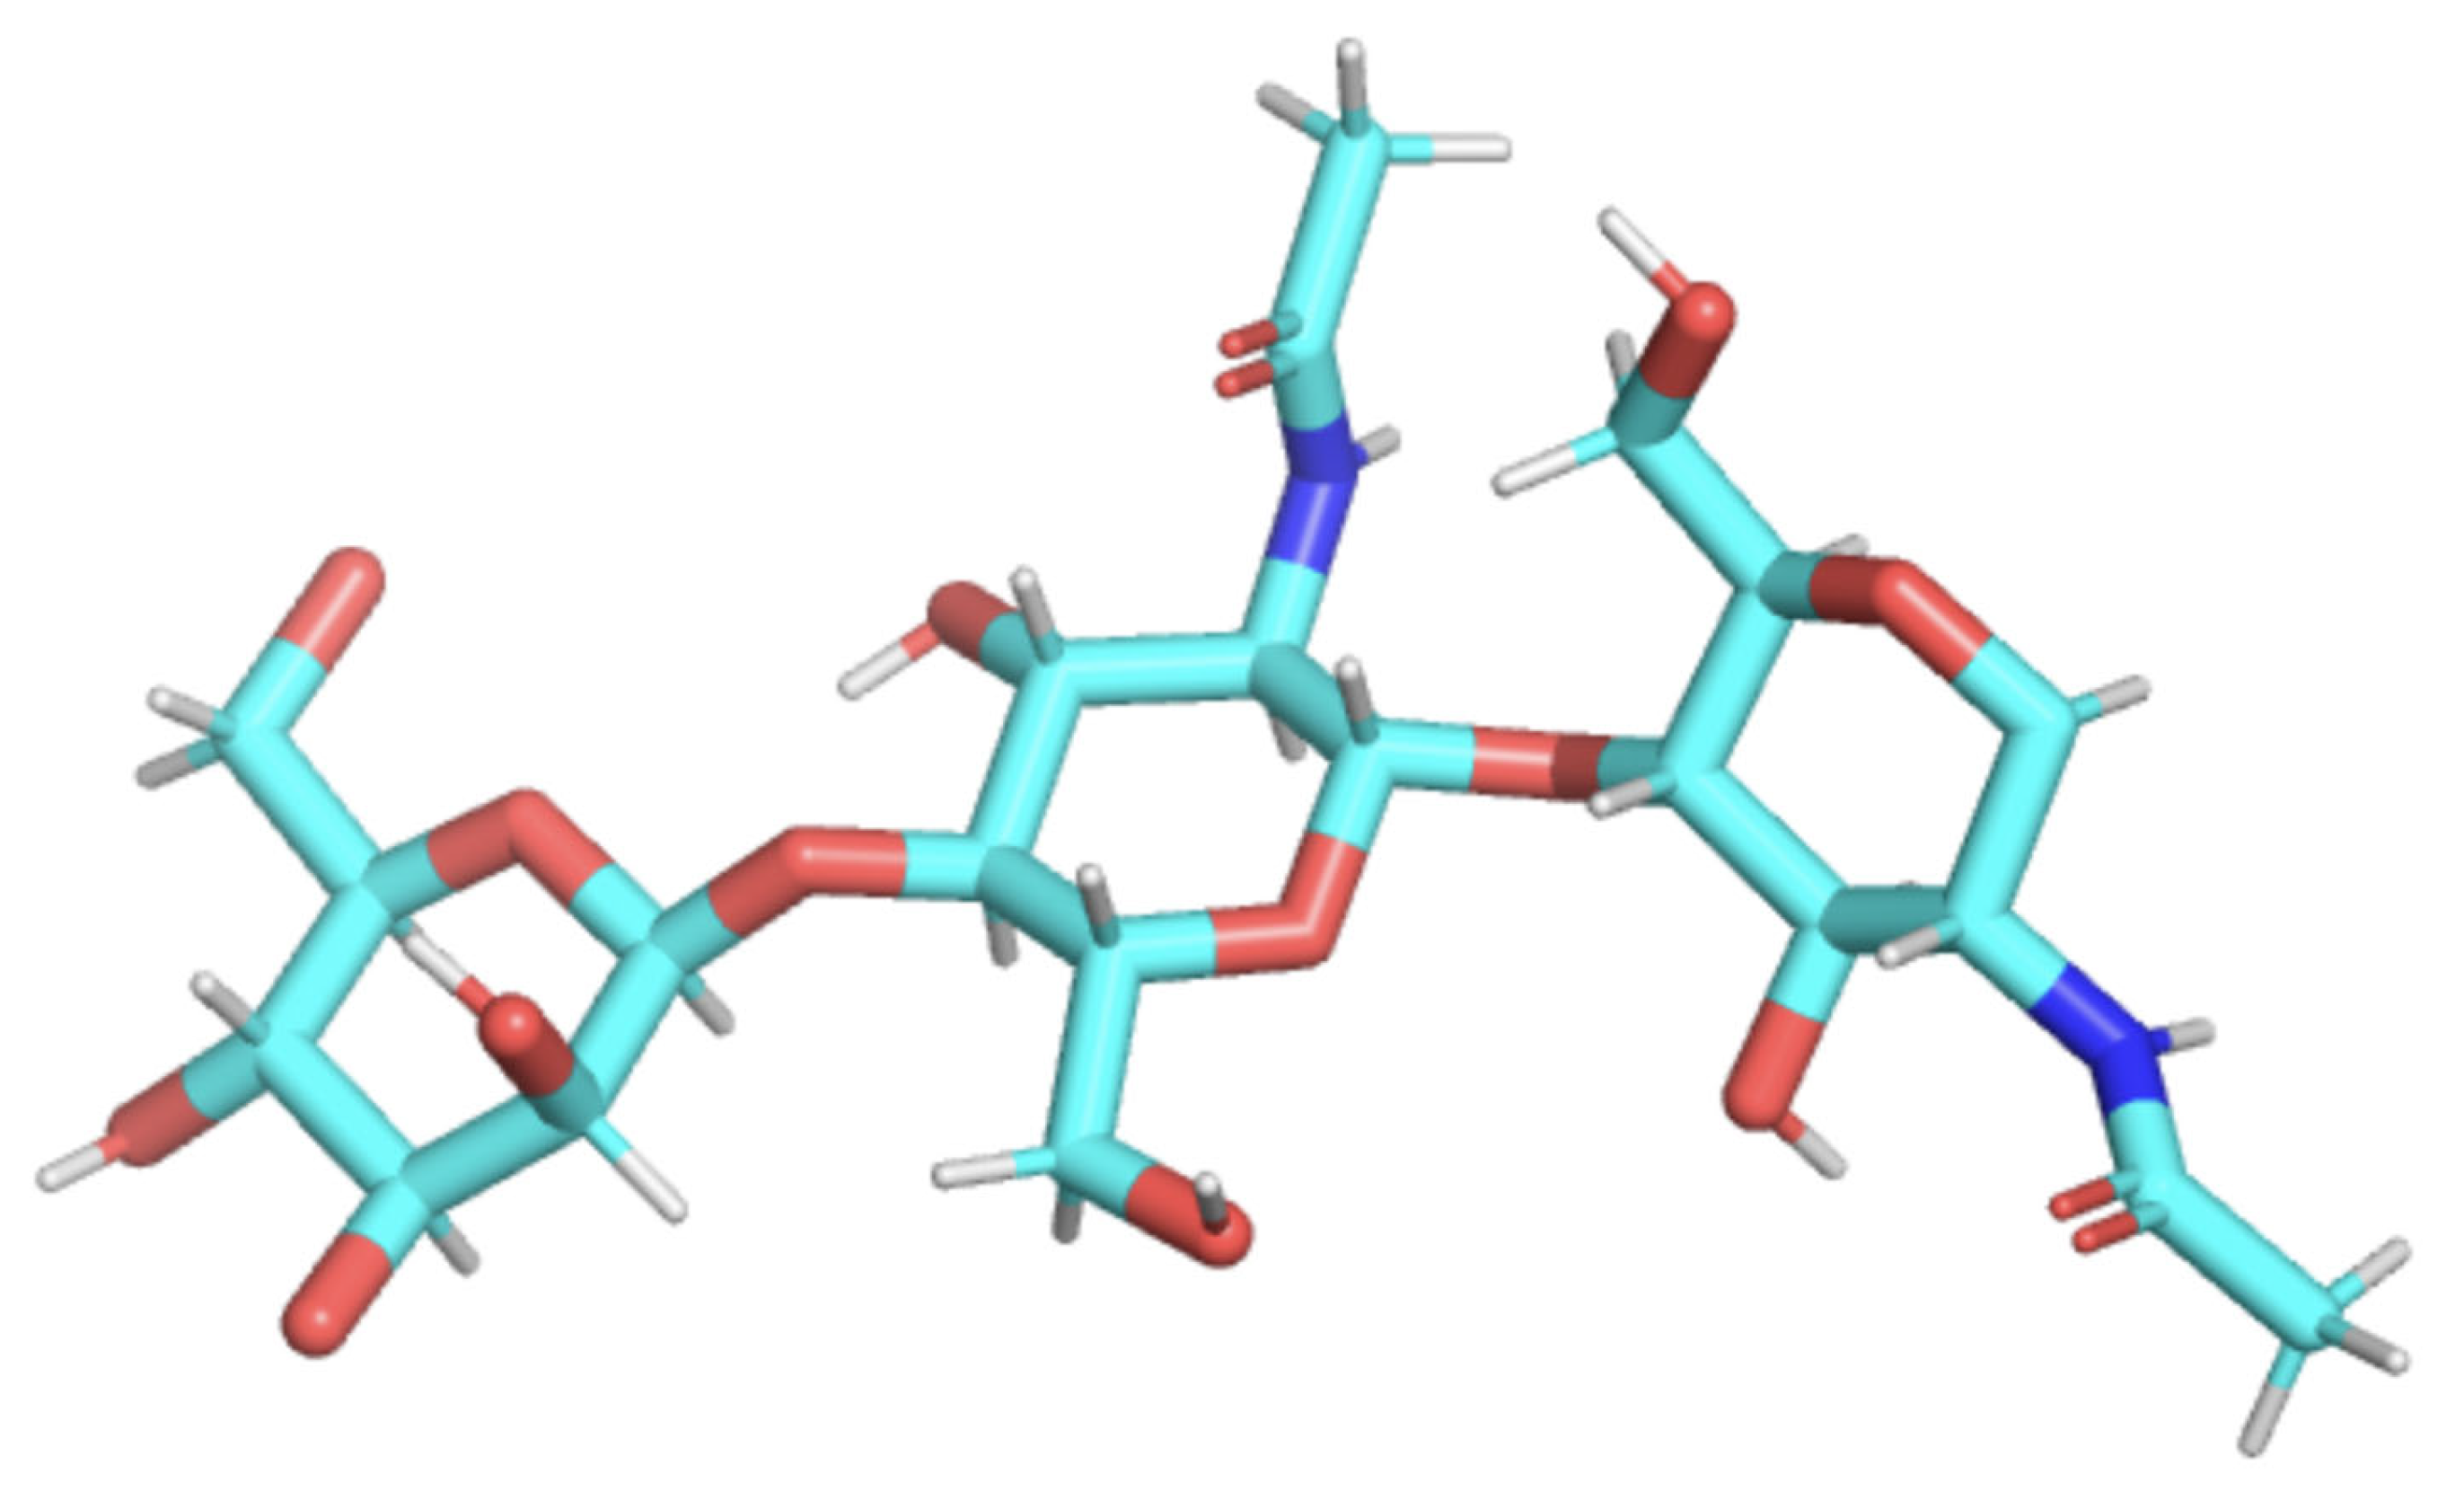
It has no phosphorus and contains amine. It’s also very ringy so I’m guessing it’s glycopeptide but I’m not sure.
This is a great assessment; I actually like that the N-terminal end isn’t at the far left side of the image because I think that students would automatically go there. This item really tests to see if students can map two-dimensional drawings onto a 3D image.
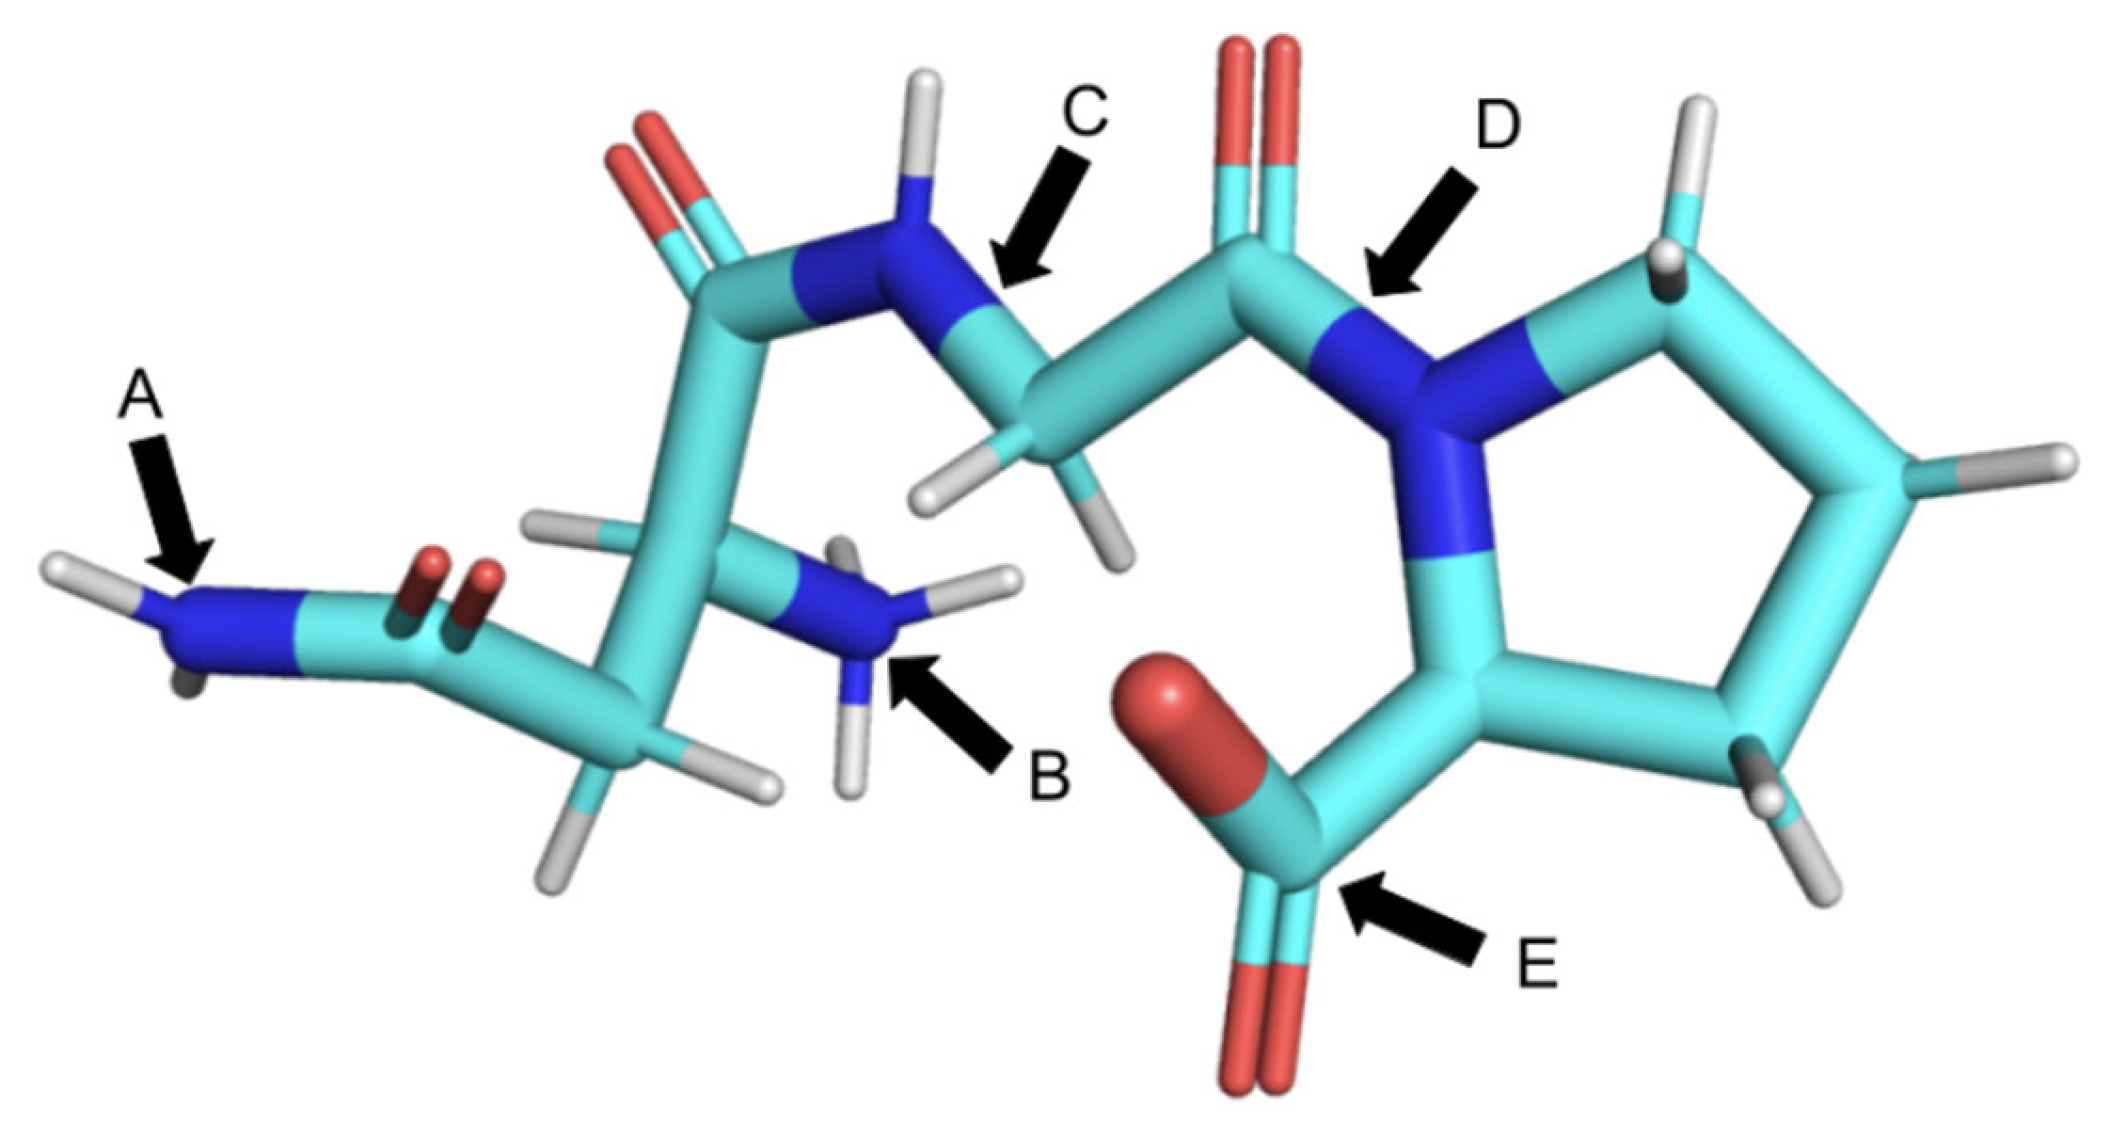
N-terminus does not contain another carbonyl group that often characterizes amino acids. It is a lone amino group.
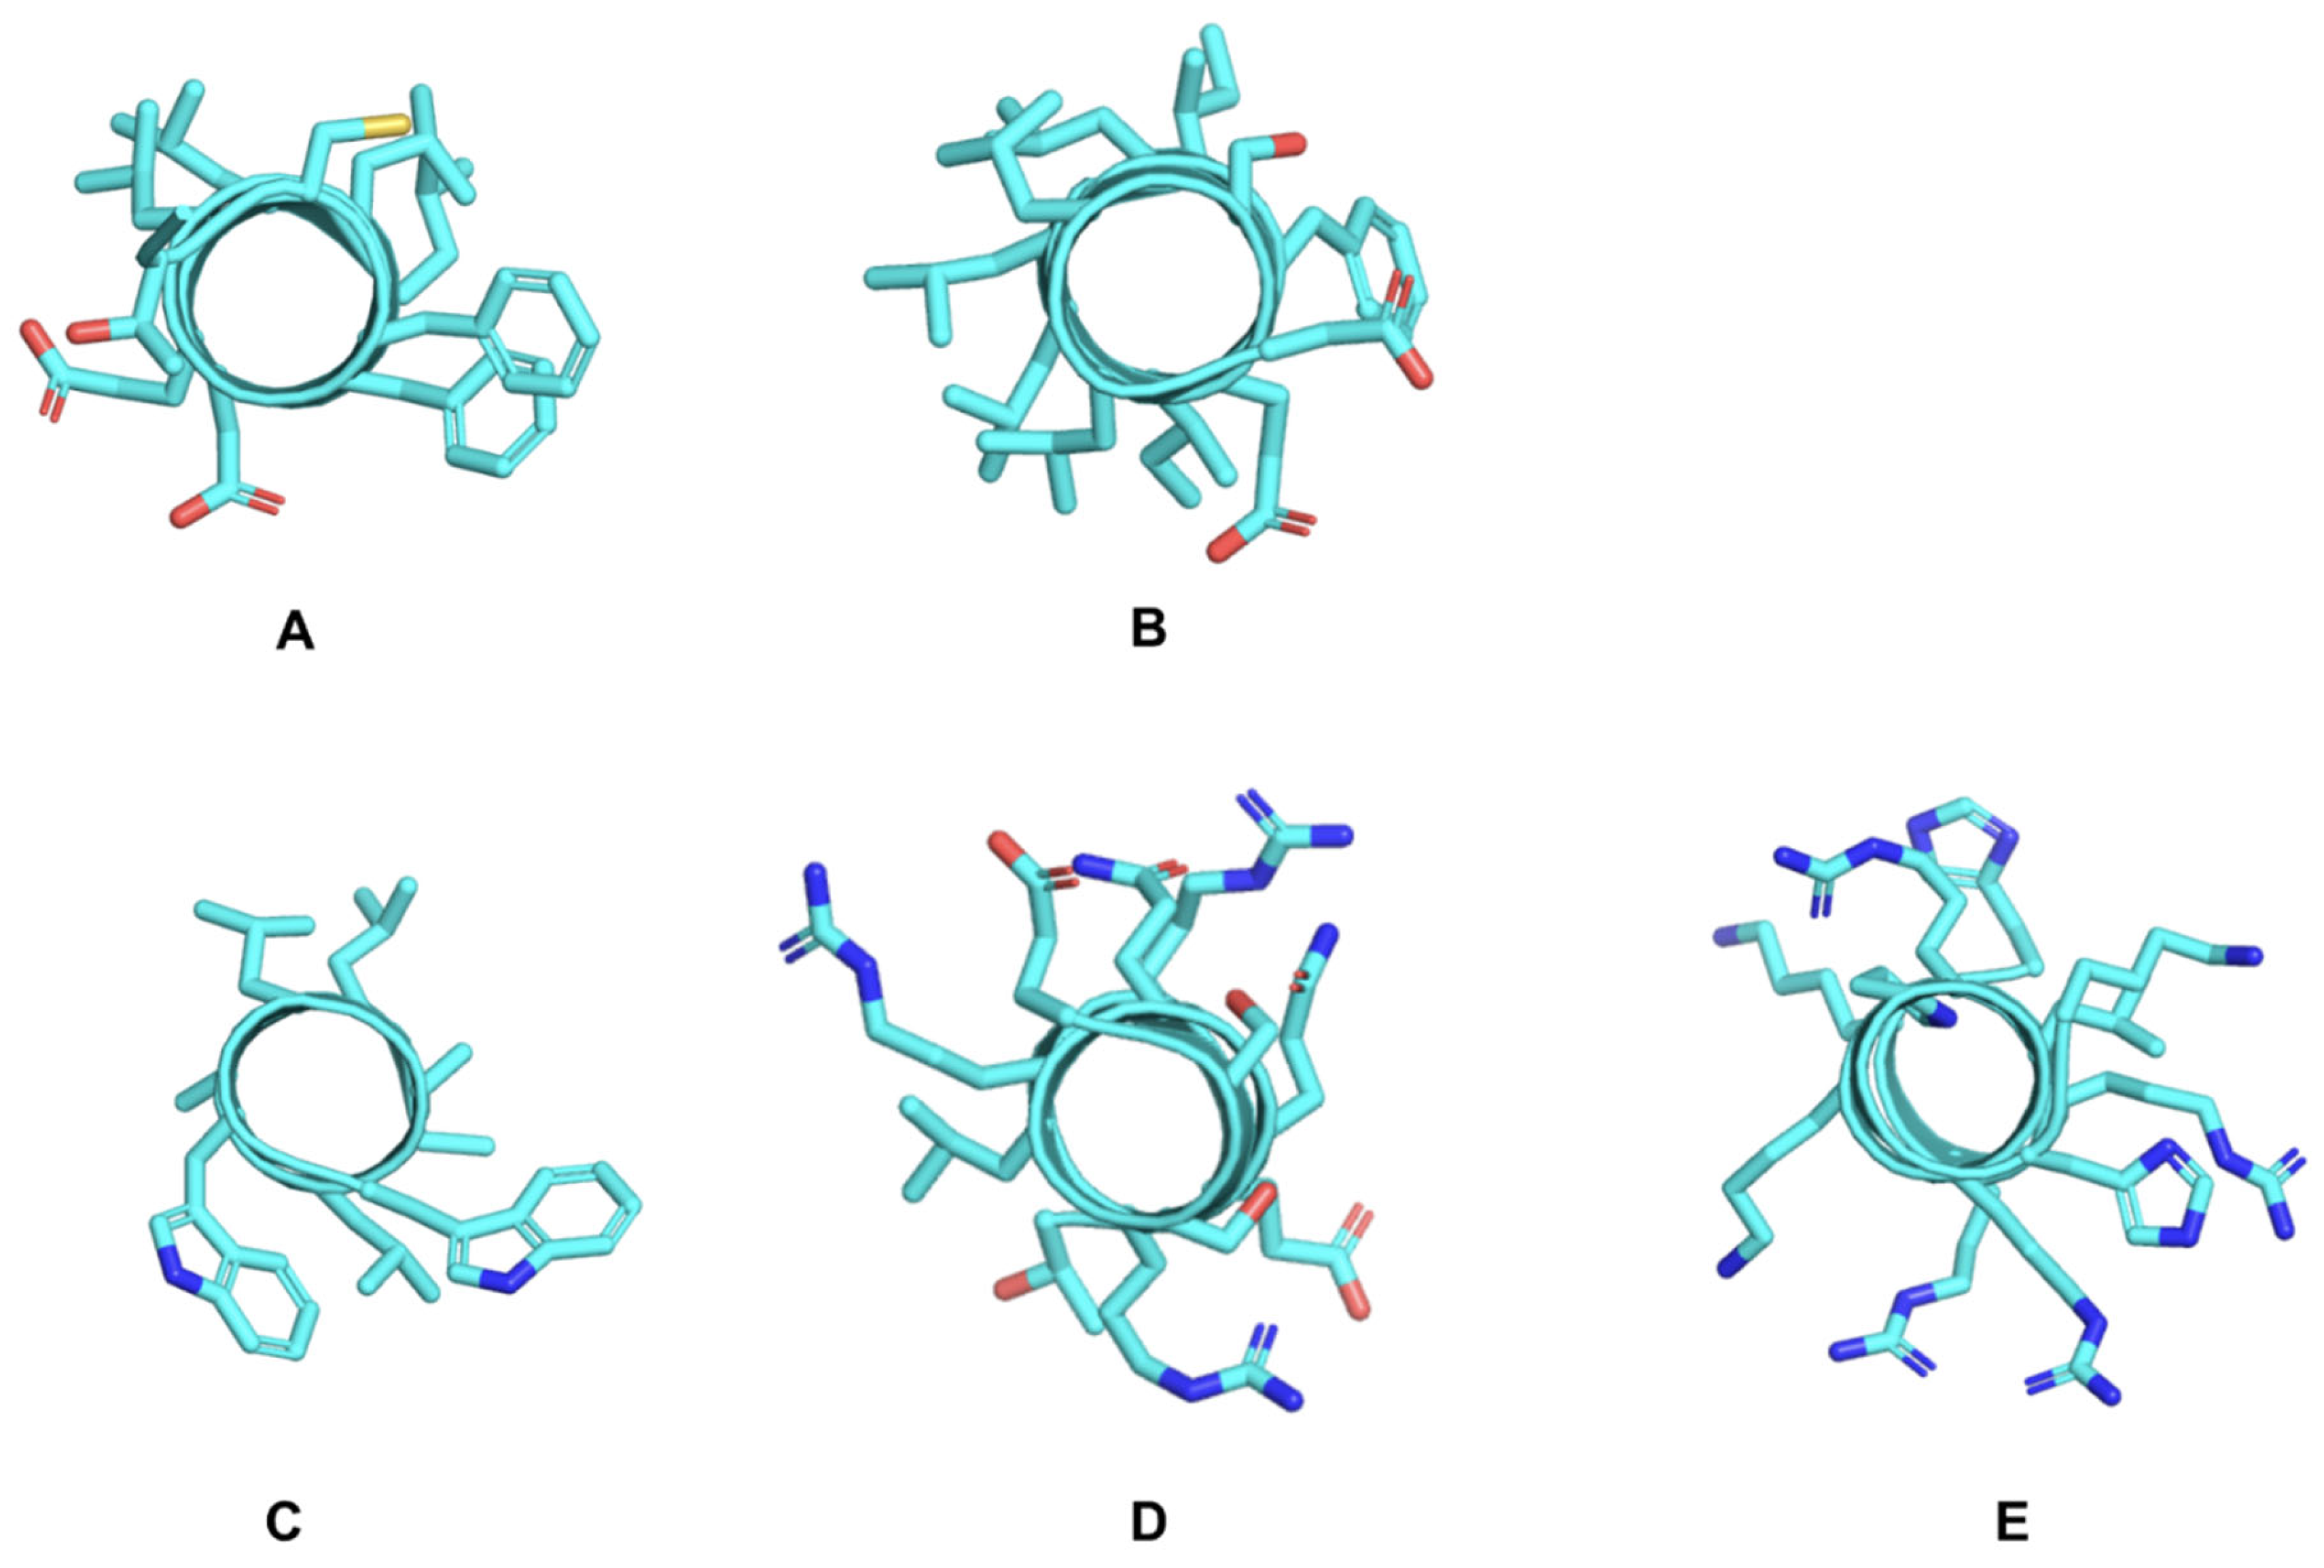
Without being able to rotate the structures to see the linear view of the amino acids, some students would be stumped. Others could look at the side chains and realize that some of the amino acid residues in question are not in some of the structures and determine which structure contains them all. This question relies on student recognition of amino acid side chains and has sort of a “puzzle component” that requires learners to realize that they do not need to view the molecule as a linear structure to answer the question. This question depicts the protein helix beautifully and will help students understand how helices interact.
This was very hard to visualize. It honestly looks like a wobbly corkscrew pasta and feels like an ineffective way to model these structures.
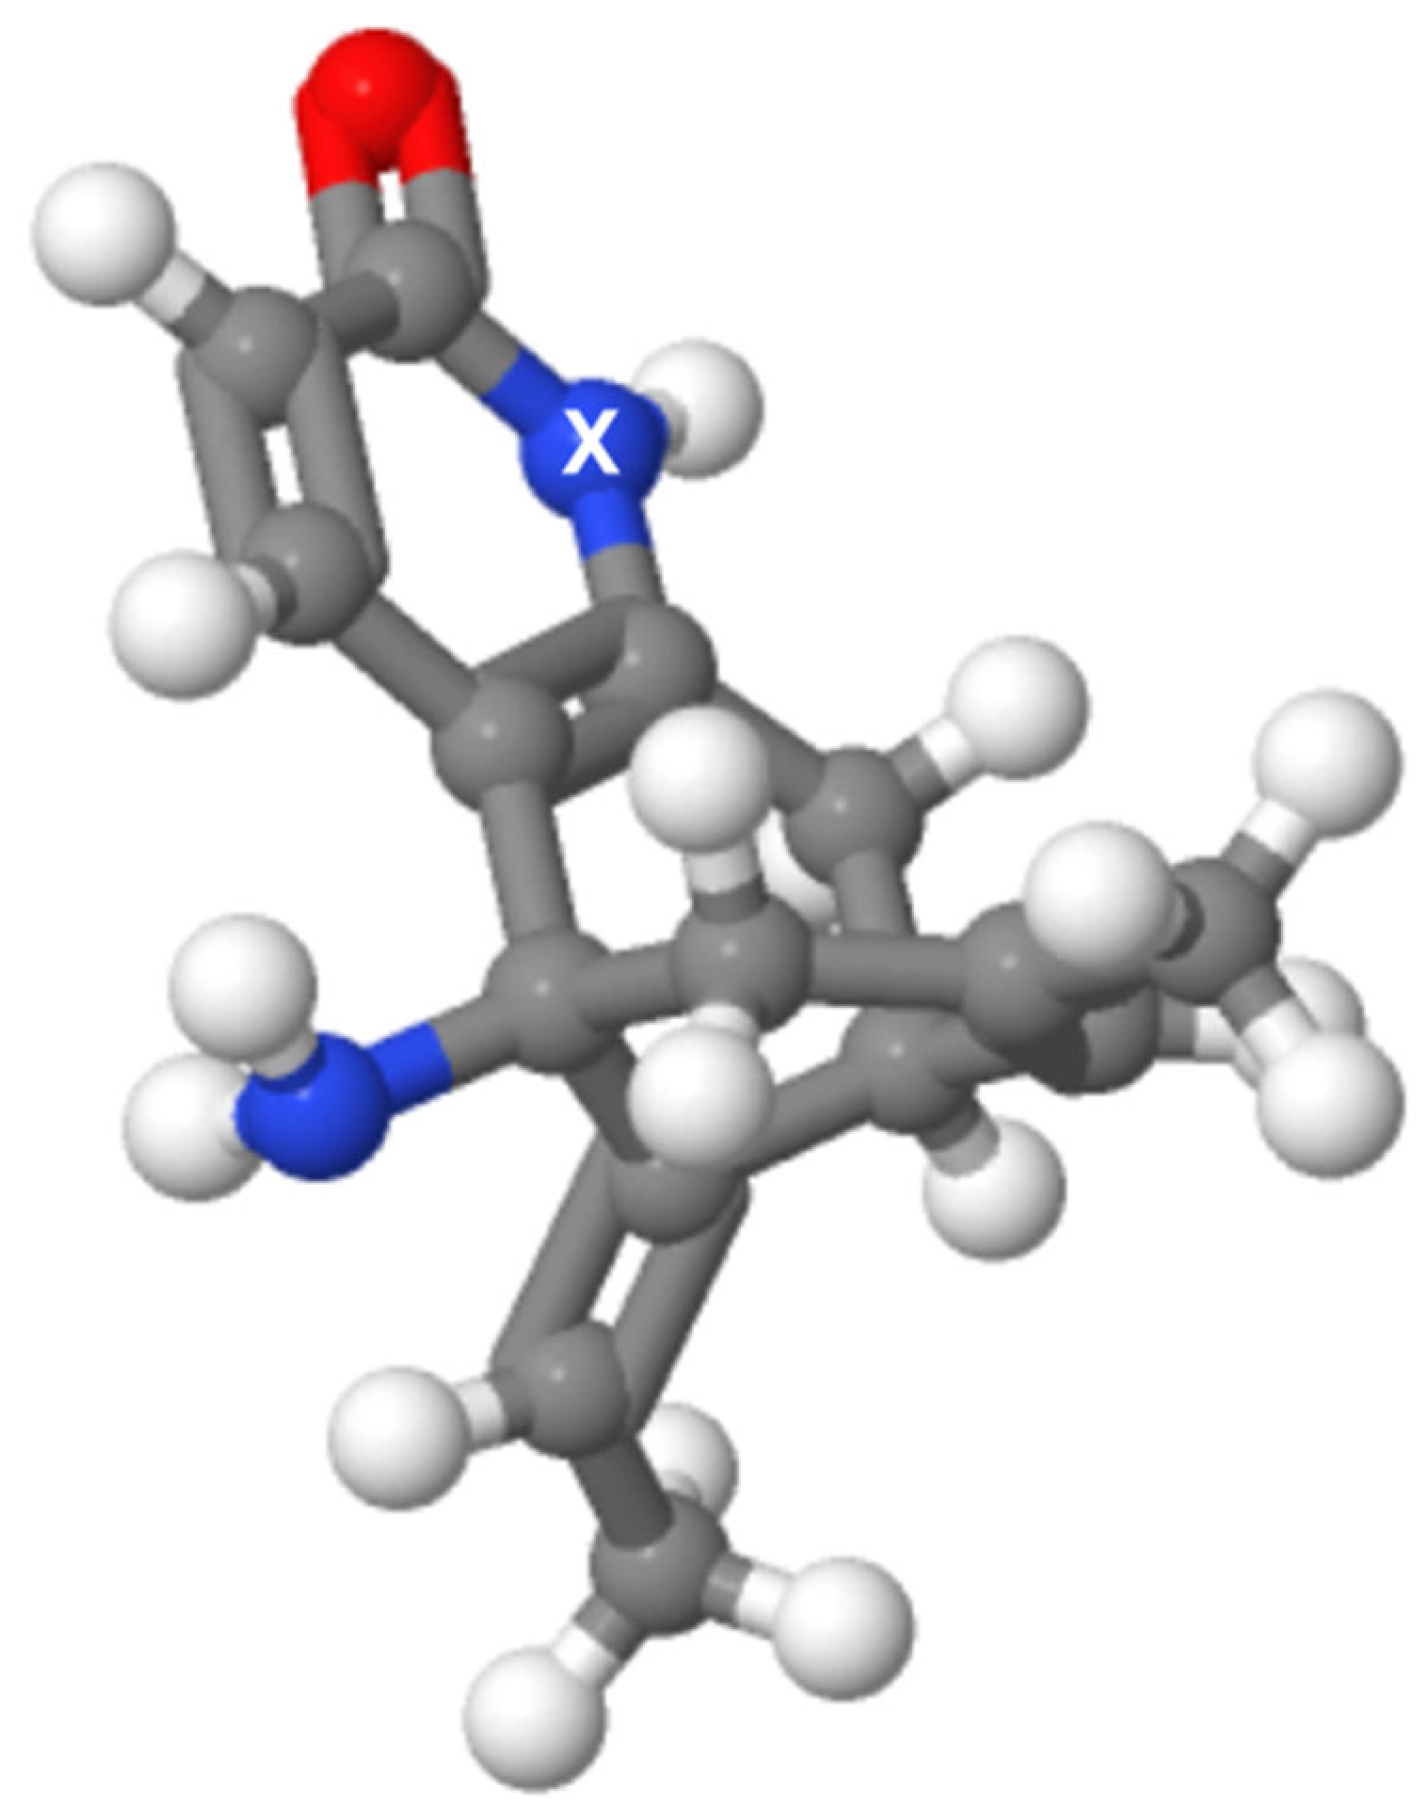
Atom X can serve as a hydrogen bond donor because it is sufficiently electronegative and its bonded hydrogen can then interact with other molecules. However, the lone pair is not involved as a hydrogen bond acceptor because it participates in resonance.
5. Conclusions
Supplementary Materials
Author Contributions
Funding
Institutional Review Board Statement
Informed Consent Statement
Data Availability Statement
Acknowledgments
Conflicts of Interest
References
- Loertscher, J.; Green, D.; Lewis, J.E.; Lin, S.; Minderhout, V. Identification of Threshold Concepts for Biochemistry. CBE—Life Sci. Educ. 2014, 13, 516–528. [Google Scholar] [CrossRef]
- Schönborn, K.J.; Anderson, T.R. The importance of visual literacy in the education of biochemists. Biochem. Mol. Biol. Educ. 2006, 34, 94–102. [Google Scholar] [CrossRef]
- Meyer, J.H.; Land, R.; Baillie, C. Threshold Concepts and Transformational Learning; Brill Publishers: Brill, The Netherlands, 2010; Volume 42. [Google Scholar]
- Dries, D.R.; Dean, D.M.; Listenberger, L.L.; Novak, W.R.P.; Franzen, M.A.; Craig, P.A. An expanded framework for biomolecular visualization in the classroom: Learning goals and competencies. Biochem. Mol. Biol. Educ. 2017, 45, 69–75. [Google Scholar] [CrossRef]
- Brewer, C.A.; Smith, D. Vision and Change in Undergraduate Biology Education: A Call to Action; American Association for the Advancement of Science: Washington, DC, USA, 2011. [Google Scholar]
- Arneson, J.B.; Offerdahl, E.G. Visual Literacy in Bloom: Using Bloom’s Taxonomy to Support Visual Learning Skills. CBE—Life Sci. Educ. 2018, 17, ar7. [Google Scholar] [CrossRef]
- Bateman, R.C.; Craig, P.A. A Proficiency Rubric for Biomacromolecular 3D Literacy. PDB Newsl. Educ. Corner 2010, 45, 5–7. [Google Scholar]
- Mnguni, L.; Schönborn, K.; Anderson, T. Assessment of visualisation skills in biochemistry students. S. Afr. J. Sci. 2016, 112, 1–8. [Google Scholar] [CrossRef]
- Offerdahl, E.G.; Arneson, J.B.; Byrne, N. Lighten the Load: Scaffolding Visual Literacy in Biochemistry and Molecular Biology. CBE—Life Sci. Educ. 2017, 16, es1. [Google Scholar] [CrossRef]
- Jaswal, S.S.; O’Hara, P.B.; Williamson, P.L.; Springer, A.L. Teaching structure: Student use of software tools for understanding macromolecular structure in an undergraduate biochemistry course: Teaching Structure in Undergraduate Biochemistry. Biochem. Mol. Biol. Educ. 2013, 41, 351–359. [Google Scholar] [CrossRef]
- Cohn, N. Visual narrative comprehension: Universal or not? Psychon. Bull. Rev. 2020, 27, 266–285. [Google Scholar] [CrossRef]
- England, B.J.; Brigati, J.R.; Schussler, E.E.; Chen, M.M. Student Anxiety and Perception of Difficulty Impact Performance and Persistence in Introductory Biology Courses. CBE—Life Sci. Educ. 2019, 18, ar21. [Google Scholar] [CrossRef]
- Stylianidou, F. Analysis of science textbook pictures about energy and pupils’ readings of them. Int. J. Sci. Educ. 2002, 24, 257–283. [Google Scholar] [CrossRef]
- Forbes-Lorman, R.M.; Harris, M.A.; Chang, W.S.; Dent, E.W.; Nordheim, E.V.; Franzen, M.A. Physical models have gender-specific effects on student understanding of protein structure-function relationships. Biochem. Mol. Biol. Educ. A Bimon. Publ. Int. Union Biochem. Mol. Biol. 2016, 44, 326–335. [Google Scholar] [CrossRef]
- Hoffman, M.; Gneezy, U.; List, J.A. Nurture affects gender differences in spatial abilities. Proc. Natl. Acad. Sci. USA 2011, 108, 14786–14788. [Google Scholar] [CrossRef]
- Lee, Y.; Capraro, R.M.; Bicer, A. Gender difference on spatial visualization by college students’ major types as STEM and non-STEM: A meta-analysis. Int. J. Math. Educ. Sci. Technol. 2019, 50, 1241–1255. [Google Scholar] [CrossRef]
- Maeda, Y.; Yoon, S.Y. A Meta-Analysis on Gender Differences in Mental Rotation Ability Measured by the Purdue Spatial Visualization Tests: Visualization of Rotations (PSVT:R). Educ. Psychol. Rev. 2013, 25, 69–94. [Google Scholar] [CrossRef]
- Reilly, D.; Neumann, D.L.; Andrews, G. Gender Differences in Spatial Ability: Implications for STEM Education and Approaches to Reducing the Gender Gap for Parents and Educators. In Visual-Spatial Ability in STEM Education: Transforming Research into Practice; Khine, M.S., Ed.; Springer International Publishing: Berlin/Heidelberg, Germany, 2017; pp. 195–224. [Google Scholar] [CrossRef]
- Sharobeam, M.H. The Variation in Spatial Visualization Abilities of College Male and Female Students in STEM Fields Versus Non-STEM Fields. J. Coll. Sci. Teach. 2016, 46, 93–99. [Google Scholar] [CrossRef]
- Tsigeman, E.S.; Likhanov, M.V.; Budakova, A.V.; Akmalov, A.; Sabitov, I.; Alenina, E.; Bartseva, K.; Kovas, Y. Persistent gender differences in spatial ability, even in STEM experts. Heliyon 2023, 9, e15247. [Google Scholar] [CrossRef]
- Garrison, L.; Bruckner, S. Considering best practices in color palettes for molecular visualizations. J. Integr. Bioinform. 2022, 19, 20220016. [Google Scholar] [CrossRef]
- Goodsell, D.S.; Jenkinson, J. Molecular Illustration in Research and Education: Past, Present, and Future. J. Mol. Biol. 2018, 430, 3969–3981. [Google Scholar] [CrossRef]
- Hattab, G.; Rhyne, T.-M.; Heider, D. Ten simple rules to colorize biological data visualization. PLoS Comput. Biol. 2020, 16, e1008259. [Google Scholar] [CrossRef]
- Jambor, H.; Antonietti, A.; Alicea, B.; Audisio, T.L.; Auer, S.; Bhardwaj, V.; Burgess, S.J.; Ferling, I.; Gazda, M.A.; Hoeppner, L.H.; et al. Creating clear and informative image-based figures for scientific publications. PLoS Biol. 2021, 19, e3001161. [Google Scholar] [CrossRef]
- Van Merriënboer, J.J.G.; Sweller, J. Cognitive Load Theory and Complex Learning: Recent Developments and Future Directions. Educ. Psychol. Rev. 2005, 17, 147–177. [Google Scholar] [CrossRef]
- Linenberger, K.J.; Holme, T.A. Biochemistry Instructors’ Views toward Developing and Assessing Visual Literacy in Their Courses. J. Chem. Educ. 2015, 92, 23–31. [Google Scholar] [CrossRef]
- Osborne, R.J.; Wittrock, M.C. Learning science: A generative process. Sci. Educ. 1983, 67, 489–508. [Google Scholar] [CrossRef]
- Kahneman, D. Thinking, Fast and Slow; Macmillan: New York, NY, USA, 2011. [Google Scholar]
- Gick, M.L. Problem-solving strategies. Educ. Psychol. 1986, 21, 99–120. [Google Scholar] [CrossRef]
- Impara, J.C.; Plake, B.S. Standard Setting: An Alternative Approach. J. Educ. Meas. 1997, 34, 353–366. [Google Scholar] [CrossRef]
- Pérez, E.V.; Santos, L.M.R.; Pérez, M.J.V.; de Castro Fernández, J.P.; Martín, R.G. Automatic classification of question difficulty level: Teachers’ estimation vs. students’ perception. In Proceedings of the 2012 Frontiers in Education Conference Proceedings, Seattle, WA, USA, 3–6 October 2012; pp. 1–5. [Google Scholar] [CrossRef]
- Van de Watering, G.; van der Rijt, J. Teachers’ and students’ perceptions of assessments: A review and a study into the ability and accuracy of estimating the difficulty levels of assessment items. Educ. Res. Rev. 2006, 1, 133–147. [Google Scholar] [CrossRef]
- Chavan, P.; Mitra, R.; Srree Murallidharan, J. Multiscale nature of student and teacher perceptions of difficulty in a mechanical engineering lecture. Eur. J. Eng. Educ. 2022, 47, 910–929. [Google Scholar] [CrossRef]
- Maynard, D.C.; Hakel, M.D. Effects of Objective and Subjective Task Complexity on Performance. Hum. Perform. 1997, 10, 303–330. [Google Scholar] [CrossRef]
- Anderson, T.R. Bridging the educational research-teaching practice gap: The importance of bridging the gap between science education research and its application in biochemistry teaching and learning: Barriers and strategies. Biochem. Mol. Biol. Educ. A Bimon. Publ. Int. Union Biochem. Mol. Biol. 2007, 35, 465–470. [Google Scholar] [CrossRef]
- Procko, K.; Engelman, S.; Jakubowski, H.; Beckham, J.T.; Dean, D.M.; Franzen, M.A.; Novak, W.R.P.; Roberts, R.; Roca, A.I.; Shor, A.C.; et al. Meeting report: BioMolViz workshops for developing assessments of biomolecular visual literacy. Biochem. Mol. Biol. Educ. 2021, 49, 278–286. [Google Scholar] [CrossRef]
- Ballen, C.J.; Wieman, C.; Salehi, S.; Searle, J.B.; Zamudio, K.R. Enhancing Diversity in Undergraduate Science: Self-Efficacy Drives Performance Gains with Active Learning. CBE—Life Sci. Educ. 2017, 16, ar56. [Google Scholar] [CrossRef]
- Saldaña, J. The Coding Manual for Qualitative Researchers; Sage: Thousand Oaks, CA, USA, 2021. [Google Scholar]
- MacQueen, K.M.; McLellan-Lemal, E.; Bartholow, K.; Milstein, B. Team-based codebook development: Structure, process, and agreement. Handb. Team-Based Qual. Res. 2008, 119, 119–135. [Google Scholar]
- Auerbach, C.; Silverstein, L.B. Qualitative Data: An Introduction to Coding and Analysis; NYU Press: New York, NY, USA, 2003; Volume 21. [Google Scholar]
- Broekkamp, H.; Van Hout-Wolters, B.H.A.M.; Van den Bergh, H.; Rijlaarsdam, G. Teachers’ task demands, students’ test expectations, and actual test content. Br. J. Educ. Psychol. 2004, 74, 205–220. [Google Scholar] [CrossRef]
- Krell, M.; Khan, S.; van Driel, J. Analyzing Cognitive Demands of a Scientific Reasoning Test Using the Linear Logistic Test Model (LLTM). Educ. Sci. 2021, 11, 9. [Google Scholar] [CrossRef]
- Mak, C.H. A Simple Paper Model Illustrates How To Cyclize Monosaccharides from Fischer Projections to Haworth. J. Chem. Educ. 2018, 95, 1336–1339. [Google Scholar] [CrossRef]
- Kryjevskaia, M.; Heron, P.R.L.; Heckler, A.F. Intuitive or rational? Students and experts need to be both. Phys. Today 2021, 74, 28–34. [Google Scholar] [CrossRef]
- Linn, M.C.; Petersen, A.C. Emergence and Characterization of Sex Differences in Spatial Ability: A Meta-Analysis. Child Dev. 1985, 56, 1479–1498. [Google Scholar] [CrossRef]
- Bates, R.; Khasawneh, S. Self-efficacy and college students’ perceptions and use of online learning systems. Comput. Hum. Behav. 2007, 23, 175–191. [Google Scholar] [CrossRef]
- Penzar, E.C.; Shea, M.; Edwards, C.N. College Students’ Academic Achievement: Exploring the Role of Hope and Academic Self-Efficacy. Int. Dialogues Educ. J. 2021, 8, 1. [Google Scholar] [CrossRef]
- Morphew, J.W. Changes in metacognitive monitoring accuracy in an introductory physics course. Metacogn. Learn. 2021, 16, 89–111. [Google Scholar] [CrossRef]
- Kolić-Vehovec, S.; Pahljina-Reinić, R.; Rončević Zubković, B. Effects of collaboration and informing students about overconfidence on metacognitive judgment in conceptual learning. Metacogn. Learn. 2022, 17, 87–116. [Google Scholar] [CrossRef]
- Ehrlinger, J.; Johnson, K.; Banner, M.; Dunning, D.; Kruger, J. Why the Unskilled Are Unaware: Further Explorations of (Absent) Self-Insight Among the Incompetent. Organ. Behav. Hum. Decis. Process. 2008, 105, 98–121. [Google Scholar] [CrossRef]

| Demographic | Category | Instructors | Students |
|---|---|---|---|
| Gender | Female | 63.0% | 66.3% |
| Male | 37.0% | 29.8% | |
| Other | 0.0% | 0.6% | |
| Prefer to not say | 0.0% | 3.3% | |
| URM Status | nonURM | 85.2% | 71.3% |
| URM | 14.8% | 24.9% | |
| Prefer to not say | 0.0% | 3.9% | |
| Year in School | First Year/Sophomore | 14.4% | |
| Junior/Senior | 85.6% | ||
| Years Teaching Experience | 2–9 | 18.5% | |
| 10–20 | 44.4% | ||
| >20 | 37.0% |
| Item ID | Molecule Type(s) | Primary Learning Objective | Question Type | % Correct | n |
|---|---|---|---|---|---|
| 00 | Nucleic acid (DNA) | AR2.03: Students can identify or create a suitable rendering or combination of renderings for a specific purpose. | MA/MS | 82 * | 61 |
| 01 | Protein, saccharide (carbohydrate) | MA1.01: Students can identify individual biomolecules in a macromolecular assembly. | MCQ | 59 | 120 |
| 02 | Tetrapeptide | MB1.01: Given a rendered structure of a biological polymer, students are able to identify the ends of a biological polymer. | MCQ | 11 | 70 |
| 03 | Dipeptide | MB1.03: Given a rendered structure, students can identify the individual building blocks. | MCQ | 87 | 70 |
| 04 | Carbohydrate (trisaccharide) | TC1.02: Students can use appropriate terms to describe the linkages/bonds/interactions that join individual building blocks together in a macromolecule or macromolecular assembly. | MA/MS | 78 † | 70 |
| 06 | Carbohydrate (trisaccharide) | TC1.02: Students can use appropriate terms to describe the linkages/bonds/interactions that join individual building blocks together in a macromolecule or macromolecular assembly. | MCQ | 42 ‡ | 50 |
| 09 | Carbohydrate (trisaccharide) | LM1.02: Students can visually identify non-protein chemical components in a given rendered structure. | MCQ | 36 | 111 |
| 10 | Protein | MB1.03: Given a rendered structure, students can identify the individual building blocks. | Short answer | 44 ❡ | 61 |
| 11 | Protein | SF2.03: Students can identify functionally relevant features of a macromolecule. | MCQ | 44 | 50 |
| 12 | Small-molecule drug | MI1.03: Students can predict whether a functional group (region) is a hydrogen bond donor or acceptor. | MCQ | 54 | 50 |
| 13 | Small-molecule drug | MI1.03: Students can predict whether a functional group (region) is a hydrogen bond donor or acceptor. | MCQ | 43 | 70 |
| 14 | Amino acids, heme group | MI1.02: Students can identify the different non-covalent interactions given a 3D structure. | MCQ | 50 | 131 |
| 15 | Oligopeptides | MB1.03: Given a rendered structure, students can identify the individual building blocks. | MCQ | 50 | 50 |
| 16 | Protein, lipid bilayer | MA1.01: Students can identify individual biomolecules in a macromolecular assembly. | MCQ | 51 | 61 |
| Male | Female | Independent-Samples t-Test | ||||
|---|---|---|---|---|---|---|
| Mean | SD | Mean | SD | |||
| Instructors | Overall Difficulty Average | 3.40 | 0.65 | 3.27 | 0.72 | ns |
| Students | 01 | 4.09 | 1.38 | 4.89 | 1.33 | t(60) = −2.88, p < 0.01 ** |
| 06 | 3.23 | 1.17 | 4.14 | 1.77 | t(33) = −2.07, p < 0.05 * | |
| 12 | 2.77 | 1.17 | 3.79 | 1.84 | t(34) = −2.27, p < 0.05 * | |
| 16 | 3.25 | 1.55 | 4.00 | 1.36 | t(34) = −1.83, p < 0.10 ± | |
| Overall Difficulty Average | 3.84 | 1.12 | 4.21 | 1.06 | t(97) = −2.09, p < 0.05 * | |
| Non-URM | URM | Independent-Samples t-Test | ||||
|---|---|---|---|---|---|---|
| Mean | SD | Mean | SD | |||
| Students | 06 | 3.50 | 1.52 | 4.50 | 1.75 | t(27) = −1.95, p < 0.10 ± |
| 11 | 4.25 | 1.70 | 5.44 | 1.21 | t(40) = −2.78, p < 0.01 ** | |
| 15 | 4.38 | 1.86 | 5.31 | 1.49 | t(37) = −1.88, p < 0.10 ± | |
| Overall Difficulty Average | 4.00 | 1.04 | 4.35 | 1.18 | t(65) = −1.76, p < 0.10 ± | |
| Outcome Variable = Overall Difficulty Average | Unstandardized Coefficients | Standardized Coefficients | t | p-Value | |
|---|---|---|---|---|---|
| B | Std. Error | β | |||
| (Constant) | 3.86 | 0.14 | 27.81 | 0.000 | |
| Role (instructor, 1; student, 0) | −0.74 | 0.21 | −0.24 | −3.43 | 0.001 ** |
| Race/Ethnicity (URM, 1; non-URM, 0) | 0.25 | 0.17 | 0.10 | 1.45 | 0.147 |
| Gender (female, 1; male, 0) | 0.25 | 0.16 | 0.11 | 1.57 | 0.119 |
| Outcome Variable = Overall Difficulty Average | Unstandardized Coefficients | Standardized Coefficients | t | p-value | |
|---|---|---|---|---|---|
| B | Std. Error | β | |||
| (Constant) | 4.84 | 0.23 | 20.99 | 0.000 | |
| Gender (female, 1; male, 0) | 0.22 | 0.17 | 0.09 | 1.31 | 0.191 |
| Race/Ethnicity (URM, 1; non-URM, 0) | 0.24 | 0.18 | 0.10 | 1.38 | 0.171 |
| Overall % Correct | −0.02 | 0.00 | −0.40 | −5.61 | 0.000 ** |
Disclaimer/Publisher’s Note: The statements, opinions and data contained in all publications are solely those of the individual author(s) and contributor(s) and not of MDPI and/or the editor(s). MDPI and/or the editor(s) disclaim responsibility for any injury to people or property resulting from any ideas, methods, instructions or products referred to in the content. |
© 2024 by the authors. Licensee MDPI, Basel, Switzerland. This article is an open access article distributed under the terms and conditions of the Creative Commons Attribution (CC BY) license (https://creativecommons.org/licenses/by/4.0/).
Share and Cite
Beckham, J.T.; Dries, D.R.; Hall, B.L.; Mitton-Fry, R.M.; Engelman, S.; Burch, C.; Acevedo, R.; Mertz, P.S.; Vardar-Ulu, D.; Agrawal, S.; et al. Seeing Eye to Eye? Comparing Faculty and Student Perceptions of Biomolecular Visualization Assessments. Educ. Sci. 2024, 14, 94. https://doi.org/10.3390/educsci14010094
Beckham JT, Dries DR, Hall BL, Mitton-Fry RM, Engelman S, Burch C, Acevedo R, Mertz PS, Vardar-Ulu D, Agrawal S, et al. Seeing Eye to Eye? Comparing Faculty and Student Perceptions of Biomolecular Visualization Assessments. Education Sciences. 2024; 14(1):94. https://doi.org/10.3390/educsci14010094
Chicago/Turabian StyleBeckham, Josh T., Daniel R. Dries, Bonnie L. Hall, Rachel M. Mitton-Fry, Shelly Engelman, Charmita Burch, Roderico Acevedo, Pamela S. Mertz, Didem Vardar-Ulu, Swati Agrawal, and et al. 2024. "Seeing Eye to Eye? Comparing Faculty and Student Perceptions of Biomolecular Visualization Assessments" Education Sciences 14, no. 1: 94. https://doi.org/10.3390/educsci14010094
APA StyleBeckham, J. T., Dries, D. R., Hall, B. L., Mitton-Fry, R. M., Engelman, S., Burch, C., Acevedo, R., Mertz, P. S., Vardar-Ulu, D., Agrawal, S., Fox, K. M., Austin, S., Franzen, M. A., Jakubowski, H. V., Novak, W. R. P., Roberts, R., Roca, A. I., & Procko, K. (2024). Seeing Eye to Eye? Comparing Faculty and Student Perceptions of Biomolecular Visualization Assessments. Education Sciences, 14(1), 94. https://doi.org/10.3390/educsci14010094