Article

Impact of Learning Analytics Guidance on Student Self-Regulated Learning Skills, Performance, and Satisfaction: A Mixed Methods Study

by
Dimitrios E. Tzimas
* and
Stavros N. Demetriadis
School of Informatics, Aristotle University of Thessaloniki, 541 24 Thessaloniki, Greece
*
Author to whom correspondence should be addressed.
Educ. Sci. 2024, 14(1), 92; https://doi.org/10.3390/educsci14010092
Submission received: 30 November 2023 / Revised: 9 January 2024 / Accepted: 10 January 2024 / Published: 15 January 2024
(This article belongs to the Special Issue Advances in Technology-Enhanced Teaching and Learning)

Abstract

:
Learning analytics (LA) involves collecting, processing, and visualizing big data to help teachers optimize learning conditions. Despite its contributions, LA has not yet been able to meet teachers’ needs because it does not provide sufficient actionable insights that emphasize more on analytics and less on learning. Our work uses specific analytics for student guidance to evaluate an instructional design that focuses on LA agency between teachers and students. The research goal is to investigate whether the minimal and strong guidance provided by the LA learning approach has the same impact on student outcomes. The research questions are as follows “Does the LA-based minimal and strong guidance learning approach have the same impact on student performance and SRL skills? What are the students’ learning perceptions and satisfaction under LA-based guidance?” A mixed methods study was conducted at a university in which LA-based strong guidance was applied to the experimental group and minimal guidance was given to the control group. When strong guidance was applied, the results indicated increased final grades and SRL skills (metacognitive activities, time management, persistence, and help seeking). Furthermore, student satisfaction was high with LA-based guidance. Future research could adapt our study to nonformal education to provide nuanced insights into student outcomes and teachers’ perceptions.

1. Introduction

Learning analytics (LA) is a multidisciplinary field involving computer science, design, and education based on big educational data mining [1]. The Society for LA Research defined LA as the “collection, analysis and reporting of data about learners and their contexts, for purposes of understanding and optimizing learning and the environments in which it occurs” [2] (p. 34). Therefore, research in LA has extracted significant outcomes in mining patterns of student behavior and deriving predictive models [3]. In addition, higher education institutions (HEIs) are experimenting with LA-based guidance techniques to increase retention rates, support students’ complex trajectories, and use resources effectively [4].
Despite its contributions, LA has not yet been applied to its potential because LA recommendations do not provide sufficient actionable insights to instructors [5,6]. Furthermore, many studies [7,8,9] have reported a slight improvement in student learning through LA. Our focus is on contributing to improving learning through LA, and the specific question we examine is “strong vs. minimal guidance”. In particular, we emphasize the role of LA-based strong (SG) vs. minimal (MG) guidance in developing self-regulated learning (SRL) skills and learning performance. Our intervention engaged students in two compared conditions. The MG group followed a low prompting approach informing students with grades and statistics. The SG group followed a highly prompting approach. Specifically, the instructors implemented an intervention protocol consisting of posting a traffic signal indicator message to indicate how each student performed and an online interview with the instructor for self-evaluation. The research goal is to investigate whether minimal and strong guidance based on the LA approach has the same impact on student outcomes. We propose two null hypotheses for studying how the degree of LA guidance supports students’ learning.
Hypothesis 1.
Performance, as measured by the course grade of the experimental group, is not significantly different from that of the control group.
Hypothesis 2.
The experimental group’s SRL skills are not significantly different from those of the control group.
Our research follows a mixed method (MM) design. In the interdisciplinary domain of technology-enhanced learning, quantitative and qualitative methods can be combined to improve research quality. The need for the MM approach is justified because of method triangulation and contradictions in extracting new research lines [10]. Finally, the article is organized into the following sections: (1) we conduct a literature review and extract the research questions (RQs); (2) we illustrate the research design and study results; and (3) we present the discussion and conclusions.

2. Background

2.1. Learning Analytics

Learning analytics is a rapidly growing community that has emerged for identifying students’ behaviors and academic performance. LA is a type of intelligent data use that aims to translate data into knowledge, providing students with learning insight and educators with evidence-based interventions [7]. Compared with studies using survey approaches, LA selects direct online data, providing timely evidence based on learning design and data science [11]. However, there are numerous challenges, particularly regarding student learning and its implications [5]. The emphasis of LA appears to be on analytics rather than learning, according to Viberg et al. [12]. LA has a limited understanding of pedagogy and underestimates the complexities of teaching processes [13]. Furthermore, LA is pedagogically neutral; therefore, a shift from a technological perspective to an educational one is required [14]. According to Guzmán-Valenzuela et al. [7], institutions’ interest in grades, persistence, and non-completion metrics tends to hinder students’ motivation and satisfaction. We contend that technologically determinist reliance on data analytics was inadequate [1], and research required the incorporation of pedagogical perspectives.

2.2. Strong vs. Minimal Teacher Guidance

The role, degree, and impact of teacher guidance during learning activities, in which feedback is translated into action, have received considerable attention [15]. Learning analytics have the potential to improve teacher guidance practices in higher education. Teacher guidance has been recognized as an effective learning tool that influences student motivation, knowledge, and metacognitive skills [16]. However, Tzimas and Demetriadis [17] do not clearly understand how LA tools can support student guidance practices.
Some researchers state that students learn best when they construct knowledge alone without explicit guidance [18]. However, many researchers suggest that students learn best when provided with explicit instructional guidance [19]. The purpose is to provide students with specific motivational guidance about cognitively using the data in ways consistent with a learning goal [20]. Others claim that prompting students triggers additional cognitive activity, resulting in better learning outcomes [21]. In parallel, LA-based interventions commonly use MG feedback, which compares students’ performance against that of their peers [17]. It is meaningful to examine the effectiveness of MG versus SG because feedback effectiveness can vary depending on the type and level of intervention.
These differences and the lack of empirical evidence, to the best of our knowledge, encourage research to determine the level of guidance through instructional experiments. Thus, teachers could use analytics to adjust their pedagogic strategies and apply well-targeted interventions. Feedback about the level of self-regulation a student uses guides students in assessing how they can metacognitively reflect on learning. Self-regulated and directed learning is not something students can do unprompted. Students need teacher guidance to make their choices and acquire these skills [22]. This study evaluated the effectiveness of two distinct LA-based guidance methods, focusing on whether explicit guidance was provided.

2.3. Learning Analytics and Student Outcomes

We conducted a literature review of LA in terms of context, methodology, and findings to determine the rationale behind this research. The studies were classified according to students’ SRL skills, performance, and satisfaction.

2.3.1. SRL Skills

Research on the role of LA supported by different levels of teacher guidance is more suitable for enhancing students’ self-reflection in online classes [23]. This point is crucial, and the decision was made to focus on self-reflection instead of self-direction. We understand SRL to be learning managed by the learner or the methods by which learners activate their cognitions, motivations, and behaviors to achieve their goals [24]. SRL strategies are actions directed at acquiring information or skills that involve students’ perceptions. Students diagnose their learning needs, develop goals, and select strategies for self-directed learning.
Nevertheless, discussing the relationship between LA and learning theories is crucial. Extracted from the Tzimas and Demetriadis [13] review, SRL is LA’s most prevalent learning theory among 140 empirical articles investigating the LA domain. Pardo et al. [25] focused on the benefits of SRL skills, which refer to learning guided by metacognition and strategic action. SRL instructional design theory is a complex construct of time management, help-seeking, and self-evaluation axes. The pedagogical aim focuses on metacognitive skills that allow learners to assume control of their decisions. However, students often lack rigorous metacognitive skills [26]. Although the literature has positive outcomes, an in-depth analysis is needed to study strategies for assessing the effect of LA on developing SRL skills [8]. Another observation is that certain studies have implemented SG to support SRL skills development, whereas others have reported MG. Edisherashvili et al. [27] stated that missing studies have focused on the effects of teacher-guided interventions on different areas of SRL. Our study fills the gap in understanding SRL skills using the Self-regulated Online Learning Questionnaire—Revised (SOL-Q-R) [28].

2.3.2. How to Increase Performance through Strong versus Minimal Guidance

Bodily and Verbert [29] explored the use of student-facing LA to improve academic performance. West et al. [30] analyzed instructors’ impacts on students’ performance using LA. The Purdue course signals system [19] uses predictive models based on metrics such as LMS usage to send performance-based feedback to students through visualizations. Courses using this system showed an increase in grades and a decrease in withdrawals. Goggins et al. [31] focused on designing LA that relates the social learning structure to performance measures in a MOOC. Kim et al. [32] indicated how students’ performance evolves through the use of LA. Similarly, Papamitsiou et al. (2018) [33] explained learning performance using self-regulation and satisfaction. To focus on this research direction, we must explain whether MG or SG LA-based instructional interventions could positively affect students’ performance.

2.3.3. LA-Based Feedback Satisfaction

Targeted studies exist on students’ perceptions and thus opinions and feelings about LA [34]. In Ifenthaler’s [35] study, network graph analysis proved the potential of LA design for optimizing learner satisfaction. Because research on LA-based feedback satisfaction is limited [36], our study investigated whether the results would confirm the current findings. Nevertheless, before and after minimal and strong guidance from LA support, students’ opinions need further research to extract insights concerning feedback satisfaction and thus students’ motivation to follow the course. One concern is that LA was developed without the active participation of students, who were relegated to an observer role. Qualitative techniques may aid in investigating teachers’ and students’ perceptions of LA and how students can become more actively involved [7]. Finally, we applied thematic analysis to student interviews in LA, where there was limited qualitative research [37].

2.4. Research Questions

After all, we aim to evaluate an instructional design that focuses on LA between teachers and students. We compared the ability of MG and SG to improve SRL skills and academic performance. In the MG scenario, we use the technocratic side of analytics for mirroring, and in the SG scenario, we communicate analytics to students with SRL skills as a dependent variable. This study introduces teacher guidance as an independent variable, exploring its impact on LA activities by posing the following RQs:
  • Does the LA-based minimal and strong guidance learning approach have the same impact on student performance and SRL skills?
  • What are the students’ learning perceptions and satisfaction under LA-based guidance?

3. Method

3.1. Instructional Design

Our instructional design follows the flipped classroom (FC), motivational interviewing (MI), and ethics pedagogical principles. First, the FC instructional strategy is typical of blended and online learning, in which students are given time on tasks that require higher-order knowledge [18]. FC emphasizes group space, where the teacher and students meet, and individual space, where students learn independently. This approach reverses the concept of traditional instruction, engaging students in understanding the content of teachers’ lectures before the class and practicing in groups [26]. Second, ΜΙ teacher guidance for effective classroom management is a collaborative conversation style that strengthens students’ motivation to change their behavior. This inter-stakeholder communication technique increases participant effort in learning; therefore, MI is a supportive pedagogical intervention [38]. Finally, ethics is a factor that mediates LA adoption. We apply ethics to establish trust among educational stakeholders by addressing the following guidelines [13]: providing informed consent and anonymity; providing students with self-control; guaranteeing instructor feedback motivates students; and informing students that LA should not be the only source of decision making.

3.2. Type of Guidance

Our intervention engaged students in two compared conditions: those who received SG and those who received MG. LA was present in both conditions.
  • The MG group followed a low prompting approach informing students with grades and statistics (max, minimum, average grade, and exercise duration);
  • The SG group followed a highly prompting and individualized approach informing students about grades and statistics. Instructors implemented a learner-centered intervention protocol that they created, consisting of (a) posting a traffic signal indicator (Red Yellow Green—RYG) message to indicate how each student performed based on performance and engagement and (b) an online interview (MI) with the instructor for self-evaluation.
Intervention 1. In week three, we sent all the students messages about LA-supported actions per group. The messages were a teacher’s initiative. Similar interventions were conducted in both groups every week, which were identical to intervention 1. This feedback was subsequently sent to the students by the instructors.
MG group: “I am sending you feedback after analyzing your course participation and performance. I attach for self-reflection your grades in the first three exercises and the grades of your fellow students. I encourage you to study the Statistics LMS option for your participation concerning your classmates”.
SG group: In addition to the above message, we sent tips to all the students in the SG group: “Those who did not meet the quiz deadline, schedule required study time; videos you consider boring try completing them persistently. Then, the visualized performance indicators can be studied”.
Finally, we adapted MI to an intervention addressing student behavior by conducting Zoom discussions in the MG group. The timing was determined at week five to ensure sufficient data for discussion after monitoring student performance and participation. Each interview lasted for 15 min. Specifically, the instructor was a consultant in our MI-based guidance protocol, and students were prompted to consider LA-based feedback (analysis phase). Then, the students were encouraged to change their behavior through analytics (change phase). Finally, the students participated in a reflective process explaining how the interventions made sense (reflective phase).

3.3. Participants and the Context

This MM study was administered in a seventh-semester, 13-week undergraduate course named the “senior seminar”. An HEI computer science department in Greece offered this course online during the COVID-19 pandemic. We selected this course because of the high dropout rate (~25%) and failure rate (~40%) of past exams. According to our independent measures design, 110 students initially took the class; however, 93 ultimately participated—47 as an experimental group receiving the LA intervention with SG. The control group was used as a baseline measure and included 46 students who received LA intervention with MG. Randomly allocating students to separate independent groups ensured sample representativeness. A total of 26% of the participants were female. The groups initially had the same assumed knowledge and educational background, having all completed six semesters. Finally, 12 students dropped out, 81 students were graded, and 58 passed the course. The course focused on methods for conducting scientific research and writing a thesis.

3.3.1. Learner Model

Figure 1, Figure 2, Figure 3 and Figure 4 present screenshots of the eClass-based LA interface. The platform’s main features are course management, evaluation, and feedback tools. Specifically, the learner and staff-facing dashboards facilitate the instructor with the course sessions (Figure 2). Finally, the instructor displays analytics related to user actions (Figure 1), comparing the current and past learning statistics. The learning statistics metric analyzes the data weekly to generate recommendations. The options are exercise grade, coursework grade, and access time. Suppose we add a criterion determining the weight value and the thresholds at the critical and advanced levels, the instructors can then monitor the students’ participation and performance (Figure 3).

3.3.2. Learning Design

The teaching experiment lasted 13 weeks with 120 min of synchronous instruction per group once a week, containing 19 educational videos and nine assessment exercises. The passing rate was 62%. The LD follows the pattern of do–analyze–change–reflect.
Week 1—Introduction. We presented the course’s overview and instructional domain. To elaborate on the ethical aspects of ensuring transparency and institution-wide adoption, we informed the department principal about the study and he consented. Informed consent was obtained from all the students. Afterward, the students completed the prequestionnaire SOL-Q-R as a baseline.
Week 2–3—Bibliographic databases. Every week, both groups participated in the exercise. We described which student-facing LA would be used and how students would use them.
Week 4–5—Scientific networking. The experimental group received RYG messages with visualizations based on performance and engagement. Then, the MI meetings occurred.
Week 6–7—Quantitative research. We polled both groups via the Zoom platform regarding learning perceptions and satisfaction.
Week 8–9—Qualitative research. The teacher and students in both groups engaged in a dialog about the semantics of the analytics.
Week 10–11—Perform a literature review. Semester work was presented.
Week 12—The students completed the post-questionnaire SOL-Q-R and the opinion survey. Students were encouraged to take the time to organize their thoughts and reflect on their course experience before completing the survey.

3.4. Research Design

We used the MM convergent approach for internal validity and consistency to analyze the data and contrast the results, deepening the understanding of our study [39]. Finally, triangulating multiple data analysis techniques enhanced the rigor of the research (Figure 5).

3.4.1. Measures and Research Instruments

We implemented a user-centered design to understand learners’ perceptions. Our intervention’s dependent variables are students’ performance and SRL skills.
Performance: Performance was measured by the final course grade (exercises counted 20% and work semester presentation 80%), which is convenient for causal and statistical analysis. The grading system follows the graded scale: 0.00–10.00/pass: 5:00 (excellent: 8.50–10.00; very good: 6.5–8.49; and good: 5.00–6.49).
SRL skills: Students (38/31 participants from the experimental and control groups) completed self-reporting online pre-/post-questionnaires about their SRL strategies. The contents of the questionnaires were equivalent. Evaluations were based on the SOL-Q-R questionnaire, which has high usability and reliability [28] and contains 42 questions (Appendix A) related to seven SRL strategies. Responses were assessed based on a graded criterion instrument using a 7-point Likert scale.
Satisfaction: The instruments used to collect student opinion data were an opinion-mining survey after the course and a poll conducted on week 7. The survey developed by the researchers included 25 questions (Appendix B): three open-ended and 22 seven-point Likert scale items. The objectivity of the survey was ensured with uniform and clear instructions. Finally, this reflection phase addressed usability, usefulness, shortcomings, and the effect on students’ perceptions

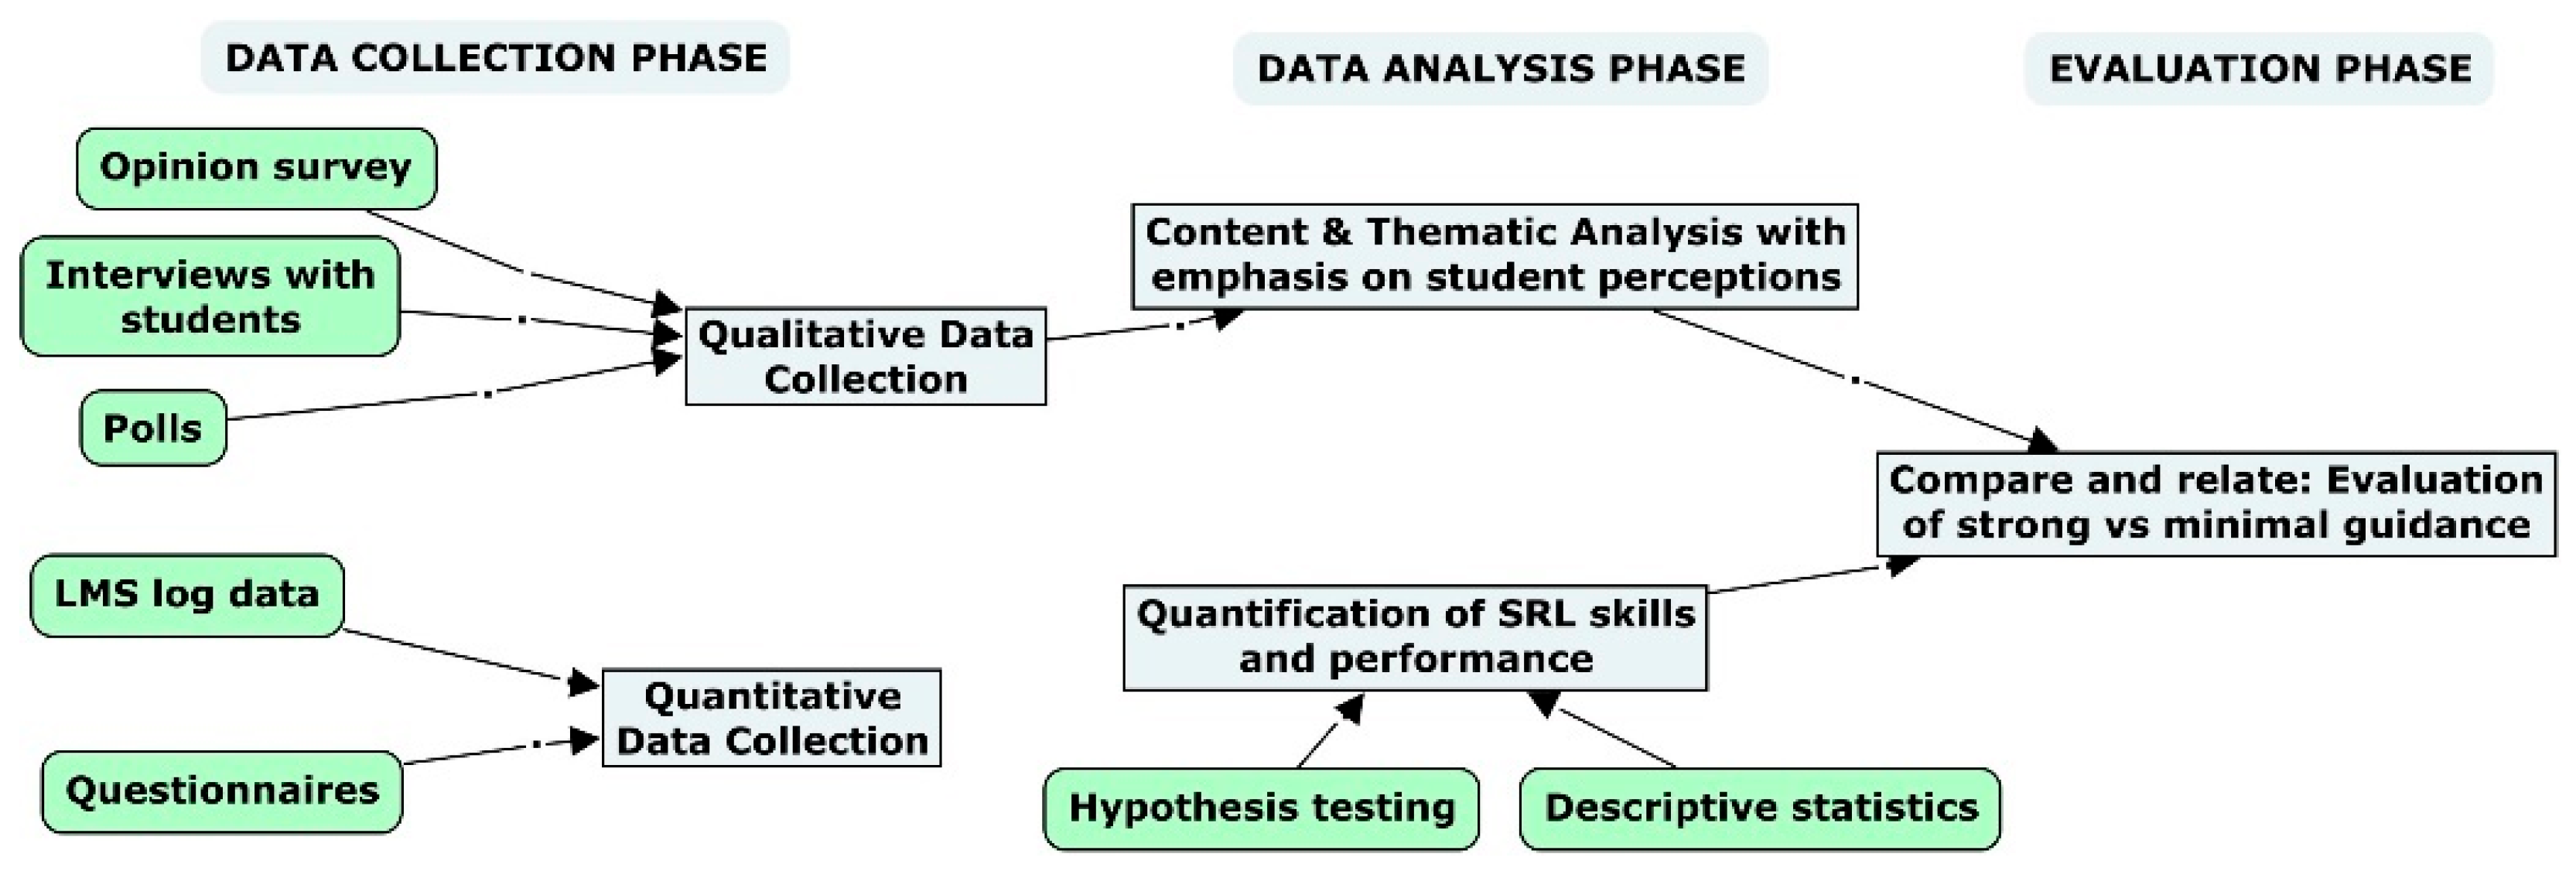
3.4.2. Data Collection and Analysis

First, we used the following quantitative data: LMS http://www.openeclass.org (accessed on 12 November 2023) extracted log data; pre-/post-questionnaires to measure SRL skills; and final grades to determine course achievement. Second, qualitative data were collected: perception survey data were used to measure student satisfaction, and semi-structured interviews were used to extract student views regarding the effectiveness of the interventions.
A quantitative analysis (descriptive statistics and hypothesis testing) was aligned with RQ1. The level of significance was set at p = 0.05. Furthermore, we applied normality (Shapiro–Wilk) and variance (Levene) controls to the available data (N > 30). The results indicated statistical nonsignificance, suggesting that the sample data were normally distributed and from populations with the same variance, appropriate for parametric test analysis. SPSS 25.0 was used to analyze the data. Finally, we conducted t-tests and analyses of covariance (ANCOVAs) to determine the effects of the intervention. Moreover, ANCOVA measures the treatment’s impact, namely, effect size.
To address RQ2, we analyzed the qualitative data from the student survey. We used content analysis to interpret patterns in the data. In parallel, we used the thematic analysis method to collect MI data to extract common themes. We combined manual techniques using printed copies and software such as Excel 2019. Therefore, we asked questions to elicit opinions (Table 1). We created a taxonomy based on the students’ open responses and frequency analysis for classifying the comments. This inductive reasoning approach means that the identified themes are strongly linked to the data without fitting into a pre-existing coding framework. In parallel, we used research journaling to support the reliability of the findings. This journal was used to record critical events, questions, next steps, and reflective memos concerning the study. We wrote journal entries within 24 h after field experiences.

4. Results

4.1. Research Question 1

We propose two null hypotheses for studying how the degree of LA guidance supports students’ learning.
Hypothesis 1.
Performance, as measured by the course grade of the experimental group, is not significantly different from that of the control group.
The mean score of the experimental group (M = 7.22, SD = 2.71) was higher than that of the control group (M = 5.28, SD = 3.95). Independent t-tests comparing course grades between the groups revealed statistically significant differences (t = 2.75, p = 0.007) (Table 2). Overall, the null hypothesis is rejected.
Hypothesis 2.
The experimental group’s SRL skills are not significantly different from those of the control group.
Since the normality and homogeneity of variance criteria were satisfied, parametric tests were conducted to examine the differences between the two conditions based on students’ scores on the pre- and post-questionnaires. To compare students’ prior SRL skills, we conducted independent t-tests to identify potential issues related to allocating participants to different conditions. To determine SRL skills measured via the post-questionnaire, we used ANCOVAs, with the prequestionnaire scores used as covariates.
Independent sample t-tests were applied to the prequestionnaire SRL skills scores in the MG and SG conditions (Table 3). There was no significant difference (p > 0.05) in the scores for these conditions. These results suggest that SRL skills were comparable before the intervention.
ANCOVAs were applied to the post-questionnaire SRL skills scores as the dependent variables and the prequestionnaire scores as the covariates. Table 4 shows statistically significant differences (p < 0.01) in the five experimental and control conditions. The results showed that students in the experimental group scored higher, with statistically significant differences in metacognitive activities before and after learning, time management, persistence, and help-seeking subscales. In contrast, there were no significant differences in metacognitive activities during the learning and environmental structuring subscales.

4.2. Research Question 2

We applied an opinion survey to address the second RQ. Thirty-four students completed the survey (Table 5), and the questions focused on student training satisfaction, LA-based guidance usefulness, and usability perceptions. The findings from the content analysis suggest that students were satisfied with the intervention quality. Most of the participants reported that the interventions were helpful (M = 5.2, SD = 1.3), simple (M = 5, SD = 1.8), interpretable (M = 5, SD = 1.2), actionable (M = 5, SD = 1.6), enjoyable (M = 4.9, SD = 1.5), and motivating (M = 4.8, SD = 1.5). Concerning the open question “What emotions does LA use evoke?”, the topics in descending order are encouragement (n = 14), self-confidence (9), stress (9), and dissatisfaction (3).
After answering the open-ended question, “Feel free to comment on the experience of using LA”, students’ views extracted the following: “I wish we had this guidance in all courses”; “LA use helped me see my level concerning fellow students”; “Using LA helped set high rankings, and seeing I was doing better than my classmates boosted my self-confidence”; “I consider LA an excellent strategy if done correctly; otherwise, it wastes time”; “When I saw my deficiencies, I tried to focus on them”; “I prefer to configure LA based on my needs”; and “It was not the LA itself that motivated me, but that there was a sort of accountability for my learning and a motivation to know I have to stay on track”.
For the question, “In what ways did LA help or hinder the learning process?”, the answers focused on the following concepts: comparison, motivation, awareness, persistence, visualizations, self-regulation, guidance, self-confidence, and time management. Finally, the students reported positive experiences with LA-based support. A total of 89% of respondents stated that interventions provided a positive experience and 58% wanted to use LA in every course.
In parallel, we extracted the following results from the poll (75 participants) conducted on week 7 in both groups. In the question “Do you study analytics for your performance”, 48 (83%) students answered Yes and 10 (17%) answered No. In the question “Do you find reflection useful?”, 36 (62%) students answered, “Yes, I am better aware”, 11 (19%) answered, “Yes, I am becoming competitive”, 9 (16%) answered “No, it makes me anxious”, and 7 (12%) answered, “No, it is unnecessary information”. Finally, in the question “What positive emotions do analytics evoke in you?”, 35 (63%) students answered interesting, 25 (45%) motivation, 20 (36%) satisfaction, 18 (32%) encouragement, and 10 (18%) self-confidence. In contrast, for the question “What negative emotions do analytics evoke in you?”, 27 (48%) students answered curiosity, 18 (32%) anxiety, 10 (18%) irritability, 9 (16%) confusion, and 8 (14%) dissatisfaction.
Furthermore, thematic analysis was applied to the interviews (MI). The analysis of the discussions generated eleven common themes. Combining the themes and refining their semantics resulted in the eight crucial themes presented in Table 6. For instance, many students mentioned changing their behavior during the semester. This pattern suggested that students at risk of withdrawing may change their learning path and behavior after RYG intervention, and MI may further exacerbate this risk. Student ST3 illustrated this mindset: “The RYG alert awakened me, and I decided to start doing exercises”. Similarly, five students mentioned that they thought of dropping out when they finally passed the course. Three SG students who ultimately dropped out did not participate in the MI session. The students in the SG group who participated in the MI had the highest scores for SRL skills among both groups. Finally, some students mentioned the absence of student involvement in the design process.

5. Discussion and Conclusions

This study presents the intervention conditions that trigger student outcomes, providing evidence that the SG mode is more effective than the MG mode. The interpretation of the quantitative, qualitative, and MM results follows.

5.1. Research Question 1

The experimental group had higher scores than the control group (Table 2). This result is consistent with previous studies [40] stating that students tend to perform better when they accept well-targeted LA interventions. As with other contributions, we conclude that there is no performance improvement without the instructor SG. However, research into social phenomena is often contradictory. Our result contrasts with Ott et al. [21], who stated that students value feedback information but, despite high engagement, learning outcomes remain unaffected.
Another observation is that both groups were comparable regarding SRL skills at the start of the course (Table 3). Additionally, Table 4 shows that students in the SG group exhibited statistically significant improvement at the end of the course compared with those in the MG group in terms of metacognitive activities before and after learning, time management, persistence, and help seeking. These results showed that the degree of guidance significantly affects students’ SRL skills development. The effect size (ηp2) showed that the variance in skills development was due to the level of guidance. Our findings conform to those of related studies [9]. Kirschner and Hendrick [22] stated that asking students to discuss their actions can help them think like independent learners. In addition, if LA-based feedback is based solely on warning systems, it may increase the mental load, whereas combining warning systems with encouragement can result in higher emotional and cognitive engagement [12]. However, both groups’ metacognitive activities during learning and environmental structuring skills were at the same level.
Metacognition has been identified as an accurate predictor of academic performance and the ability to accomplish complex tasks [33]. Reflecting further on Table 2, Table 3 and Table 4, students who more actively regulate their learning had higher course performance [41]. These findings indicate that LA activities improve learning outcomes with appropriate SG. This conclusion is consistent with Kizilcec et al.’s [42] suggestion that additional guidance could help students persist with the course and achieve better grades. In addition, these findings agree with studies highlighting the positive effect of LA on performance [43]. Finally, self-efficacy is an essential aspect of self-regulation related to using specific strategies and self-monitoring performance [22].
In conclusion, knowing that the only difference between the groups was the level of guidance, we suggest that appropriate guidance leads to better learning outcomes and consequently actionable LA [11]. Next, we discuss how students qualitatively account for the effectiveness and adoption of LA-based interventions and to what extent they triangulate the quantitative findings from RQ1.

5.2. Research Question 2

Table 5 shows that student satisfaction was high which agrees with Nguyen et al.’s [44] findings. Students’ positive response to the usefulness of LA services concurred with the literature [29,45] and our poll’s findings (81% of students recognized LA’s usefulness). Following Viberg et al. [12], the above findings strengthen the understanding of opinions on LA qualitatively rather than as technical methods.
In addition, students’ answers extracted emerging themes associated with (a) LA quality (I had adequate guidance for using LA), (b) the effectiveness of LA (I would like LA to be applied to other courses), (c) satisfaction (LA was an enjoyable learning experience), and (d) motivation to use (LA helped me to be aware of my course). Specifically, the need for quality and timely feedback to self-reflect [29] is extracted from the following quotations: “It is insufficient to have a good score without receiving feedback. I feel there is more to improve beyond the grade”; “Few teachers care if students are going at the same pace”. Therefore, students expect their educational data to be used to inform support diminishing teacher resistance to LA adoption.
We conclude from the interviews (MI) that students had a favorable view of LA-based guidance. The main topics we extracted were behavioral change, motivation, help seeking, time management, persistence, and stress. We observed students’ satisfaction with LA to support awareness and self-reflection, which agrees with the findings of Arnold and Pistilli [19]. As described by student S17, “The guidance I had for using LA was needful”. However, students were initially not accustomed to working with LA-based feedback; therefore, guidance is necessary. In addition, we observed a positive change in attitude among students who reacted negatively before the intervention. This explains the contradiction in the dropout rates between the groups (three students dropped out in the SG and nine in the MG).
To explore differences across the datasets, some students stated dissatisfaction, stress, or anxiety; thus, HEIs cannot ignore this critical perspective. This finding is unexpected and generates unanticipated insights because prior extracted themes indicate that SG feedback may motivate the promotion of learning outcomes. A possible explanation could be that peer comparisons are stressful or discouraging. According to Roberts et al. [46], some students did not desire services that allowed peer comparisons. Students reported extreme anxiety when asked about their views on progress (e.g., underperforming). Barreiros et al. [47] propose that student opinions be included in LA-based decision making (codesign), but these opinions are often not considered [48]. Thus, although a university may view feedback and teacher effort as advantageous, they may not necessarily reflect what students want. Similarly, some students reported anxiety and irritability in the poll.
In antithesis, most SG students understood the value of guidance. Many quotes illustrate this mindset: “My grades were below the class average, so this comparison changed my study habits”; “LA offers motivation, reflection, and stress, pushing students to become more productive”; and “Using LA helped set high rankings and boosted my self-confidence”. We conclude that guidance is meaningful for improving self-regulation and performance expectancy and that peer comparisons can encourage students to improve their skills in line with the RQ1 results.
A scenario in student-facing LA involves students being shown a dashboard but failing to consider what it means to them [29] because the feedback is not explainable. This contradicts the students’ statements during the study interviews: “It is beneficial. I wish we had this specific guidance in all courses” (obligation to act and data literacy); “LA use helped me see my level concerning fellow students” (reflection and understanding); and “This thing is there and works. Go for it”.
Regarding SRL skills, SG allows students to practice SRL skills systematically. After following the MI guidelines and expressing their thinking about their study behavior, the students in the SG group were more likely to practice these skills. Finally, by reflecting on students’ subjective impressions, we observed that the students reported adequate assimilation of SRL skills as the interventions progressed. This confirms Kitto et al.’s [34] discussion that students should analyze their behavior using self-regulation methods.
Involving students in the LA design process may be complex and time-consuming. However, involving them through participatory and codesign methods can transform an unsuccessful prototype into a successful system. Therefore, shifting LA from something done to students toward something done with students is a human-centered learning analytics approach [48]. Understanding students’ priorities, values, needs, and constraints through inter-stakeholder communication leads to the agentic positioning of learners [11]. The above insights are derived from students’ statements: “LA should be tailored to my needs”; “It would help if I could configure LA based on my preferences”.
Reflecting on the poll results, most students considered LA feedback (83% answered yes) and recognized its usefulness (81%). The most prevalent positive emotions are motivation, satisfaction, and encouragement, whereas the most prevalent negative emotions are anxiety, irritability, and confusion. A comparison of the survey, poll, and MI data sources highlights similarities across the datasets. Encouragement, self-confidence, persistence, and stress are consistent themes. This makes sense for the RQ1 findings explaining the improvement in learning outcomes.
Finally, we must consider concerns about students’ perceptions. Differences have been observed between the predicted learning outcomes (judgments of learning) and the actual learning outcomes (e.g., performance). This is because of illusions of competence and an overestimation of future learning outcomes [16].

5.3. Study Limitations and Future Work

Notwithstanding that the findings are generalizable due to the random assignment of groups, we acknowledge limitations in interpreting the findings. The sample size was not sufficiently large, and the data covered one semester in a domain-specific course.
Among the aspects of SRL discussed are the findings that, although students’ beliefs about their learning can sometimes be accurate, they can inaccurately assess their actual learning, creating illusions of competence. Furthermore, the LMS captures a subset of learning events, whereas other student characteristics may influence learning outcomes. We could search for latent variables differing between the two groups. Specifically, our data lack the personal and social information that impacts learning.
Overall, this study showed that the SG group outperformed the MG group in improving student outcomes. Given that the same didactical settings were applied to both groups, this difference occurred because of the degree of guidance. We intend to replicate the study in nonformal education and new groups (teachers and students of different backgrounds) with significant at-scale populations. In this way, we could determine how our findings apply to multiple contexts. Furthermore, most related research describes systems that target students as end-users. Finally, we aim to stimulate further discussion on SRL-related LA to achieve an efficient instructional design.

Author Contributions

Conceptualization, D.E.T. and S.N.D.; methodology, D.E.T. and S.N.D.; validation, D.E.T. and S.N.D.; formal analysis, D.E.T. and S.N.D.; resources, D.E.T. and S.N.D.; data curation, D.E.T. and S.N.D.; writing—original draft preparation, D.E.T. and S.N.D.; writing—review and editing, D.E.T. and S.N.D.; visualization, D.E.T. and S.N.D.; supervision, D.E.T. and S.N.D.; project administration, D.E.T. and S.N.D. All authors have read and agreed to the published version of the manuscript.

Funding

This research received no external funding.

Institutional Review Board Statement

Not applicable.

Informed Consent Statement

Informed consent was obtained from all subjects involved in the study.

Data Availability Statement

The datasets used and analyzed during the current study are available from the corresponding author on reasonable request.

Conflicts of Interest

The authors declare no conflict of interest.

Appendix A

The Self-regulated Online Learning Questionnaire
Metacognitive activities before learning
  • I think about what I need to learn before I begin a task in this online course.
  • I ask myself questions about what I will study before I begin to learn for this online course.
  • I set short-term (daily or weekly) goals as well as long-term goals (monthly or for the whole online course).
  • I have set goals to help me manage my study time for this online course.
  • I set specific goals before beginning a task in this online course.
  • I think of alternative ways to solve a problem and choose the best one in this online course.
  • At the start of a task, I think about the study strategies I will use.
Metacognitive activities during learning
8.
When I study for this online course, I try to use strategies that have worked in the past.
9.
I have a specific purpose for each strategy used in this online course.
10.
I am aware of the strategies I use when I study for this online course.
11.
I change strategies when I do not make progress while learning for this online course.
12.
I periodically review to help me understand the important relationships in this online course.
13.
I find myself pausing regularly to check my comprehension of this online course.
14.
I ask myself questions about how well I am doing while learning something in this online course.
Metacognitive activities after learning
15.
I think about what I have learned after I finish working on this online course.
16.
I ask myself how well I accomplished my goals once I’m finished working on this online course.
17.
After studying for this online course, I reflect on what I have learned.
18.
I find myself analyzing the usefulness of the strategies after I studied for this online course.
19.
I ask myself if there are other ways to do things after I finish learning for this online course.
20.
After learning about this online course, I think about the study strategies I used.
Time management
21.
I make good use of my study time for this online course.
22.
I find it hard to adhere to a study schedule for this online course.
23.
I ensure that I keep up with the weekly readings and assignments for this online course.
24.
I often find that I do not spend very much time on this online course because of other activities.
25.
I allocate my study time to this online course.
Environmental structuring
26.
I choose the location where I will study for this online course to avoid too much distraction.
27.
I find a comfortable place to study for this online course.
28.
I know where I can study most efficiently for this online course.
29.
I have a regular place to study in this online course.
Persistence
30.
When I feel bored studying for this online course, I force myself to pay attention.
31.
When my mind begins to wander during a learning session for this online course, I make a special effort to keep concentrating.
32.
When I begin to lose interest in this online course, I push myself even further.
33.
I work hard to do well in this online course even if I don’t like what I have to do.
34.
Even when the materials in this online course are dull and uninteresting, I manage to keep working until I finish.
35.
Even when I feel lazy or bored while studying for this online course, I finish what I plan to do.
36.
When work is difficult in this online course, I continue to work.
Help seeking
37.
When I do not completely understand something, I ask other course members in this online course for ideas.
38.
I share my problems with my classmates in this course online so that we know what we are struggling with and how to solve our problems.
39.
I am persistent in getting help from the instructor of this online course.
40.
When I am not sure about some material in this online course, I check with other people.
41.
I communicate with my classmates to determine how I am doing in this online course.
42.
When I have trouble learning, I ask for help.

Appendix B

  • LA was simple to understand.
  • LA helped increase participation.
  • I prefer LA use in the learning process over traditional LA use.
  • LA helped me perform better.
  • I would like LA to be applied to other courses.
  • LA was an enjoyable learning experience.
  • LA had pedagogical value.
  • LA was confusing/non-functional.
  • There was an understandable explanation using LA.
  • LA made me feel I had better control over the learning process.
  • LA has boosted my confidence.
  • There was anonymization when using LA.
  • LA helped me be aware of the course.
  • There was a sufficient interpretation of LA.
  • A discussion was provided to explain the LA results.
  • The LA service helped me make decisions during the course through encouragement and suggestions.
  • LA maximized my motivation to engage with the course.
  • LA resulted in putting more effort into the course.
  • The guidance for using LA was adequate.
  • I ignored the use of LA throughout the course.
  • Comparing the performance of my fellow students helps me (e.g., increases competitiveness).
  • Using LA helps me seek help from fellow students and teachers.
  • What feelings does using LA evoke (e.g., dissatisfaction, encouragement, anxiety, confidence)?
  • How did LA help or hinder the learning process?
  • Feel free to comment on your experience with LA.

References

  1. Gašević, D.; Dawson, S.; Siemens, G.; Gašević, B.D.; Dawson, S. Let’s not forget: Learning analytics are about learning. TechTrends 2015, 59, 64–71. [Google Scholar] [CrossRef]
  2. Siemens, G.; Long, P. Penetrating the fog: Analytics in learning and education. EDUCAUSE Rev. 2011, 46, 30–40. [Google Scholar]
  3. Ranjeeth, S.; Latchoumi, T.P.; Paul, P.V. A survey on predictive models of learning analytics. Procedia Comput. Sci. 2020, 167, 37–46. [Google Scholar] [CrossRef]
  4. Lang, C.; Siemens, G.; Wise, A.; Gasevic, D. Handbook of Learning Analytics; SOLAR, Society for Learning Analytics and Research: New York, NY, USA, 2017. [Google Scholar] [CrossRef]
  5. Banihashem, S.K.; Noroozi, O.; van Ginkel, S.; Macfadyen, L.P.; Biemans, H.J.A. A systematic review of the role of learning analytics in enhancing feedback practices in higher education. Educ. Res. Rev. 2022, 37, 100489. [Google Scholar] [CrossRef]
  6. Herodotou, C.; Maguire, C.; McDowell, N.; Hlosta, M.; Boroowa, A. The engagement of university teachers with predictive learning analytics. Comput. Educ. 2021, 173, 104285. [Google Scholar] [CrossRef]
  7. Guzmán-Valenzuela, C.; Gómez-González, C.; Rojas-Murphy Tagle, A. Learning analytics in higher education: A preponderance of analytics but very little learning? Int. J. Educ. Technol. High. Educ. 2021, 18, 23. [Google Scholar] [CrossRef] [PubMed]
  8. Park, Y.; Jo, I.H. Development of the learning analytics dashboard to support students’ learning performance. J. Univers. Comput. Sci. 2015, 21, 110–133. [Google Scholar] [CrossRef]
  9. Wong, J.; Baars, M.; de Koning, B.B.; van der Zee, T.; Davis, D.; Khalil, M.; Houben, G.; Paas, F. Educational theories and learning analytics: From data to knowledge. In Utilizing Learning Analytics to Support Study Success; Springer: Berlin/Heidelberg, Germany, 2019; pp. 3–25. [Google Scholar] [CrossRef]
  10. Creswell, J.W. Research Design: Qualitative, Quantitative and Mixed Methods Approaches, 4th ed.; Sage: Thousand Oaks, CA, USA, 2014. [Google Scholar] [CrossRef]
  11. Dimitriadis, Y.; Martínez-Maldonado, R.; Wiley, K. Human-Centered Design Principles for Actionable Learning Analytics. In Research on E-Learning and ICT in Education; Springer: Berlin/Heidelberg, Germany, 2021; pp. 277–296. [Google Scholar] [CrossRef]
  12. Viberg, O.; Hatakka, M.; Bälter, O.; Mavroudi, A. The current landscape of learning analytics in higher education. Comput. Hum. Behav. 2018, 89, 98–110. [Google Scholar] [CrossRef]
  13. Tzimas, D.; Demetriadis, S. Ethical issues in learning analytics: A review of the field. Educ. Technol. Res. Dev. 2021, 69, 1101–1133. [Google Scholar] [CrossRef]
  14. Tzimas, D.; Demetriadis, S. Culture of Ethics in Adopting Learning Analytics. In Augmented Intelligence and Intelligent Tutoring Systems. ITS 2023. Lecture Notes in Computer Science; Frasson, C., Mylonas, P., Troussas, C., Eds.; Springer: Cham, Switzerland, 2023; Volume 13891. [Google Scholar] [CrossRef]
  15. Matcha, W.; Gašević, D.; Uzir, N.A.; Jovanović, J.; Pardo, A. Analytics of learning strategies: Associations with academic performance and feedback. ACM Int. Conf. Proc. Ser. 2019, 461–470. [Google Scholar] [CrossRef]
  16. Bjork, R.; Dunlosky, J.; Kornell, N. Self-Regulated Learning: Beliefs, Techniques, and Illusions. Annu. Rev. Psychol. 2012, 64, 417–444. [Google Scholar] [CrossRef]
  17. Tzimas, D.; Demetriadis, S. The impact of learning analytics on student performance and satisfaction in a higher education course. In Proceedings of the 14th International Conference on Educational Data Mining (EDM21), Paris, France, 29 June–2 July 2021; pp. 654–660. [Google Scholar]
  18. Sun, Z.; Xie, K.; Anderman, L.H. The role of self-regulated learning in students’ success in flipped undergraduate math courses. Internet High. Educ. 2018, 36, 41–53. [Google Scholar] [CrossRef]
  19. Arnold, K.E.; Pistilli, M.D. Course signals at Purdue: Using learning analytics to increase student success. ACM Int. Conf. Proc. Ser. 2012, 2012, 267–270. [Google Scholar] [CrossRef]
  20. Kirschner, P.; Hendrick, C.; Heal, J. How Teaching Happens: Seminal Works in Teaching and Teacher Effectiveness and What They Mean in Practice; Routledge: London, UK, 2022. [Google Scholar] [CrossRef]
  21. Ott, C.; Robins, A.; Haden, P.; Shephard, K. Illustrating performance indicators and course characteristics to support students’ self-regulated learning in CS1. Comput. Sci. Educ. 2015, 25, 174–198. [Google Scholar] [CrossRef]
  22. Kirschner, P.; Hendrick, C. How learning happens: Seminal works in educational psychology and what they mean in practice. Routledge. TechTrends 2020, 65, 120–121. [Google Scholar] [CrossRef]
  23. Soderstrom, C.; Yue, L.; Bjork, L. Metamemory and Education. In The Oxford Handbook of Metamemory; Dunlosky, J., Tauber, S.K., Eds.; Oxford Library of Psychology: Oxford, UK, 2015. [Google Scholar] [CrossRef]
  24. Zimmerman, B.J. A social cognitive view of self-regulated academic learning. J. Educ. Psychol. 1989, 81, 329–339. Available online: https://pdfs.semanticscholar.org/e1ff/53e710437e009f06bc264b093a2ba9523879.pdf (accessed on 12 November 2023). [CrossRef]
  25. Pardo, A.; Han, F.; Ellis, R.A. Combining university student self-regulated learning indicators and engagement with online learning events to predict academic performance. IEEE Trans. Learn. Technol. 2017, 10, 82–92. [Google Scholar] [CrossRef]
  26. Jovanovic, J.; Gašević, D.; Dawson, S.; Pardo, A.; Mirriahi, N. Learning analytics to unveil learning strategies in a flipped classroom. Internet High. Educ. 2017, 33, 74–85. [Google Scholar] [CrossRef]
  27. Edisherashvili, N.; Saks, K.; Pedaste, M.; Leijen, L. Supporting Self-Regulated Learning in Distance Learning Contexts at Higher Education Level: Systematic Literature Review. Front. Psychol. 2022, 12, 792422. [Google Scholar] [CrossRef] [PubMed]
  28. Jansen, R.S.; van Leeuwen, A.; Janssen, J.; Kester, L.; Kalz, M. Validation of the self-regulated online learning questionnaire. J. Comput. High. Educ. 2017, 29, 6–27. [Google Scholar] [CrossRef]
  29. Bodily, R.; Verbert, K. Trends and issues in student-facing learning analytics reporting systems research. ACM Int. Conf. Proc. Ser. 2017, 309–318. [Google Scholar] [CrossRef]
  30. West, D.; Heath, D.; Lizzio, A.; Toohey, D.; Miles, C.; Searle, B. Higher education teachers’ experiences with learning analytics in relation to student retention. Australas. J. Educ. Technol. 2016, 32, 48–60. [Google Scholar] [CrossRef]
  31. Goggins, S.P.; Galyen, K.D.; Petakovic, E.; Laffey, J.M. Connecting performance to social structure and pedagogy as a pathway to scaling learning analytics in MOOCs: An exploratory study. J. Comput. Assist. Learn. 2016, 32, 244–266. [Google Scholar] [CrossRef]
  32. Kim, D.; Park, Y.; Yoon, M.; Jo, I.H. Toward evidence-based learning analytics: Using proxy variables to improve asynchronous online discussion environments. Internet High. Educ. 2016, 30, 30–43. [Google Scholar] [CrossRef]
  33. Papamitsiou, Z.; Economides, A.A.; Pappas, I.O.; Giannakos, M.N. Explaining learning performance using response-Time, self-Regulation and satisfaction from content: An fsQCA approach. ACM Int. Conf. Proceeding Ser. 2018, 181–190. [Google Scholar] [CrossRef]
  34. Kitto, K.; Lupton, M.; Davis, K.; Waters, Z. Designing for student-facing learning analytics. Australas. J. Educ. Technol. 2017, 33, 152–168. [Google Scholar] [CrossRef]
  35. Ifenthaler, D. Are higher education institutions prepared for learning analytics? TechTrends 2017, 61, 366–371. [Google Scholar] [CrossRef]
  36. Demmans Epp, C.; Phirangee, K.; Hewitt, J.; Perfetti, C.A. Learning management system and course influences on student actions and learning experiences. In Educational Technology Research and Development; Springer: New York, NY, USA, 2020; Volume 68. [Google Scholar] [CrossRef]
  37. Tsai, Y.S.; Moreno-Marcos, P.M.; Tammets, K.; Kollom, K.; Gašević, D. SHEILA policy framework: Informing institutional strategies and policy processes of learning analytics. ACM Int. Conf. Proc. Ser. 2018, 5, 320–329. [Google Scholar] [CrossRef]
  38. Zuckoff, A. Welcome to MITRIP. Motiv. Interviewing Train. Res. Implement. Pract. 2012, 1, 1. [Google Scholar] [CrossRef]
  39. Twining, P.; Heller, R.; Nussbaum, M.; Tsai, C. Some guidance on conducting and reporting qualitative studies. Comput. Educ. 2017, 106, A1–A9. [Google Scholar] [CrossRef]
  40. Khalil, M.; Ebner, M. Clustering patterns of engagement in Massive Open Online Courses (MOOCs): The use of learning analytics to reveal student categories. J. Comput. High. Educ. 2017, 29, 114–132. [Google Scholar] [CrossRef]
  41. Jansen, R.S.; van Leeuwen, A.; Janssen, J.; Jak, S.; Kester, L. Self-regulated learning partially mediates the effect of self-regulated learning interventions on achievement in higher education: A meta-analysis. Educ. Res. Rev. 2019, 28, 100292. [Google Scholar] [CrossRef]
  42. Kizilcec, R.F.; Pérez-Sanagustín, M.; Maldonado, J.J. Self-regulated learning strategies predict learner behavior and goal attainment in Massive Open Online Courses. Comput. Educ. 2017, 104, 18–33. [Google Scholar] [CrossRef]
  43. Chen, L.; Lu, M.; Goda, Y.; Shimada, A.; Yamada, M. Learning Analytics Dashboard Supporting Metacognition; Springer: Berlin/Heidelberg, Germany, 2021; pp. 129–149. [Google Scholar] [CrossRef]
  44. Nguyen, Q.; Rienties, B.; Toetenel, L.; Ferguson, R.; Whitelock, D. Examining the designs of computer-based assessment and its impact on student engagement, satisfaction, and pass rates. Comput. Hum. Behav. 2017, 76, 703–714. [Google Scholar] [CrossRef]
  45. Smith, P. Engaging online students through peer-comparison progress dashboards. J. Appl. Res. High. Educ. 2019, 12, 38–56. [Google Scholar] [CrossRef]
  46. Roberts, L.D.; Howell, J.A.; Seaman, K.; Gibson, D.C. Student attitudes toward learning analytics in higher education: “The fitbit version of the learning world”. Front. Psychol. 2016, 7, 1959. [Google Scholar] [CrossRef] [PubMed]
  47. Barreiros, C.; Leitner, P.; Ebner, M.; Veas, E.; Lindstaedt, S. Students in Focus–Moving Towards Human-Centred Learning Analytics. In Practicable Learning Analytics. Advances in Analytics for Learning and Teaching; Viberg, O., Grönlund, Å., Eds.; Springer: Cham, Switzerland, 2023. [Google Scholar] [CrossRef]
  48. Buckingham Shum, S.; Ferguson, R.; Martinez-Maldonado, R. Human-Centred Learning Analytics. J. Learn. Anal. 2019, 6, 1–9. [Google Scholar] [CrossRef]
Figure 1. Screenshot of the feedback for students. LMS access per student.
Education 14 00092 g001
Figure 2. Personalized feedback with visualizations.
Education 14 00092 g002
Figure 3. Students’ progress.
Education 14 00092 g003
Figure 4. View per student.
Education 14 00092 g004
Figure 5. Diagram of the triangulation design procedures used in this research.
Education 14 00092 g005
Table 1. Guide to MI with the students.
CodeQuestions
(Q1)What is your LA-based learning experience as a whole? Were the analytics valuable?
(Q2)Are you satisfied with your study behavior? Under which criteria did you decide to change?
(Q3)What changes do you need to make to improve your performance?
(Q4)Specify which interventions helped improve your performance. Explain how they influenced your behavior.
(Q5)How much would you rate yourself thus far, and why?
(Q6)How similar are your test scores to those of others?
(Q7)What positive or negative emotions do analytics evoke in you? Have you considered dropping out of the course?
(Q8)Do you have any comments to add that we have not already discussed?
Table 2. Performance t-test results for the experimental and control groups.
GroupNMSDt (91)p
Experimental477.222.712.750.007
Control465.283.95
Table 3. Independent samples t-test prequestionnaire results between the groups.
SRL SkillsSG (N = 38)MG (N = 31)pt (67)
M (SD)M (SD)
Metacognitive activities before learning3.47 (1.33)3.19 (1.22)0.3700,90
Metacognitive activities during learning3.50 (1.20)3.29 (1.27)0.4850.70
Metacognitive activities after learning2.90 (1.29)3.06 (1.15)0.602−0.52
Time management3.21 (1.11)3.22 (1.23)0.957−0.54
Environmental structuring5.42 (1.64)5.09 (1.61)0.4150.82
Persistence3.10 (1.35)2.83 (1.09)0.3790.88
Help seeking3.34 (1.75)3.16 (1.45)0.6470.46
Table 4. Post-test questionnaire analysis: ANCOVA results between the groups.
SRL SkillsSG (N = 38)MG (N = 31)ANCOVA
M (SD)M (SD)
Metacognitive activities before learning5.21 (1.50)4.20 (1.17)F [1,66] = 8.375, p = 0.005 *, ηp2 = 0.113
Metacognitive activities during learning4.21 (1.31)4.09 (1.16)F [1,66] = 0.001, p = 0.975, ηp2 = 0.000
Metacognitive activities after learning4.93 (1.38)3.70 (1.20)F [1,66] = 27.398, p = 0.000 *, ηp2 = 0.293
Time management5.34 (1.12)4.12 (1.28)F [1,66] = 22.502, p = 0.000 *, ηp2 = 0.254
Environmental structuring5.35 (1.51)4.75 (1.54)F [1,66] = 2.521, p = 0.117, ηp2 = 0.037
Persistence5.21 (1.52)3.70 (1.21)F [1,66] = 22.181, p = 0.000 *, ηp2 = 0.252
Help seeking5.17 (1.43)3.80 (1.54)F [1,66] = 25.266, p = 0.000 *, ηp2 = 0.277
* Significant difference at the 0.05 level.
Table 5. Summary of student opinion survey descriptive statistics (N = 34).
Survey StatementsMSD
LA quality
LA was simple to understand5.01.8
LA helped increase participation4.91.6
The guidance for using LA was adequate5.01.6
There was a sufficient interpretation of the LA5.01.2
Effectiveness of LA on SRL skills
I prefer LA use in the learning process over the traditional one4.71.6
I would like LA to be applied to other courses4.91.8
LA resulted in putting more effort into the course4.41.7
LA made me feel I had better control over the learning process4.61.9
Student satisfaction
LA was an enjoyable learning experience4.91.5
LA had pedagogical value4.51.5
LA has boosted my confidence4.41.5
LA maximized my motivation to engage in the course4.81.5
Motivation to use
There was an understandable explanation using the LA5.01.2
A discussion was conducted to explain the LA results5.01.6
LA helped me be aware of the course5.21.3
Table 6. Interview results—Qualitative themes.
ThemeSample Evidence QuotesFreq. (n = 36)
Behavior changeThe RYG alert awakened me, and I decided to start doing exercises (ST3)52%
GuidanceMy grades were below the class average; therefore, this comparison changed my study habits (ST17)45%
Help seekingLA services encouraged me to ask for support (ST32)39%
MotivationLA motivated me to keep trying (ST5)34%
InvolvementLA should be tailored to my needs (ST15)17%
Time managementLA gave me study orientation, e.g., time management (ST11)17%
PersistenceLA resulted in putting more effort (ST29)16%
StressLA intrigued and stressed me creatively (ST26)14%
Disclaimer/Publisher’s Note: The statements, opinions and data contained in all publications are solely those of the individual author(s) and contributor(s) and not of MDPI and/or the editor(s). MDPI and/or the editor(s) disclaim responsibility for any injury to people or property resulting from any ideas, methods, instructions or products referred to in the content.

