Article

The Effects of Attitudes towards Mathematics and STEM Education on High-Ability Students and a Community Sample

by
Elena Rodríguez-Naveiras
1,*,
Sergio Chinea
1,
Triana Aguirre
2,
Nathalia Manduca
3,
Teresa González Pérez
2 and
África Borges
1
1
Department of Clinical Psychology, Psychobiology and Methodology, Faculty of Psychology and Speech Therapy, University of La Laguna, 38200 San Cristóbal de La Laguna, Spain
2
Faculty of Psychology, University of Bristol, Bristol BS8 1QU, UK
3
Department of History and Philosophy of Science, Education and Language, Faculty of Education, University of La Laguna, 38200 San Cristóbal de La Laguna, Spain
*
Author to whom correspondence should be addressed.
Educ. Sci. 2024, 14(1), 41; https://doi.org/10.3390/educsci14010041
Submission received: 23 October 2023 / Revised: 5 December 2023 / Accepted: 18 December 2023 / Published: 29 December 2023
(This article belongs to the Special Issue Talent and Education: Approaches, Assessments and Intervention)

Abstract

:
Mathematic proficiency has long been associated with the male gender and with high levels of intelligence. Similarly, STEM careers have been linked to the male gender, so both ideas are central to the present article. This study aims to observe differences in attitudes towards mathematic and STEM careers, considering, on the one hand, gender differences and, on the other hand, intelligence, separating the latter variable into a high-ability group and a normative intelligence group. A mixed methods approach was used for the analysis due to its methodological richness, using a reduced version of the Expectations and Values Questionnaire (EVQ) analysed using SPSS v. 25 and two open-ended questions analysed qualitatively using the ALCESTE software. v.1. The results show differences as a function of intelligence, but no gender differences were observed. It is concluded that the results challenge historical conceptions of attitudes towards mathematic and STEM careers.

1. Introduction

STEM (science, technology, engineering and mathematics) careers have drawn increasing interest over the years. The study of and work in these fields is a necessity in this globalized and competitive world with constant innovation and changing needs [1], in which STEM careers are becoming more relevant [2,3,4]. However, the number of students who select STEM careers is currently insufficient to fill the positions in the STEM job market, which is growing [5]. Therefore, it is critical to increase the number of students pursuing STEM pathways [4].
A gender gap in participation in these degrees has been observed [6], especially in professions that tend to be male dominated, with a large technological, scientific and mathematical component [7,8], but these gender-based differences in scientific, specifically mathematic, performance have diminished in the last few years in various countries [9,10].
It has been stated that teaching mathematics has become an arduous task [11] and that, for most people, learning mathematics is difficult because of how unstable the variables are [12]. Research has shown that student interest is one of the main factors contributing to students’ selection of STEM courses [13] and STEM-related fields [14,15], and adolescents with interests and talents in mathematics are more likely to pursue STEM in postsecondary education [16,17,18,19], so trying to increase students’ interest in STEM in general and in mathematics specifically could be important today [20,21].
In the same way, studies have shown that students’ mathematical self-efficacy is related to their interest in STEM careers; more specifically, some variables, such as self-efficacy in mathematics, mathematics achievement and success, play a critical role in influencing students’ interest in STEM careers [4,21,22,23,24].
Nevertheless, there are cultural and social factors that suggest that gender stereotypes assign certain abilities or qualities to the sexes. According to [25], gender stereotypes in our society are established and linked to learning capabilities. For example, some believe that girls are not good at mathematics and boys are, that girls like art but boys should not enjoy it or that boys should play sports and girls should not.
These sociocultural factors make us associate different traits and attitudes to men and women since childhood, making us assign to each gender certain stereotypes and conferring a selection of behaviours, roles and activities to both genders [26,27].
Regarding the latter, many investigations have shown that children believe mathematical-performance stereotypes. Children between 5 and 6 years old already display gender stereotypes related to mathematic performance and attitudes that suggest that males are more competent [28,29].
Refs. [30,31] found gender-based differences in mathematical success. After investigating affective variables and beliefs, such as complaints about the usefulness of and confidence in learning this subject, they proved that men showed higher confidence and stated that mathematics was more useful for them than for women. According to [12], this idea has remained prevalent in more recent studies. High school students of both sexes believe that boys need more mathematical knowledge than girls to obtain successful jobs and have a better adult life.
In addition to the pattern based on a general perception of males’ greater mathematical competence, they perceive that success in this subject is purely based on ability and that praise regarding mathematics in an academic context will create a successful life for them in the future. Girls, on the other hand, show a lack of confidence in future achievements, a smaller social impact of their grades (based on whether their teachers like them) and an inferior self-concept of their mathematical competence [12]. This attitudinal pattern, related to males’ superiority and ease compared to that of females in mathematics, is also observed among female high school students. Ref. [32] found that the female gender has a large effect on success and failure attribution based on ability.
Nonetheless, not every study supports this idea of male dominance, and some show discordant results, pointing out that there is no evidence of gender-based differences in performance [9,33] or attitude [34]. Moreover, [35] stated that women showed more of a positive attitude towards mathematics than men.
The Programme for International Student Assessment, specifically the results regarding mathematical competence, show that the margin in gender-based differences has decreased in every edition. For example, in 2015, the difference between the sexes was 3.23%, favouring males; meanwhile, in 2018, it was 1.65%, favouring males. This shows that in Spain, this difference regarding mathematics exists but is decreasing over time [36].
The existence of cognitive differences between the sexes has been frequently studied over the last few years, with a great variety of studies showing a clear difference in cognitive abilities between the sexes. Women stand out in verbal ability [37] and input rate [38], whereas men stand out in spatial ability [38,39] and mathematics [40,41].
Nonetheless, investigations have shown that said cognitive ability differences between the sexes have more to do with cultural differences [33,42,43,44,45] and the effects of socialization more than anatomy, physiological nature or cognition.
On the other hand, we must consider the role that intelligence can play in the attitudes towards mathematics, which is why high-ability students may have a different attitude towards this subject. It should be emphasised that one of these students’ main characteristics is precisely their remarkable skills, whether intellectual, social, motor, mechanic or artistic [46,47,48], when said abilities are compared to those of their peers [49].
A study on high-ability students showed that academic success could be explained, in a way, by the intellectual ability they possess [2,50,51] as well as the attitude and motivation they present while learning the subject [52,53,54,55]. However, the investigation presents other factors that affect their attitudes towards mathematics, such as the type of teachers they have [56,57,58] and their family environment [59,60].
That is why it is interesting to observe whether gender still affects mathematical capacity indirectly through intelligence or, on the contrary, is not decisive. The results of various investigations indicate that males stand out in mathematics [40,41] and that females generally present a negative attitude towards this subject and their mathematical ability [61,62].
Considering the results of such investigations, no conclusion can be reached on gender-based differences or mathematic ability depending on intellectual capacity or the perception of competence and attitudes towards learning mathematics. Therefore, this article is intended to contribute to the study of possible differences in the learning of this subject and the study of STEM careers regarding gender and intellectual capacity. This objective is very relevant from an educational point of view, in order to promote gender-independent learning without limitations for the students.
In light of the above-mentioned results, two research questions are developed. First, to what extent does gender influence interest in mathematics? Second, to what extent does having or not having a high ability influence one’s interest in mathematics?

2. Materials and Methods

2.1. Methodology and Design

In order to respond to the objective of this research, to observe the differences in attitudes towards mathematic and STEM careers, considering, on the one hand, gender differences and, on the other hand, intelligence, an expo facto design was carried out, in which the covariations between two independent variables of the sample, high ability or normative intelligence group and male or female gender, were compared, the dependent variable being the score in the instrument called the Expectations and Values Questionnaire (EVQ). The independent variables are intelligence and gender, and the dependent variables are the Expectations and Values Questionnaire (EVQ) factors.

2.2. Sample

The sample comprised 1147 participants between the ages of 11 and 17 and between their first and third years of high school, selected by convenience sampling of schools belonging to the autonomous community of the Canary Islands. From this larger sample, an intentional selection was made to obtain a high-ability population and a complementary population without high abilities. After the high-ability sample was obtained, the students that formed this group were matched based on gender, age and year with members of the other group to obtain two groups, both as homogenous as possible. Finally, each group comprised 101 participants: 41 women, 58 men and 2 non-binary people.
Table 1 shows the intentionally selected participants as well as the means and standard deviations of the ages in both groups, divided by gender.
It should be emphasised that those who identified themselves as “other” were eliminated from the study, because the number of people in this category was not representative of the total sample.
In Table 2, participants are shown by gender and course.
It should be emphasised that those who identified themselves in the category of “other” were eliminated from this study, since the amount of people in this category was not representative with respect of the total sample.

2.3. Research Instruments

To determine, in the first instance, the students’ intelligence and to form groups based on said intelligence, the Matrices-TAI questionnaire was used, which consists of 27 items from a set of 326 items, selected after the Bayesian EAP estimation was established. For first- and second-year students, level D of this instrument was used, whereas for third-year students, level E was used. The data collection process is ongoing, so the reliability values cannot be provided at this moment [63].
To establish gender stereotypes related to mathematics and STEM career choices, the shortened version of the Expectations and Values Questionnaire (EVQ) was used. This questionnaire consists of 26 items and utilizes a Likert scale ranging from 1 to 7. Per the authors, α = 0.858 and the construct validity is 0.825 [64].
Additionally, a qualitive analysis was conducted based on two open-ended questions included in said questionnaire. The question was, “Do you plan to pursue a STEM career? Why?”

2.4. Procedure

After the project’s approval by the Committee on Ethics in Research and Animal Welfare (CEIBA) of the University of La Laguna, which verified that this project complies with the ethical and data projection requirements of this type of research and whose registration number is CEIBA2021-0449, the sample was accessed. First, authorization was requested from the institutes involved for participation in this study. After this authorization was obtained, a document was provided so the students and their parents had proof of the realization of the tests and the data’s confidentiality. Also, families were provided with a document for authorization by the parents of those students under 14 years of age. Once they were obtained, the test pass with the instruments used was conducted in each centre’s facilities. Several scales were passed, among which were those used in this study. The tests were administered in person, and researchers as well as teachers of the centres were present at all times. Data were collected online with the support that the centres had available, mainly computers or tablets. Participants were not offered any incentive.
In addition, before the tests began, students were informed about data protection and that the information collected would be used only for academic purposes. Also, an individual code was provided for each student to maintain the data’s anonymity.

2.5. Data Analysis

A quantitative and qualitative analysis was conducted to observe the possible differences in the attitudes towards mathematic and STEM careers and to determine whether there is a difference based on gender and intelligence.
Considering the quantitative analysis, Cronbach’s alpha was first checked from the complete questionnaire and from the factors independently, and the items that required it were reverse scored. Second, differences based on intellectual capacity and gender were verified by conducting a MANOVA for the factors, in which the independent variables were gender and intelligence, and the dependent variables were each of the factors. These quantitative analyses were conducted with SPSS, version 25.
The qualitative analysis was conducted with ALCESTE, created by [65] in the framework of the investigation of linguistic analysis methods. This software allows users to examine the structure of the vocabulary used as well as linguistic materials, such as open questions in questionnaires [66]. After analysis, the software provides several classes, depending on the correlation between the verbal content provided. Therefore, the software’s author states that it is relevant to consider the context in which the answers are given to obtain a better understanding of the results and not only to perform a structural analysis of the content [67,68].

3. Results

3.1. Descriptive Data

Regarding the quantitative analyses’ results, an analysis of the instrument’s reliability was conducted as well as of the factors that compose it. Table 3 shows the Cronbach’s alpha results.
Table 4 shows the descriptive data for both groups in the instrument used, the reduced version of the EVQ and its factors.
To verify homoscedasticity, the Levene statistic was calculated to check the existence of variance of the samples (see Table 5).

3.2. Quantitative Data

The MANOVA analysis revealed that the difference in terms of gender is not significant (λ de Willks = 0.953; F(5, 190) = 1.865; p = 0.102), presenting a small effect size (η²p = 0.047).
However, the within-group differences are significant (λ de Willks = 0.927; F(5, 190) = 3.009; p = 0.012), presenting a mean effect size (η²p = 0.073). The univariate contrast results show significant differences in two factors: enjoyment, presenting a medium effect size, and importance, presenting a small effect size. Table 6 shows the results of this analysis.
Finally, regarding the interaction between the gender and intelligence variables, the differences are not statistically significant (λ de Willks = 0.97; F(5, 190) = 1.191; p = 0.305), showing a small effect size (η²p = 0.03).

3.3. Qualitative Data

Furthermore, to gather information about the participants’ attitudes towards the two constructs, two open-ended questions were used, and the ALCESTE program was used for analysis. Specifically, two separate analyses were conducted, one for each group. The analysis of the normative group resulted in four classes, explaining 59% of the elementary context units (ECUs), with a high relevance of the analysis. The classes are organized as follows: class 1 is connected to two branches, one of which contains class 2, and the other branch comprises two classes, 3 and 4 (see Figure 1).
The first class refers to the interest shown by students in STEM careers and represents 20.69% (12 ECUs), the most representative term being “interest”; given its representativeness, class 1 is given the following name: interest in STEM careers. Table 7 presents the four most representative examples of this class.
The second class is the one that presents the largest percentage and refers to the students’ career choice, which accounts for 36.21% (21 ECUs), and the most representative word is “study”; given its representativeness, class 2 is given the following name: career choice. Table 8 shows four of the most representative examples of this class.
The third class references the students’ dissatisfaction with STEM careers, which accounts for 24.14% (14 ECUs), and the most representative term is “would like”; given its representativeness, class 3 is given the following name: dissatisfaction towards STEM. Table 9 shows four of the most representative examples of this class.
The fourth and last class references the students’ interest in scientific careers and presents 18.96% (11 ECUs), and the most representative word is “science”; given its representativeness, class 4 is given the following name: scientific interest. Table 10 shows the four most representative examples of this class.
On the other hand, the high-ability group analysis reveals five classes, which explain 73% of the ECUs, with a high relevance in the analysis. The classes are organized as follows: class 1 connects with two branches, one of them containing class 2, and the other branch includes class 3 on one side and classes 4 and 5 on the other, with classes 4 and 5 being interconnected (see Figure 2).
The first class refers to the students’ expectations when considering future careers related to technology or engineering, representing 25.35% (19 ECUs), and the most represented term “technology”; given its representativeness, the following name is given to class 1: expectations on technologic and engineering careers. Table 11 shows the four most representative examples of this class.
The second class refers to the self-perception of capability when it comes to pursuing a STEM career, with 24% (18 ECUs), and is most represented by the phrase “be good at”; given its representativeness, the following name is given to class 2: capacity to face STEM careers. Table 12 shows the four most representative examples of this class.
The third class references the students’ expectations regarding future career choices related to mathematics or science, representing 20% (15 ECUs), and the most representative word is “mathematics”; therefore, class 3 is called expectations of mathematic and scientific career choice. Table 13 shows the four most representative examples of the class.
The fourth class refers to the students’ general interest in STEM careers, representing 16% (12 ECUs). The most representative word was “interest”; therefore, class 4 is called interest towards STEM careers. Table 14 shows the most representative examples of this class.
Finally, the fifth class refers to students’ determination to pursue a particular career, whether STEM or not, and represents 14.67% (11 ECUs). Class 5 is referred to as determination towards specific careers. Table 15 shows the four most representative examples.

4. Discussion

This research was based on two fundamental questions: To what extent does gender influence interest in mathematics? Secondly, to what extent does having or not having high abilities influence interest in mathematics? Given the ample opportunities the mixed-method approach offers, the results show that, contrary to the expectation that the high-ability group would score higher than the normative group in their attitudes towards mathematic and STEM careers, the normative group scored higher. Furthermore, the analysis of the factors revealed that in two of the five factors, the normative group scored higher than the high-ability group, specifically in terms of their enjoyment of mathematics and their belief in the importance of mathematics for their future. On the other hand, for the remaining three factors, no significant differences were observed in favour of either group.
Nonetheless, these differences may be attributed to the possibility that the instrument uses items that may not be fully adapted to the high-ability group or may not accurately capture the construct, considering the context in which the students are placed. Because this study focuses on secondary education students, the content of mathematics taught in class may be geared towards the normative population, making it less interesting or engaging for the group with high abilities. This can be observed, for instance, in items such as number 3, which states, “I learn many interesting things in mathematics”. Students with high abilities might already be familiar with the curriculum being taught and may not feel that they are learning new content or may feel that they are not being challenged. For future research involving students with high abilities, it may be beneficial to use a different instrument that is better adapted to the specific context in which these students are placed. Such an assessment can better capture their attitudes towards and perceptions of mathematics and STEM fields, providing a more accurate understanding of their experiences and interests.
On the other hand, no gender differences were observed for any of the factors. Research on attitudes towards mathematics has shown varied results regarding gender differences. As in the current study, [9,33] found no gender differences in this subject among adolescents. However, [35] observed that women perceived greater opportunities in math classes and showed a greater interest in mathematics than men. These findings, particularly regarding mathematics, are becoming increasingly uncommon.
Finally, a mixed analysis offers the possibility of providing an expanded view of the research results. This increases the relevance of the study, as it complements the quantitative results with the qualitative analysis and allows for a detailed explanation of what subjects report in detail in the open-ended answers of a questionnaire.
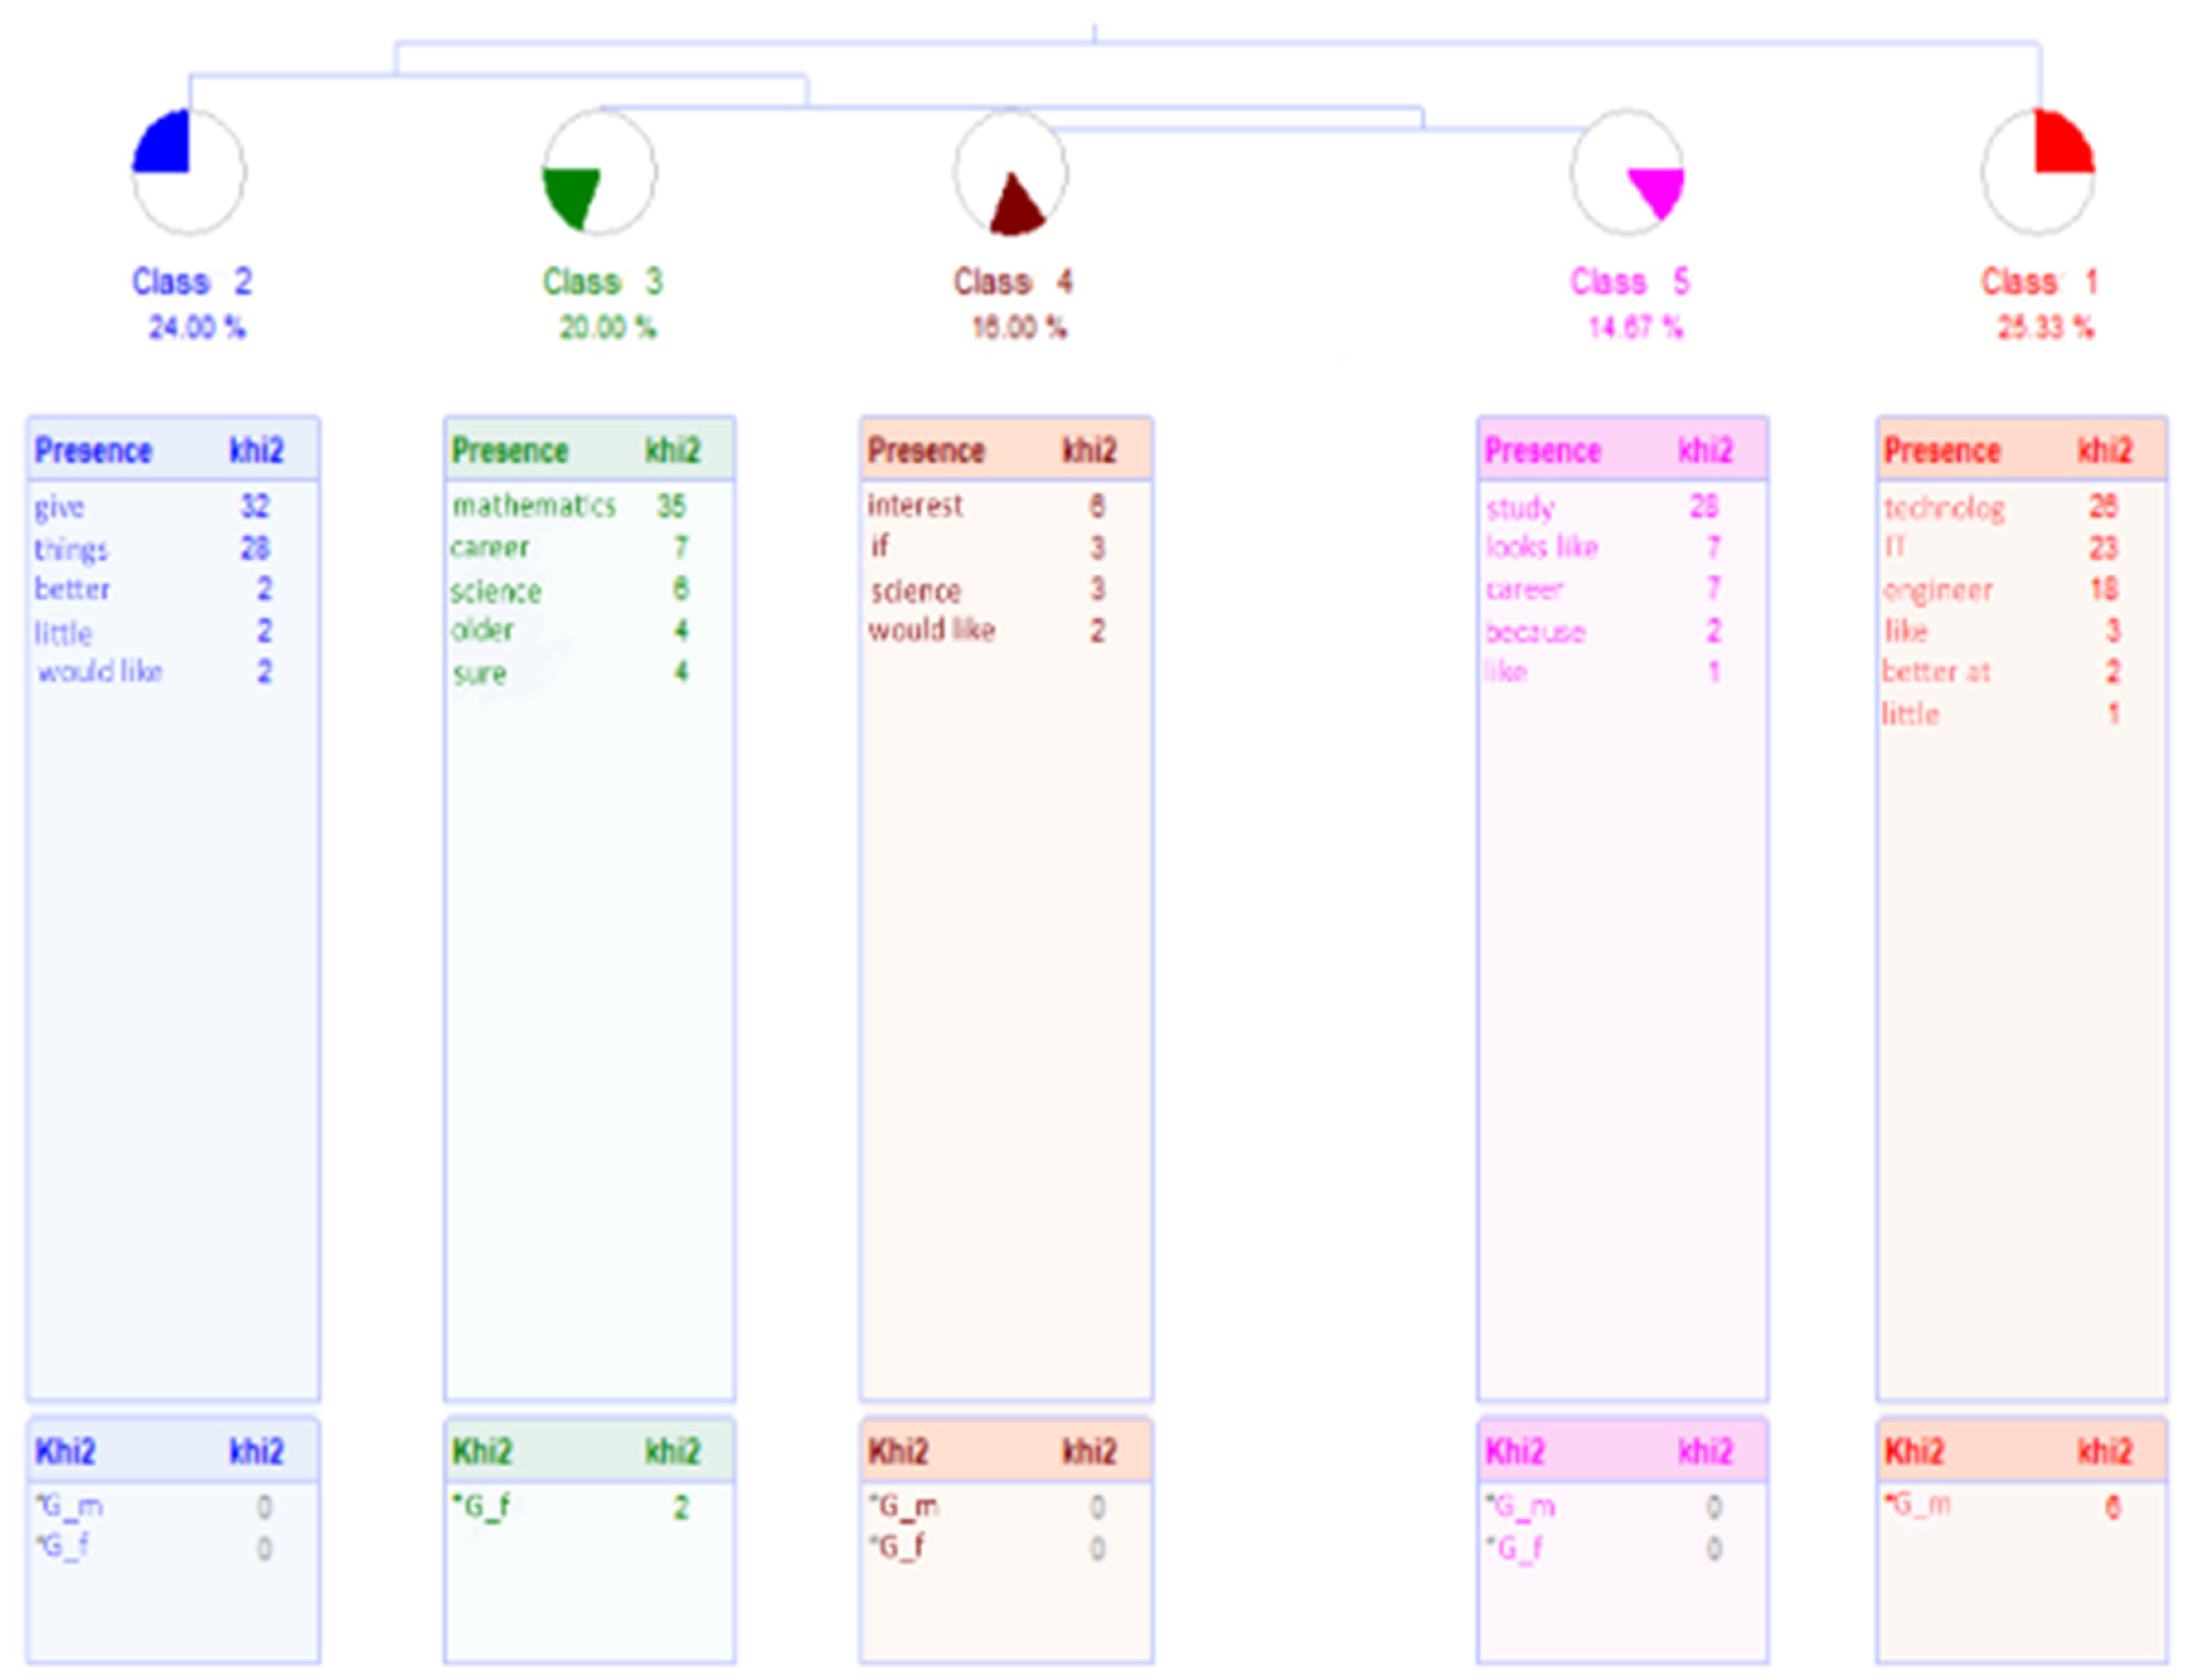
Regarding the qualitative analysis of the choice of STEM careers [2,3,4], the high-ability group provided responses with more substantial content as well as longer and denser explanations and showed a stronger connection to the topic of STEM careers. They offered explanations for why they do or do not want to pursue STEM careers, and in the latter case, they outlined alternative career options they plan or wish to pursue in the future. On the other hand, in the normative group, more responses and explanations focused solely on whether they like or are interested in these types of careers without providing extensive explanations for why they do not like or are not interested in them. Also, the comparison of the classes obtained in the ALCESTE analysis makes it evident that the high-ability group’s classes are more closely related to the topic of STEM careers. Additionally, students in this group made connections between two STEM careers on two occasions, namely, between technological and engineering (as observed in class 1) and between mathematics- and science-related careers (as found in class 3).

5. Conclusions

This study shows that highly able pupils do not stand out in terms of their interest in or enjoyment of mathematics compared to a normal group. There are no significant gender differences in liking mathematics. When choosing STEM careers, highly able pupils explain better why they are interested in STEM than the normal group. Highly able pupils are more likely to choose technological and engineering careers as well as mathematics- and science-related careers. This study contributes to the knowledge of the differences in the learning of the subject of mathematics and the study of STEM careers in relation to gender and intellectual ability. This is highly relevant from an educational point of view, as it promotes gender-independent and unconstrained learning for the student body. In this sense, the mixed method was a key factor to the approach of analysing the data, offering a joint and reinforced analysis between qualitative and quantitative.

Author Contributions

Conceptualization, S.C., T.A., T.G.P. and Á.B.; methodology, Á.B., T.A. and E.R.-N.; software, Á.B. and E.R.-N.; validation, N.M. and Á.B.; formal analysis, Á.B. and S.C.; investigation, Á.B., T.A. and S.C.; resources, N.M. and S.C.; data curation, Á.B., T.A. and S.C.; writing—original draft preparation, S.C. and Á.B.; writing—review and editing, Á.B., S.C., T.A., E.R.-N., N.M. and T.G.P.; visualization, N.M. and E.R.-N.; supervision, Á.B.; project administration, T.A., T.G.P. and Á.B.; funding acquisition, T.G.P., Á.B. and S.C. All authors have read and agreed to the published version of the manuscript.

Funding

This work was carried out with funding from the CajaCanarias Foundation (Women’s empowerment: educating for STEM talent incentivization Ref. 2020EDU05).

Institutional Review Board Statement

This study was conducted in accordance with the guidelines of the Declaration of Helsinki. The information will be used for strictly academic and research purposes as stipulated in the current Organic Law 3/2018 of 5 December on Personal Data Protection and guarantee of digital rights (BOE no. 294 of 6 December). The Research Ethics and Animal Welfare Committee (CEIBA) of the University of La Laguna approved this proposal on 14 April 2021, with the code CEIBA2021-0449.

Informed Consent Statement

Informed consent was obtained from all subjects involved in this study.

Data Availability Statement

The data presented in this study are available upon request from the corresponding author due to restrictions, privacy and ethical constraints.

Conflicts of Interest

The authors declare no conflicts of interest.

References

  1. Bordalba, M.M.; Bochaca, J.G. Accesibilidad y alfabetización digital: Barreras para la integración de las TIC en la comunicación familia/escuela. Rev. Investig. Educ. 2018, 36, 239–257. [Google Scholar] [CrossRef]
  2. García-Perales, R.; Almeida, L. Programa de enriquecimiento para alumnado con alta capacidad: Efectos positivos para el currículum. Comun. Rev. Científica Comun. Educ. 2019, 27, 39–48. [Google Scholar] [CrossRef]
  3. Descifrar el Código: La Educación de las Niñas y las Mujeres en Ciencias, Tecnología, Ingeniería y Matemáticas (STEM). Available online: https://unesdoc.unesco.org/ark:/48223/pf0000366649 (accessed on 20 September 2023).
  4. Kwon, H.; Vela, K.; Williams, A.; Barroso, L. Mathematics and Science Self-Efficacy and STEM Careers: A Path Analysis. J. Math. Educ. 2019, 12, 66–81. [Google Scholar]
  5. Connecting Informal STEM Experiences to Career Choices: Identifying the Pathway | STELAR—STEM Learning and Research Center. Available online: https://stelar.edc.org/publications/connecting-informal-stem-experiences-career-choices-identifying-pathway (accessed on 11 November 2023).
  6. PISA 2015 Results (Volume I): Excellence and Equity in Education. Available online: https://read.oecd-ilibrary.org/education/pisa-2015-results-volume-i_9789264266490-en (accessed on 20 September 2023).
  7. Kahn, S.; Ginther, D. Women and STEM; National Bureau of Economic Research: Cambridge, MA, USA, 2017. [Google Scholar]
  8. Hyde, J.S.; Lindberg, S.M.; Linn, M.C.; Ellis, A.B.; Williams, C.C. Gender Similarities Characterize Math Performance. Science 2008, 321, 494. [Google Scholar] [CrossRef] [PubMed]
  9. Mullis, I.V.S.; Martin, M.O.; Loveless, T. 20 Years of TIMSS: International Trends in Mathematics and Science Achievement, Curriculum, and Instruction; IEA TIMSS&PIRLS International Study Center Lynch School of Education, Boston College: Chestnut Hill, MA, USA, 2016. [Google Scholar]
  10. Bishop, A.J. Enseñanza de las Matemáticas: ¿Cómo Beneficiar a Todos los Alumnos? In Matemáticas y Educación: Retos y Cambios Desde una Perspectiva Internacional; CreateSpace: North Charleston, SC, USA, 2000; pp. 35–56. ISBN 84-7827-246-1. [Google Scholar]
  11. González-Pineda, J.; Fernández-Cueli, M.; Suárez, N.; Fernández, E.; Tuero-Herrero, E.; Garcia, T.; Helena, E. Diferencias de Género En Actitudes Hacia Las Matemáticas En La Enseñanza Obligatoria. Rev. Iberoam. Psicol. Salud 2012, 3, 1–87. [Google Scholar]
  12. Subotnik, R.; Tai, R.; Rickoff, R.; Almarode, J. Specialized Public High Schools of Science, Mathematics, and Technology and the STEM Pipeline: What Do We Know Now and What Will We Know in 5 Years? Roeper Rev. 2010, 32, 7–16. [Google Scholar] [CrossRef]
  13. Riskowski, J.; Todd, C.; Wee, B.; Dark, M.; Harbor, J. Exploring the Effectiveness of an Interdisciplinary Water Resources Engineering Module in an Eighth Grade Science Course. Int. J. Eng. Educ. 2009, 25, 181. [Google Scholar]
  14. Sanders, M. STEM, STEM Education, STEMmania. Technol. Teach. 2009, 68, 20–26. [Google Scholar]
  15. Pyryt, M. Talent Development in Science and Technology. In International Handbook of Giftedness and Talent; Elsevier: Amsterdam, The Netherlands, 2000; pp. 427–437. [Google Scholar] [CrossRef]
  16. Subotnik, R.; Duschl, R.; Selmon, E. Retention and Attrition of Science Talent: A Longitudinal Study of Westinghouse Science Talent Search Winners. Int. J. Sci. Educ. 1993, 15, 61–72. [Google Scholar] [CrossRef]
  17. Tai, R.; Liu, C.; Maltese, A.; Fan, X. Planning Early for Careers in Science. Science 2006, 312, 1143–1144. [Google Scholar] [CrossRef]
  18. Webb-Williams, J. Science Self-Efficacy in the Primary Classroom: Using Mixed Methods to Investigate Sources of Self-Efficacy. Res. Sci. Educ. 2018, 48, 939–961. [Google Scholar] [CrossRef]
  19. Tyler-Wood, T.; Knezek, G.; Christensen, R. Instruments for Assessing Interest in STEM Content and Careers. J. Technol. Teach. Educ. 2010, 18, 345–368. [Google Scholar]
  20. Wang, X. Why Students Choose STEM Majors: Motivation, High School Learning, and Postsecondary Context of Support. Am. Educ. Res. J. 2013, 50, 1081–1121. [Google Scholar] [CrossRef]
  21. Keşan, C.; Kaya, D. Mathematics and Science Self-Efficacy Resources as the Predictor of Academic Success. Int. Online J. Educ. Sci. 2018, 10, 45–58. [Google Scholar] [CrossRef]
  22. Rask, K. Attrition in STEM Fields at a Liberal Arts College: The Importance of Grades and Pre-Collegiate Preferences. Work. Pap. 2010, 29, 892–900. [Google Scholar] [CrossRef]
  23. Tyson, W.; Lee, R.; Borman, K.; Hanson, M. Science, Technology, Engineering, and Mathematics (STEM) Pathways: High School Science and Math Coursework and Postsecondary Degree Attainment. J. Educ. Stud. Placed Risk Jespar 2007, 12, 243–270. [Google Scholar] [CrossRef]
  24. UNICEF. Creciendo en igualdad. In Guía para Madres, Padres, Tutores y Profesorado para Enfrentar los Estereotipos de Género y Promover un trato Igualitario Entre Niños, Niñas y Adolescentes; UNICEF: New York, NY, USA, 2021. [Google Scholar]
  25. Davies, P.G.; Spencer, S.J.; Steele, C.M. Clearing the Air: Identity Safety Moderates the Effects of Stereotype Threat on Women’s Leadership Aspirations. J. Pers. Soc. Psychol. 2005, 88, 276–287. [Google Scholar] [CrossRef] [PubMed]
  26. Steele, C.M.; Spencer, S.J.; Aronson, J. Contending with Group Image: The Psychology of Stereotype and Social Identity Threat. In Advances in Experimental Social Psychology; Academic Press: San Diego, CA, USA, 2002; Volume 34, pp. 379–440. [Google Scholar] [CrossRef]
  27. Del Río, M.F.; Strasser, K.; Susperreguy, M.I. ¿Son Las Habilidades Matemáticas Un Asunto de Género?: Los Estereotipos de Género Acerca de Las Matemáticas En Niños y Niñas de Kínder, Sus Familias y Educadoras. Calid. En Educ. 2016, 45, 20–53. [Google Scholar] [CrossRef]
  28. Galdi, S.; Cadinu, M.; Tomasetto, C. The Roots of Stereotype Threat: When Automatic Associations Disrupt Girls’ Math Performance. Child Dev. 2013, 85, 250–263. [Google Scholar] [CrossRef]
  29. Fennema, E.; Sherman, J. Sex-Related Differences in Mathematics Achievement, Spatial Visualization and Affective Factors. Am. Educ. Res. J. 1977, 14, 51–71. [Google Scholar] [CrossRef]
  30. Fennema, E.H.; Sherman, J.A. Sex-Related Differences in Mathematics Achievement and Related Factors: A Further Study. J. Res. Math. Educ. 1978, 9, 189–203. [Google Scholar] [CrossRef]
  31. Cerda, G.; Vera, A. Rendimiento En Matemáticas: Rol de Distintas Variables Cognitivas y Emocionales, Su Efecto Diferencial En Función Del Sexo de Los Estudiantes En Contextos Vulnerables. Rev. Complut. Educ. 2019, 30, 331–346. [Google Scholar] [CrossRef]
  32. Ardila, A.; Rosselli, M.; Matute, E.; Inozemtseva, O. Gender Differences in Cognitive Development. Dev. Psychol. 2011, 47, 984–990. [Google Scholar] [CrossRef] [PubMed]
  33. Flores, W.O.; Auzmendi, E. Actitudes hacia las matemáticas en la enseñanza universitaria y su relación con las variables género y etnia. Profr. Rev. Currículum Form. Profr. 2018, 22, 231–251. [Google Scholar] [CrossRef]
  34. PISA. Programa para la Evaluación Internacional de los Estudiantes. Informe Español. 2018. Available online: https://sede.educacion.gob.es/publiventa/descarga.action?f_codigo_agc=20372 (accessed on 20 September 2023).
  35. Lynn, R.; Irwing, P.; Cammock, T. Sex Differences in General Knowledge. Intelligence 2001, 30, 27–39. [Google Scholar] [CrossRef]
  36. Keith, T.; Reynolds, M.; Patel, P.; Ridley, K. Sex Differences in Latent Cognitive Abilities Ages 6 to 59: Evidence from the Woodcock–Johnson III Tests of Cognitive Abilities. Intelligence 2008, 36, 502–525. [Google Scholar] [CrossRef]
  37. Yoon, S.Y.; Mann, E. Exploring the Spatial Ability of Undergraduate Students: Association with Gender, STEM Majors, and Gifted Program Membership. Gift. Child Q. 2017, 61, 001698621772261. [Google Scholar] [CrossRef]
  38. Ceci, S.J.; Williams, W.M.; Barnett, S.M. Women’s Underrepresentation in Science: Sociocultural and Biological Considerations. Psychol. Bull. 2009, 135, 218–261. [Google Scholar] [CrossRef]
  39. Ferriman, K.; Lubinski, D.; Benbow, C. Work Preferences, Life Values, and Personal Views of Top Math/Science Graduate Students and the Profoundly Gifted: Developmental Changes and Gender Differences During Emerging Adulthood and Parenthood. J. Pers. Soc. Psychol. 2009, 97, 517–532. [Google Scholar] [CrossRef]
  40. Halpern, D.F.; LaMay, M.L. The Smarter Sex: A Critical Review of Sex Differences in Intelligence. Educ. Psychol. Rev. 2000, 12, 229–246. [Google Scholar] [CrossRef]
  41. Muñoz Deleito, P. Mujeres jóvenes de altas capacidades: Aceptar y ser aceptada, sin miedo, sin violencia, con inteligencia. Rev. Estud. Juv. 2018, 120, 129–143. [Google Scholar]
  42. Weiss, E.M.; Kemmler, G.; Deisenhammer, E.A.; Fleischhacker, W.W.; Delazer, M. Sex Differences in Cognitive Functions. Personal. Individ. Differ. 2003, 35, 863–875. [Google Scholar] [CrossRef]
  43. Jordan-Young, R.M. Brain Storm: The Flaws in the Science of Sex Differences; Harvard University Press: Cambridge, MA, USA, 2011. [Google Scholar]
  44. Mcclain, M.-C.; Pfeiffer, S. Identification of Gifted Students in the United States Today: A Look at State Definitions, Policies, and Practices. J. Appl. Sch. Psychol. 2012, 28, 59–88. [Google Scholar] [CrossRef]
  45. Pfeiffer, S. The Gifted: Clinical Challenges for Child Psychiatry. J. Am. Acad. Child Adolesc. Psychiatry 2009, 48, 787–790. [Google Scholar] [CrossRef] [PubMed]
  46. Rocha, A.; Almeida, A.I.S.; Palhares, C.; Oliveira, E.P.; Fonseca, H.; Almeida, L.S. Guia Para Profesores e Educadores Nas Altas Capacidades e Sobredotação: Compreender, Identificar, Atuar; Associação Nacional para o Estudo e Intervencão na Sobredotação (ANEIS): Braga, Portugal, 2017. [Google Scholar]
  47. Rocha, A.; García-Perales, R.; Viseu, F.; Almeida, L.S.; Rocha, A.; García-Perales, R.; Viseu, F.; Almeida, L.S. Resolución de Problemas Matemáticos En Alumnado Con y Sin Superdotación Intelectual. Rev. Psicol. 2021, 39, 1031–1066. [Google Scholar] [CrossRef]
  48. Almeida, L.; Araújo, A.; Sainz Gómez, M.; Prieto, M. Challenges in the Identification of Giftedness: Issues Related to Psychological Assessment. An. Psicol. 2016, 32, 621–627. [Google Scholar] [CrossRef]
  49. Morosanova, V.; Fomina, T.; Bondarenko, I. Academic Achievement: Intelligence, Regulatory, and Cognitive Predictors. Psychol. Russ. State Art 2015, 8, 136–156. [Google Scholar] [CrossRef]
  50. Fernández Cueli, M.; García Fernández, T.; González Castro, P. Autorregulación y rendimiento académico en Matemáticas. Aula Abierta 2013, 41, 39–48. [Google Scholar]
  51. De La Rosa, J. Didactica para La Resolucion de Problemas. Sevilla: Junta de Andalucía. Available online: https://es.scribd.com/document/118034279/Didactica-para-la-Resolucion-de-Problemas-EDUCACION-PRIMARIA-2007-Jose-Miguel-de-la-Rosa-Sanchez (accessed on 20 September 2023).
  52. Mato Vázquez, M.D.; Espiñeira Bellón, E.; Chao Fernández, R. Dimensión afectiva hacia la matemática: Resultados de un análisis en Educación Primaria. Rev. Investig. Educ. 2014, 32, 57–72. [Google Scholar] [CrossRef]
  53. Tourón, J.; Hernández, L.; Castro, M.; Navarro, E. Alumnos de Alto, Medio y Bajo Rendimiento en Matemáticas en TIMSS: Estudio del Impacto de Algunos Factores de Contexto. In Estudio Internacional de Progreso en Comprensión Lectora, Matemáticas y Ciencias; Ministerio de Educación, Cultura y Deportes: Madrid, Spain, 2012; pp. 187–215. [Google Scholar]
  54. Carey, E.; Hill, F.; Devine, A.; Szücs, D. The Chicken or the Egg? The Direction of the Relationship between Mathematics Anxiety and Mathematics Performance. Front. Psychol. 2016, 6, 1987. [Google Scholar] [CrossRef]
  55. Dowker, A.; Sarkar, A.; Looi, C.Y. Mathematics Anxiety: What Have We Learned in 60 Years? Front. Psychol. 2016, 7, 508. [Google Scholar] [CrossRef] [PubMed]
  56. Schillinger, F.L.; Vogel, S.E.; Diedrich, J.; Grabner, R.H. Math Anxiety, Intelligence, and Performance in Mathematics: Insights from the German Adaptation of the Abbreviated Math Anxiety Scale (AMAS-G). Learn. Individ. Differ. 2018, 61, 109–119. [Google Scholar] [CrossRef]
  57. Ferreira, A.S.; Flores, I.; Casas-Novas, T. Porque Melhoraram os Resultados PISA em Portugal? estudo longitudinal e comparado (2000–2015); Fundação Francisco Manuel dos Santos: Lisboa, Portugal, 2017. [Google Scholar]
  58. Rodríguez-Mantilla, J.M.; Fernández-Díaz, M.J.; Jover Olmeda, G. PISA 2015: Predictores del rendimiento en Ciencias en España. Rev. Educ. 2017, 380, 75–102. [Google Scholar] [CrossRef]
  59. Else-Quest, N.; Hyde, J.; Linn, M. Cross-National Patterns of Gender Differences in Mathematics: A Meta-Analysis. Psychol. Bull. 2010, 136, 103–127. [Google Scholar] [CrossRef] [PubMed]
  60. Valle Arias, A.; Regueiro Fernández, B.; Piñeiro Aguín, I.; Sánchez Vales, B.; Freire Rodríguez, C.; del Mar Ferradás, M. Actitudes hacia las matemáticas en estudiantes de Educación Primaria: Diferencias en función del curso y del género. Eur. J. Investig. Health Psychol. Educ. 2016, 6, 119–132. [Google Scholar]
  61. Abad, F.J.; Sánchez-Sánchez, F.; Santamaría, P. MATRICES-TAI. Test Adaptativo de Inteligencia General; PSEA SAS: Bogotá, Colombia, 2020. [Google Scholar]
  62. González-Pérez, S.; Mateos de Cabo, R.; Sáinz, M. Girls in STEM: Is It a Female Role-Model Thing? Front. Psychol. 2020, 11, 2204. [Google Scholar] [CrossRef] [PubMed]
  63. Reinert, M. Alceste, Une Méthode Statistique et Sémiotique d’analyse de Discours. Application Aux Rêveries Du Promeneur Solitaire. Rev. Fr. Psychiatr. Psychol. Médicale 2001, 5, 32–36. [Google Scholar]
  64. De Alba, M. El Método ALCESTE y Su Aplicación al Estudio de Las Representaciones Sociales Del Espacio Urbano: El Caso de La Ciudad de México. Pap. Soc. Represent. 2004, 20, 1. [Google Scholar]
  65. Reinert, M. Une Méthode de Classification Descendante Hiérarchique: Application à l’analyse Lexicale Par Contexte. Cah. Anal. Données 1983, 8, 187–198. [Google Scholar]
  66. Rodríguez-Naveiras, E.; Cadenas, M.; Borges, Á.; Valadez, D. Educational responses to students with high abilities from the parental perspective. Front. Psychol. 2019, 10, 1187. [Google Scholar] [CrossRef]
  67. Bahr, T.; Zinn, B. Gender Differences in the New Interdisciplinary Subject Informatik, Mathematik, Physik (IMP)-Sticking with STEM? Educ. Sci. 2023, 13, 478. [Google Scholar] [CrossRef]
  68. Lazarides, R.; Ittel, A.; Juang, L. Wahrgenommene Unterrichtsgestaltung Und Interesse Im Fach Mathematik von Schülerinnen Und Schülern. Unterrichtswissenschaft 2015, 43, 67–82. [Google Scholar]
Figure 1. Caption. Dendogram. “Do you plan to pursue a STEM career?” Note: *G_m (male gender); *G_f (female gender).
Education 14 00041 g001
Figure 2. Dendrogram corresponding to the high-ability group. Note: *G_m (male gender); *G_f (female gender).
Education 14 00041 g002
Table 1. Sample of this study’s selected participants.
GenderAge
FemaleMaleFemaleMale
High Ability4158M = 13.02; SD = 0.85M = 13.07; SD = 0.9
Normative group4158M = 13.02; SD = 0.85M = 13.07; SD = 0.9
Table 2. Participants by gender and age group.
CourseGender
FemaleMale
First Year of High School3442
Second Year of High School2846
Third Year of High School2028
Table 3. The instrument’s reliability.
Cronbach’s Alpha
Instrument’s total0.85
Enjoyment0.956
Importance0.854
Stereotype0.95
Expectations0.904
STEM choice0.772
Table 4. Descriptive Statistics.
FactorGroupMaleFemale
MeanStandard DeviationSample (N)MeanStandard DeviationSample (N)
Instrument’s totalHigh ability90.823.55895.121.741
Normative group98.325.25810725.341
EnjoymentHigh ability13.89.015815.29.8441
Normative group17.39.25821.79.6141
ImportanceHigh ability17.78.015819.17.6241
Normative group20.910.35821.58.9641
StereotypesHigh ability15.35.685815.77.1441
Normative group15.65.8658147.9741
ExpectationsHigh ability27.97.635827.97.341
Normative group28.76.495830.310.441
STEM choiceHigh ability16.26.185817.17.1641
Normative group15.85.865819.46.2441
Table 5. Levene’s contrast of factors.
Fdf1df2Sig.
Enjoyment0.67531940.568
Importance2.26931940.082
Stereotypes6.51531940.000
Expectations5.44531940.001
STEM choice0.99231940.398
Table 6. Relative effects of enjoyment and importance factors by group.
dfRoot Mean SquareFSig.η²pObserved Power
Enjoyment11193.95013.6070.0000.0660.956
Importance1376.2524.7750.0300.0240.585
Stereotypes122.530.5220.4710.0030.111
Expectations1128.1572.0380.1550.010.295
STEM choice144.2981.110.2930.00060.182
Table 7. Examples of the class of interest in STEM careers.
Class 1χ2Answer ExamplesGender
Interest in STEM careers12“Engineering, it catches my attention as I’m also interested in all kinds of motor-related engineering.”Female
8“No, because I haven’t developed an interest yet, but I would like to know more about STEM, everything in general.”Female
8“No, because I have no interest in that field, but I like it.”Female
8“Yes, I am interested in everything about STEM but specially Mathematics.”Male
Table 8. Class examples of career choice.
Class 2χ2Answer ExamplesGender
Career choice12“No, that is not what I have in mind, I’m also not really good at it.”Female
9“Yes, I would really like to study STEM because I’m good at it.”Male
4“Yes, I would like to be a vet because I adore animals and would like to take care of them when they are sick.”Female
4“It is not what I have in mind, because I want to study something else.”Female
Table 9. Examples of the class that shows dissatisfaction towards STEM.
Class 3χ2Answer ExamplesGender
Dissatisfaction towards STEM3“No, because I don’t think I would enjoy it and I have never thought about doing something like that.”Male
3“No, because I don’t like it.”Male
3“No, because I don’t like it.”Female
3“No, because I am not quite sure I enjoy it.”Male
Table 10. Examples of the class of scientific interest.
Class 4χ2Answers ExamplesGender
Scientific interest5“Yes, I have always preferred sciences over humanities. Also, I am passionate about everything related to science.”Female
3“Yes, because I love science.”Female
3“Maybe, because I am not quite sure yet.”Female
3“Yes, because I prefer science over humanities.”Male
Table 11. Examples of the class of expectations on technologic and engineering careers.
Class 1χ2Answer ExamplesGender
Expectations on technologic and engineering careers7“Yes, technology or computer engineering, because I like new technologies.”Male
6“Yes, engineering. I have always liked machinery and everything related to it.”Male
6“Yes, computer engineering specifically. I have always liked computers and coding.”Male
3“Yes, the technology and engineering field. Ever since I was a child I have loved it because I liked to see the mechanics of cars, boats, planes, machines, etc.”Male
Table 12. Examples of the class of the capacity to face STEM careers.
Class 2χ2Answer ExamplesGender
Capacity to face STEM careers28“No, because in the STEM field there are things I am not good at, don’t make me happy or feel like an enigma to me.”Female
6“Probably, because I am good at that field and it has good job offers.”Female
6“I have not though about it yet, but I would really like it, because I think it is what I am the best at and it is more interesting to me than other things.”Female
6“Yes, I am good at it.”Male
Table 13. Examples of the class of the expectations of mathematic and scientific career choice.
Class 3 χ2Answer ExamplesGender
Expectations of mathematic and scientific career choice9“Probably, but I am not sure, because I like maths but I don’t know what I want to be when I am older”.Female
7“Yes, mathematics or science, because that is what I am best at and is easier for me. And also, because I really enjoy it”.Female
7“No, I am not being really good at science, specially mathematics, so I don’t think that I am able to take a scientific career”.Male
6“I might study a mathematics career when I am older, but I am not sure because of how many options there are out there”.Female
Table 14. Examples of the class of interest towards STEM careers.
Class 4χ2Answers ExamplesGender
Interest towards STEM careers4“Yes, because I think they are interesting and I like them”.Male
4“Yes, because I am interested in science and medicine”.Female
4“No, because I am not interested”.Male
2“Yes, I like them, I think sciences are pretty interesting and would like to discover new things about them”.Female
Table 15. Examples of the class of determination towards specific careers.
Class 5χ2Answer ExamplesGender
Determination towards specific careers7“Indeed, technical architecture. It seems like an interesting career and I would like it”.Male
7“Yes, I would like to study industrial engineering, because I think it is a very attractive and interesting career”.Male
7“No, because I like other types of careers, like criminology or psychology”.Female
4“No, because I want to study teaching and criminology and that’s not included in STEM”.Female
Disclaimer/Publisher’s Note: The statements, opinions and data contained in all publications are solely those of the individual author(s) and contributor(s) and not of MDPI and/or the editor(s). MDPI and/or the editor(s) disclaim responsibility for any injury to people or property resulting from any ideas, methods, instructions or products referred to in the content.

