1. Introduction
In 2020, the coronavirus pandemic (COVID-19) compelled many educational institutions to shift from traditional in-person classroom instruction to remote online teaching using video conferencing technology. As the pandemic abated, several universities temporarily adopted a dual-modality approach for providing instruction. To alleviate the health concerns of students taking large-enrollment general education courses, students were provided the option of enrolling in a face-to-face classroom or an online synchronous version of the course. As was the case in this study, some institutions allowed students to participate in either modality, regardless of the section in which they were officially registered. In addition, a by-product of emergency remote online instruction resulted in many instructors recording their lectures for students. Classroom recordings were never intended to replace synchronous instructional modalities but were simply an accommodation made possible by technology-facilitated online instruction. Regardless, in this study, students had the option of three viable modalities for receiving instruction: in-person, synchronous online, and asynchronous classroom recordings.
A long-held concern of educators that fueled the resistance of individuals to embrace online instruction is that online instruction and classroom recordings were seen as being less effective than in-person classroom instruction. The 2020 pandemic and the move to emergency online instruction reignited this debate. Several instructional modality studies have been conducted in past decades [
1,
2,
3]. These studies produced mixed results when looking at effectiveness based on measures of student achievement alone. Several of these studies concluded that student achievement is not regulated solely by the mode of instruction but rather by the quality of the instruction provided and various individual student characteristics [
4,
5,
6,
7]. Still, a bias toward in-person classroom instructions seems to exist.
In addition to, and regardless of the question of effectiveness, online learning is becoming a prevalent mode of instruction [
4,
8]. Some suggest that this increase stems from a shift in students’ preference for online instruction; others suggest it is simply a matter of economics and convenience [
9,
10]. Whichever the case, students are not always provided a choice as to the mode of instruction. Nonetheless, instructional modality and student preference were recently identified by Jordan and Samuels [
11] as two critical topics that needed further examination within accounting education research.
This study explored the impact various modes of instruction had on student achievement. In addition, this study compared students’ stated modality preference with their actual attendance behavior. The purpose of this study was to examine evidence that might support offering students the choice of instructional modalities. To achieve a better understanding of the impact of different modalities in an introductory accounting course, we pose the following research questions and hypothesis:
RQ1: To what degree did students’ stated modality preference and actual attendance behavior differ?
H1. Students’ attendance behavior will follow their preferred modality but will vary by learning goals, personal situations, and conditions throughout the course.
RQ2: Given students’ dominant instructional modality, what differences in academic achievement exist between groups?
H2. There will be no significant difference in student achievement based on the course modalities selected by students.
RQ3: In what ways do students perceive the offering of multiple modalities as beneficial, or harmful, to their success in a course?
H3. Students will prefer having a choice in how they attend class and see this as a benefit.
Review of Literature
The prevalence of online learning has been increasing for years. As a result of the COVID-19 outbreak, the acceptance of online learning as a viable option in education has increased. However, COVID-19-induced emergency online instruction also polarized opinions about learning online. According to Lederman [
12], the number of postsecondary students enrolled in online courses grew continuously for six years previous to the pandemic. As of 2019, approximately 30% of all university students had enrolled in at least one online course [
12]. The National Postsecondary Student Aid Study [
13] reported that 84% of undergraduate students switched to primarily online courses in Spring 2020 due to the COVID pandemic. Not all institutions were prepared to provide quality online learning opportunities to their students, and student perceptions about the effectiveness of online learning varied significantly as a result.
Scholars have investigated the effectiveness of online learning in previous research; many did so by comparing the learning outcomes of students participating in online and in-person classes. Studies report conflicting results on how modality impacts student achievement. Some reported no achievement difference between in-person and online modalities [
14,
15,
16,
17,
18,
19], while others reported minor differences [
20]. The effectiveness of online education is still uncertain due to many possible confounding variables [
10]. As a result, it is hard to provide a conclusive answer regarding the effectiveness of online and in-person instruction based solely on the instructional modality in which the course is offered.
When studying effectiveness, Martin et al. [
6] point out that individual student characteristics such as self-regulation, interests, and learning goals will affect engagement. Lei, Cui, and Zhou [
21] reported that engagement is the time and effort that students devote to learning, and effort is driven by a student’s interests and abilities. The researchers found that students who self-regulate well are more satisfied and have a greater intrinsic motivation to engage in their learning. These students will be more engaged in the coursework and have greater academic success.
However, some researchers point out that the quality of online education is more important than the modality in which the instruction is provided [
9]. Not all classroom instruction can be categorized as high quality [
5]. Often, we set classroom instruction as the standard and compare online instruction to classroom instruction, but we often err in thinking that all classroom instruction is of high quality. Instructional design is crucial when studying the impacts of instruction on learning [
22]. How a course is designed will affect a student’s perception of the course and the effort they put into learning. A critical aspect of instructional design is the idea of self-direction [
23]. McAvoy [
24] points out that student choice, being able to make decisions about how and what they will learn, affects engagement. With advances in educational technologies, new pedagogies are available that support individual learning strategies for knowledge development and self-directed learning [
25]. Students who demonstrate the metacognitive ability to self-regulate and are interested in learning do better in school and often benefit more from online instruction [
26].
2. Materials and Methods
This study utilized an explanatory mixed-method research design. We used quantitative measures to describe the modality preferences and behaviors of students, as well as the achievement results disaggregated by modality choice. This was followed by a qualitative analysis of student comments and the contextual situation to better understand and explain the quantitative results.
While this study was initially designed to compare in-person and synchronous online instruction provided using video conferencing software, we found that student choice was not simply dichotomous. In a traditional experimental or quasi-experimental study, students are assigned to one treatment or another. However, in this study, we needed to account for treatment interaction and student choice. While many students selected and consistently participated in the in-person or synchronous online experience, three additional options were identified based on students’ reports of their weekly attendance behaviors. Several students reported only watching class recordings (asynchronously), and some reported not attending class at all. Many students reported a mixed modality attendance pattern: sometimes they attended class in-person or online, and other times they just watched the class recording. As a result, the instructional conditions for this study included: (1) In-person; (2) Live remote online; (3) Mixed modality; (4) Recorded lectures; and (5) Non-attenders. The data collected in this study were compared for each of these groups.
2.1. Course Context
This study involved an introductory accounting course at a private university in the Western United States. The 14-week course was an undergraduate class on the topic of basic financial and managerial accounting principles. It is a three-credit course that is required for all business major and minor degrees, as well as a few additional degrees outside the business school. The focus of this study is Fall 2021 where students could enroll and attend an in-person section or a live remote section. It is important to note that the instructor, course content, assignments, and assessments were the same for both sections, as well as the two previous years (Fall 2019 and Fall 2020), which we include for comparable purposes. However, there were some course administrative adjustments that were made as a result of the worldwide pandemic.
Table 1 outlines the administrative and course delivery differences for the three years included in this paper.
Before COVID-19, Fall 2019, the course was a blended course with online assignments due each week, along with a 75-min in-person interactive lecture held once a week. Due to the COVID-19 pandemic, Fall 2020 was taught remotely (i.e., live online). The content in the course remained the same as previous semesters, but instead of meeting in a large auditorium once a week, the Fall 2020 class met synchronously using Zoom video conferencing software. In addition, due to the social distancing requirements of the pandemic, the in-person accounting lab and on-campus testing center were not available during Fall 2020. However, an online accounting lab was still available to help students, and an online proctoring service was used to administer exams. When in-person classes resumed in Fall 2021, students were provided the option for the required 75-min lecture each week, or to register for either a synchronous live remote section or an in-person section. The in-person version of the course was taught in a large auditorium that accommodates 850 students.
For class sessions, whether live remote or in-person, the instructor provided a handout to students with application problems from the content studied earlier in the week in the asynchronous session. The instructor began class with a brief introduction of the material, followed by several small exercises where students worked through problems and input their answers using an online polling system. After each polling session, the instructor debriefed the exercise by demonstrating the process to solve the problem. The students that attended class in-person worked with those around them on the problems and could ask questions of the instructor and the teaching assistants while they worked through the exercises. Students attending live remote were able to use the chat feature, break-out rooms, or raise their digital hand to be helped by the instructor and teaching assistants. The polling questions were not graded, and no points were connected to class participation.
Final course grades for all the semesters in this study were calculated based on scores on weekly quizzes or activities (40%), two midterm exams (32%), and a cumulative final exam (28%).
2.2. Study Participants
Table 2 provides the student demographics and academic ability for the participants in the study. The student demographics and academic abilities are similar for all three years referenced in this study. While we reference three years of data for comparison purposes, the focus of this study is the Fall 2021 section. In Fall 2021, students were provided the option to register for either an in-person section or a synchronous live remote section of the course; 720 (68%) students registered for the in-person section, and 339 (32%) registered for the live remote section of the course. Both sections were capped at 858 students; neither section reached the registration cap. Most of the 2021 students were business majors or minors in the university’s School of Business. Sixty-six percent of the participants were male, and 34% were female. Eighty-two percent of the participants were Caucasian, and the remaining 18% were underrepresented minorities. Twelve percent of the participants were first-generation college students. Thirty-seven percent of the students were freshmen, 36% were sophomores, 19% were juniors, and 7% were seniors. The average student entering GPA of the 2021 participants was 3.50, and their average course load for the semester was 13.6 credits.
Not all students choose to participate in the study by providing information about their class attendance and preferences. Of the 1059 enrolled students in Fall 2021, 966 students (91 percent) provided some information about their attendance behavior and modality preference. We do not have complete data for all enrolled students as some students withdrew from the course or opted not to take the survey or answer all the survey questions. For this analysis, 746 (70% of the original 1059 students enrolled) provided attendance information for each of the 11 instructional weeks regarding their class attendance and modality preference. Of the original 1059 students, 720 students (68%) registered for the in-person section, and 339 (32%) registered for the live online section. Of those included in this analysis, 517 students (69%) were enrolled in the in-person section of the course, and 229 students (31%) enrolled in the live online section of the course. Based on this, we conclude that there was no systematic sampling issue that may have biased the result. This analysis is based on the sample of 746 students.
2.3. Data Collection
Data used in this study come from various sources. The university academic office provided demographic data for students participating in this study. Exam scores were obtained from the learning management system (LMS) used for the course. Exams were similar in content and difficulty for all three years studied. Students who dropped the course at any point in the semester were excluded from the analysis.
For the 2021 student cohort, participants were asked on each exam in the course to provide information about how they attended class each week leading up to the exam. There were three exams in the 14-week semester, with no class being held during exam weeks. On each exam (Weeks 4, 10, and 14) students indicated how they attended class each week and, regardless of how they attended class, what their preferred method of attending class was (11 data points). See
Appendix A for the optional survey questions asked on each exam. This self-reported data allowed us to compare attendance behavior with stated modality preference.
In addition to the survey questions on exams, we administered an unincentivized, optional survey to students near the end of the semester to better understand their perceptions of offering multiple modalities in the course, specifically whether they found the different modality offerings helpful or harmful.
Appendix B outlines the survey questions administered to the students.
2.4. Statistical Analysis
We tested our hypotheses using the data collected from the learning-management software, demographic information provided by the university, and self-reported class attendance.
Table 3 shows the analysis procedure and variables used to test the different hypotheses.
Appendix C defines each of the variables used in the models.
Descriptive statistics were used to identify and compare students’ preferred modality and whether their preferences changed over the course of the semester. We also examined whether their actual behavior matched their stated preference. Achievement data were analyzed and compared in aggregate for each of the three years. Achievement from 2021 was analyzed using regression analysis, ANOVA, and a Chi-Squared analysis. The regression analysis was used to determine whether student characteristics and modality choice predicted student achievement. The ANOVA was used to ascertain whether average class achievement differed statistically by modality behavior. The Chi-Squared analysis was used to determine if the number of students receiving a specific letter grade differed statistically by dominant attendance modality.
2.5. Qualitative Analysis
Qualitative data were used to better understand the quantitative results obtained in this study. The perceptions of students regarding any harm or benefit resulting from the availability of modality options were analyzed. The open-ended survey responses were coded by two of the co-authors separately. Any disagreement in coding was resolved by further investigating the responses to reach a negotiated consensus. Common code categories were identified, and the frequency of responses were tabulated to determine the strength of each response perception.
3. Results
3.1. RQ1: Modality Preference and Attendance Behavior
An initial step in this study explored students’ preferred attendance modality and their actual attendance behavior. We hypothesized that students’ attendance behavior would follow their preferred modality but might vary slightly based on the students’ learning goals and personal situations that arose throughout the semester (e.g., sickness, scheduling conflicts, etc.). The results obtained in this study were analyzed based on the stated student preference and actual attendance behavior for the 2021 students. In 2019 and 2020, students were only provided the option to attend one modality of the course. However, students in 2020 were provided with a recording of each class, and for all years, students have always had the option of not attending class. We did not have access to any data regarding the students’ actual attendance patterns in 2019 and 2020.
3.1.1. Enrollment Modality
One way to examine modality preference is to consider class enrollment. Of the original 1059 students, 720 students (68%) registered for the in-person section of the course, while 339 (32%) registered for the live remote online section. As noted in
Section 2, 746 (70% of the original 1059 students enrolled) provided attendance information for each of the 11 weeks. We found a similar enrollment distribution in that sample. Of those in the respondent sample we used, 517 (69%) were enrolled in the in-person section of the course, and 229 students (31%) enrolled in the live online section of the course. Based on these data, one might assume that over two-thirds of students preferred in-person instruction. However, this does not account for scheduling conflicts and other potential influences that may have caused students to enroll in a section that did not align with the student’s preferred instructional modality. Overall, student attendance behavior aligned with their enrolled modality only 72% of the time. Twenty-eight percent of the time, students participated in an instructional modality other than that of the section in which they were initially enrolled. In fact, only 88% of those enrolled in the in-person section and 40% of those enrolled in the online section of the course listed that modality as their preferred instructional modality at Week 4 (see
Table 4). Overall, at Week 4 of the course, 76% of the students (61% from the in-person section and 15% from the live remote section) indicated they preferred to attend class in-person. It appears that, for a variety of reasons, students do not always enroll in a particular section of a course that matches their preferred instructional modality.
3.1.2. Dominant Modality
Another way to look at student preference is to look at their behavior. To facilitate our understanding of student preference, we grouped students by the modality students reported choosing most of the time. A student’s dominant modality was identified if they attended class in a particular modality in at least six of the 11 class periods (55% or more of the time). Students with no dominant attendance pattern were identified as choosing a mixed modality. Based on these criteria, students were separated into five main groupings: (1) In-person; (2) Live remote online; (3) Class recordings; (4) Non-attenders; and (5) Mixed modality (see
Table 5).
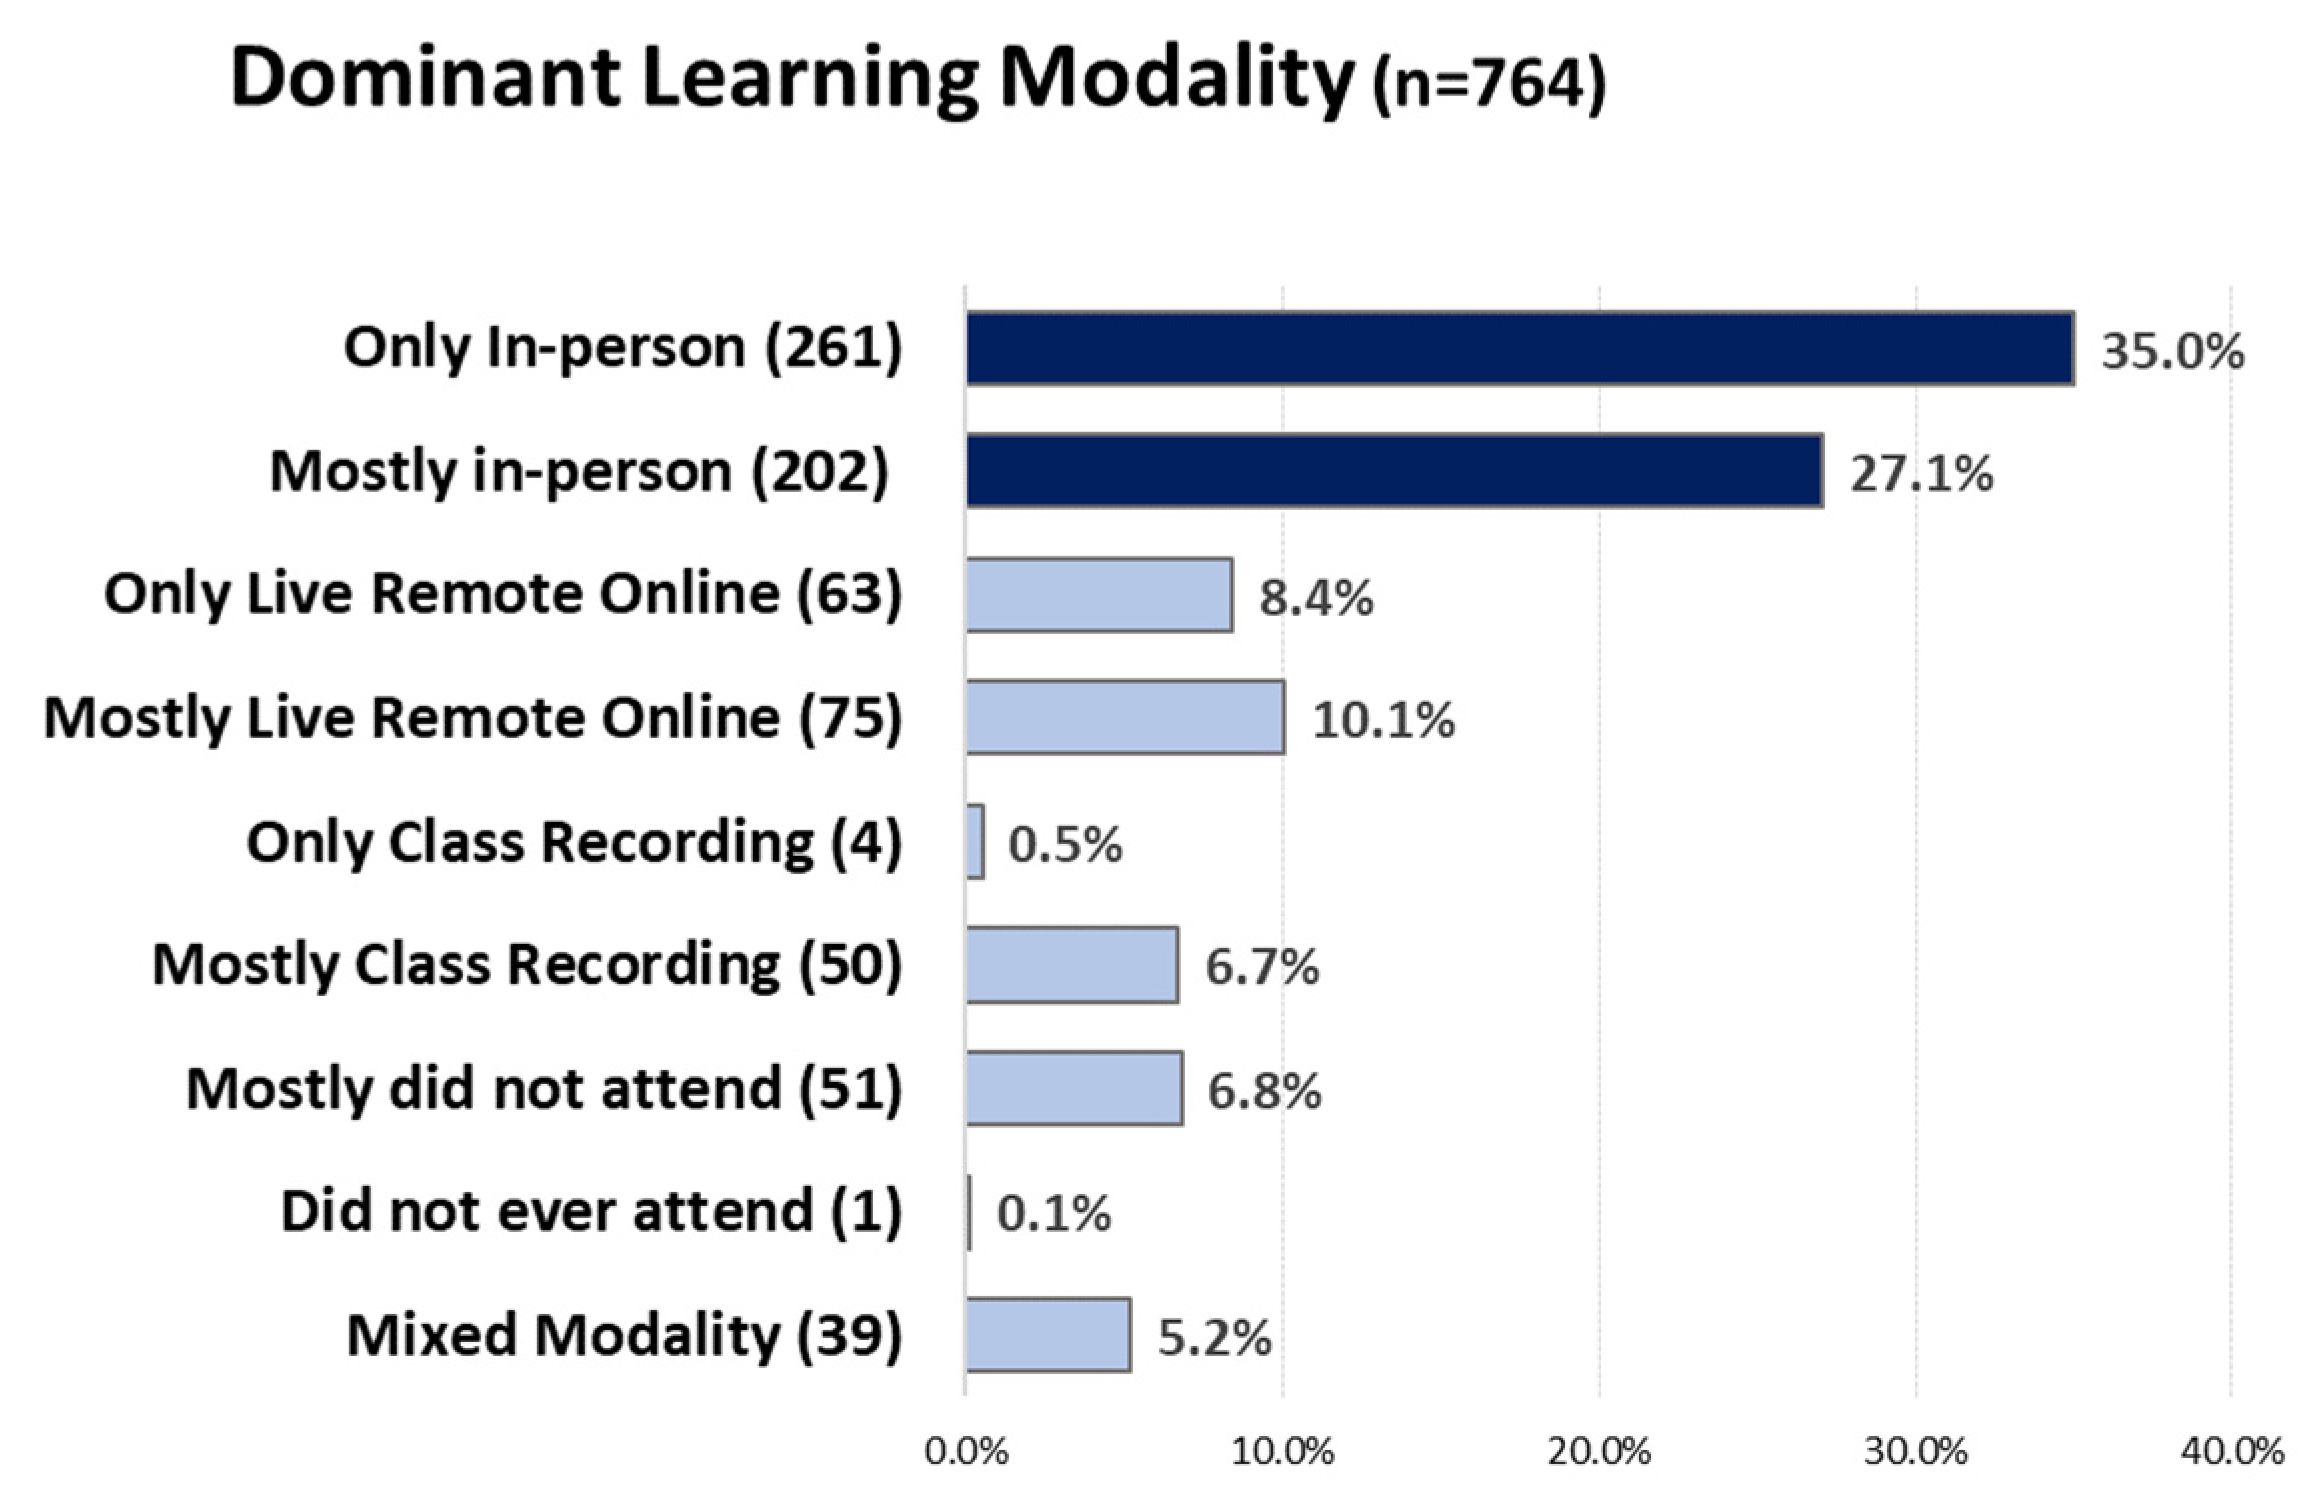
Most students reported participating predominately in-person (62%). Another 18% of the students attended class only or primarily online. Of importance is the fact that less than half (329, or 44% of the students) indicated they participated in class consistently via one modality. For example, the dominant modality for 62% of the students was in-person. However, only 56% of these students (261, or 35% of all students; see
Figure 1) reported attending class entirely in person. For a variety of unstated reasons, many students attended class using a variety of modalities. In fact, about 5% of the students had no dominant modality, meaning they reported engaging in class using a variety of modalities but no particular modality more than six times over the course of the semester. Of interest is the fact that about 7% of these students reported that they did not attend class regularly.
3.1.3. Stated Modality Preferences
Student modality preferences were examined further using three data points (see
Table 6). On Weeks 4, 10, and 14 (exam weeks), students were asked to indicate which modality they preferred regardless of how they attended class. They were provided the option to indicate in-person, live remote online, or class recordings. Several students chose not to answer this question even though they indicated their attendance behavior each week. We cannot assume that failure to respond was analogous to a preference not to attend class at all. However, in Week 14, 106 students failed to respond to this question. From this group, 81% of the time, these students indicated they did not attend class the three weeks prior to the final exam. In addition, 46% of these non-responders’ dominant modality was to not attend class.
3.1.4. Shifts in Stated Modality Preferences
From the data in
Table 6, we note a shift in the students’ stated modality preferences as the course progresses. Most prominently, we see an overall decline in the number of students who indicated a preference for in-person instruction from 76% at the beginning of the course to 54% at the end of the course.
The results presented in
Table 7 verify the shift in the stated modality preferences of students from Week 4 to Week 14. Overall, 26% of students changed their stated instructional modality preference. Three percent (3%) of students reported shifting their instructional modality preference to in-person instruction (11% towards live remote online instruction, while 12% indicated a preference shift toward watching the class recordings). An analysis of the data shows a decline in the number of students indicating a preference for in-person instruction from 67% to 51% of students. Although we note that 34 students (5.6% of all students) who did not indicate the preferred modality in both Weeks 4 and 14, they reported attending class in person the majority of the time. This could increase the number of students who prefer in-person instruction from 51% to 56% in Week 14, which is still a substantial decline of about ten 10%.
In addition, our analysis of these data reveals a noticeable tendency for students to stop attending class toward the end of the course. While students did not have the option to indicate they preferred not to attend class, we noted a significant shift in the number of times students reported not attending class as the course progressed. Only 6% of students indicated they had not attended class during the first eight weeks of class. During the final three weeks of class, 13% of students indicated they had not attended class. The increase in missed classes was particularly prominent for the non-respondent group in this analysis (i.e., those who did not indicate their preferred instructional modality in both Weeks 4 and 14). Seventy-six percent of the time these students reported not attending class in the three weeks before the final exam. Only 2% of the other students reported not attending class during this period. Of the non-respondent group, 43% (49 students) reported not attending class six times or more throughout the 11 weeks of class.
3.1.5. Stated Modality Preferences and Dominant Modality
From our analysis of these data, we also noted that student behavior did not always align with their stated modality preference (see
Table 8). Only 74% of the time did a student’s stated modality preference align with their dominant modality. However, an alignment between preference and behavior tended to increase as the course proceeded to correspond with shifts in students’ stated modality preference. From
Table 6, we saw an increase in the number of students whose participation aligned with their stated modality preference. For example, in Week 4, those who indicated a preference for in-person instruction only attended class 80% of the time. In Week 14, those who indicated a preference for in-person instruction attended class 97% of the time. A similar increase in alignment was noted for those who preferred live remote online instruction and those who preferred watching class recordings. Alignment between stated preference and dominant modality was most likely to occur for those indicating a preference for in-person instruction.
3.2. RQ2: Achievement Differences by Dominant Modality
In terms of achievement differences, we hypothesized that there would be no significant statistical difference in student achievement based on the course modalities selected by students. To answer this research question, we considered three analyses of achievement. First, a regression analysis to determine which student characteristics best predicted student success. Second, an analysis of average student achievement based on students’ dominant modality using an ANOVA. Finally, an exploration of the letter grades awarded to students using a chi-squared analysis to determine whether the distribution of grades was statistically different based on their dominant modality.
3.2.1. Predictive Regression Analysis
To begin the analysis, we first reviewed the assumptions regarding our data. The assumption of linearity and homoscedasticity were met for this analysis based on the random pattern scatter plot of the residuals against the values of the outcomes. The normality assumption was met due to the large sample size, a symmetrical and bell-shaped histogram, and a normal probability plot showing normally distributed residuals. The multicollinearity assumption was met with a variance inflation factor below four. For independence, the model accounted for the clustering of students within a classroom.
Table 9 presents the descriptive statistics for the study. The sample (N = 746) includes students enrolled in ACC 200 during Fall 2021 who self-reported how they attended class each week. However, not all the data were available for all the students (7.02% are missing ACT scores, and 33.4% are missing entering GPA data; see
Table 2). The ACT scores were not available for all transfer students, and some students were in their first semester at the university, so they did not have an entering GPA. The missing data were handled by the full information maximum likelihood approach (FIML). FIML uses all available data to estimate parameters that result in unbiased estimates [
27].
Table 10 presents the Pearson correlation coefficients for the variables in this study (as defined in
Appendix C).
To test our hypothesis, we conducted an ordinary least square (OLS) multiple regression analysis using the following equation:
The results from the OLS multiple regressions are presented in
Table 11. Column 1 presents the unstandardized results, and Column 2 presents the standardized results. The results indicate a small positive association between in-person class attendance and course percentage points (
p < 0.05), with the most influential factors being ACT (
p < 0.01) and entering GPA (
p < 0.01). The OLS results show that for every class period attended in-person, we can predict a 0.31% increase in percentage points earned in the course, holding all other variables constant. So, while there was a small statistical benefit for students attending class in-person, a better predictor of student success was students’ ACT scores and their GPA prior to taking this course.
3.2.2. Achievement Comparisons by Year
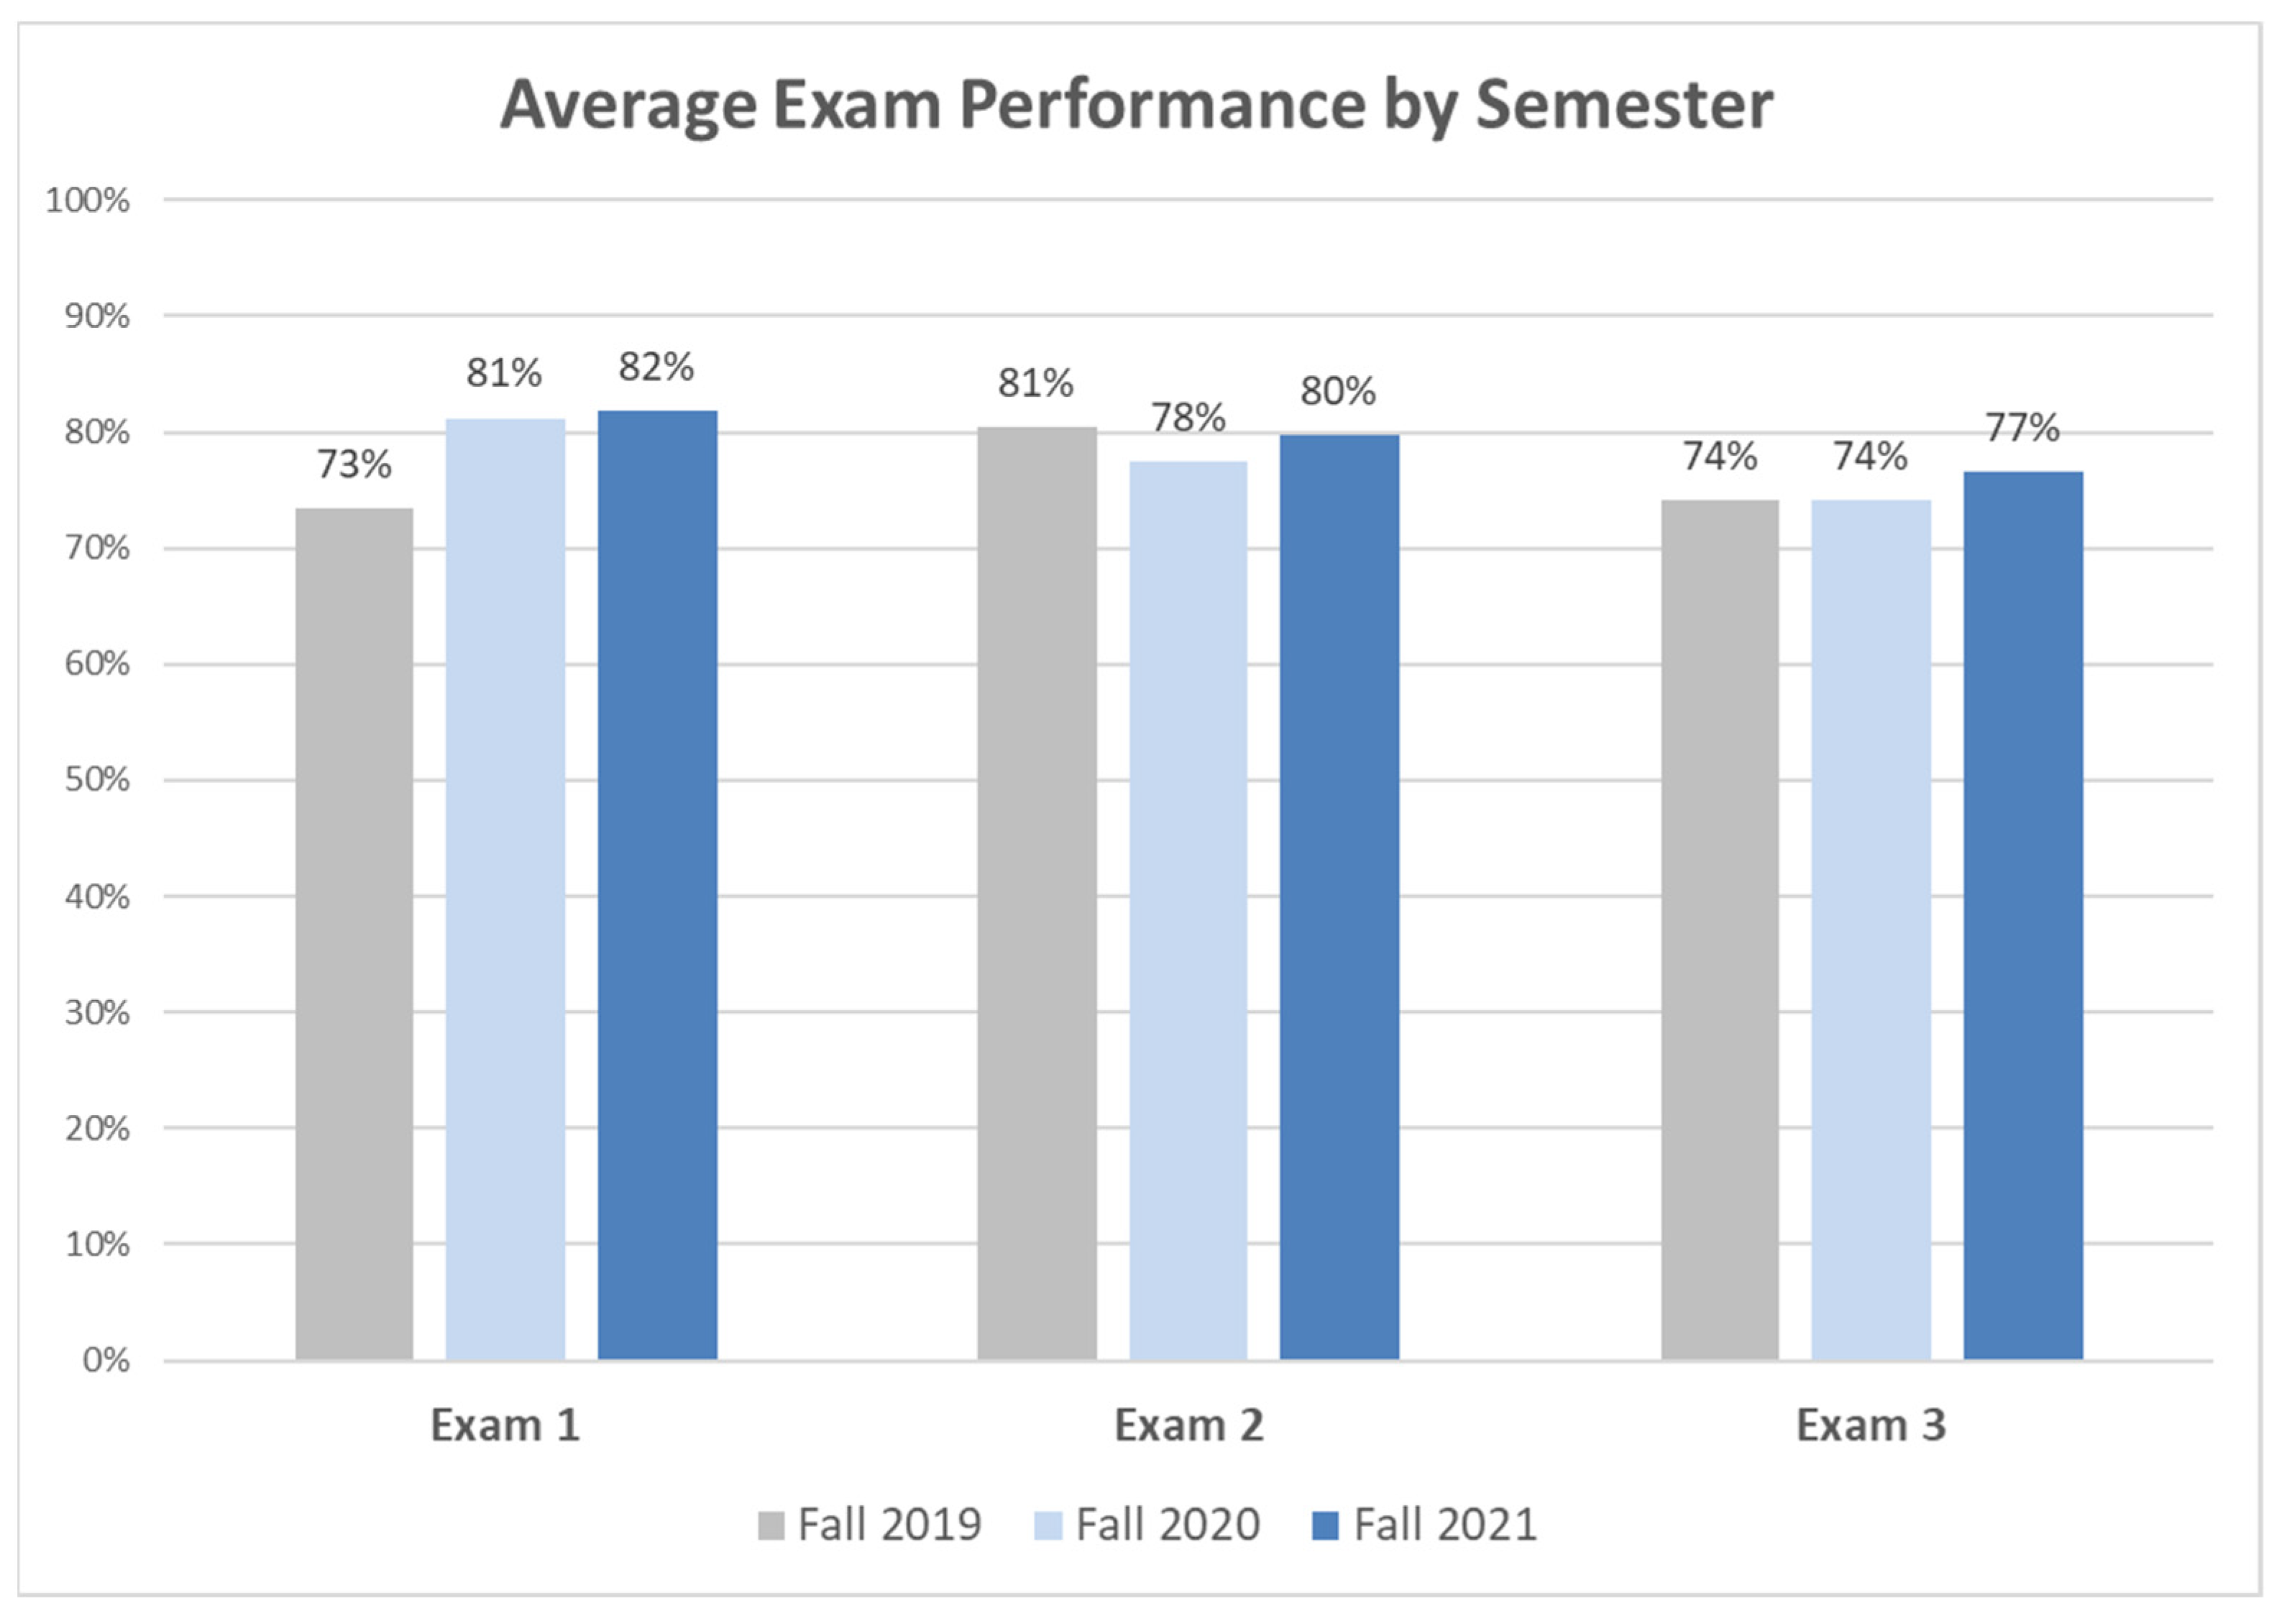
Before looking carefully at academic performance in 2021, we first compared academic achievement for 2019 (in-person), 2020 (live remote), and 2021 (HyFlex). Overall, students in 2021 performed slightly better on exams than in previous years (see
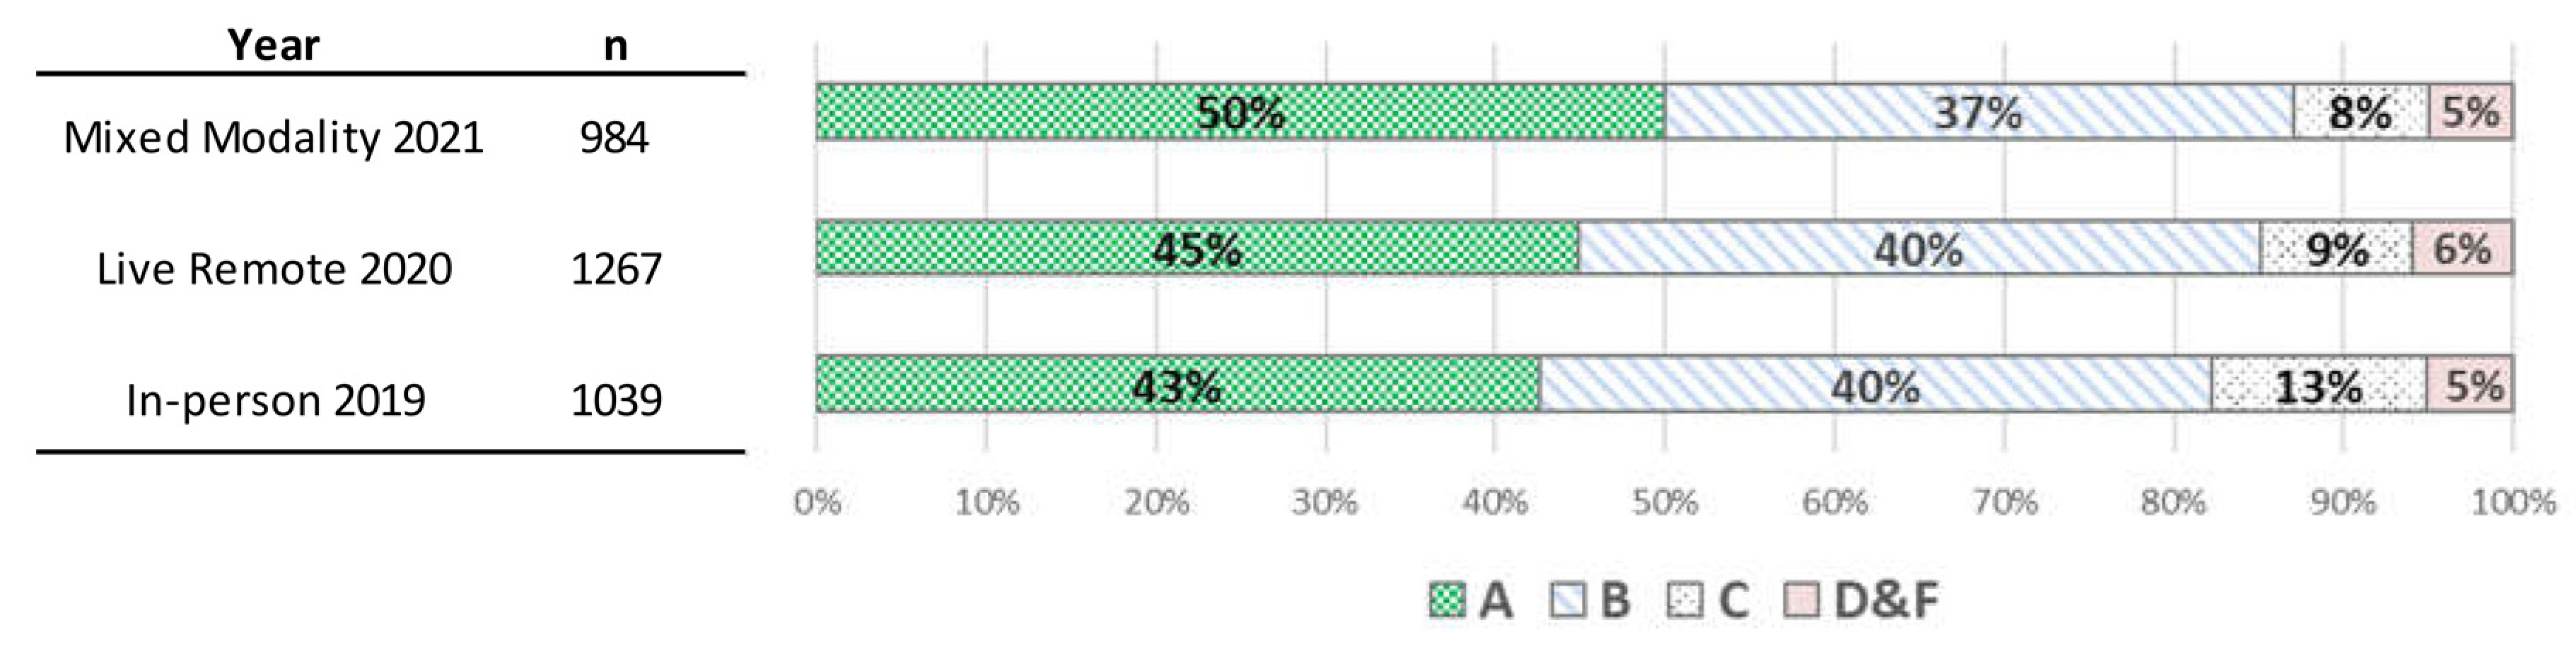
Figure 2). It should be noted that there was an exam policy change in Fall 2020. In 2020, the instructor introduced a second-chance exam policy. This policy was in effect for both the 2020 and 2021 cohort. This new exam policy allowed students who performed poorly on an exam to retake that exam. The revised exam score was capped at 80% but increased average test scores and the distribution of final grades from 2019 to 2020. Between 20 and 25% of students capitalized on the second-chance exam opportunity. However, less than one-third of those retaking an exam scored well enough to improve their score to 80%. The overall difference in grades presented in
Figure 3 were statistically significant (χ2(6) = 25.1,
p < 0.05). Slightly more students received a grade of C in 2019 compared to other years. Overall, 95% of the students passed the course with a C grade or better each year, and about 85% received a grade of A or B. The same grading scale was used to determine final grades for all three semesters in the study.
3.2.3. 2021 Achievement Comparisons by Modality
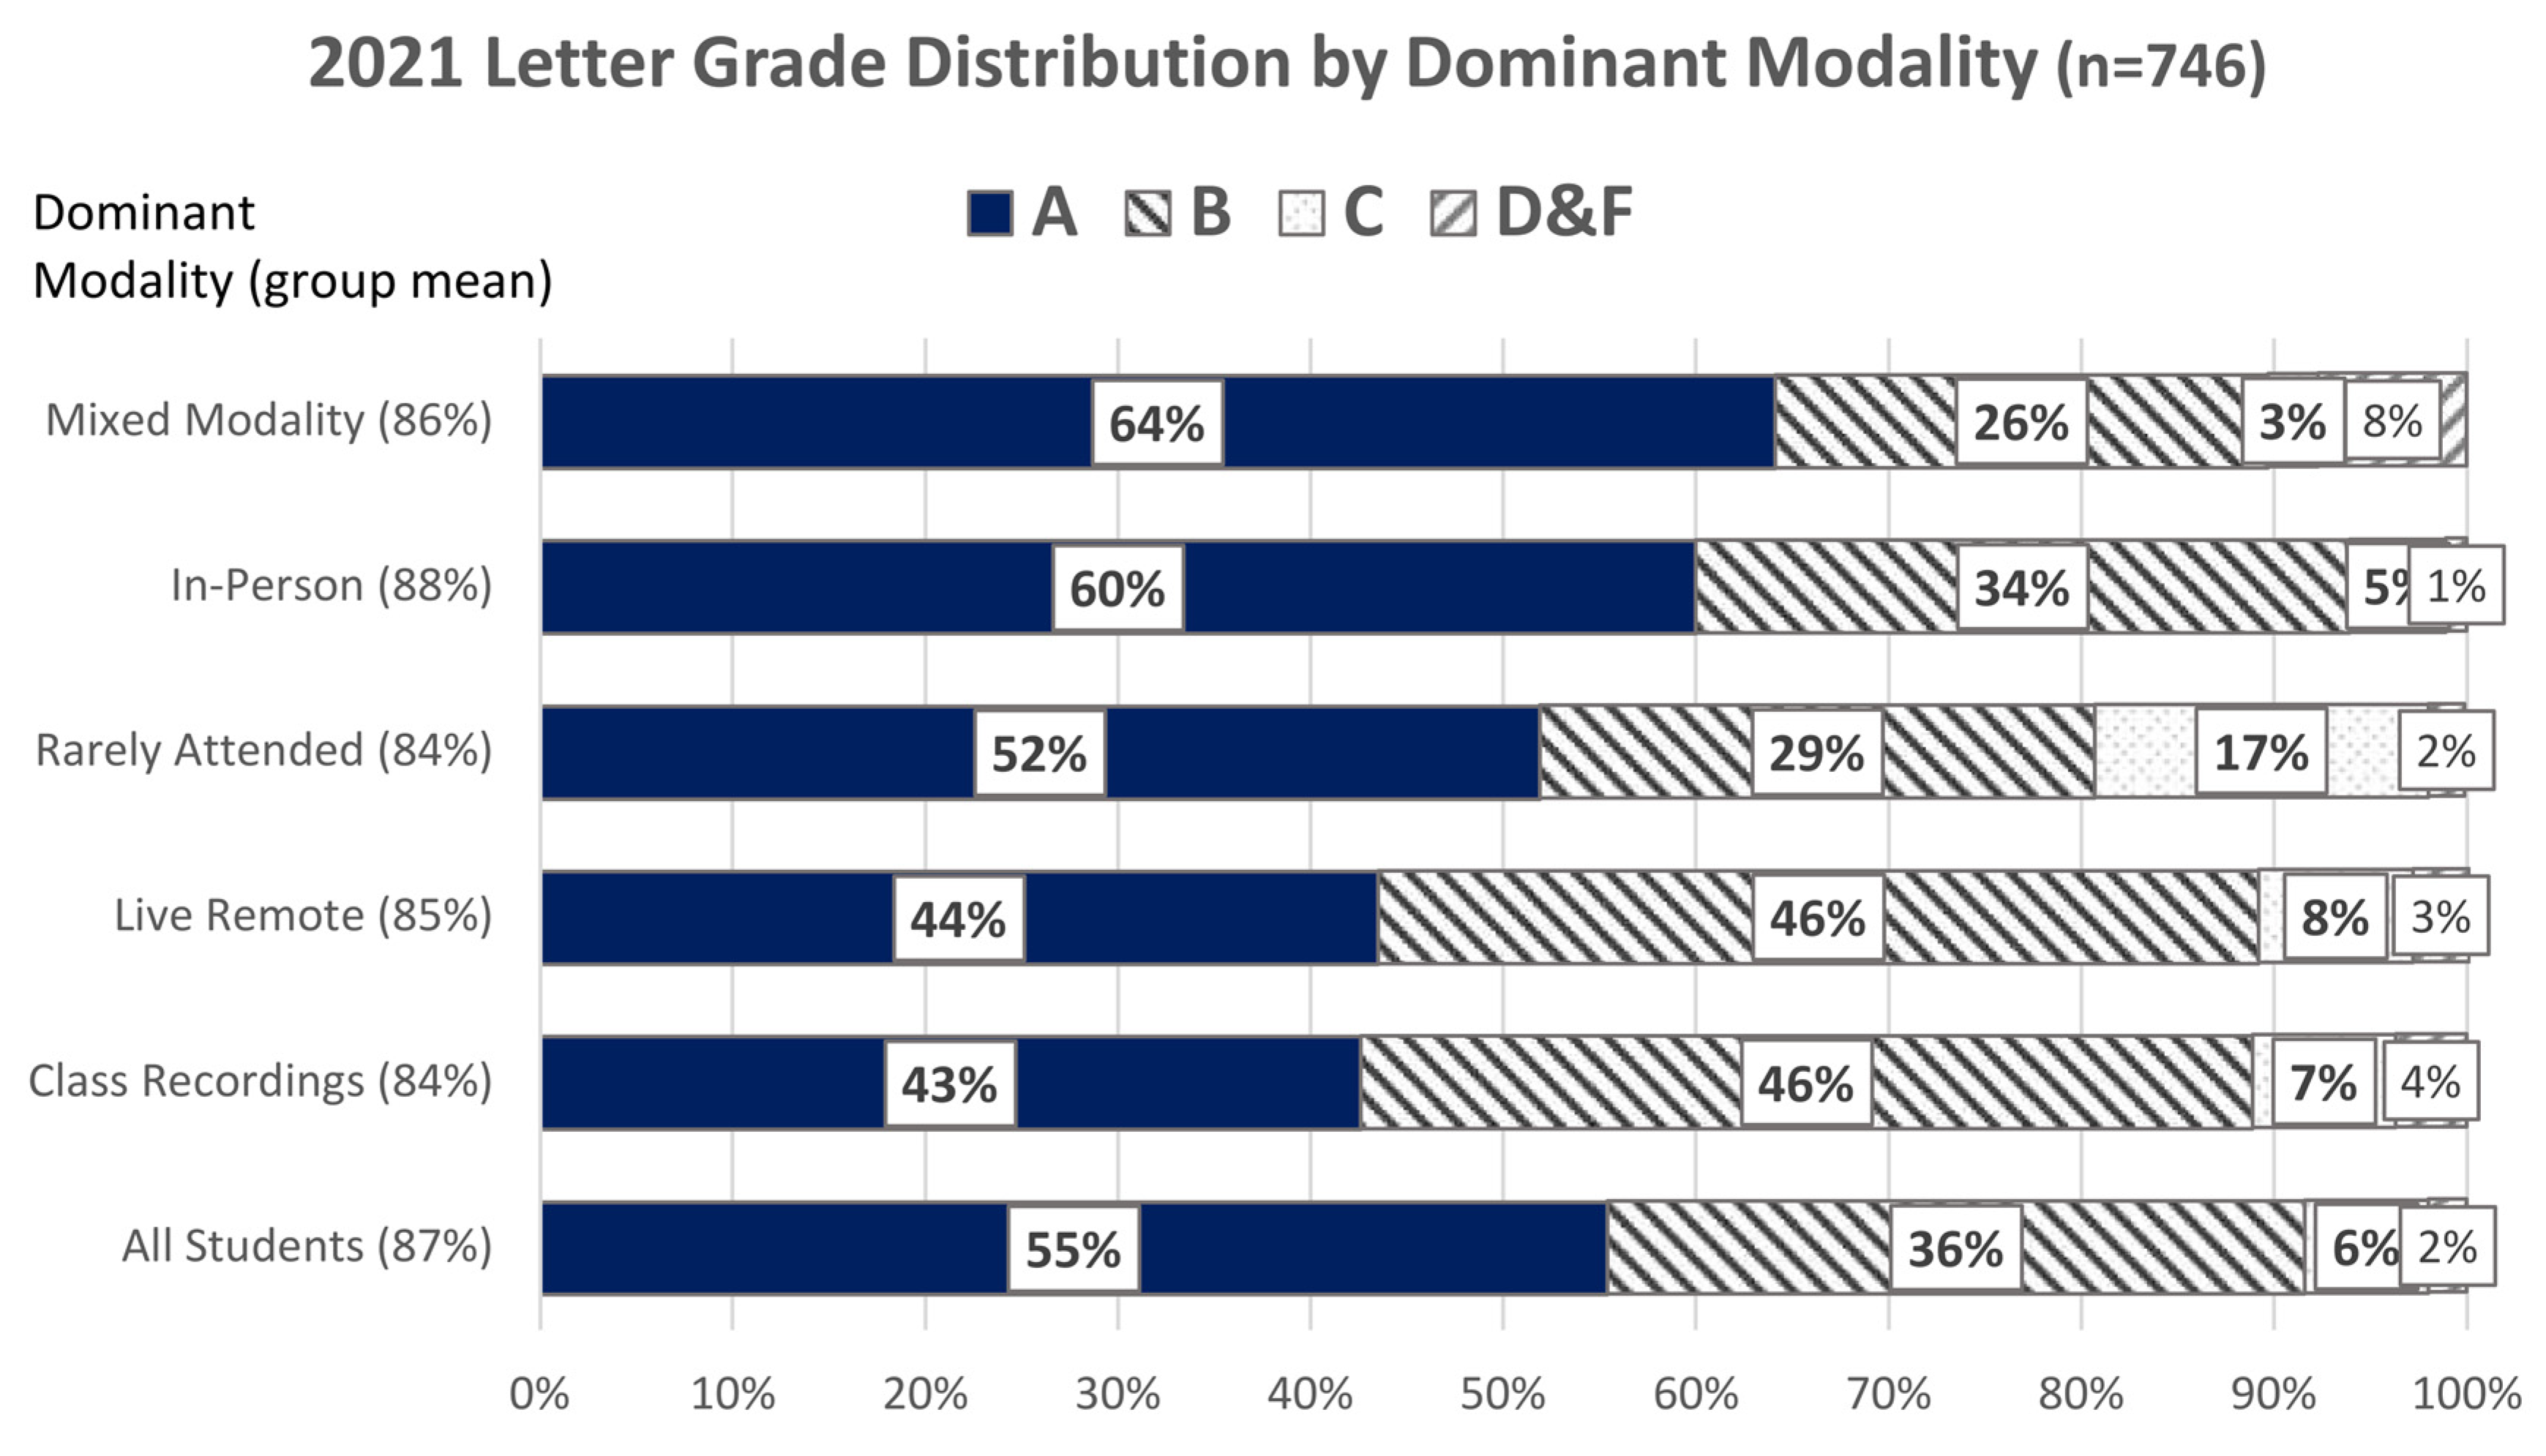
A comparison of achievement by dominant modality using an ANOVA revealed a statistically significant difference between group means (see
Table 12 and
Table 13). However, the practical significance of this result is small. There was only a four-point difference between the in-person group and those who primarily watch class recordings. Based on a post-hoc analysis, this was the only statistically different comparison. However, the effect size for this comparison was 0.028, meaning that this analysis explained less than 3% of the variance.
Figure 4 and
Table 14 present the achievement breakdown by letter grade for students in the 2021 cohort. An analysis of the overall letter grade distribution based on dominant modality shows a statistically significant difference (χ2(12) = 37.3,
p < 0.001, ES = 0.129). However, based on a Cramers V calculation, the effect size was weak. Although there were statistically significant differences in the number of A, B, C, and D or F grades awarded, the practical significance of this result was small.
On average, those who attended class in-person or used a mixed modality obtained the largest proportion of A grades. Those who indicated they primarily participated online and those who mainly watched class recordings received the fewest number of A grades, even fewer than those who indicated they rarely attended class. However, regardless of the modality, over half (55%) of the students received an A, and 91% received an A or a B. Those who indicated they rarely attended class obtained the least number of A or B grades (81%). This group also received the largest number of C grades (17%). Still, regardless of their modality choice, a large number of students in each of the modalities achieved success in the course.
3.3. RQ3: Value of Having Modality Options
An important aspect of this study was to explore students’ perceptions regarding the offer of multiple modalities. It was hypothesized that students would prefer having a choice in how they attend class and see this as a benefit.
Table 15 reports the student survey responses. Students were also asked to explain any benefits and disadvantages they felt occurred as a result of having modality options.
4. Discussion
This research examined students’ achievement and instructional modality preferences in an introductory accounting class. Our purpose was to explore the viability and benefit of offering students a choice of instructional modalities.
4.1. RQ1: Modality Preference and Attendance Behavior
The results of this study partially support our hypothesis for Research Question 1. For various reasons, student participation in class (i.e., their dominant modality) did not always align with their preferred modality, especially at the beginning of the course. However, students’ stated preferences changed as the course progressed. As student preferences became more established, we observed better alignment with the students’ stated preference for a specific modality and their learning behavior.
At the beginning of the semester (Week 4), a majority of students in this study (74%) indicated they preferred attending class in-person. However, only 69% of the students enrolled in the in-person section of the course, and only 62% of students indicated they attended class in-person most of the time. In practice, only 35% of the students (47% of those who indicated they preferred in-person instruction) attended class only in-person. Students who indicated they preferred live remote instruction were even less likely to attend class only online.
Overall, 5% of the 746 students had no dominant learning behavior (mixed modality, see
Table 5). However, 56% of the students availed themselves of multiple modality options to some extent throughout the semester. Furthermore, an analysis of these data revealed that students’ preferences for a specific modality changed as the semester progressed. Three percent of students reported shifting their instructional modality preference to in-person instruction. A few of these indicated they needed the structure of the in-person class to help them avoid distractions and improve their focus. Eleven percent of the students changed their modality preference to live remote online instruction, and 12% indicated a preference shift toward watching the class recordings. These students typically cited the flexibility and convenience of attending classes online, synchronously or asynchronously. We also noted an increased pattern of students not attending class toward the end of the semester. Overall, as student preferences shifted and established themselves, we observed better alignment with the students’ stated preference for a specific modality and their learning behavior.
4.2. RQ2: Academic Achievement by Dominant Modality
Our analysis partially supported our hypothesis for this research question. While there were statistically significant differences in achievement between learning modalities, the differences had small effect sizes and weak practical significance. In addition, the regression analysis revealed other factors that likely predicted achievement better than the modality the student chose.
We initially compared academic achievement for students in 2019 (in-person), 2020 (live remote), and 2021 (HyFlex). This analysis revealed some differences in achievement. Overall, students in 2021 performed slightly better on exams than in previous years. However, the small differences in average achievement and the distribution of letter grades for the three years could reasonably be explained by factors other than the modality options of the course (e.g., second-chance exam policy changes).
The primary focus of this study was the HyFlex instruction provided in 2021, where students had various modality options to choose from. After establishing the dominant learning modality for students in the 2021 cohort, we found only minor differences in aggregate course grades when comparing student achievement by instructional modality. Those participating predominantly in-person and those watching class recordings had the only statistically significant mean difference of four percentage points (88% compared to 84%, on average). In addition, while we found that the distribution of letter grades awarded was different to some degree when comparing groups, many students in each group obtained an A in the course. In fact, over half of those students who reported rarely attending class received an A in the course. So, while there was evidence that students attending class in-person and those who utilized a mixed modality may have slightly higher achievement, regardless of the modality, 91% of all students received an A or a B in the course.
Our suspicion that factors other than learning modality affect achievement was confirmed by the results of the predictive regression analysis we conducted. This analysis found a small benefit in achievement for those attending class in person. However, a student’s ACT scores and previous GPA were better indicators of achievement than that of learning modality. Several possible alternative explanations might also explain this result. Those who attend class in-person may have different capabilities, learning goals, and life circumstances that either allowed them to attend in person or motivated them to apply themselves more diligently to their studies. However, students were able to succeed in any of the instructional modalities they choose.
4.3. RQ3: Student Perceptions of Modality
Our explorations of student perceptions support our hypothesis for the third research question that students will prefer having a choice in how they attend class and see this as a benefit. The vast majority of students agreed that having a choice of modalities was beneficial to their success. The main benefit noted was that of flexibility and convenience. For various reasons, students are not always able to attend class in-person and appreciate the option to participate in other ways rather than miss class entirely. Those who felt that having options was detrimental to their success were few. However, their concerns had more to do with the limitations of specific learning options and the difficulty they had trying to learn within a specific instructional modality. For example, not being able to self-regulate well or having difficulty engaging fully.
5. Conclusions
The results of this study support the idea that students can learn online and in-person. Regardless of the dominant instructional modality students chose, a large majority of students successfully completed this course. The average group achievement for students in this study and the distribution of letter grades was fairly similar. Small statistically significant differences did exist. However, the practical significance of these differences was questionable. In addition, the predictive regression analysis we conducted revealed other factors that predict academic achievement better than instructional modality.
Based on our analysis, we suggest that providing modality options does benefit students. The majority of students in this study indicated that having modality options was a good thing. It can help alleviate anxiety and stress and allows students to regulate their learning based on individual needs. Providing a choice of modality also accommodates attendance issues that occur due to health conditions, weather, and other unexpected situations. Not only does it provide students with a way to catch up when they cannot attend in-person lectures, but it also allows them to review content covered in class when preparing for exams. In this study, we found that most students preferred attending class in-person, with 62% reporting they attended class predominantly in-person. However, a preference for in-person instruction diminished as the course proceeded from 74% to 54%. In practice and for various reasons, most students (56%) attend class utilizing a variety of learning modalities.
Lederman [
28] discussed the advantages and disadvantages of what he calls a “HyFlex” (hybrid flexible) modality. He suggests that offering both in-person and online options allows students the opportunity to manage their learning in ways that meet their personal situations. However, he states that when using a HyFlex instructional format, teachers must evaluate what learning activities are best done in-person and which learning activities work well for online learners. This method requires additional work on the professor’s part but gives the student more control over their learning. It is not surprising that some faculty may not embrace the idea of providing a variety of modality options. Teaching online requires specific skills and abilities that may stretch faculty. Quality online courses are more than just a camera capturing a lecture. Teaching online may require additional resources to ensure the learning opportunity is optimized. For example, resources used in this online course involved teaching assistants who monitor the “chat” feature of the online participants. They would answer questions posted by individual students and communicate with the professor when a response was needed from the instructor.
Based on the results of our analyses, we conclude that many students would benefit from having a choice. In addition, many students prefer, and are successful, studying in settings other than in-person classrooms. These results support the idea that instructional designers should focus on improving the quality of instruction regardless of the modality [
16,
29,
30,
31].
Author Contributions
Conceptualization, M.L., R.D., A.S. and W.M.C.; methodology, M.L., R.D. and A.S.; validation M.L. and R.D.; formal analysis, M.L., R.D. and A.S.; data curation, M.L., R.D. and A.S.; writing—original draft preparation, M.L., R.D., A.S. and W.M.C.; writing—review and editing, M.L. and R.D.; project administration, M.L. All authors have read and agreed to the published version of the manuscript.
Funding
This research received no external funding.
Institutional Review Board Statement
The study was conducted in accordance with the Declaration of Helsinki and approved by the Institutional Review Board (or Ethics Committee) of Brigham Young University (IRB2020-320, July 2020).
Informed Consent Statement
Informed consent was obtained from all subjects involved in the study.
Data Availability Statement
Data available upon request.
Conflicts of Interest
The authors declare no conflict of interest.
Appendix A. Survey Questions Administered on Exams (Weeks 4, 10, and 14)
The following survey questions are optional. There is no requirement to complete them, and no points will be deducted or added for answering them. This information helps me determine how this course should be offered in future semesters.
How did you attend the class session on [weekly topic covered]?
I attended this class in-person
I attended this class watching the live (remote delivery) lecture on Zoom
I attended this class by watching the recorded class video posted after class
I did not attend or watch this class session
Regardless of how you answered the above questions, what is your preferred way of attending class?
Appendix B. Survey Questions Administered to Students at the End of the Semester
Did the offering of multiple modes of class (in-person, zoom, or recorded lectures) hurt you in any way? Yes/No? How? (Open response)
Did the offering of multiple modes of class (in-person, zoom or recorded lectures) help you in any way? Yes/No?
How? (Open response)
How much do you agree that in-person class sessions should be offered?
Strongly agree
Somewhat agree
Somewhat disagree
Strongly disagree
How much do you agree that Zoom class sessions should be offered?
Strongly agree
Somewhat agree
Somewhat disagree
Strongly disagree
How much do you agree that posting of recorded class sessions should be offered?
Strongly agree
Somewhat agree
Somewhat disagree
Strongly disagree
Appendix C
Table A1.
Variables and Descriptive Statistics.
Table A1.
Variables and Descriptive Statistics.
| Panel A: Continuous Variables | |
|---|
| Variable | Variable Group | Description |
|---|
| Course % points (C%) | Dependent variable | Percentage points students earned in ACC 200 |
| In-person (INP) | Independent variable) | # of class periods student self-reported class attendance as in-person |
| Synchronous (SYN) | Independent variable | # of class periods student self-reported class attendance as synchronous |
| Asynchronous (ASYN) | Independent variable | # of class periods student self-reported class attendance as asynchronous |
| ACT | Control variable | Students’ university entrance score |
| Credits (CR) | Control variable | Number of credits students are enrolled in during the semester they took ACC 200 |
| EGPA | Control variable | Students’ cumulative GPA prior to the beginning of the semester that they took ACC 200 |
| Panel B: Categorical Variables | |
| Variable | Variable Group | Description |
| Female (F) | Control variable | Female students = 1, 0 otherwise |
| Nonwhite (NW) | Control variable | Students who classified their race as something other than
white = 1, 0 otherwise |
| First Generation (1stG) | Control variable | First generation students =1, 0 otherwise |
| First Year (FY) | Control variable | First-year students = 1, 0 otherwise |
| Sophomore (SO) | Control variable | Sophomore students = 1, 0 otherwise |
| Letter Grade | Dependent Variable | A = 90%+, B = 80–89%, C = 70–79%, DF = 60% or lower |
References
- Moore, M.G.; Kearsley, G. Distance Education: A Systems View of Online Learning; Cengage Learning: Independence, KY, USA, 2011. [Google Scholar]
- Gaytan, J. Visions shaping the future of online education: Understanding its historical evolution, implications, and assumptions. Online J. Distance Learn. Adm. 2007, 10, 1–10. [Google Scholar]
- Tucker, S. Distance education: Better, worse, or as good as traditional education. Online J. Distance Learn. Adm. 2001, 4, 1–6. [Google Scholar]
- Altindag, D.T.; Filiz, E.S.; Tekin, E. Is Online Education Working? (No. w29113); National Bureau of Economic Research: Cambridge, MA, USA, 2021. [Google Scholar]
- Glazier, R.A.; Hamann, K.; Pollock, P.H.; Wilson, B.M. What drives student success? Assessing the combined effect of transfer students and online courses. Teach. High. Educ. 2021, 26, 839–854. [Google Scholar] [CrossRef]
- Martin, F.; Sun, T.; Westine, C.D. A systematic review of research on online teaching and learning from 2009 to 2018. Comput Educ. 2020, 159, 104009. [Google Scholar] [CrossRef] [PubMed]
- O’Keefe, L.; Rafferty, J.; Gunder, A.; Vignare, K. Delivering High-Quality Instruction Online in Response to COVID-19: Faculty Playbook; Online Learning Consortium: Newburyport, MA, USA, 2020. [Google Scholar]
- IPEDS. U.S. Department of Education, National Center for Education Statistics. Integrated Postsecondary Education Data System (IPEDS), Fall Enrollment Component Final Data (2012–2019) and Provisional Data, 2020, 2021. [Google Scholar]
- Goodman, J.; Melkers, J.; Pallais, A. Can online delivery increase access to education? J. Labor Econ. 2019, 37, 1–34. [Google Scholar] [CrossRef]
- Xu, D.; Xu, Y. The Promises and Limits of Online Higher Education: Understanding How Distance Education Affects Access, Cost, and Quality; American Enterprise Institute: Washington, DC, USA, 2019. [Google Scholar]
- Jordan, E.E.; Samuels, J.A. Research Initiatives in Accounting Education: Improving Learning Effectiveness. Issues Account. Educ. 2020, 35, 9–24. [Google Scholar] [CrossRef]
- Lederman, D. Online Education Ascends. Inside Higher Ed. 7 November 2018. Available online: https://www.insidehighered.com/digital-learning/article/2018/11/07/new-data-online-enrollments-grow-and-share-overall-enrollment?v2 (accessed on 28 August 2023).
- Cameron, M.; Lacy, T.A.; Siegel, P.; Wu, J.; Wilson, A.; Johnson, R.; Burns, R.; Wine, J. 2019-20 National Postsecondary Student Aid Study (NPSAS: 20): First Look at the Impact of the Coronavirus (COVID-19) Pandemic on Undergraduate Student Enrollment, Housing, and Finances (Preliminary Data); NCES 2021-456; National Center for Education Statistics: Washington, DC, USA, 2021. [Google Scholar]
- Mullen, C.A. Does modality matter? A comparison of aspiring leaders’ learning online and face-to-face. J. Furth. High. Educ. 2020, 44, 670–688. [Google Scholar] [CrossRef]
- Zhao, Y.; Lei, J.; Lai, B.Y.C.; Tan, H.S. What makes the difference? A practical analysis of research on the effectiveness of distance education. Teach. Coll. Rec. 2005, 107, 1836–1884. [Google Scholar] [CrossRef]
- Meyer, K.A. Putting the distance learning comparison study in perspective: Its role as personal journey research. Online J. Distance Learn. Adm. 2004, 7. Available online: https://ojdla.com/archive/spring71/meyer71.pdf (accessed on 28 August 2023).
- Simonson, M. In case you’re asked the effectiveness of distance education. Q. Rev. Distance Educ. 2002, 3, 7–9. [Google Scholar]
- Saba, F. Research in distance education: A status report. Int. Rev. Res. Open Distrib. Learn. 2000, 1, 1–9. [Google Scholar] [CrossRef]
- Davies, R. Evaluation Comparison of Online and Classroom Instruction. High. Coll. Technol. J. 1999, 4, 33–46. [Google Scholar]
- Umutlu, D.; Akpinar, Y. Effects of different video modalities on writing achievement in flipped English classes. Contemp. Educ. Technol. 2020, 12, 270. [Google Scholar] [CrossRef] [PubMed]
- Lei, H.; Cui, Y.; Zhou, W. Relationships between student engagement and academic achievement: A meta-analysis. Soc. Behav. Personal. Int. J. 2018, 46, 517–528. [Google Scholar] [CrossRef]
- Kintu, M.J.; Zhu, C.; Kagambe, E. Blended learning effectiveness: The relationship between student characteristics, design features and outcomes. Int. J. Educ. Technol. High. Educ. 2017, 14, 7. [Google Scholar] [CrossRef]
- Loeng, S. Self-directed learning: A core concept in adult education. Educ. Res. Int. 2020, 8, 3816132. [Google Scholar] [CrossRef]
- McAvoy, G.E. Let’s Vote on it: How Implementing Student Choice in Curriculum Affects Classroom Engagement. Illinois Wesleyan University, 10 April 2021. Video, 4:59. Available online: https://digitalcommons.iwu.edu/jwprc/2021/schedule/49/ (accessed on 28 August 2023).
- Grimus, M. Emerging technologies: Impacting learning, pedagogy and curriculum development. In Emerging Technologies and Pedagogies in the Curriculum; Springer: Singapore, 2020; pp. 127–151. [Google Scholar]
- Karatas, K.; Arpaci, I. The role of self-directed learning, metacognition, and 21st century skills predicting the readiness for online learning. Contemp. Educ. Technol. 2021, 13, 300. [Google Scholar] [CrossRef] [PubMed]
- Little, R.J.A.; Rubin, D.B. Statistical Analysis with Missing Data; John Wiley & Sons: Hoboken, NJ, USA, 2019; Volume 793. [Google Scholar]
- Lederman, D. The HyFlex Option for Instruction if Campuses Open This Fall. Inside Higher Ed. 2020. Available online: https://www.insidehighered.com/digital-learning/article/2020/05/13/one-option-delivering-instruction-if-campuses-open-fall-hyflex?v2 (accessed on 28 August 2023).
- Beaudoin, M.F. Distance education leadership: Appraising theory and advancing practice. Reflect. Res. Fac. Leadersh. Distance Educ. 2004, 8, 91101. [Google Scholar]
- Garrison, D.R.; Anderson, T. E–Learning in the 21st Century: A Framework for Research and Practice; Routledge/Falmer: London, UK, 2003. [Google Scholar]
- Sherry, A.C. Quality and its measurement in distance education. In Handbook of Distance Education; Lawrence Erlbaum Associates: Mahwah, NJ, USA, 2003; pp. 435–459. [Google Scholar]
Figure 1.
Dominant Learning Modality.
Figure 1.
Dominant Learning Modality.
Figure 2.
Average Exam Performance by Semester.
Figure 2.
Average Exam Performance by Semester.
Figure 3.
Grade Distribution by Semester.
Figure 3.
Grade Distribution by Semester.
Figure 4.
Letter Grande Distribution by Dominant Modality.
Figure 4.
Letter Grande Distribution by Dominant Modality.
Table 1.
Administrative and Course Delivery Adjustments.
Table 1.
Administrative and Course Delivery Adjustments.
| | Fall 2019 | Fall 2020 | Fall 2021 |
|---|
| Course Modality | In-person Blended:
1-day asynchronous online work; 1 day in-person in a large auditorium classroom | Live Remote Blended:
1-day asynchronous online work; 1 day live remote synchronous via Zoom | Hy-Flex:
1-day asynchronous online work; 1-day option of attending live remote synchronous via Zoom or in-person |
| Accounting lab | In-person and online lab available | Online lab available | In-person and online lab available |
| Exam Administration | Proctored in a testing center on campus, students allowed scratch paper, pencil, and calculator. Phones could not be used. | Proctored via Proctorio online software. Each testing session required student ID verification and audio and visual recording. | Proctored in a testing center on campus, students allowed scratch paper, pencil and calculator. Phones could not be used. |
| Exam Policy | One attempt at each exam | Retake of an exam available, with retake score capped at 80% | Retake of an exam available, with retake score capped at 80% |
| Post-Exam Reviews | Students could review exams in-person in a proctored environment to see what they missed | Not available due to the mandated remote environment | Students could review exams in-person in a proctored environment to see what they missed |
Table 2.
Student Demographics and Ability.
Table 2.
Student Demographics and Ability.
| | Fall 2019
In-Person | Fall 2020
Live Remote | Fall 2021
Hy-Flex |
|---|
| Number of students enrolled | 1144 | 1361 | 1059 |
| Student gender | 35% female, 65% male | 34% female, 66% male | 34% female, 66% male |
| Student race | 81% White, 19% URM | 82% White, 18% URM | 81% White, 19% URM |
| First-generation students | 12% | 12% | 13% |
| Year in school | 31% first year, 41% sophomore, 19% junior, 9% senior | 36% first year, 41% sophomore, 16% junior, 7% senior | 32% first year, 40% sophomore, 21% junior, 7% senior |
| Average student ACT score | 28 | 28 | 28 |
| Average student entering GPA | 3.45 | 3.50 | 3.47 |
| Average enrolled credits | 14 | 14 | 14 |
Table 3.
Hypothesis Tests.
Table 3.
Hypothesis Tests.
| | Variables | Analysis Procedure |
|---|
| H1. Students’ attendance behavior will follow their preferred modality but will vary by learning goals, personal situations, and conditions throughout the course. | Change in stated Preferred Modality accompanied by change in attendance behavior. | Descriptive Statistics |
| H2. There is no significant difference in student achievement based on the course modalities selected by students. | Dependent variables: Course percentage points
Independent variable: Dominant Attendance Modality
Control variables: Gender, minority, first-generation, ACT score, credit hours, entering GPA, year in school | Ordinary least squares regression |
| H2. There is no significant difference in student achievement based on the course modalities selected by students. | Dependent variables: Course percentage points
Independent variable: Dominant Attendance Modality | ANOVA |
| H2. There is no significant difference in student achievement based on the course modalities selected by students. | Dependent variable: Course Letter Grade Achieved
Independent variable: Dominant Attendance Modality | Chi-squared |
| H3. Students will prefer having a choice in how they attend class and see this as a benefit. | Self-Report regarding Benefits and Harm | Qualitative Analysis |
Table 4.
Comparison of Enrollment, Attendance Behavior, and Initial Stated Preference.
Table 4.
Comparison of Enrollment, Attendance Behavior, and Initial Stated Preference.
| Enrollment Modality | N | Overall % of Time Students Attended Enrolled Modality | % Indicating This as Their Preferred Modality in Week 4 * |
|---|
| In-person | 517 (69%) | 79% | 457 (88%) |
| Live Remote Online | 229 (31%) | 55% | 90 (40%) |
| Total | 746 | 72% | |
Table 5.
Dominant Modality.
Table 5.
Dominant Modality.
| Dominant Participation Modality | N = 746
(% of Total) | Only 1 Modaility
n = 329
(% of Total) | Mostly
n = 378
(% of Total) |
|---|
| In-person | 463 (62%) | 261 (35%) | 202 (27%) |
| Live Remote Online | 138 (18%) | 63 (8%) | 75 (10%) |
| Class Recordings | 54 (7%) | 4 (0.5%) | 50 (7%) |
| Did not attend | 52 (7%) | 1 (0.1%) | 51 (7%) |
| Mixed Modality | 39 (5%) | | |
Table 6.
Stated Modality Preference of Students and Attendance Behavior.
Table 6.
Stated Modality Preference of Students and Attendance Behavior.
| | Week 4 | Week 10 | Week 14 |
|---|
| Modality | Stated Preference | % Time Attended Preferred Modality | Stated Preference | % Time Attended Preferred Modality | Stated Preference | % Time Attended Preferred Modality |
|---|
| In-Person | 570 (76%) | 80% | 503 (67%) | 78% | 400 (54%) | 97% |
| Live Remote | 116 (16%) | 76% | 105 (14%) | 68% | 136 (18%) | 88% |
| Class Recordings | 52 (7%) | 29% | 106 (14%) | 42% | 104 (14%) | 80% |
| No Response | 8 (1%) | 8% * | 32 (4%) | 8% * | 106 (14%) | 81% * |
Table 7.
Shift in Stated Preferred Modality from Week 4 to Week 14.
Table 7.
Shift in Stated Preferred Modality from Week 4 to Week 14.
| | | Week 14 Stated Preference | | |
|---|
Week 4
Stated Preference | Week 4
N (% of Total) | In-Person
n (% of grp) | Live Remote Online
n (% of grp) | Class Recordings
n (% of grp) | % Time Students Did Not Attend (W11–W13) | % Preferring the Same Modality
(W4 to W13) |
|---|
| In-person | 498 (67%) | 380 (76%) | 62 (12%) | 56 (11%) | 2% | 76% |
| Live Remote Online | 91 (12%) | 7 (7%) | 66 (69%) | 18 (24%) | 3% | 69% |
| Class Recordings | 44 (6%) | 10 (10%) | 7 (18%) | 27 (56%) | 7% | 56% |
| Overall Shift Totals | 633 (85%) | 17 (3%) | 69 (11%) | 74 (12%) | 2% | 74% |
| No Response | 113 (15%) | | | | | |
| Attendance Behavior * | | 14% | 3% | 7% | 76% | |
| Dominant modality ** | | 34 (30%) | 10 (9%) | 5 (4%) | 49 (43%) | |
Table 8.
Week 14 Modality Preference by Dominant Modality.
Table 8.
Week 14 Modality Preference by Dominant Modality.
| Stated Preferred Modality Week 14 | N (%) | In-Person
n (% of grp) | Live Remote
Online
n (% of grp) | Class Recordings
n (% of grp) | Did Not Attend
n (% of grp) | Mixed Modality
n (% of grp) |
|---|
| In-person | 400 (54%) | 389 (97.3%) | 5 (1.3%) | 0.0% | 1 (0.3%) | 5 (1.3%) |
| Live Remote | 136 (18%) | 17 (12.5%) | 114 (83.8%) | 1 (0.7%) | 0.0% | 4 (2.9%) |
| Class Recordings | 104 (14%) | 26 (25.0%) | 11 (10.6%) | 50 (48.1%) | 2 (1.9%) | 15 (14.4%) |
| No Response | 106 (14%) | 31 (29.2%) | 8 (7.5%) | 3 (2.8%) | 49 (46.2%) | 15 (14.2%) |
| Overall Totals | 746 | 463 (62%) | 138 (18%) | 54 (7%) | 52 (7%) | 39 (5%) |
Table 9.
Mean, Standard Deviation (SD), Range, % Missing for All Measures.
Table 9.
Mean, Standard Deviation (SD), Range, % Missing for All Measures.
| | Mean | SD | Range | % Missing |
|---|
| Course % points | 86.87 | 9.26 | 45.52–100.00 | 0.00% |
| In-person | 6.63 | 0.41 | 0.00–11.00 | 0.00% |
| Synchronous | 2.23 | 0.34 | 0.00–11.00 | 0.00% |
| Asynchronous | 1.09 | 0.21 | 0.00–11.00 | 0.00% |
| Nothing | 0.95 | 0.20 | 0.00–11.00 | 0.00% |
| Female | 0.35 | 0.48 | 0.00–1.00 | 0.00% |
| Non-white | 0.15 | 0.38 | 0.00–1.00 | 0.00% |
| First generation | 0.11 | 0.31 | 0.00–1.00 | 0.00% |
| ACT | 28.48 | 3.86 | 17.00–36.00 | 7.20% |
| Credits | 13.76 | 1.78 | 3.00–18.00 | 0.00% |
| Entering GPA | 3.58 | 0.41 | 2.02–4.00 | 33.4% |
| First year | 0.29 | 0.45 | 0.00–1.00 | 0.00% |
| Sophomore | 0.42 | 0.49 | 0.00–1.00 | 0.00% |
| Junior | 0.22 | 0.41 | 0.00–1.00 | 0.00% |
Table 10.
Pearson Correlation Coefficient Matrix.
Table 10.
Pearson Correlation Coefficient Matrix.
| | C% | INP | SYN | ASYN | FEM | NW | 1st G | ACT | CR | EGPA | FY | SO | JR |
|---|
| C% | 1.00 | | | | | | | | | | | | |
| INP | 0.18 ** | 1.00 | | | | | | | | | | | |
| SYN | −0.12 ** | −0.73 ** | 1.00 | | | | | | | | | | |
| ASYN | −0.10 ** | −0.44 ** | −0.06 | 1.00 | | | | | | | | | |
| FEM | −0.09 * | 0.05 | −0.04 | 0.00 | 1.00 | | | | | | | | |
| NW | −0.08 * | 0.31 | −0.05 | −0.01 | 0.02 | 1.00 | | | | | | | |
| 1st G | −0.15 ** | −0.12 ** | 0.12 ** | 0.04 | 0.00 | 0.11 ** | 1.00 | | | | | | |
| ACT | 0.39 ** | 0.38 | −0.04 | −0.03 | −0.06 | −0.14 ** | −0.22 ** | 1.00 | | | | | |
| CR | 0.10 ** | 0.16 ** | −0.15 ** | −0.05 | −0.05 | −0.03 | −0.12 ** | 0.16 ** | 1.00 | | | | |
| EGPA | 0.54 | 0.10 * | 0.02 | −0.15 ** | −0.03 | −0.07 | −0.19 ** | 0.26 ** | 0.13 ** | 1.00 | | | |
| FY | 0.10 ** | 0.16 ** | −0.07 | −0.12 ** | −0.05 | 0.01 | 0.03 | −0.01 | 0.05 | −0.01 | 1.00 | | |
| SO | −0.04 | 0.02 | −0.03 | 0.01 | 0.01 | −0.03 | 0.03 | −0.03 | −0.02 | −0.06 | −0.55 ** | 1.00 | |
| JR | −0.03 | −0.14 ** | −0.10** | 0.07 | 0.02 | −0.02 | −0.08 * | 0.03 | −0.03 | 0.05 | −0.34 ** | −0.45 ** | 1.00 |
Table 11.
Results of OLS Multiple Regressions.
Table 11.
Results of OLS Multiple Regressions.
| | Column 1 | | Column 2 | |
|---|
| unS.Coeff. a | S.E | S.Coeff. b | S.E. |
|---|
| In-person | 0.31 | * | 0.15 | 0.16 | 0.08 |
| Synchronous | 0.07 | | 0.16 | 0.03 | 0.07 |
| Asynchronous | 0.15 | | 0.19 | 0.04 | 0.05 |
| Female | −1.32 | * | 0.61 | −0.07 | 0.03 |
| Nonwhite | −0.56 | | 1.00 | −0.02 | 0.04 |
| First Generation | −0.73 | | 1.15 | −0.02 | 0.04 |
| ACT | 0.62 | ** | 0.10 | 0.26 | 0.04 |
| Credits | −0.09 | | 0.18 | −0.02 | 0.04 |
| GPA | 9.78 | ** | 1.02 | 0.43 | 0.04 |
| First year | 2.48 | | 1.31 | 0.12 | 0.06 |
| Sophomore | 1.11 | | 1.29 | 0.06 | 0.07 |
| Junior | 0.57 | | 1.35 | 0.03 | 0.06 |
| R2 | 0.34 |
Table 12.
Group Means by Dominant Modality.
Table 12.
Group Means by Dominant Modality.
| Dominant Modality | N | Mean | SD |
|---|
| In-person | 463 | 88.0 | 8.4 |
| Live Remote Online | 138 | 85.3 | 9.5 |
| Class Recordings | 54 | 84.0 | 10.9 |
| Do not attend | 52 | 84.3 | 10.7 |
| Mixed Modality | 39 | 86.3 | 11.2 |
| Total | 746 | 86.9 | 9.3 |
Table 13.
ANOVA Results: Achievement by Modality.
Table 13.
ANOVA Results: Achievement by Modality.
| Source | Type III Sum of Squares | df | Mean Square | F | Sig. | Partial Eta Squared |
|---|
| Corrected Model | 1767.277 a | 4 | 441.8 | 5.274 | <0.001 | 0.028 |
| Intercept | 2,514,418 | 1 | 2,514,418 | 30,016.76 | 0 | 0.976 |
| Modality | 1767.277 | 4 | 441.8 | 5.274 | <0.001 | 0.028 |
| Error | 62,071.45 | 741 | 83.8 | | | |
| Total | 5,692,923 | 746 | | | | |
| Corrected Total | 63,838.73 | 745 | | | | |
Table 14.
Letter Grade Distribution by Dominant Modality.
Table 14.
Letter Grade Distribution by Dominant Modality.
| Dominant Modality | N | Group Mean | A | B | C | DF |
|---|
| In-person | 463 | 88% | 278 (60%) | 157 (34%) | 23 (5%) | 5 (1%) |
| Live Remote | 138 | 85% | 60 (44%) | 63 (46%) | 11 (8%) | 4 (3%) |
| Class Recordings | 54 | 84% | 23 (43%) | 25 (46%) | 4 (7%) | 2 (4%) |
| Rarely Attended | 52 | 84% | 27 (52%) | 15 (29%) | 9 (17%) | 1 (2%) |
| Mixed Modality | 39 | 86% | 25 (64%) | 10 (26%) | 1 (3%) | 3 (8%) |
| All Students | 746 | 87% | 746 (55%) | 270 (36%) | 48 (6%) | 15 (2%) |
Table 15.
Student Survey Responses.
Table 15.
Student Survey Responses.
| Survey Question | Response Rate: 64% |
|---|
| Did the offering of multiple modes of class (in-person, zoom, or recorded lectures) hurt you in any way? | 95% No
5% Yes |
| Did the offering of multiple modes of class (in-person, zoom, or recorded lectures) help you in any way? | 36% No
64% Yes |
| How much do you agree that in-person class sessions should be offered? | 88% Strongly agree
9% Somewhat agree
1% Somewhat disagree
2% Strongly disagree |
| How much do you agree that Zoom class sessions should be offered? | 58% Strongly agree
33% Somewhat agree
6% Somewhat disagree
3% Strongly disagree |
| How much do you agree that posting of recorded class sessions should be offered? | 72% Strongly agree
21% Somewhat agree
5% Somewhat disagree
2% Strongly disagree |
| Disclaimer/Publisher’s Note: The statements, opinions and data contained in all publications are solely those of the individual author(s) and contributor(s) and not of MDPI and/or the editor(s). MDPI and/or the editor(s) disclaim responsibility for any injury to people or property resulting from any ideas, methods, instructions or products referred to in the content. |
© 2023 by the authors. Licensee MDPI, Basel, Switzerland. This article is an open access article distributed under the terms and conditions of the Creative Commons Attribution (CC BY) license (https://creativecommons.org/licenses/by/4.0/).


