1. Introduction
The realignment of education goals focused on increasing the quality of education in line with the UN Sustainable Development Goals. The focus is primarily on the development of key competencies for mastering individual and societal challenges in a complex digital world. Technological innovations are, therefore, increasingly transforming education and provoking the fourth industrial revolution in education, “Education 4.0”. Education 4.0 implies a digital transformation to technology-enhanced teaching and learning [
1].
Of particular interest for educational research are the effects of new technology-based teaching and learning concepts on psychological and cognitive learning processes [
1,
2]. Findings from educational research and technology development are molding educational goals in the digital world and paving the way for new digital technologies in science, technology, and mathematics (STEM) education. An understanding of scientific relationships and structure–function interactions from the real world is essential in STEM education [
3,
4]. In this context, inquiry-based learning has become increasingly popular, using authentic methods and practices from research to build knowledge [
5]. Experimentation is one phase of the inquiry circle [
5]. In science lessons, experimentation has long-term effects on basic science education [
6]. Experiments are indispensable, especially for gaining practical experience and memorable experiences. However, traditional hands-on laboratory experiments are limited by their cognitive complexity, the need for pedagogical support, and methodical instructions regarding learning success [
7]. Often, the implementation of experimental measurement methods is not obvious due to the black box nature of the measurement device, thus hindering the development of conceptual connections [
8]. To transcend these limitations and provide insight into the black boxes of measurement devices, new technologies in the field of extended reality offer enriching possibilities in terms of learner success [
8]. One approach, for example, is to enrich traditional experiments with additional virtual representations [
9,
10]. This allows for previously invisible phenomena or apparatus setups in laboratory equipment to be visualized and functional relationships between real components and virtual representations to be highlighted.
The additional virtual information has often been connected with the DeFT-Framework dealing with multiple external representations, their design, functions, and tasks [
11]. One possibility is to extend the real experimental setup with multiple representations in augmented reality. Thereby, scientific relationships of the experiment can be directly visualized and clarified by combining real and virtual components in multiple external representations.
Furthermore, the use of digital twins as multiple representations is possible. A digital twin is a replication of a physical system into the digital world [
12,
13]. In industry, Digital Twins are already used as another representation to visualize, simulate, analyze and optimize different industrial processes. Digital twins can be used as a simple virtual environment for testing, evaluating, and training processes or they can enable an open optimization loop through continuous data flow to the real object. For educational processes, this means that digital twins offer the possibility of performing virtual experiments as a means of preparation or consolidation of real experiments. The use of digital twins allows for the execution of realistic experiments that would not be possible in schools due to safety regulations or missing equipment, without risking the consequences of handling errors. A continuous flow of data between the physical object and the digital twin requires sensor systems that can capture as many variables of the experiment as possible to integrate the real-time transmission of data to the digital twin. Real-time transmission in the data flow opens up another layer of possibilities for multiple representations. The effects of using the intelligent sensor-based hardware on the digital twin and vice versa become visible. This means, for example, that the changes in state and their consequences on an intelligent hardware can be directly reflected to the user via the representation in the digital twin. This possibility offers multiple representations for the individual experimentation process, in which complicated and unclear hardware elements can be represented simplistically. In addition, handling errors can be identified and reflected more easily in cases of error messages/attempts. For the experimentation process in the classroom, this means that, for example, only one intelligent device would have to be provided to guide and track the experimentation processes with the digital twin. In industry, data on smart hardware and digital twins are already evaluated by algorithms, and decisions are made about actions in the production system based on the processing of these data. For the educational process, similar steps could be used to create a smart digital twin. The wealth of real-time information about the current state of the experiment offers rich opportunities for data-mining in education and AI-based feedback for the user or other data-driven applications in the digital twin.
In this paper, we present a novel experimentation platform called Smart Education Photometer (SmaEPho). The SmaEPho is a portable photometric measurement system and is suitable in the context of inquiry-based learning in STEM education. It provides insights into the black box of photometric measurement systems and electrical circuits to gain deep insights into photometry. Learners can use the SmaEPho along the inquiry-based circle not only as a measurement system for data generation, but also to explore, apply, and transfer various photometry expertise across science subjects. Furthermore, through the use of smart electronics, measured values and changes in the electrical circuit are registered in real-time, transmitted to a digital twin, and visualized accordingly. This adds the aforementioned didactical and methodological value to the representation, for example in the area of self-monitoring. The development of the SmaEPho was based on the photometer from the non-profit organization desklab (Schriesheim, Germany). Analogies in the design of the systems were deliberately created in order to use the intelligent SmaEPho as a demonstrator in combination with the already established desklab photometer. In this case, the teacher would demonstratively build the circuit on the SmaEPho. During this process, the students can observe this circuit setup via the representation of the digital twin and perform the circuit setup at the same time on the design-similar desklab photometer. This is to facilitate knowledge-building regarding electrical circuits and photometry. In future prospects, parallel generated data-log-files can be used to analyze and reconstruct all user actions and interpret cognitive processes to improve the learning process of pupils or students and to support this using AI-based feedback functions.
To take these further steps towards an intelligent digital twin, the main contributions of this paper are as follows:
A portable photometric measuring system with smart electronics for inquiry-based learning in STEM lessons called SmaEPho;
A digital twin of the SmaEPho including visualization and recording function implemented on an iPad;
An evaluation of the hardware and tracking components of the SmaEPho;
An initial field study with students to evaluate the usability of the SmaEPho hardware platform to ensure comparability of usability with students with the already-established system;
Laying the foundation for a wide range of future research questions regarding data analytics and machine learning algorithms
The paper is structured as follows:
Section 2 discusses the theoretical background of the research. In
Section 3, we present the general design of the SmaEPho, the cable and component tracking system, the photometric measuring chamber, and the data communication. The digital twin is described in more detail in
Section 4.
Section 5 describes the results of the hardware evaluation as well as the usability. In
Section 6, the final discussion, concrete further development possibilities, and future research questions are presented. The conclusion in
Section 7 provides a final overview of the educational innovation and research platform SmaEPho, and summarizes the first research results as a starting point for future research.
3. Hardware Platform
This section first describes the general design of the SmaEPho. Subsequently, the individual components, consisting of the cable and component tracking system, over current protection techniques, the photometric measuring chamber, and the data communication between SmaEPho and iPad, are explained in more detail.
3.1. General Overview
In general, the SmaEPho is based on the principles of the desklab photometer presented in
Section 2.5 and is, therefore, very similar in arrangement and coloring. However, the objectives in the development of the SmaEPho significantly differ from those of the desklab photometer. In addition to integrating the object tracking system, protecting the electrical components, and connecting it to the digital twin, and all the resulting possibilities, the aim was to develop a much larger and more robust device that could also function as a demonstrator in larger groups. In this regard, a demonstration of the circuit setup is possible through the additional display of the digital twin by the teacher, in combination with the individual circuit design on the desklab photometer by the students. This can be used facilitate the understanding and setup of the desklab photometer.
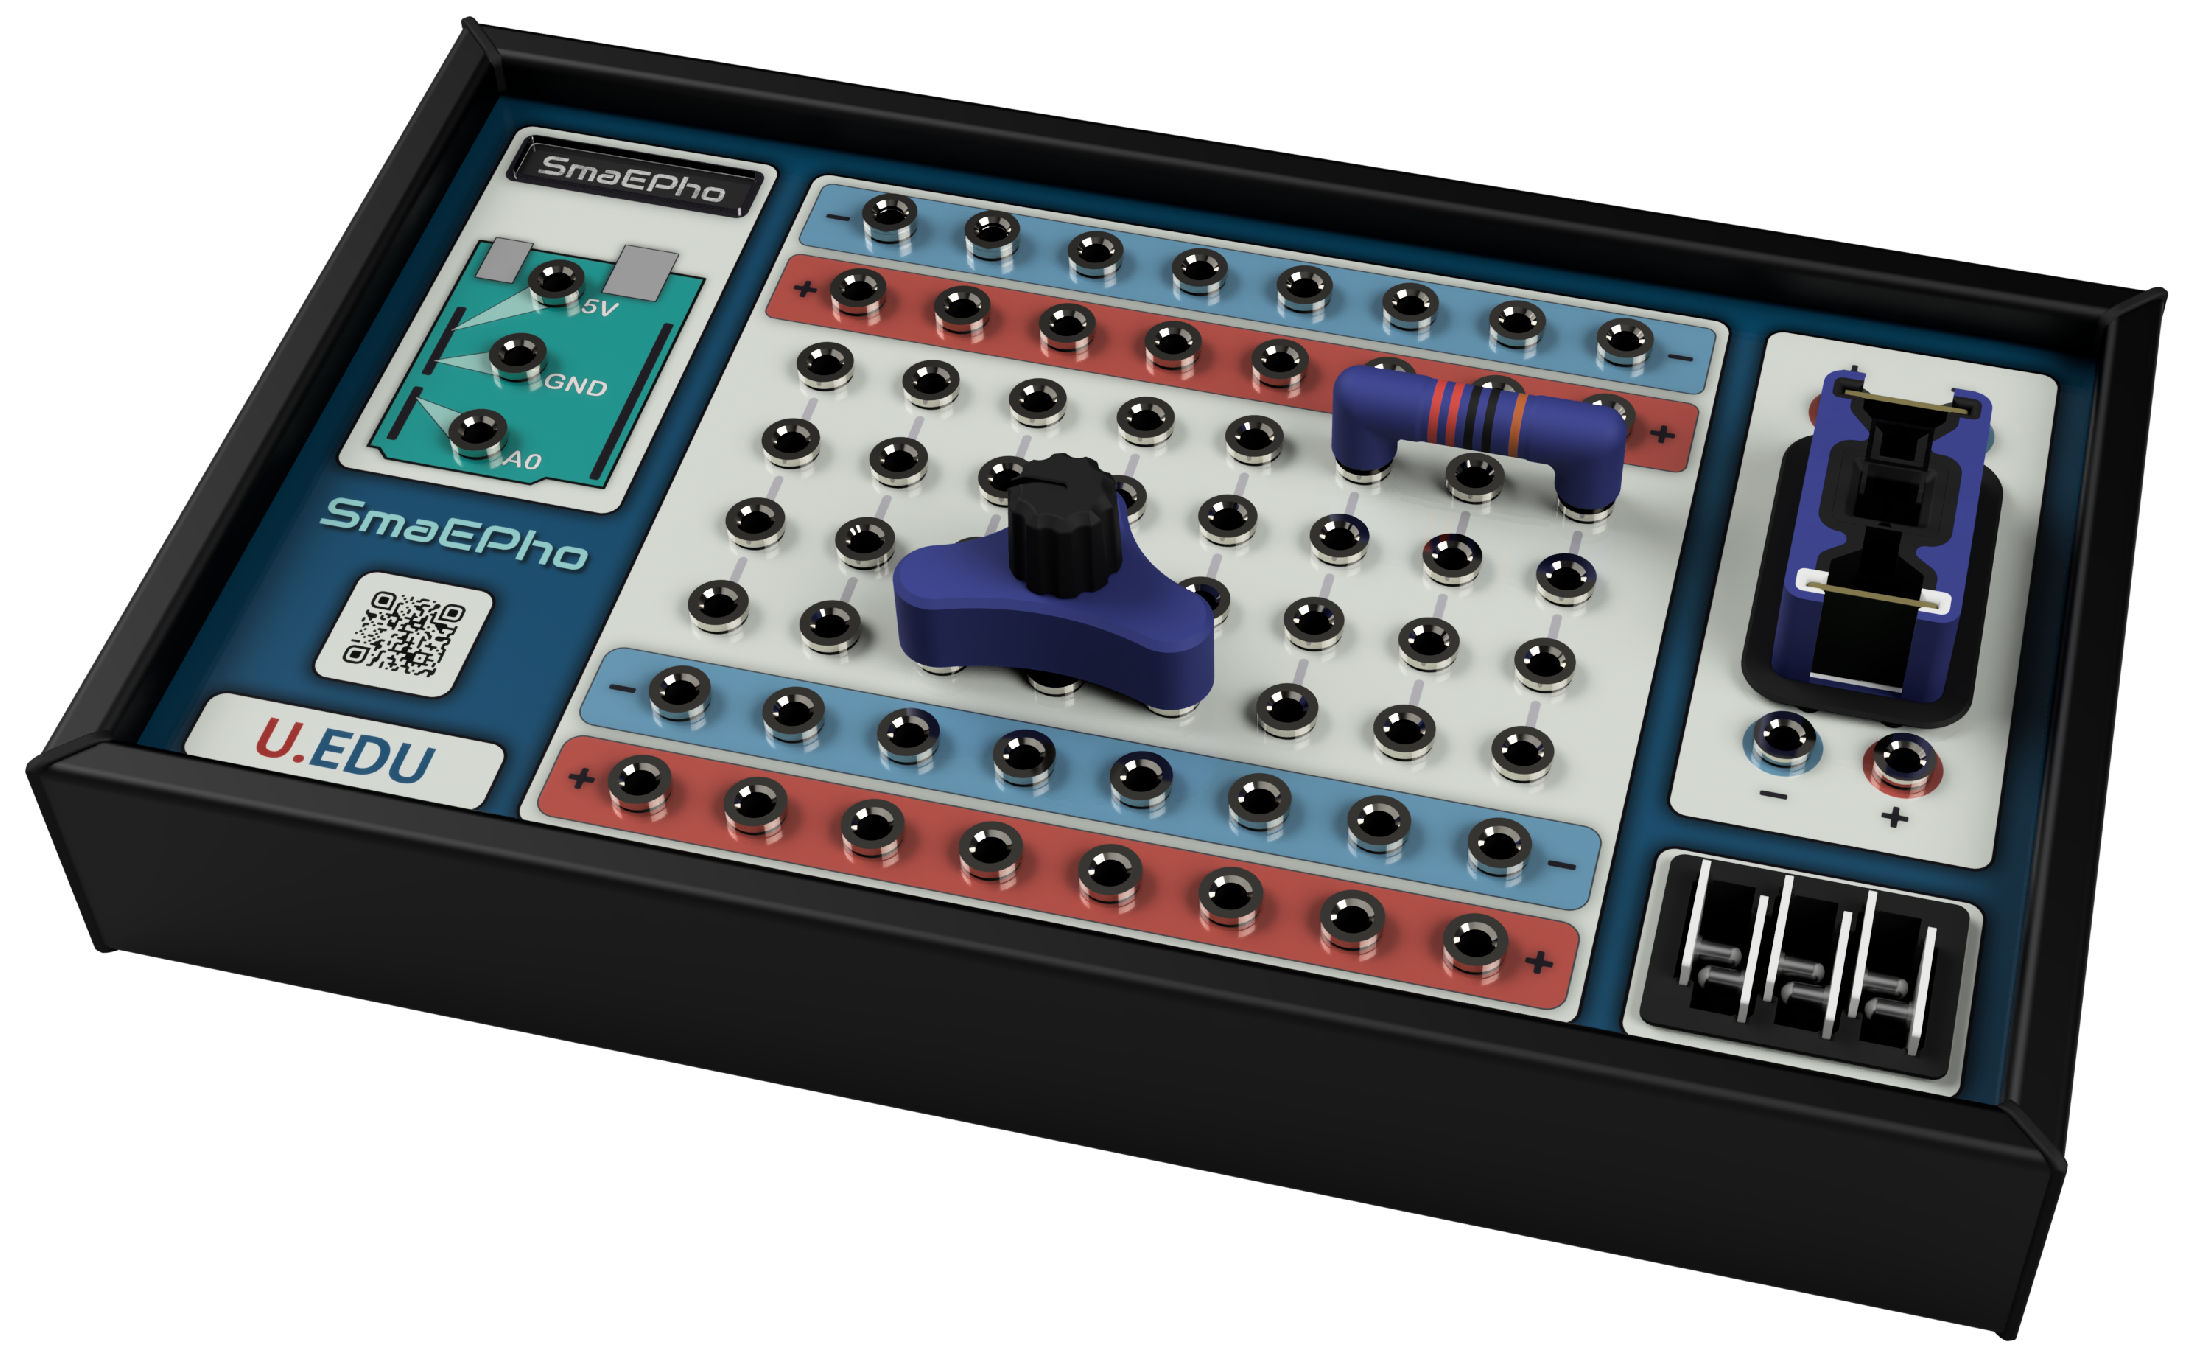
Figure 1 shows the hardware platform of the SmaEPho, which can be divided into three main components:
The microcontroller with the display on the left, which provides a power supply of five volts and an analog input for voltage measurement. The display allows for easy interaction with the user without the need to use an iPad.
The breadboard in the middle is used to build the electrical circuit. The sockets of the upper and lower two rows are connected horizontally. The remaining sockets in the middle are connected vertically. In the construction and design of the breadboard, attention was paid to the similarity with a commercial of-the-shelf breadboard.
The photometric measuring chamber on the right consists of a replaceable LED, a replaceable phototransistor, a diffuser, and a recess to hold the cuvettes. Further details can be found in
Section 3.2.
3.2. Photometric Measuring Setup
Following the measurement setup developed by desklab, the photometric measurement setup of the SmaEPhos was designed to be as basic as possible without compromising the required accuracy. The housing of the measuring chamber is completely 3D-printed and consists of a blue outer shell and a black insert. At the upper edge, custom circuit boards, equipped with specially selected LEDs, can be inserted. By using different colored LEDs, various wavelengths can be measured. At the lower edge, another custom circuit board, equipped with a commonly used phototransistor (SFH 300 from Osram (
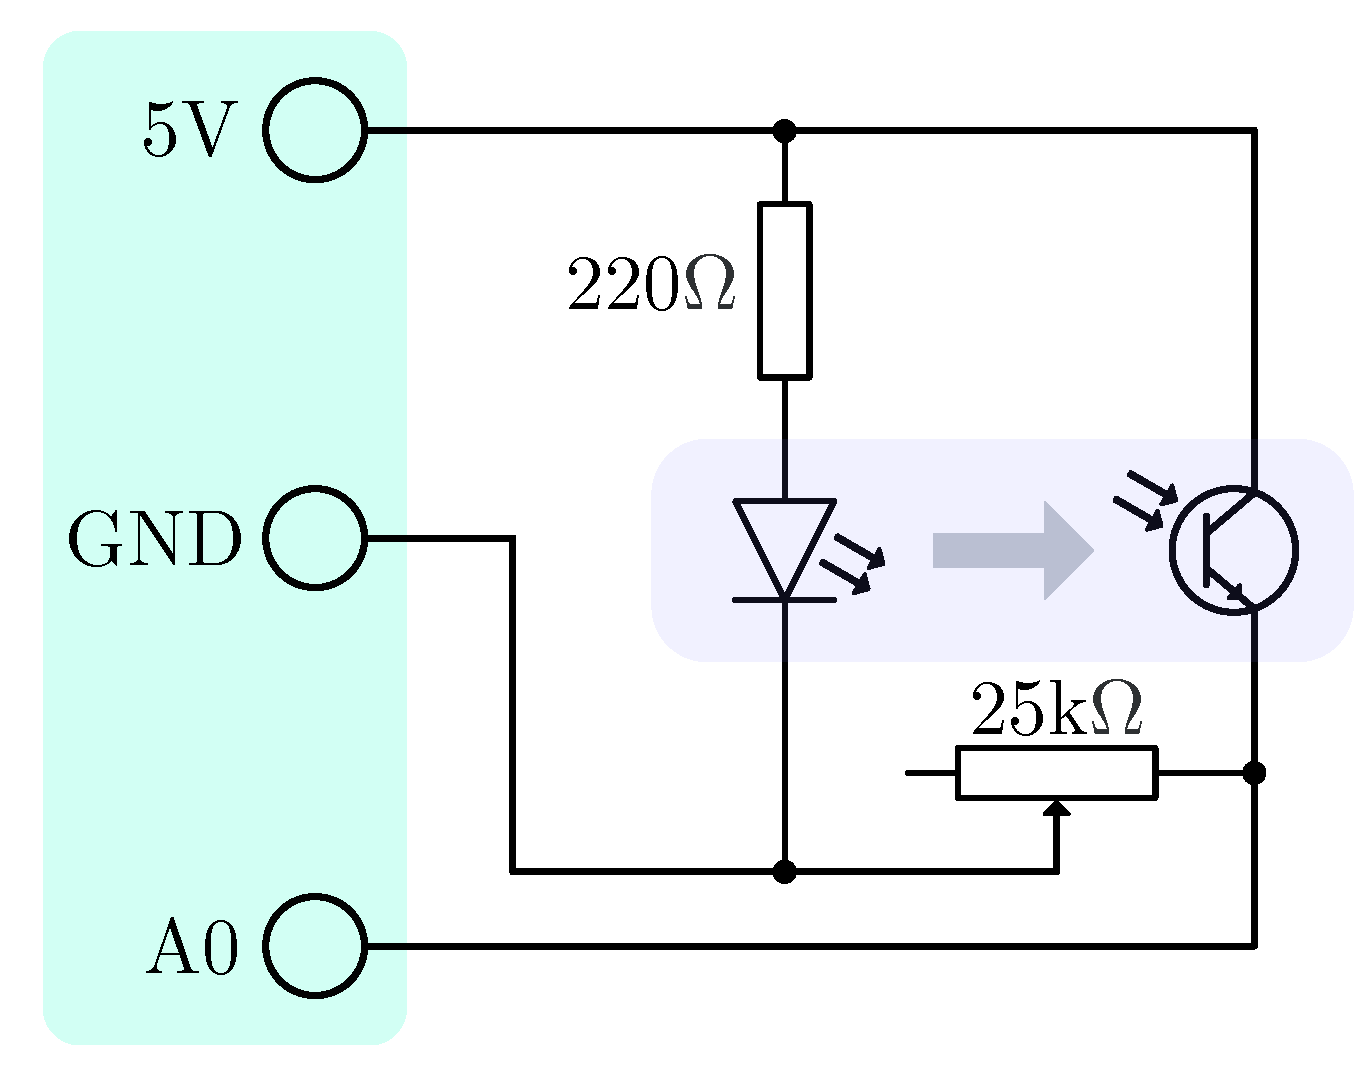
https://www.osram.com/ecat/Radial20T1203-420SFH20300/com/en/class_pim_web_catalog_103489/prd_pim_device_2219651 (accessed on 27 January 2023))), can be inserted. Between the LED and the phototransistor, there is a small diffuser and a recess for a standard cuvette. To block as much disturbing light from the outside as possible, the measurement chamber can be closed off with a 3D-printed cover. The circuit structure that has to be built up on the breadboard for measurements is also kept simple. The LED is connected with a resistor in series with the voltage source. The current through the phototransistor is measured by the voltage drop across an adjustable 25
resistor (potentiometer). An external 10-bit analog-to-digital converter (MCP3021 from Microchip (
https://www.microchip.com/en-us/product/MCP3021 (accessed on 27 January 2023))) connected to the microcontroller is used to measure the voltage. The exact circuit diagram is shown in
Figure 2.
The SmaEPho also offers a mode in which the optical density is directly shown on the display. Therefore, the zero point must first be set using the blank. The blank sample should include all the components of the sample measurement, with the sole exception of the substance to be analyzed. After insertion, the resistance of the potentiometer is adjusted so that the voltage across the resistor is exactly . This value was defined by us and used in the calculation of the optical density in the software of the SmaEPho. Starting from this zero point, the optical density of the following samples was calculated. In order to obtain usable measurement results for an educational environment, despite the simple structure of the photometric measurement unit, a quadratic regression to previously determined measurement values was chosen for the calculation of optical density in SmaEPho. For this purpose, a number of samples for each LED were measured with the SmaEPho, as well as with a professional laboratory photometer (Agilent Technologies, Cary 60). The voltage values measured on the SmaEPho were then normalized by the specified blank value of and adjusted to the optical density measured by the laboratory photometer using a quadratic approximation. This procedure makes it possible to directly compensate for inaccuracies and non-linearities in the measurement setup, but also involves considerable effort due to the large series of measurements required for calibration.
3.3. Cable and Component Tracking
The tracking of each pluggable component on the SmaEPho forms a very important part of its functionality. In addition to all cables and components used to build the circuit, each LED and phototransistor can be uniquely identified. For this purpose, the “Cable Identification System” based on the one-wire-protocol (
https://www.maximintegrated.com/en/products/ibutton-one-wire.html, (accessed on 27 January 2023)), which was presented in [
10], was used as a starting point and slightly modified for our needs. The technology used in the trackable objects does not differ from the original system. Still, the 64 bit ID of a 1 kbit EEPROM Chip (DS2431 from Maxim) is used in each object for identification. However, the implementation of the master that reads the ID on each socket was modified. On the SmaEPho a total of 73 sockets have to be monitored (3 on the microcontroller part, 64 on the breadboard, 4 next to the measurement chamber, 1 for the LED, and 1 for the phototransistor). To achieve a reasonable response time, a total of nine masters were implemented in parallel on the small field-programmable gate array (FPGA; iCE40HX8K from Lattice Semiconductor Corporation). Each master was multiplexing over 8 or 9 sockets and reported detected changes in the microcontroller. The detection of multiple clients per socket, which is used if plugs can be stacked on top of each other, is not required on the SmaEPho and, therefore, was not implemented.
3.4. Overcurrent Protections
Since a wide variety of circuits can be implemented on the breadboard, it is essential to detect possible short-circuits and protect the hardware. This is particularly important as there should be no need for a teacher to check the circuit separately before applying the voltage. In general, the source current was limited to 500 , and the cable, as well as the potentiometer and resistor, were selected accordingly to ensure that no damage was taken at this current. Nevertheless, when the current limit is reached, a signal is sent to the software, which can then specifically deactivate the voltage source if necessary or trigger actions on the digital twin. Specially selected shunts are used to monitor the current through the LED and phototransistor, reporting the status to the software, which can then disable the connections through photorelays. In addition, all connections to the microcontroller and FPGA are protected by bidirectional digital isolators.
3.5. Data Communication
The data connection between iPad and SmaEPho was established via Bluetooth Low Energy (BLE). An nRF52840 System on Chip (SoC) from Nordic Semiconductor (Trondheim, Norway) is used for this purpose (
https://www.nordicsemi.com/Products/nRF52840, (accessed on 27 January 2023)). In addition to communication, this is also used to pre-process the cable and component tracking data, process the measured values, and control the display. The processed data are then labeled with predefined packet identifiers and sent to the iPad. The following information is exchanged:
Current measured value of the analog-digital converter (socket A0);
Status and, if available, the ID of the inserted object for all sockets;
Status and, if available, the ID of the inserted LED and phototransistor;
Status of the overcurrent detection mechanisms and the associated disconnectors for the voltage source, LED, and phototransistor.
4. SmaEPho–Digital Twin
The app, which forms the digital twin of the SmaEPho, runs on an iPad. This is based on Apple’s ARKit (
https://developer.apple.com/augmented-reality/arkit/, (accessed on 27 January 2023)) and is connected to the physical SmaEPho via the BLE interface. The received data are used to display the exact state of the SmaEPho using a three-dimensional model of the SmaEPho and all its components. In addition, warnings are issued in the event of short-circuits, for example. Furthermore, the data are also stored in special log files for later analysis and further processing. Configurations on the SmaEPho can also be changed via the app. This applies, for example, to different measurement modes, such as voltage ranges or direct conversion to optical density. Considering the clearly recognizable data flow between the SmaEPho and the digital twin, this can be assigned to the digital shadows after precise categorization
Section 2.3. This means that, as previously defined, there is an automated one-way data flow between the state of the SmaEPho, the physical object, and the digital twin. A change in the state of the SmaEPho leads to a change in the state of the digital twin via the intelligent sensor system.
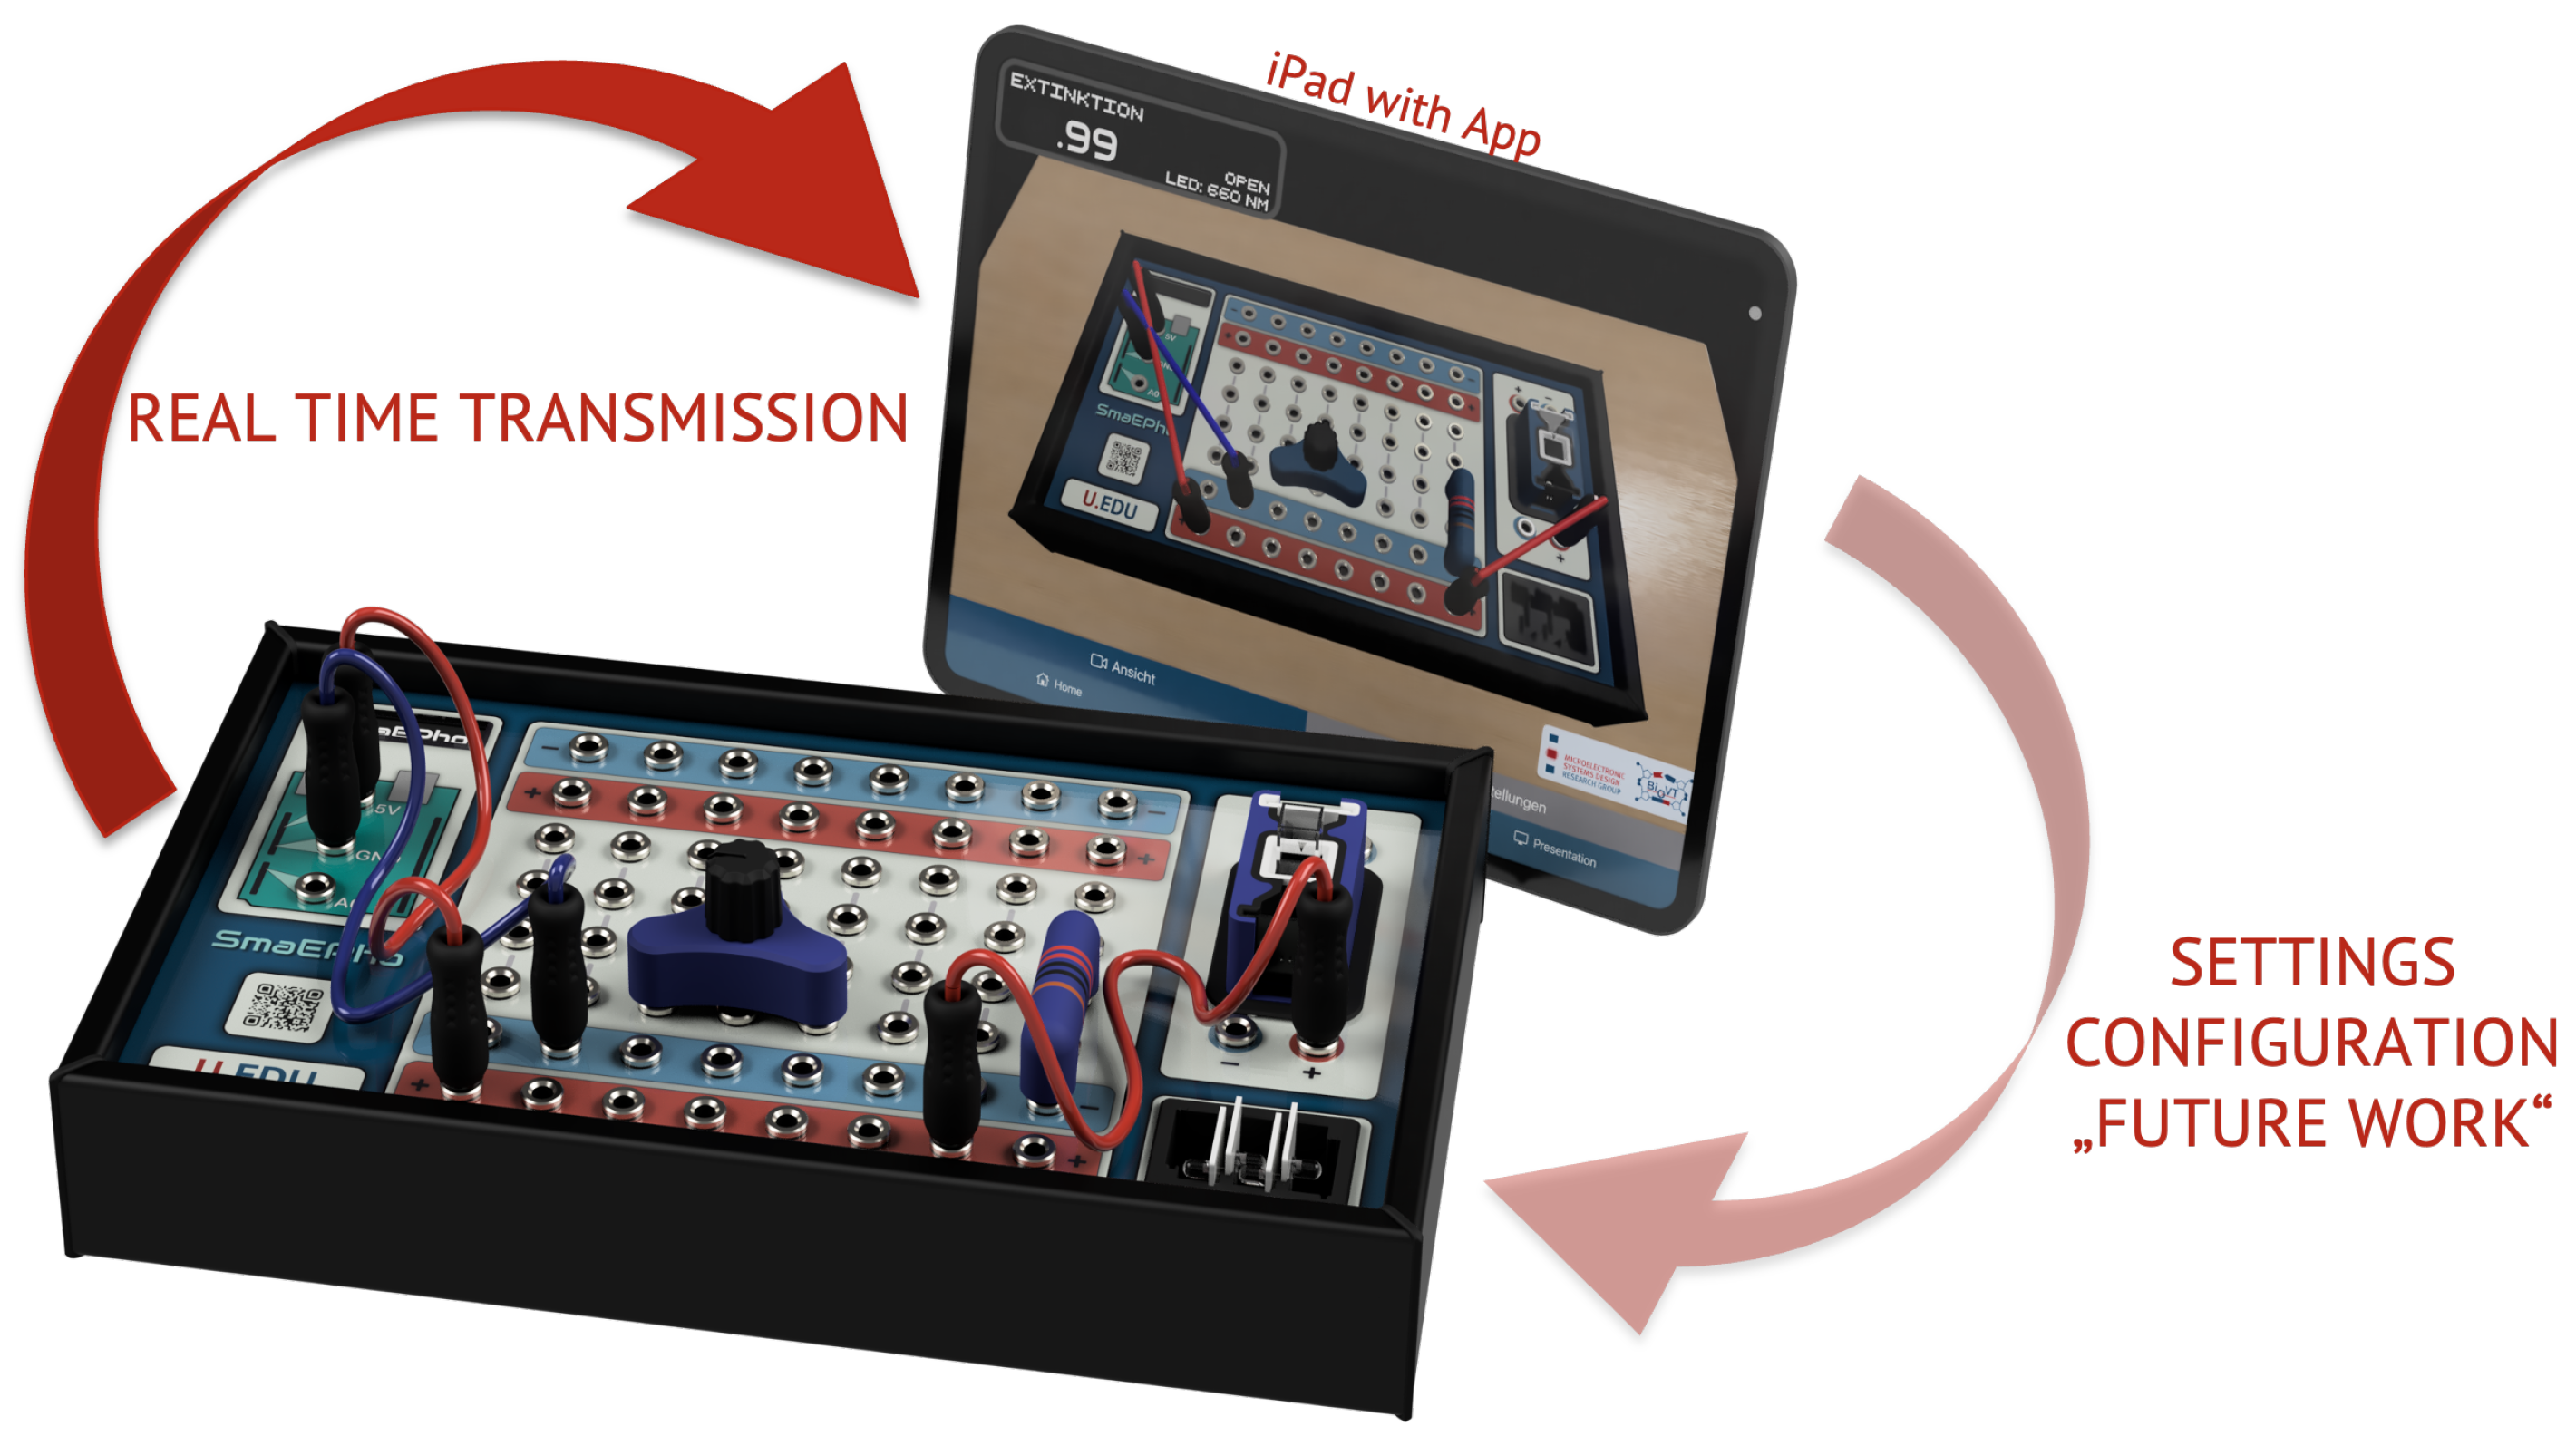
Figure 3 shows an image of the SmaEPho with the digital twin and a visualization of the data flow. In
Figure 3, according to the definition of a digital twin, the data flow between an existing physical system and a digital object is fully integrated in both directions. Currently, the data flow from the digital twin to the SmaEPho is limited when changing settings and activating or deactivating the hardware, for example, in the event of a short circuit. This data flow is currently very restricted, but was not the focus of the core development work. In future work, the data flow from digital twin to hardware will be established. The presentation of the current state of SmaEPhos on the digital can be used in a teaching–learning context in the form of an additional presentation level, as a demonstrator. Using a presentation medium, e.g., a beamer, the digital twin can be presented and the circuit design can be re-enacted live in a large group. As a further development of the digital twin, the possibility of interaction is planned to enable its use in a remote learning setting.
5. Evaluation
Two types of evaluations were carried out to assess the newly developed SmaEPho in practice, two types of evaluations. First, the hardware platform of the SmaEPho was evaluated for its functionality. This includes the accuracy and precision of the photometric measurement system compared to a professional laboratory photometer, as well as the maximum latency of the object tracking. The second evaluation consisted of a field study with high-school students who tested the usability of the SmaEPho evaluated with the System Usability Scale, as in Brooke [
34]. Acceptable usability is an essential cornerstone for further research projects. The prerequisite here is that the usability of SmaEPho is at least as good as that of the comparable and currently established desklab system for reference, ensuring its meaningful use as a demonstrator of SmaEPho in combination with the desklab photometer.
5.1. Hardware Platform Evaluation
In the education sector, the requirements for a measuring system differ considerably from those in a laboratory setup. Absolute accuracy often plays a subordinate role, as it is usually more important to understand the basic measurement principle of measurement. However, larger delays between the physical and the digital world, e.g., after plugging in a cable, can quickly become irritating and disturbing.
5.1.1. Object Tracking
The object tracking of the SmaEPho is based on the device ID of the one-wire interface, which is digitally retrieved from the respective inserted component. In addition to the ID, a cyclic redundancy check (CRC) is also transmitted, so transmission errors can be reliably detected. Since we use one master interface to query up to nine slots, one after the other, the maximum latency between two queries in the same slot is around 135 . For processing and transmission of the data to the digital twin, a maximum latency of 25 could be determined.
5.1.2. Photometric Measurement System
The aim of the photometric measuring system is clearly to demonstrate the basic operation of a photometric measuring device. Therefore, when designing the measuring system, more emphasis was placed on a simple circuit and standard components than on absolute accuracy. As light sources with a limited range in wavelengths, standard LEDs with various peak wavelengths were used in our case to cover the different measurement ranges ( 470 , 530 , 590 , 620 , 660 ). The spectral full width at half maximum (FWHM) of the LEDs was approx. 60 , resulting in a much more widely scattered light than what is used in modern laboratory photometers. The latter operates in the range of a few nanometers in width. A standard phototransistor (SFH 300 from Osram) with a preferably linear behavior between irradiance and current was used to measure the luminous intensity. The phototransistor was connected in series to an adjustable resistor and the voltage dropping across the resistor was measured by the ADC. In this way, a direct correlation can be established between the measured voltage irradiance.
To calibrate the measuring system, the reference point must first be set using a blank sample, including all dissolved components in the sample solution, with the exclusion of the substance that is to be analyzed. After inserting the blank sample into the measuring chamber, the resistance of the potentiometer is adjusted so that the voltage across the resistor is exactly , or the value of optical density is . This value was specifically defined in the development and stored in the calculation of the optical density in the software of the SmaEPhos.
As described in
Section 3.2, a quadratic approximation on pre-determined measurements with a laboratory photometer was used to determine the optical density to compensate for possible non-linearities and inaccuracies in advance. To evaluate the system, a series of measurements were again performed, in comparison with the laboratory photometer. A colorimetric detection reaction was used to evaluate the optical density (OD) of a standard series with 12 different phosphates (PO
) concentrations in
/
(
;
;
;
;
;
;
; 1;
; 2;
; 5) measured in triplicate on the SmaEPho, as well as on the laboratory photometer, for each of the LEDs.
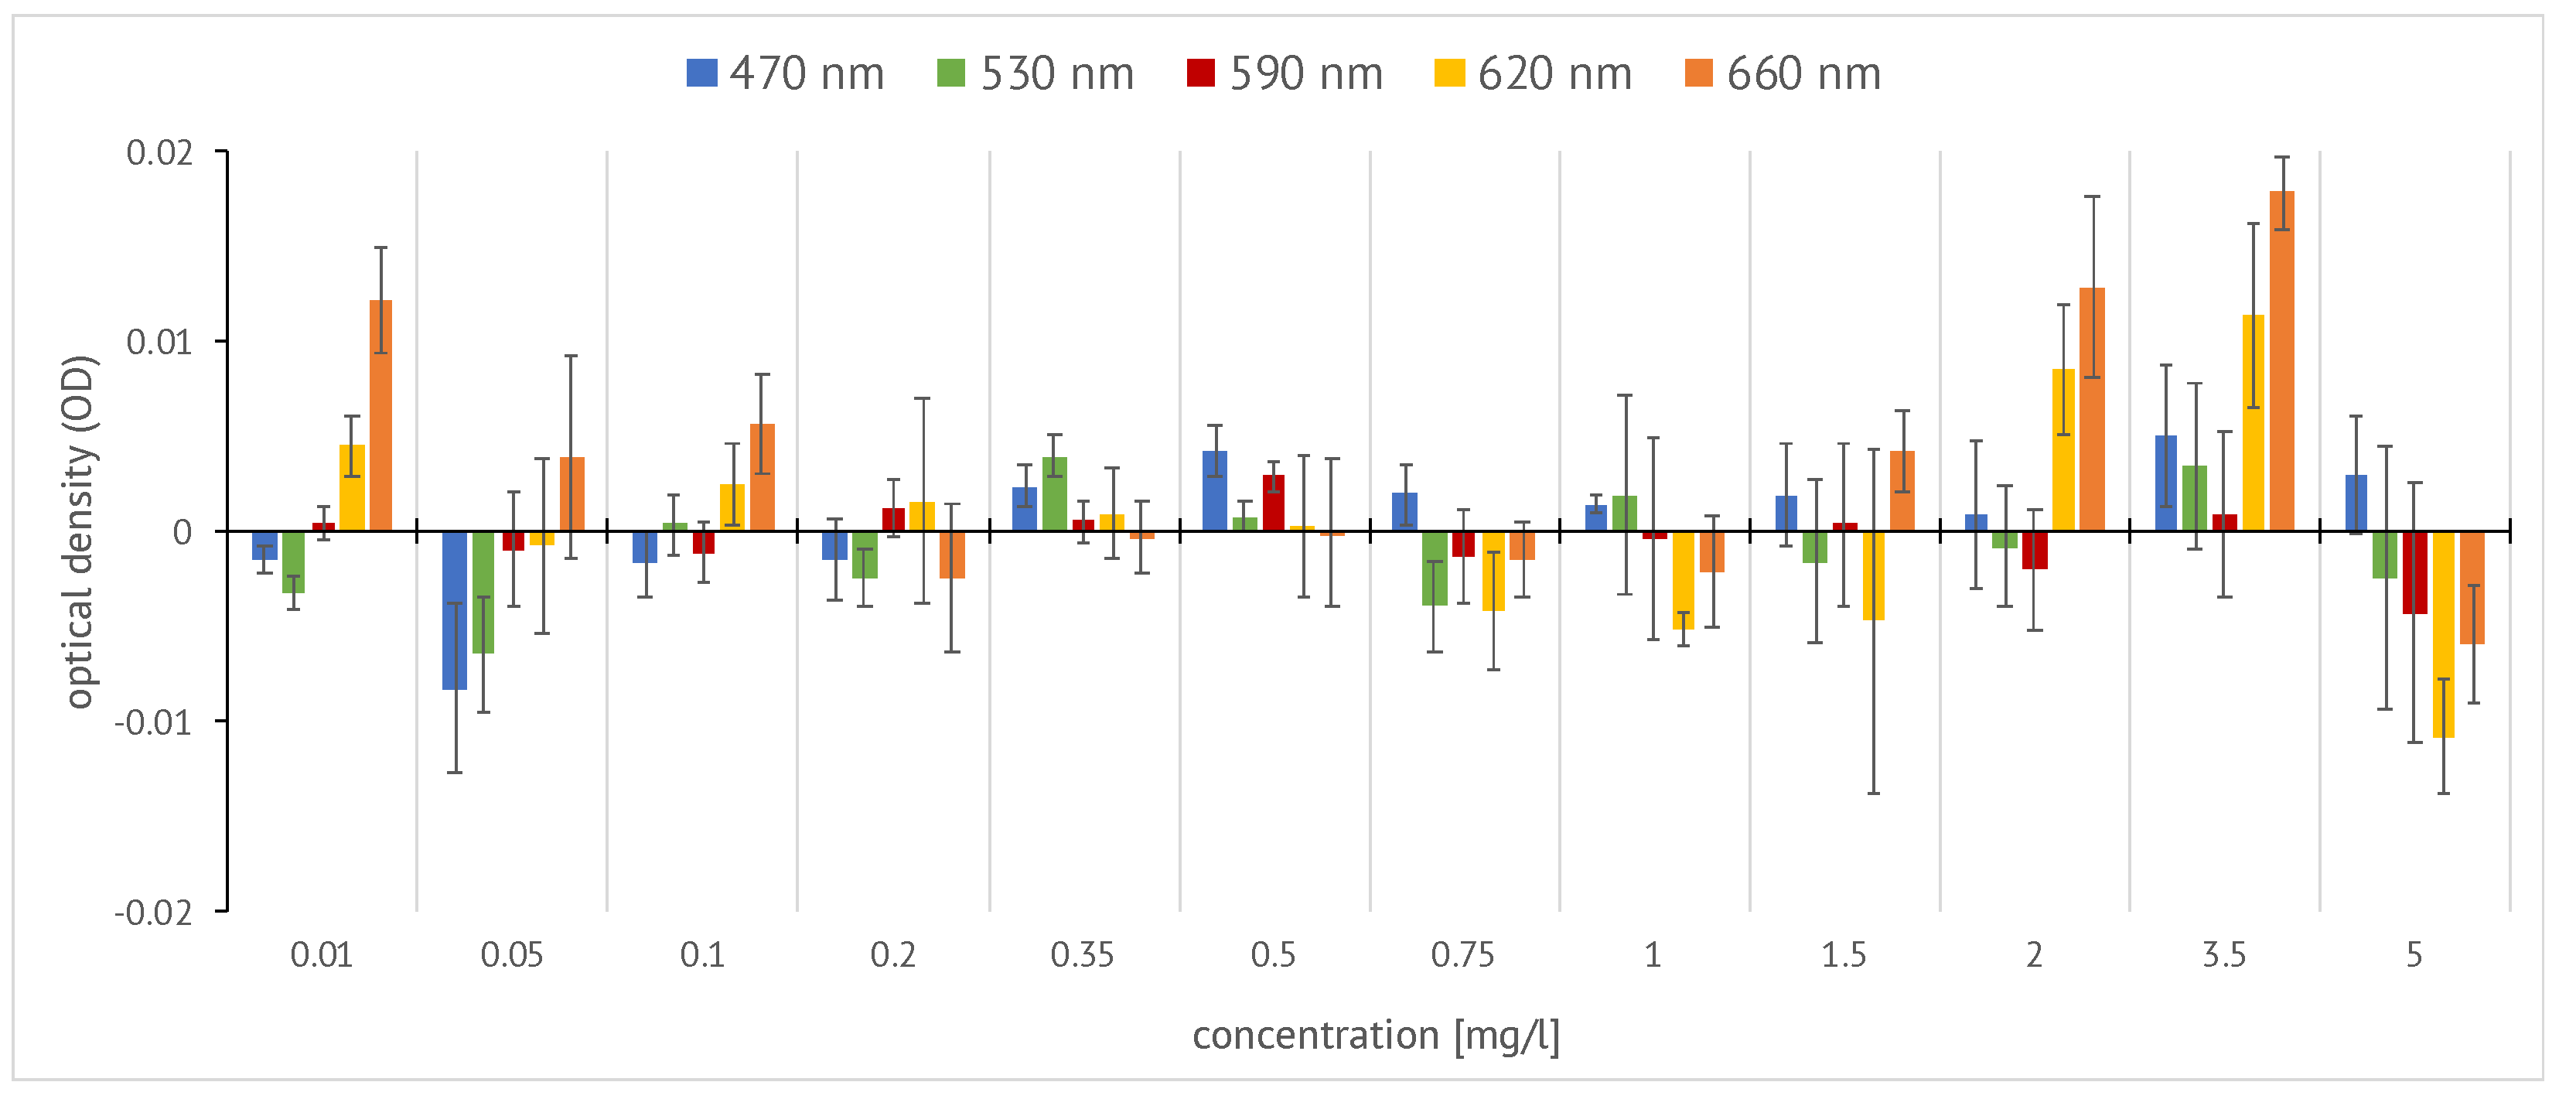
Figure 4 shows the mean values of the difference, i.e., the potential error of the optical density between SmaEPho and the laboratory photometer for each concentration of the measured samples. The SmaEPho only displays the optical density to two decimal places. This means that the display error is in the range of
for almost all of our measurements. However, the results also show higher deviations in the limit range at higher and lower concentrations at wavelengths 620
and 660
. Here, optimization possibilities remain open. For simple measurements in the educational field, such as the determination of the concentration of nitrate, nitrite, or phosphate ion to examine water samples, or for the determination of growth curves of a cultivation, for example, an algae culture, the results are more than sufficient.
5.2. Usability Evaluation
Evaluating usability is a common method to lay the first cornerstone for further research questions. High usability implies that the target group, in this case, students, is satisfied with the use (e.g., low complexity) and efficiency (e.g., the time and effort required to use the device). If high usability has already been established and further research questions focus, for example, on cognitive load or learning efficiency, influencing factors regarding usability can already be excluded and used to justify the results. Based on this, the first field study with high school students, focusing on the usability of our intelligent photometric measurement system, is presented in this paper. Our intention is to lay the foundation for large fields of potential future research questions, which the SmaEPho, with its digital twin as an innovative educational technology, will open. One goal of the study is that the usability of the SmaEPho reaches at least the usability of comparable photometric measurement systems for education. Due to the fact that the SmaEPho was developed on the basis of the desklab photometer, which is well-established in the classroom, and that analogies were made in the design and construction of the hardware platform, we used this as a comparative system for the usability study.
5.3. Hyoptheses and Research Questions
The aim of this study is to evaluate the usability of the newly developed SmaEPho hardware platform and determine whether it is at least comparable to the already established photometric measurement system from desklab. The design of the SmaEPho was conceived and further developed based on the portable photometer from desklab. The design of the desklab photometer is explained in
Section 2.5. With regard to the technology-based educational goals, measurement systems can be extended in many ways, with new technologies and innovations, especially with regard to sensor-based and AI-based learning systems. Based on the existing smart sensor system [
10] for STEM experiments in electrical circuits with cable identification for circuit reconstruction, SmaEPho was developed. Due to the increased space requirements for the plugs and sockets of the intelligent sensor system, the structure of the SmaEPho hardware was enlarged (dimensions: approx. 44
× 23
). The number of plug contacts was minimized to 64 compared to the desklab photometer, which reduces the plugging possibilities or the number of correct or incorrect plug connections in the circuit design. The actual photometer (measuring chamber) is identical in construction, so that the measuring accuracy is guaranteed and the measurement results remain comparable to the desklab photometer.
Since the design of the SmaEPhos was developed on the basis of the desklab photometer, the usability of the already-established desklab photometer served as a reference. The following hypothesis was formulated for the usability study: With the present study set-up, the usability of the SmaEPhos shows no significant differences when compared to the usability of the desklab photometer that has already been established for use in the classroom.
It is interesting to observe the effects of the structural changes to the breadboard due to the intelligent technology, and to determine their effects on usability. Due to the intelligent sensor technology and the resulting enlarged construction with a reduced number of slots on the breadboard, there are far fewer plug-in options than there are with the desklab photometer. In this respect, however, it is assumed that this lower number of possibilities leads to a better overview and can be defined as a possible indicator for lower cognitive load or easier handling. The measurement of the time required to operate the SmaEPhos serves as an initial basis for related data. Another hypothesis was formulated based on this: The time required to set up the circuit and perform a photometric measurement is lower with the SmaEPho than with the desklab photometer. However, in order to investigate the effects of the reduction in cognitive load on circuit design, more specific research is needed.
5.3.1. Participants
In total, 52 high-school students (24 male, 27 female, 1 diverse/non-binary) participated in the usability study. The students attended the upper secondary level (in German: gymnasiale Oberstufe) of two high schools and had an average age of (sd ). Participation in the study was voluntary and, as a prerequisite, at least one science subject should be studied to ensure students have a comparable interest in science and technology.
5.3.2. System Setup
The evaluated system consisted of a photometric measurement system (SmaEPho or desklab photometer) and written instructions for the two parts of the investigation phase. For the assembly of the circuit in the first part, the participants were provided with a suitable amount of cables, one potentiometer, and one resistor. In addition, the required LEDs for the corresponding wavelengths and a phototransistor were provided. The components of the electrical circuit were each adapted to the photometric measurement system.
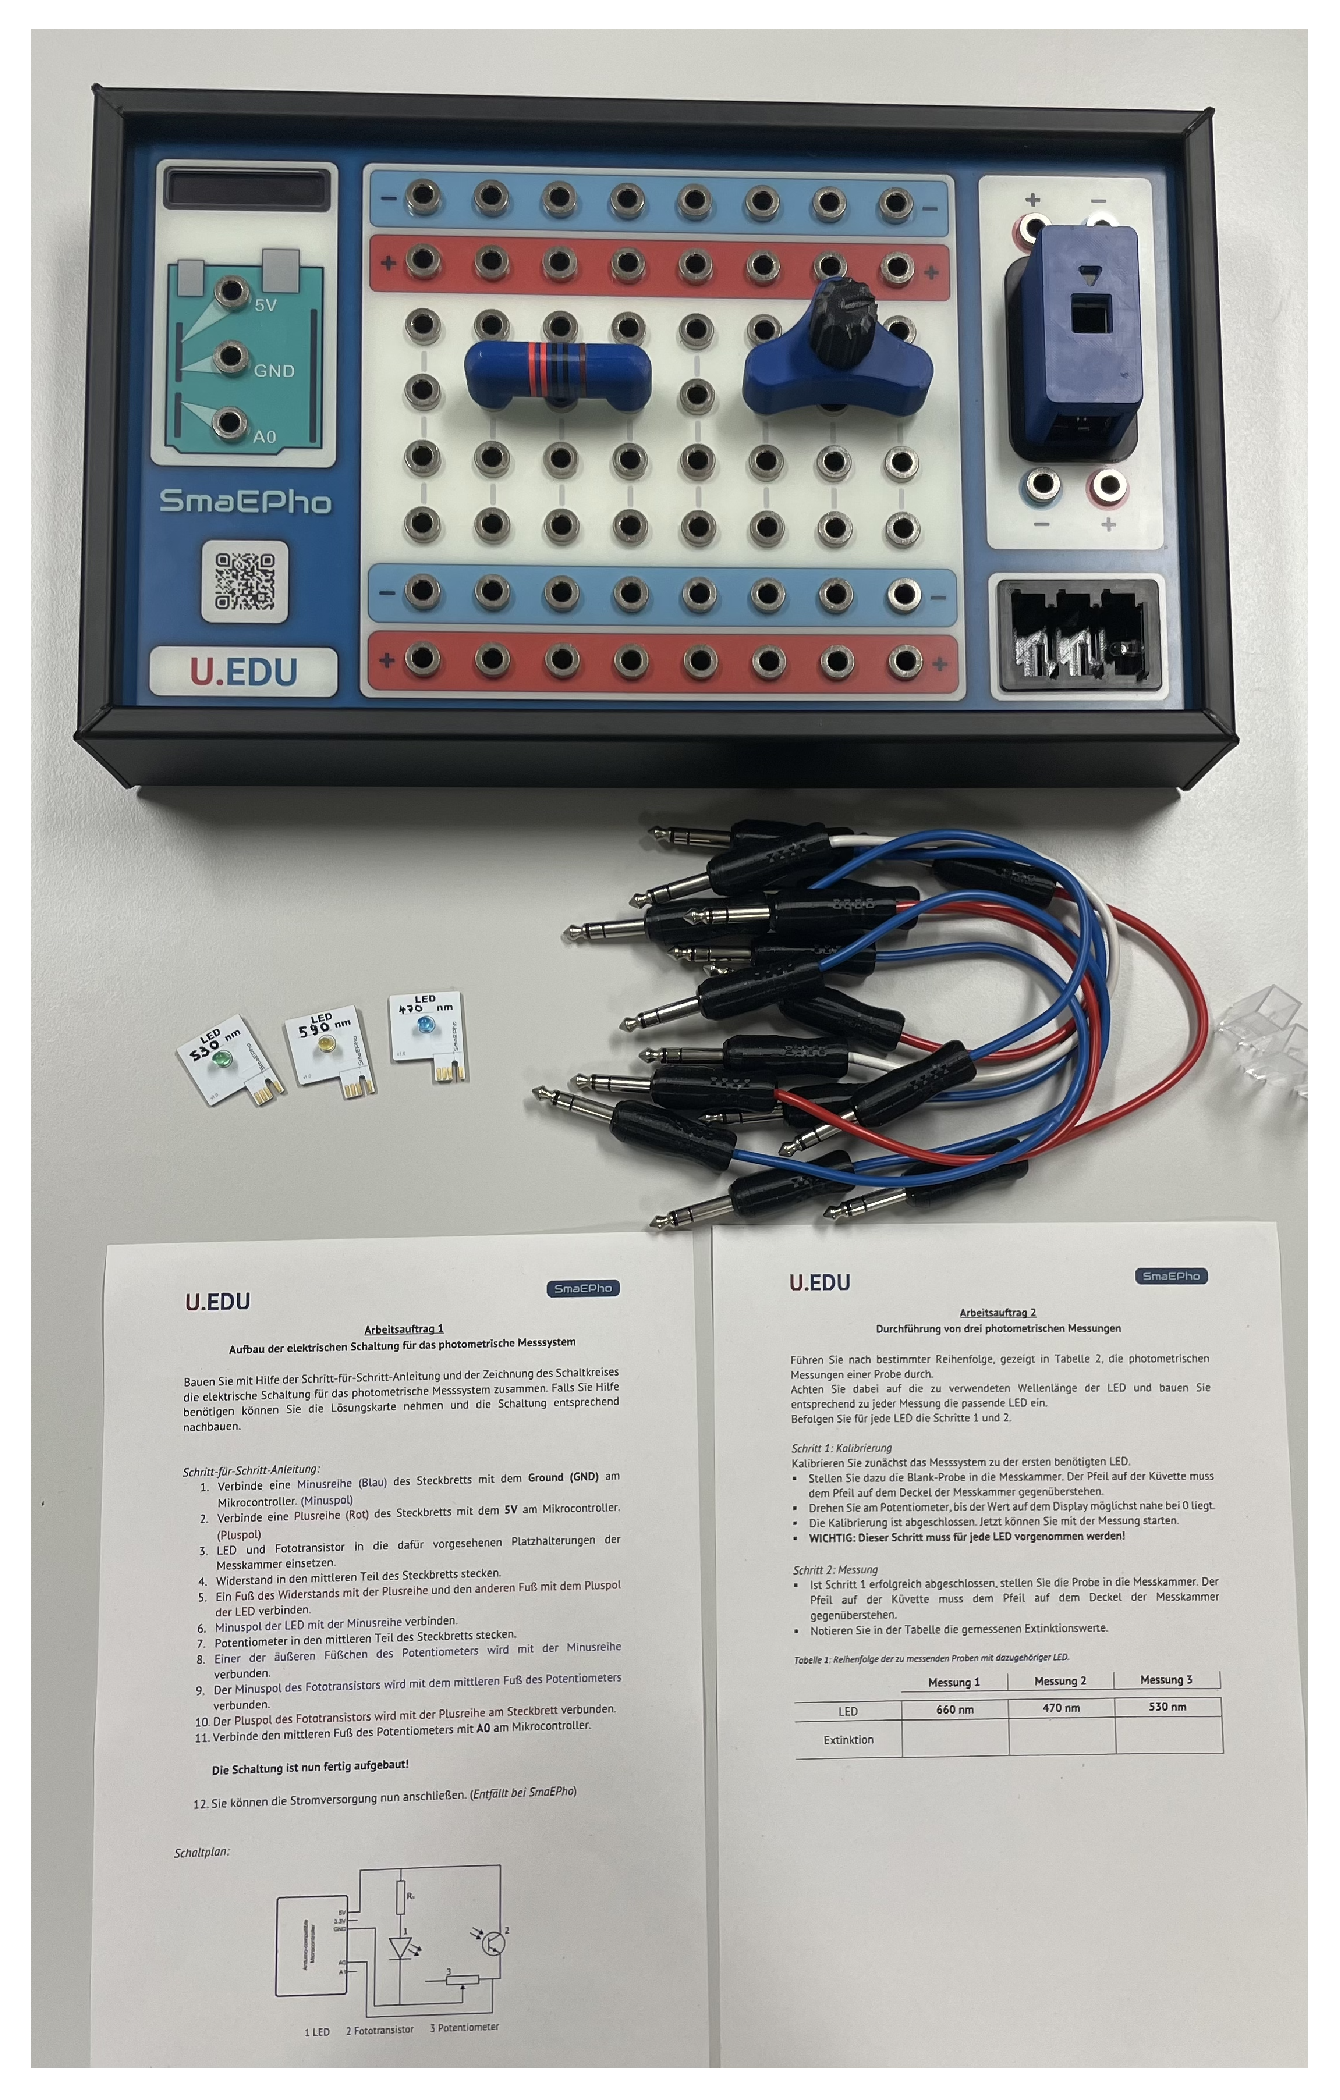
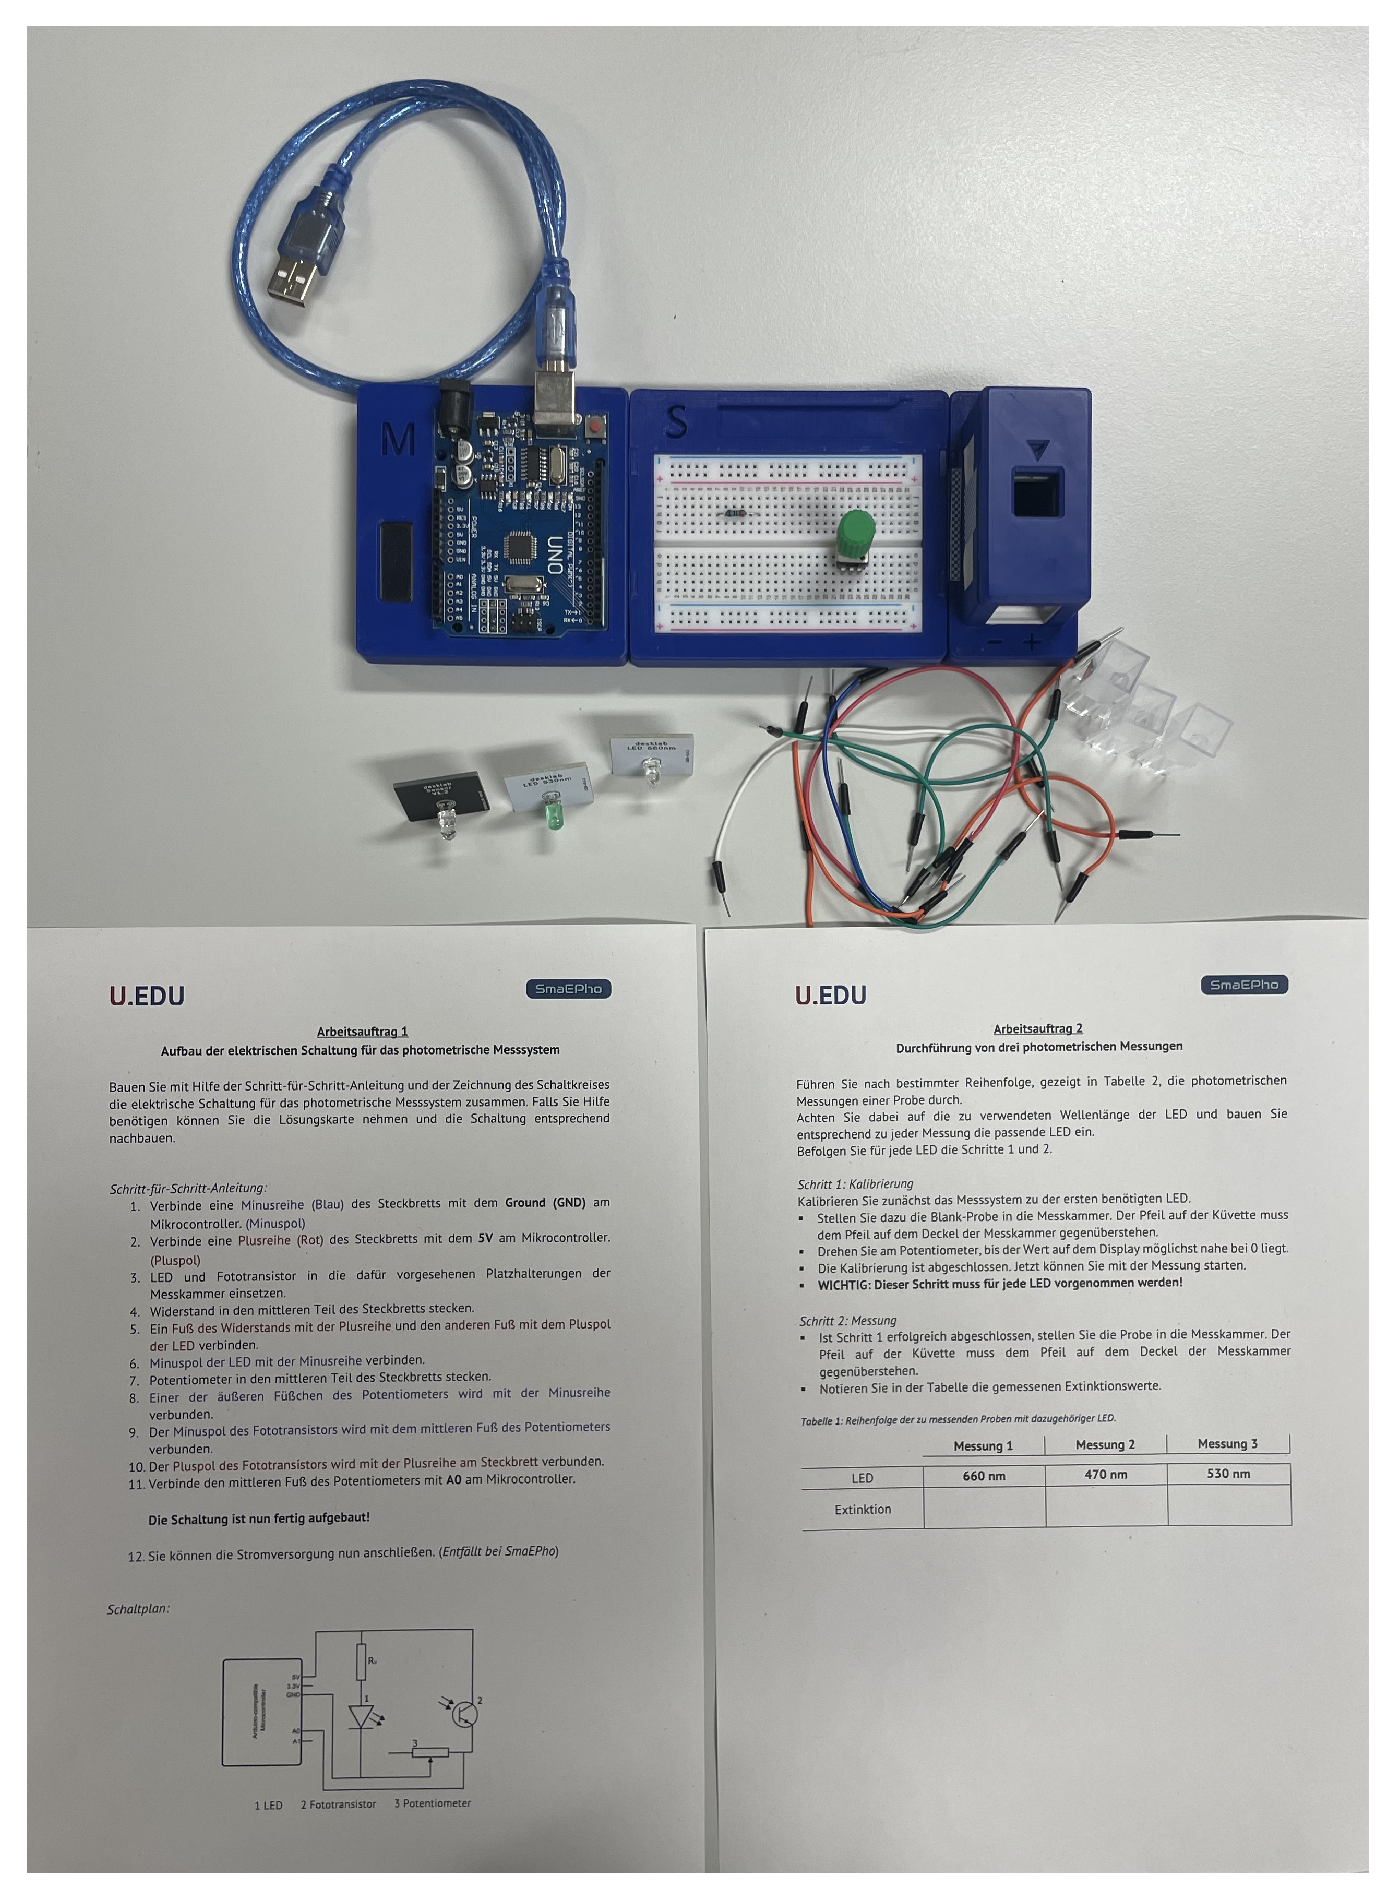
Figure 5 shows a photo of the setup for the usability evaluation of the desklab photometer. A photo of the setup for the usability evaluation of the desklab photometer can be found in
Figure 6.
In the study, two tasks had to be completed by the study participants, related to possible applications and tasks during inquiry-based learning. The set-up of the usability study was not designed to investigate the usability of the SmaEPho in the context of inquiry-based learning, focusing instead on the system itself. The generation of measurement data and the construction of different or more advanced electrical circuits for the function of the photometer or other applications are possible application examples of inquiry-based learning, and were reflected in the study tasks. The time required to complete each task was documented. First, general information about the construction of electrical circuits on a breadboard, the components of the photometric measurement systems, and the experiment were provided in an explanatory video. In the first task, the study participants had to build the circuit on the SmaEPho or desklab photometer with the help of detailed written instructions and a pictorial circuit diagram. After the circuit was successfully built, the second task was to perform three photometric measurements and record the results. The test samples were provided to the participants.
5.3.3. Instruments
To evaluate the usability of the system, the System Usability Scale by Brooke [
34] was used as a post-test after participants completed all study tasks. Participants rated their level of agreement with 10 statements about the handling and usefulness of the system on a 5-point scale. The items were translated into German (
Table 1; [
9,
34]), in which case the term “system” was defined as the synergy between the experimental task, the performance of the experimental task, and the photometric measurement system (SmaEPho or desklab photometer). To obtain the final score from 0 (worst) to 100 (best), the individual point scores (range of values: 0–4; some items inverted) were added and multiplied by a factor of
, as described by Brooke. Following the review of Bangor et al. [
44], classifications can be further defined.
5.3.4. Procedure
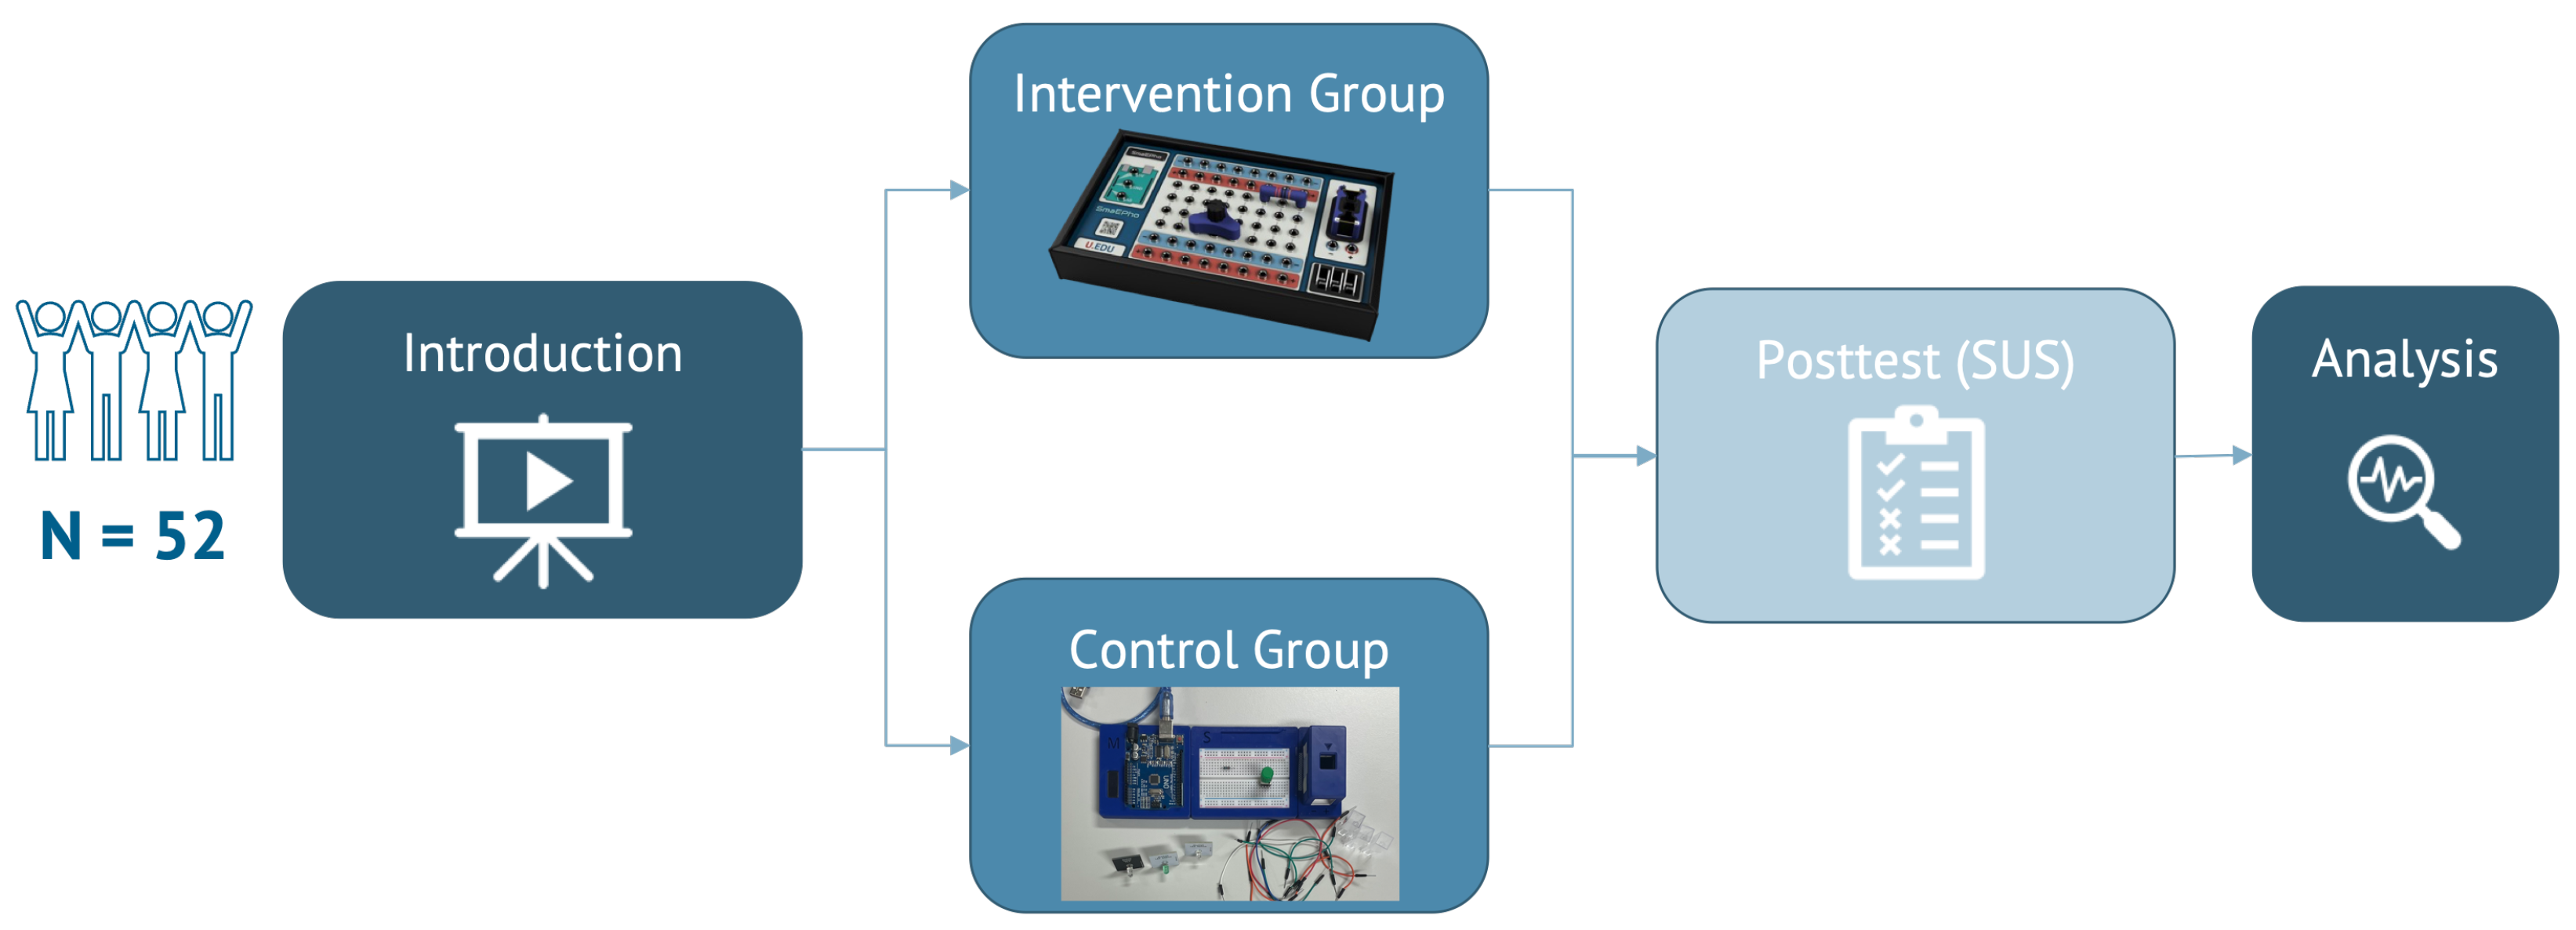
The experimental study design is shown in
Figure 7. The design includes two experimental groups, to which study participants were randomly assigned. Study participants in both groups performed the same experiments, differing in the educational technology used for this purpose. The independent variable “photometric measurement system” was manipulated in the groups and usability was evaluated regarding their dependence on this. Since the focus was an evaluation of the usability of the SmaEPho, the term experimental/intervention group (EG) refers to the group of study participants who performed the photometric measurement with the SmaEPho. The control group (CG), on the other hand, performed the study with the desklab photometer. In the study procedure, there was no pre-test on conceptual knowledge, as there was no performance test in the procedure. The knowledge needed to complete the required study tasks was presented to the participants in an introductory video.
After the welcome and an explanation of the goals of the study, the thematic introduction was provided. Both groups were first provided with an introduction containing general information on the construction of electrical circuits on a breadboard, the components of the photometric measurement systems, and the experiment in a 5-min explanatory video. The experimental tasks were identical in both groups and the participants had 20 min to complete them. In a post-test, the usability of the respective photometric measurement system was evaluated. In addition, the demographic data of the study participants were collected to describe their general profile. After that, the study was finished. An analysis of the collected data follows. The experimental tasks in the intervention phase were identically structured for both groups and divided into two parts. In the first part, participants set up one of the photometric measurement systems using identical written instructions. In the second task, students performed measurements with prepared test samples. These samples were photometrically measured in the measuring systems according to a specified pure sequence, using identical written instructions. The prescribed sequence provoked the participants to change the LEDs three times, which was individually required for the measurement. After each LED change, the measuring system had to be re-calibrated with a blank sample. Thus, the real measurement process was simulated and the usability of the measurement was evaluated.
5.3.5. Results
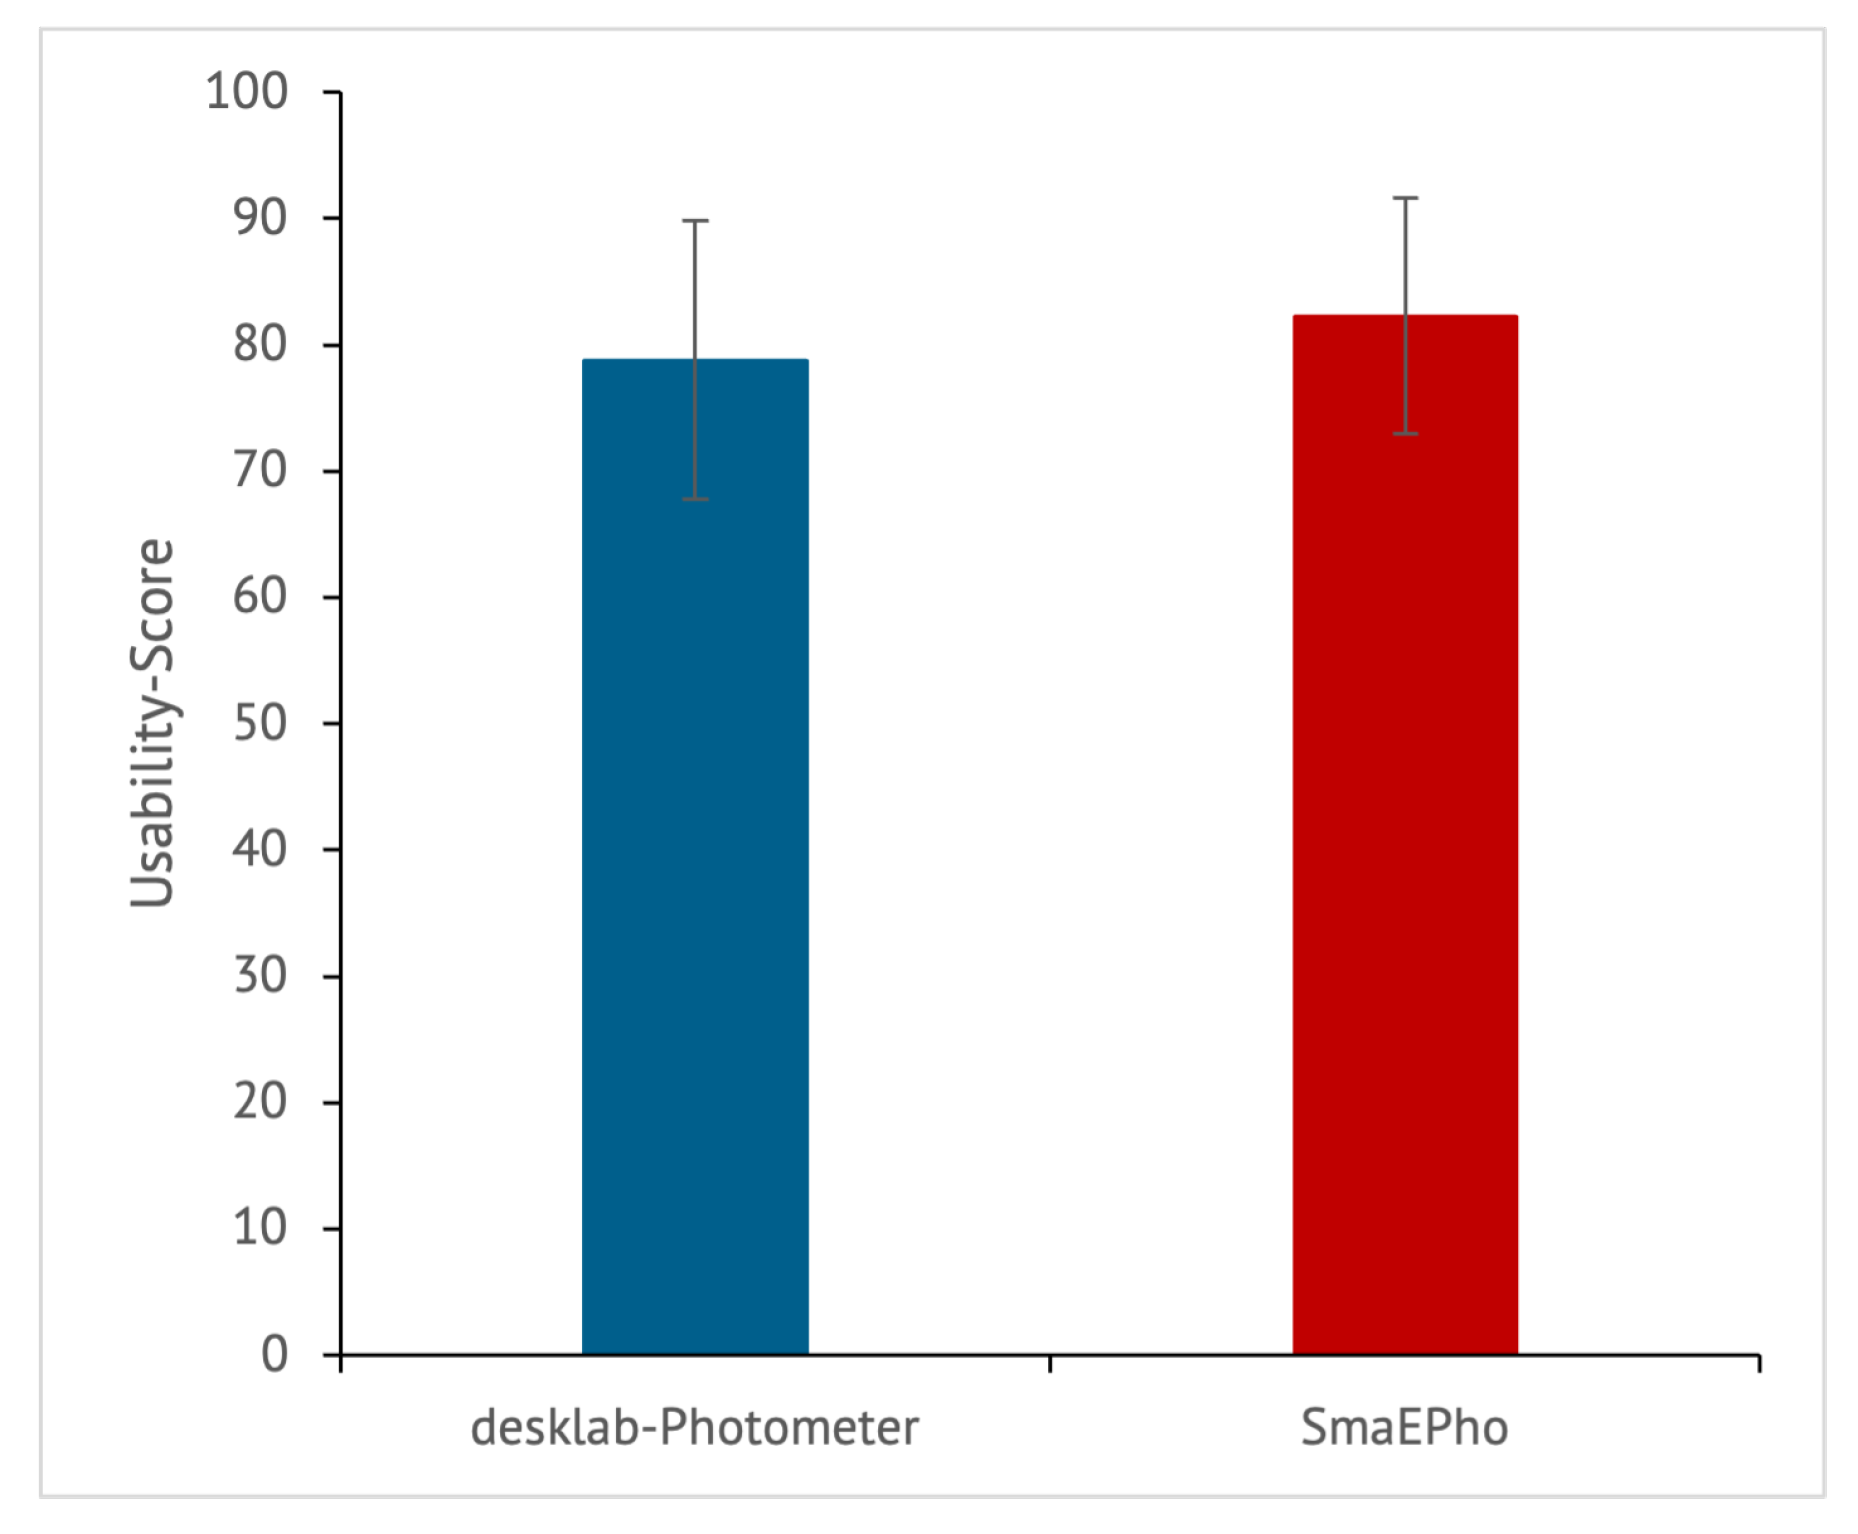
In the case of the desklab photometer, the data showed an average usability score following the scoring by Brooke [
34] of
(sd
). According to the classification by Bangor et al. [
44], this falls into the category ‘excellent‘. The internal consistency of the SUS is
(Cronbach’s alpha [
47]).
In comparison, the average usability score for the SmaEPho, following the scoring by Brooke [
34], is
, with a standard deviation of
(sd
) and falls into the category ‘excellent‘ following the classification by Bangor et al. [
44]. The internal consistency of the SUS, in this case, is
(Cronbach’s alpha [
47]). The results are shown in
Figure 8.
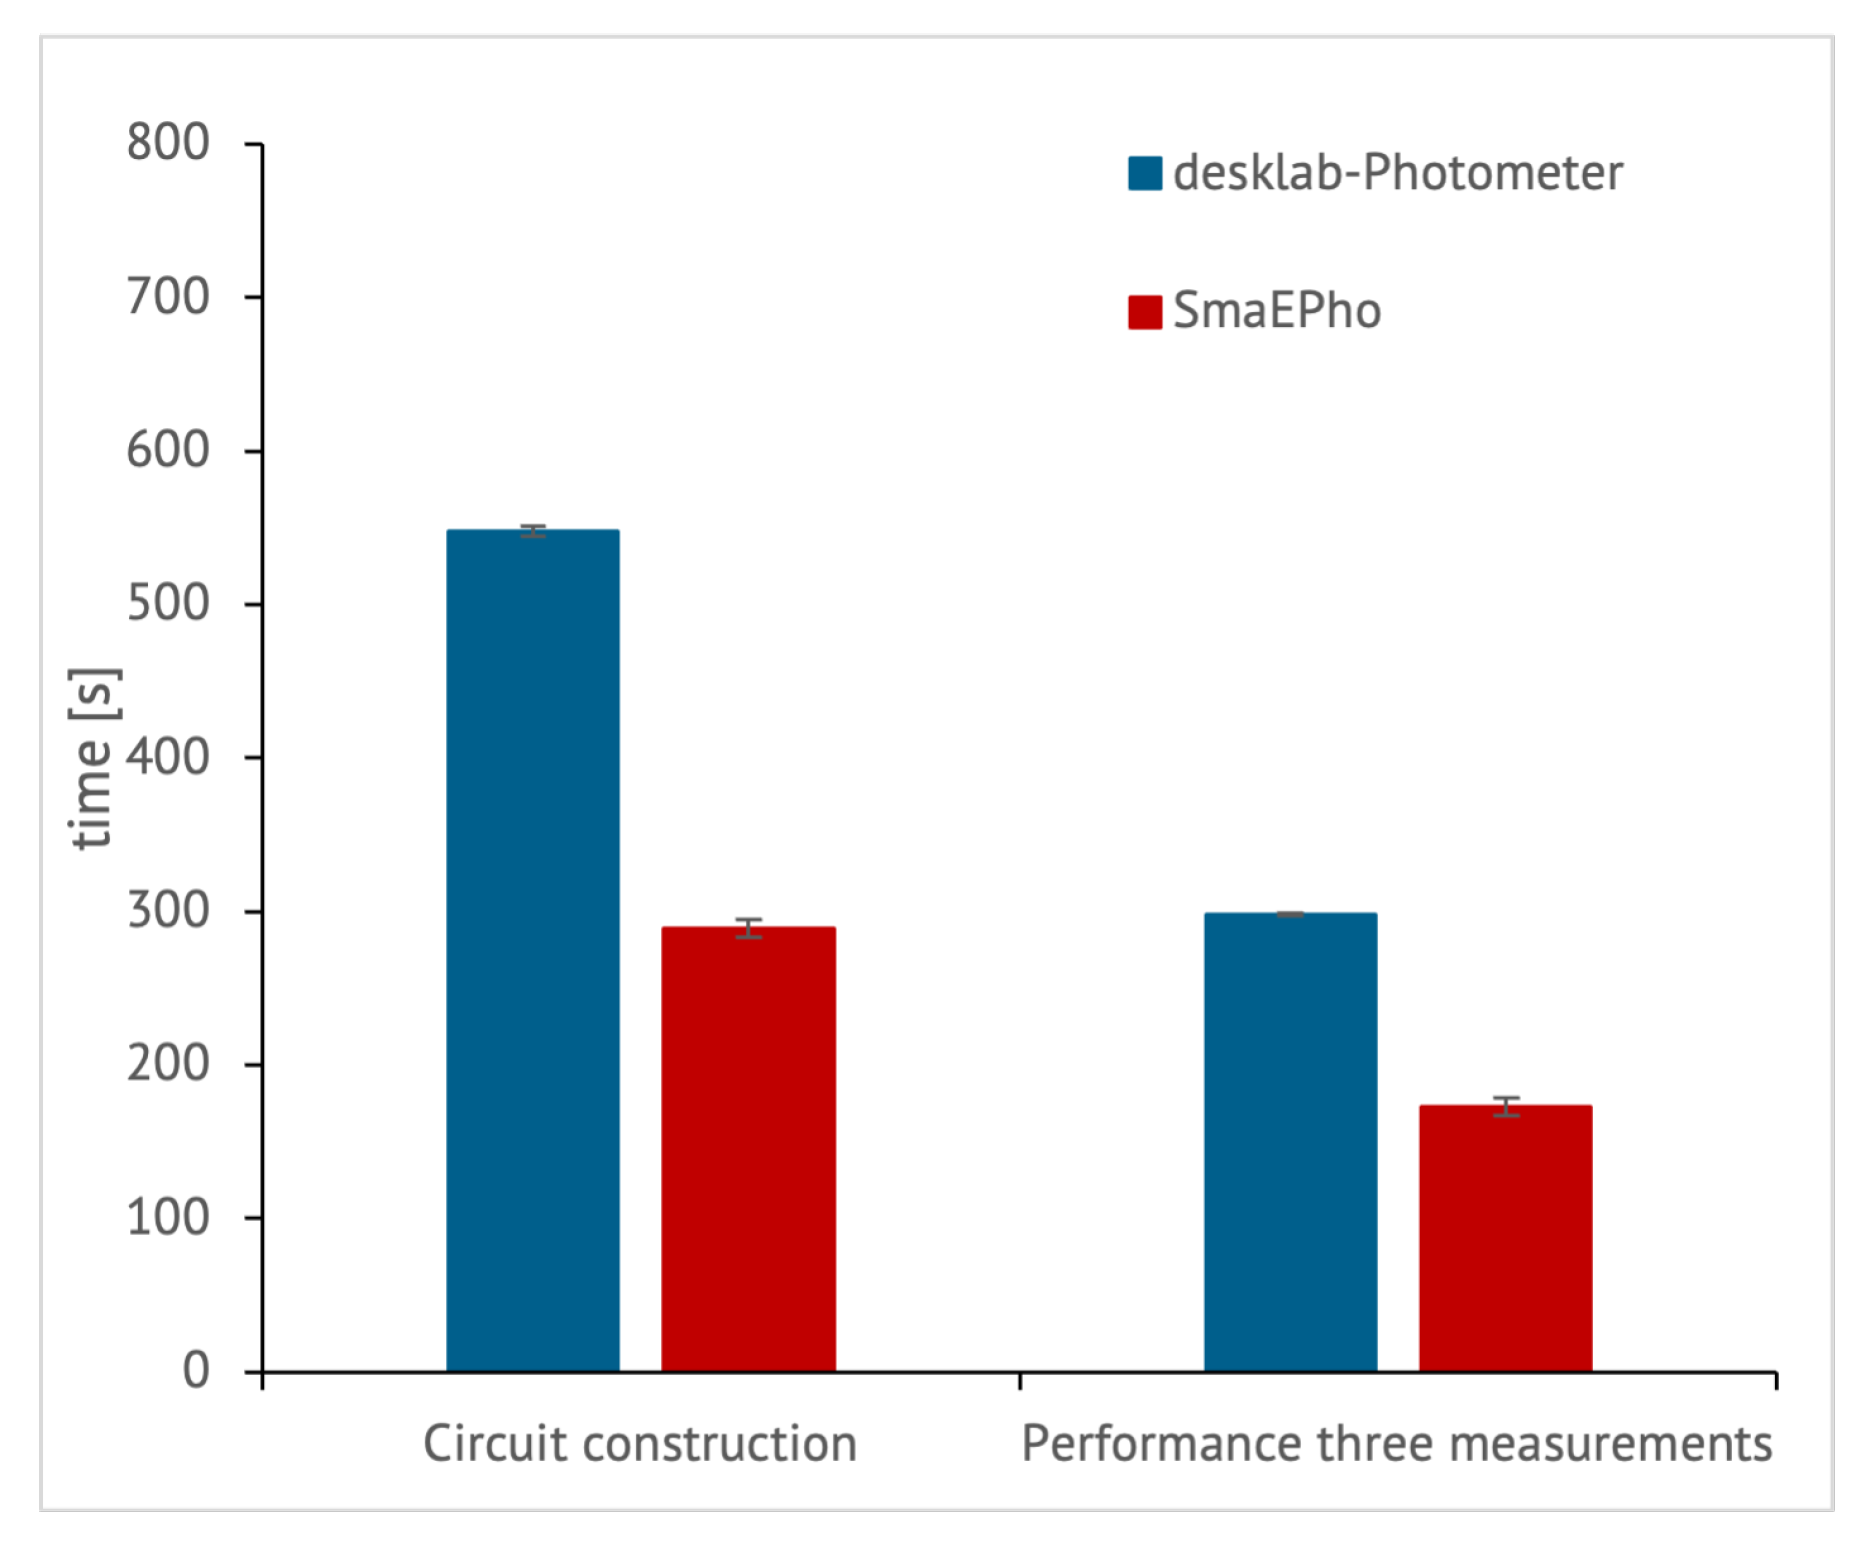
In
Figure 9 the time required to set up the circuit and perform three photometric measurements with the desklab photometer (blue) and the SmaEPho (red) is shown for comparison. Building the electrical circuit took the participants an average of 4
19
less with the SmaEPho (SmaEPho average time 4
49
(sd
); desklab photometer average time was 9
8
(sd
)). In addition, the three photometric measurements were performed at an average of 2
53
(sd
) with the SmaEPho and 4
58
(sd
) with the desklab photometer. Accordingly, the time needed to perform the measurements was 2
5
less with the SmaEPho.
6. Discussion
The evaluation of the hardware platform showed that the measurement accuracy is sufficient to carry out basic photometric measurements that are suitable for the school context. With the accuracy of the measured values, measurements in the school context can be optimally mapped, for example, to determine the concentration of the photopigment chlorophyll.
In a first usability study, the two hypotheses “
The SmaEPho achieves a comparable usability to the desklab photometer that is already established in the classroom” and “
The time required to set up the circuit and perform a photometric measurement is lower with the SmaEPho than with the desklab photometer” were investigated. Both hypotheses could be verified with the data from the usability study. The smaller sample of N = 52 participants does not have a substantial limiting influence on the significance of the usability results, as argued by Nielsen [
42], and counts as an acceptable evaluation aspect in the development process of the educational technology SmaEPho. Regarding the discussion of latency between the sensor and digital twin, it was decided that this would not be pursued further. Latency does not affect the digital twin on an external screen as much as it affects augmented-reality applications.
Both systems achieved a high usability scale score with the classification ‘excellent‘ [
44]. In comparison, the SmaEPho was about five scale points ahead of the desklab photometer. The usability of the SmaEPho is, thus, not necessarily higher but comparable to that of the desklab photometer. The difference is very small and, due to the high standard deviations, the differences are not statistically significantly distinguishable. With regard to the research question and hypotheses, it can be said that the usability of the two measuring devices does not differ and, accordingly, the redesign of the hardware of the SmaEPhos does not have a significant negative influence on usability. Furthermore, it should be noted that the study specifically focused on the evaluation of usability and no full comparison, including of statistical tests, was conducted. The high usability of the SmaEPhos lays the cornerstone for further research, e.g., in terms of cognitive load and learning gains achieved with the SmaEPho. The analysis of the internal consistency of the scales showed acceptable consistency, with Cronbach’s alpha values of around
for the system usability scale. According to the literature, consistency values below
are considered unacceptable, while values above
are considered acceptable [
48].
Our research objective included the study of the correlation between the time required to build the circuit and the time required to perform a photometric measurement. Based on the design changes made in the development of the SmaEPho, it was possible to hypothesize that the time required to set up the circuit and perform a photometric measurement would be less with the SmaEPho than with the desklab photometer. The data on time recording for the two experimental tasks confirm this hypothesis, with significant results. On average, the study participants needed about 40% less time ( 4 ) to set up the circuit with the SmaEPho and to set up the photometer. In addition, the time required to perform three photometric measurements was reduced by about half ( 2 ) compared to the desklab photometer. This time-saving can probably be explained by the effects of the structural changes in the breadboard due to the intelligent technology in the SmaEPho. The enlargement of the cables and the board, the reduction in the plug-in options, and the removal of the necessity of wiring the plus/minus contact of the LED at each change significantly contributed to the reduction in the time required. The faster set-up and measurement time determined with the SmaEPho are particularly suitable for explaining the principle to the students and making faulty circuits quickly understandable. In addition, the positive effects of the time savings can be seen, for example, in the creation of interpolation points in an absorption curve, where frequent changes in the LED are required. When creating a calibration series that requires several successive measurements of standard samples at one wavelength, the time difference might not be noticeable. Whether the high usability and the time savings contribute to a reduction in the cognitive load and a learning gain has yet to be shown by further investigations.
Future Investigations
Further studies are planned to investigate teaching–learning effects caused by the additional representation by the digital twin and the SmaEPho. For this purpose, the following hypothesis/research question will be considered: “How far does the learning effectiveness change with the additional presentation of the circuit on the SmaEPho by the digital twin in plenary compared to no additional presentation with only written instructions on the circuit design”.
Further open research topics arise, e.g., regarding the extension of the digital twin with interactivity and its possible integration in distance learning environments. The main goal of all further research questions relates to ‘understanding learning’. To this end, several further developments are currently planned regarding to the development of an intelligent digital twin of the SmaEPho. The data from the log files provide a possible approach to the construction of an AI-supported learning application in the digital twin, e.g., a feedback-based scaffolding framework. Analysis of the data may also be of interest to teachers regarding individualized assessments and evaluation. Based on the data on the handling of the SmaEPho, it may be possible to assess students individually or reflect on different didactic teaching concepts with the SmaEPho and digital twin in a data-based way. Furthermore, a link with AR/VR environments is conceivable and of research interest.
Furthermore, an automated digital analysis of the measured values in a data file of a spreadsheet program is planned. In the digital twin, a representation of the measured values in the diagram should be directly possible and can be further evaluated by the students. These further developments are underpinned by future studies with students.
The research project is integrated into an overall project “U.EDU” (Funding number: 01JA1916), with a focus on the development of digitization topics. This enables extensive linkage to other research areas, as well as the enlargement of the research spectrum. The interdisciplinarity in the project opens up many possible SmaEPhos applications in diverse research projects of different disciplines and research interests. For example, the SmaEPho can also be used in university teaching in physical internships, especially in medical training, teacher training, and in all scientific training areas.


