Article

Perceived Stress and Perceived Lack of Control of Student Teachers in Field Practice Placements in Schools during the COVID-19 Pandemic: Validity of the PSS-10 Adapted to the Field Practice Context

Department of Applied Research in Education and Social Science, UCL University College [UCL Erhvervsakademi og Professionshøjskole], Niels Bohrs Allé 1, 5230 Odense, Denmark
Educ. Sci. 2023, 13(10), 983; https://doi.org/10.3390/educsci13100983
Submission received: 13 July 2023 / Revised: 30 August 2023 / Accepted: 31 August 2023 / Published: 26 September 2023
(This article belongs to the Section Education and Psychology)

Abstract

:
Field practice placements contribute substantially to students’ gradual attainment and final mastery of the skills of the teaching profession. The aim of this study was to adapt the Danish consensus translation of the PSS-10 to assess perceived stress during field practice placements of varying durations and to investigate its validity for use with student teachers in field practice during the COVID-19 pandemic. Data were collected upon completion of 6 weeks of a field placement at one of three levels (N = 359), and grades from the field practice exam were obtained. To resolve any issues with differential item functioning and lack of item independence, graphical loglinear Rasch models were used. Criterion validity was investigated in relation to the level of field practice and subsequent grades. The results showed that items 10 and 4 had to be eliminated; both subscales had locally dependent items, and one item in the perceived lack of control subscale functioned differentially relative to the level of field practice placement. Criteria expectations were confirmed, though not all were significant. The psychometric properties of the adapted PSS-10 were in line with previous findings on the original PSS-10 subscales. Score levels can be used as benchmarks in post-COVID-19 studies of student teachers’ field-practice-related perceived stress.

1. Introduction

Stress among higher education students in general is well documented and appears to be a global phenomenon (e.g., the review by [1]). Students in higher professional education, such as the teaching, nursing, and medical professions, also have the added demands of engaging in their profession, before they are proficient in its core skills, as part of the education program. Field practice placement (in some professions denoted as workplace-based learning or clinical field practice) is an essential part of higher professional education programs within the health, social, and educational professions, as this provides opportunities to learn the profession’s core and critical skills in the professional work environment. Commonly, professional education programs include several field practice placements, where core skills and profession-specific reasoning of increasing complexity are practiced and learned through increasing involvement and enactment through the program and placements, thus progressing students toward proficiency in the profession upon graduation. In the field placements, students are often part of staff or undertake parts of staff functions to practice their professional skills while learning them; thus, students’ identity is split between being a student and a professional—a duality that is not at play on campus. The field placement learning environment is thus relatively psychologically unsafe and high risk (in comparison to the campus environment), as “failure” can extend to other people beyond the profession—for example, patients and their relatives in the health professions, and children and their parents in the education professions. The personal psychological risk also differs in the professional learning environment compared to the campus environment, as students face increased communicative, emotional, and psychological demands while learning. The students expose more of their person and, thus, to a higher degree “put themselves on the line” in learning while practicing the professional core skills compared to the campus environment.
This complexity of the higher professional education learning environment means that students completing the field practice placement parts of professional education programs are engaging in the profession’s core activities to learn them while not yet being proficient in these skills. Students are expected not only to engage in the profession but also to be successful to varying degrees, as there can otherwise be consequences for other people involved, as well as personal consequences beyond the typical educational arena. This sets higher professional education apart from higher education programs without field practice placements, and it can potentially lead to increased stress and experiences of lack of control by students in field practice placements.

1.1. Environmental and Perceived Stress in Field Practice Placements

Research on stress in field practice placements in higher professional education has mainly been focused on identifying specific stressors, following the environmental view of stress as a consequence of certain life events (e.g., [2]), or in this case, professional events, thus operationalizing and measuring stress through predefined field practice event scales. For example, a review by Pulido-Martos, Augusto-Landa, and Lopez-Zafra [3] on stressors in nursing education identified both the academic demands (e.g., reviews and workload) and the clinical workplace demands (e.g., fear of unknown situations and mistakes with patients or equipment) as stressors. Focusing specifically on stressors in the clinical placements of nursing students in the Jordanian and Taiwanese contexts, Al-Zayyat and Al-Gamal [4] and Wu, Rong, and Huang [5] both found that the most frequently reported stressors were related to taking care of patients, teachers and nursing staff, workloads, and assignments. Turning to the teaching profession’s education, Gardner’s [6] review found that while previous research has also identified teachers’ stressors, less attention has been given to the study of stressors among student teachers. However, Chaplain’s [7] UK study identified behavior management, workload, and lack of support in field practice placements as significant stressors for secondary school student teachers and that as many as 38% of the student teachers reported that their placement experience had been very or extremely stressful.
A smaller number of studies on field-practice-related stress instead draw on Lazarus’s idea that external environmental stressors (e.g., life events) are not objectively stressful, but only if they are perceived as threatening and there are insufficient coping resources, and that this perception invariably varies across individuals [8,9]. Thus, these studies operationalize and measure stress as the psychological experience of stress and lack of coping during a specified period of time, but without attaching this to specific events or factors in the learning environment (i.e., perceived stress). For example, Ngui and Lay [10,11] found that field-practice-related perceived stress among student teachers was predicted by self-efficacy and subjective wellbeing. Geng, Midford, and Buckworth [12] found that the practicum-related perceived stress levels were significantly correlated with the time spent by student teachers on planning for teaching, so the more hours spent on planning, the less stress. Petko et al. [13] reported that the different uses of weblogs in student teachers’ field practice did not affect their perceived stress levels.

1.2. Changes and Development in Student Teachers’ Perceived Stress Related to Field Practice Placements

The perceived stress of student teachers has been compared at various levels of their teacher education program; for example, Geng and Midford [14] found that first-year students had significantly higher perceived stress levels than other years’ education students. However, the study was not focused on field practice. Also, not focused on field-practice-related stress, Martinez et al. [15] found that first-year male student teachers experienced less perceived lack of control than did their second-year counterparts, while there was no significant difference for female student teachers. With regard to perceived stress, their results were more complex, as perceived stress depended both on the interaction between degree year and gender and the interaction between degree year and basis of admission.
Focusing more directly on field practice, Klassen and Durksen [16] found that student teachers had significantly decreasing experiences of perceived stress during their last field placement in the teacher education program. However, they used a single-item indicator of perceived stress “How stressful was your practicum this week?” with anchors only at response categories 1, 6, and 11, with 11 indicating extreme stress, and not a stress scale as such. Hopkins et al. [17] found a statistically significant increase in perceived stress during the culminating field experience for student teachers in a pilot professional training school program.

1.3. Perceived Stress in Student Teachers’ Field Practice Placements and Outcomes

Previous studies have shown student teachers experiencing stress specifically associated with their field practice, and this field practice-related stress has been associated with, for example, teaching performance [18], performance assessments during placement [14], occupational commitment [19], and additional mental issues such as emotional exhaustion [20].

1.4. The Measurement of Perceived Stress in Teacher Education Field Practice Placements

While a number of different measures of perceived stress have been used in the previously mentioned research, a significant number of the identified quantitative studies of student teachers’ perceived stress as related to field practice appear to have utilized the 10-item version of the perceived stress scale (PSS-10; [21]), for example, Geng and Midford [14] and Ngui and Lay [10]. The PSS-10 has also been utilized in numerous studies on the perceived stress of student teachers in relation to the campus or university parts of their education (e.g., [15,22]).
In the Danish teacher education context, no studies have been conducted on student teacher stress in relation to field practice. However, the PSS-10 [21] was available in a Danish consensus translation [23], and this has been previously validated in the Danish higher education context with samples of psychology and technical university students [24]. Thus, the PSS-10 was chosen as a starting point for measuring perceived stress during field practice placement.

1.5. The Current Study

The aim of this study was to conduct a first investigation of the psychometric properties and the criterion validity of the PSS-10 in a version aimed at just-completed field practice placements within the primary school teacher education in Denmark (BA Ed), which includes 30 ECTS (European Credit Transfer System) worth of field practice. Based on the well-known impact of both local response dependence between items and differential item functioning (DIF) on the psychometric properties of a scale (e.g., inflated estimates of reliability and biased estimates of the person parameters; [25,26]), investigations of these issues were emphasized for both subscales of the PSS-10 and item response theory methods, which can take both into account, were employed.
The investigation of the psychometric properties was conducted to provide elaborate answers to three research questions:
RQ1: Are the items within each of the Perceived Stress and Perceived Lack of Control in Field Practice subscales conditionally independent given the score (i.e., free of local response dependency)?
RQ2: Are the Perceived Stress and Perceived Lack of Control in Field Practice subscales measurement invariant and free of DIF across student subgroups defined by the level of field practice placement, the campus they are enrolled at, whether they are enrolled in the regular BA Ed program or variations of this, or their gender and age?
RQ3: Are the Perceived Stress and Perceived Lack of Control in Field Practice subscales well-targeted for the study population of Danish student teachers?
Based on previous research, criterion validity was investigated through three hypotheses:
Crit1: Perceived stress and perceived lack of control in field practice scores will be positively correlated (c.f. previous validity studies on the PSS-10).
Crit2: With regard to the relationship between the level of field practice (progression in complexity of skills objectives) and students’ perceived stress and perceived lack of control in field practice, there was no clear guidance from previous research, and thus it was expected from a common sense perspective that with increasing levels of field practice (timewise later and growing complexity), perceived stress would increase, while perceived lack of control would decrease as familiarity with the field practice context would grow.
Crit3: Increased levels of perceived stress and perceived lack of control in field practice will be associated with lower grades on the field practice exam.

2. Materials and Methods

2.1. Participants and Data Collection

The target population was Danish teacher students who had just completed a field practice placement as part of their four-year-long teacher education program at one Danish University College. The Danish teacher education program includes field practice placements at three levels with common learning objectives across university colleges (see Supplemental File S2). These three levels can be covered through a varied number of field practice placements of differing lengths. At the university college in question, the field practice placements are placed within the first, third, and fourth years of study, in the spring or in the fall semester, and each are six weeks long. Data were collected using a targeted online survey starting immediately after the end of the fall field practice placements in 2020 and 2021 (i.e., in December 2020 and December 2021). Despite the COVID-19 pandemic, the circumstances of the field practice placements did not differ from the usual modus in significant ways, except for very few students who contracted COVID-19 and worked from home for the period of quarantine. Only 16 (4.5%) of the participating students completed their field practice under special circumstances, due to COVID-19—all of whom had completed level 1 field practice in 2020. For these students, 2–3 weeks of virtual field practice, where they were either teaching online or otherwise engaging in the school activities from home due to lockdown of the primary schools, was arranged.
The data collection resulted in a data sample of 359 teacher students at different stages of the teacher education program; 56 had just completed their level I field practice placement, 151 their level II field practice placement, and 152 their level III field practice placement (Table 1). The students were enrolled in the regular Bachelor of Education program (83.6%) or more specialized versions of the program (i.e., trainee program, STEM program, and so on), and they were enrolled at two campi (65.7% versus 34.3%) of the same university college. The majority of the sample identified as female (71.9%), and the mean age of the sample was 27.2 years.

2.2. Instrument

The Danish consensus translation [23] of the 10-item Perceived Stress Scale (PSS-10; [21]) was used in a slightly adapted form. The adaptation only consisted of changing the original PSS-10 item stems of “In the last month, how often …” with “In your latest field practice placement, how often …” and was necessary as the field practice placements in the current study were six weeks, and the change can accommodate this as well as placements of varying lengths. In Danish, the consensus translation of the items starts with ”Hvor ofte indenfor den sidste måned…” [21], while in the adaptation for the current study, the items start with ”hvor ofte i din seneste praktikperiode…”. The exact wording of items and response categories in Danish can be obtained upon request from the author. The Perceived Stress (PS) and Perceived Lack of Control (PLC) subscales of the PSS-10 were accordingly renamed PSFP (Perceived Stress in Field Practice) and PLCFP (Perceived Lack of Control in Field Practice) for this study. The original five response categories from the PSS-10 were used; 0 = Never, 1 = Almost Never, 2 = Sometimes, 3 = Fairly Often, 4 = Very Often.

2.3. Item Analyses by Rasch Models

Item analyses were conducted to uncover in detail the psychometric properties and construct validity of the two subscales of the PSPS-10 within the item response theory (IRT) framework. Given the known impact of both local response dependence and DIF on the psychometric properties of a scale (e.g., inflated alpha estimates and biased estimates of the person parameters; [25,26]), emphasis was put on these two issues in the analyses. Specifically, I used the Rasch model (RM; [27]) generalized for ordinal data (effectively the Partial Credit model; [28]) and an extended version in the form of graphical loglinear Rasch models (GLLRM), which can effectively test the fit of models with DIF and LRD interaction terms included in the same manner as with the pure Rasch model [29,30,31].
The Rasch model (RM), among other IRT models, has particularly desirable properties [32]. The RM is in statistical terms a parsimonious model describing the causal effect of a latent trait variable on responses to items, and contrary to other IRT and CFA models, it does not need assumptions on the distribution of the latent variable. If a scale fits the RM, the sum score is a sufficient statistic for the person parameter estimates from the model in the sense that all necessary information is obtained with the sum score. This property is not only unique for scales fitting the RM compared to other IRT models [33], but it is also an attractive property when dealing with scales where the sum score is used for assessment, as is the case with the PSS-10 (and thus the PSSFP-10). Four of the five requirements for fit to the Rasch model are common across (unidimensional) IRT models and provide criterion-related construct validity as defined by Rosenbaum [34]. The fifth requirement of homogeneity is unique to the RM [33]:
  • Unidimensionality: The items of a scale assess one single underlying latent construct. Here, the PSFP subscale assesses one construct and the PLCFP subscale another construct.
  • Monotonicity: The expected item scores on a scale should increase with increasing values of the latent variable. Here, the probability of occurrence of any of the experiences described in the items should increase with increasing scores on the subscale.
  • Local independence of items (no local response dependence; LRD): The responses to a single item should be conditionally independent from the responses to another item of the scale given the latent variable. For example, responses to any one PSFP item should only depend on the level of perceived stress in field practice and not also on responses to the other items in the scale.
  • No differential item functioning (DIF): Items and exogenous (i.e., background variables) should be conditionally independent given the latent variable. For example, responses to any one PSFP item should only depend on the level of perceived stress in field practice and not on subgroup membership such as gender or age, etc.
  • Homogeneity: The rank order of the item parameters (i.e., the item difficulties) should be the same across all persons, regardless of their level on the latent variable. For example, the item that requires the most perceived stress in field practice to be endorsed should be the same for all students, no matter if they were not very or very stressed in their field practice, and the same for the item requiring the second-lowest perceived stress in field practice, and so on.
Previous research on the psychometric properties of the two subscales in the PSS10 has repeatedly discovered evidence of LRD and DIF, and thus they have not fitted the RM. However, if the only departures from the RM in a scale are in the form of uniform LRD and/or DIF (uniform here means at the same at all levels of the latent variable), graphical loglinear Rasch models (GLLRM; [29,30,31]) can be employed to include these departures as interaction terms in the GLLRM. Subsequently, the same tests of fit as for the RM can then be used to test fit to this more complex model. GLLRMs retain most of the desirable properties of the RM once the departures of LRD or DIF are taken into account, and the sum score remains a sufficient statistic if the score is appropriately adjusted for any DIF included in the model ([31]). While validity cannot be claimed in the strictest sense for GLLRMs with uniform LRD or DIF, as both are violations of two of Rosenbaum’s (1989) four criteria for criteria-related construct validity, essential validity and objectivity are achieved in addition to the score sufficiency [31,35].
GLLRMs can be illustrated by inserting the loglinear Rasch model in multivariate chain graph models together with background variables, as chain graph models use graphs with nodes representing variables to illustrate associations among variables. In chain graph models, missing edges or arrows between nodes denote that the variables are conditionally independent, given the remaining variables in the model, while an arrow connecting two variables may refer to a causal relationship, and undirected edges illustrate that the variables are conditionally dependent without assuming causality. Lauritzen [36] provides a comprehensive introduction to the theory of graphical models for the interested reader. As items in GLLRMs follow the same rules as other variables, items that are not connected by an edge in a GLLRM graph are conditionally independent given the latent variable (i.e., items are locally independent). Likewise, a missing arrow between an item and a background variable means that they are conditionally independent given the latent variable and the other variables in the model (i.e., there is no DIF). In addition, the causal relationship between the latent variable and items is shown by arrows between them. Lastly, associations between background variables and the latent variable are illustrated by arrows between them.

2.3.1. Strategy of Analysis

To rigorously test the fit of responses to PSFP and PLCFP items, respectively, to the RM and GLLRMs (RQ1–RQ3), the following steps were included in the analysis of each subscale. The analysis was performed as an iterative process aimed at discovering as much evidence against the model as possible. While the majority of previous research suggested that evidence of both local response dependence and DIF would be discovered, some studies have reported no such issues, and thus fit to the pure Rasch model was tested first with the following:
  • Overall test of homogeneity of item parameters across low- and high-scoring groups.
  • Overall tests of invariance relative to in relation to the level of field practice placement (level I, level II, and level III), campus (A or B), Bachelor of Education program (regular or other), gender (female or male), and median-cut age groups (25 years and younger and 26 years and older). The first category serves as the reference group.
  • Tests of no DIF for all items relative to the above background variables.
  • Tests of local independence for all item pairs.
  • Fit of the individual items to the RM.
The above steps do not need to be taken in the order presented. For example, if evidence of LRD or DIF turns up, loglinear interactions were added to the model and the steps were repeated until no further evidence against the model was disclosed. After resolving the final model for each of the subscales, the additional steps below conclude the analysis:
  • Assessment of person parameters estimates standard error and bias of measurement.
  • Evaluation of targeting and reliability relative to the current study population.

2.3.2. Statistics

Fit of the individual items to the RM or GLLRM was tested by comparing the observed item/rest score correlations with the expected item/rest score correlations under the model [30]. The overall tests of fit to the RM (i.e., tests of global homogeneity by comparison of item parameters in low- and high-scoring groups, and global tests of invariance) were conducted using the Andersen conditional likelihood ratio test (CLR; [37]). The local independence of items and absence of DIF were tested using Kelderman’s [38] likelihood ratio test, and if evidence against no DIF or local independence of items was discovered, the magnitude of the local dependence and/or DIF was supplied by partial Goodman–Kruskal gamma coefficients conditional on the rest scores [30].
Conditional independence of items given the score was not expected (c.f. the previous research on the PSS-10 described in the Section 1), and thus reliability was calculated using Hamon and Mesbah’s [39] Monte Carlo method, which takes into account any local response dependence between items. Targeting of the resulting theta scales (i.e., the estimated person parameters under the model) was assessed with two indices [40]: the test information target index (the mean test information divided by the maximum test information) and the root mean squared error target index (the minimum standard error of measurement divided by the mean standard error of measurement). Both indices should have a value close to one. In addition, item maps, showing the distribution of the item threshold locations against weighted maximum likelihood estimates of the person parameter locations as well as the person parameters for the population (assuming a normal distribution) and the information function, were plotted for a visual inspection of targeting. The target of the observed scores and the standard error of measurement of the observed scores were also calculated.
All the statistical tests used tested whether the item response data complied with the expectations of the RM or the GLLRM in question, and the results were all evaluated in the same manner for both the RM and the GLLRM. Thus, significant p-values signify evidence against the model. P-values were evaluated as a continuous measure of evidence against the null hypothesis, distinguishing between weak (p < 0.05), moderate (p < 0.01), and strong (p < 0.001) evidence against the model, as recommended by Cox and colleagues [41], rather than applying a deterministic critical limit of 5%. Furthermore, the Benjamini–Hochberg [42] procedure was applied, when appropriate, to adjust for the false discovery rate (FDR) due to multiple testing to reduce false evidence against the model created by the multiple tests conducted (i.e., reduce type I errors).

2.4. Criterion Validity

To investigate if the students’ perceived stress and perceived lack of control in field practice scores were positively correlated, as expected (Crit1), Pearsons’ r was used. To investigate whether the relationships between the level (i.e., complexity) of the field practice placement and perceived stress and perceived lack of control were as expected (Crit2), mean scores for each scale were compared for students in the different placement levels. To check whether any of the included background variables (i.e., gender, age, campus, and type of teacher education program) influenced these relationships and affected the primary relationship, analyses of variance were conducted using general linear models to allow for both discrete and continuous independent variables. In each analysis, a backwards model search strategy starting from a model with main effects and all two-way interactions included was employed, while adhering to the hierarchical principle for the exclusion of model terms [43]. To investigate whether the teacher students’ perceived stress and perceived lack of control in their just-finished field practice placement were negatively related to their obtained grades in the field practice exam, as expected (Crit3), the PSFP and the PLCFP scores were each categorized into low and high scores using the median as the cut-point, and the mean grades in each group were compared using student’s t-test. The same categorization was used across all students, as there was no significant difference in the distribution of PSP and PLCP scores dependent on the level of the field practice placement they had just completed. For the PSP subscale, the categorization was: 0–7 = low perceived stress in field practice and 8–20 = high perceived stress in field practice. For the PLCP subscale, the categorization was: 0–3 = low perceived lack of control in field practice and 4–8 = high perceived lack of control in field practice. As 12 of the students did not complete the exam due to illness or other reasons, the sample was reduced to 347 for this specific analysis.

2.5. Software

All item analyses were conducted using the Digram software package [44,45,46]. Item maps were produced in R, and the criterion validity analyses were performed using SPSS version 26.

3. Results

3.1. Item Analyses by Rasch Models

As expected, neither the Perceived Stress (PSFP) nor the Perceived Lack of Control (PLCFP) subscales fitted the Rasch model (RM) (Table 2, RM columns).
In the case of the PSFP subscale, there was strong evidence against global homogeneity and invariance of the entire item set across levels of field practice (Table 2, PSFP RM column) as well as strong evidence against the fit of item 10 to the RM (Table 3, PSFP RM column). As fit of the data to any GLLRM could not be achieved with item 10 included in the scale, item 10 was consequently eliminated. The reduced five-item PSFP subscale fitted a GLLRM (Table 2, PSFP GLLRM column), with all items involved in local response dependence (Figure S1 and Table S1 in Supplemental File S1).
For the PLCFP subscale, there was also strong evidence against global homogeneity but no evidence against the fit of single items to the RM (Table 2 and Table 3, PLCFP RM columns). As the analysis did not reveal the source of the misfit, previous studies were consulted to see if they could provide any suggestions as to which item to eliminate. The most comparable study was a recent Spanish study using comparable methods to investigate the psychometric properties of the PSS-10, where item 4 was eliminated from the PLC subscale, resulting in a fit to a GLLRM [15]. Thus, in the present study, item 4 was also chosen for elimination. This resulted in a three-item PLCFP subscale that fitted a GLLRM with strong evidence of local response dependence between items 5 and 8, as well as DIF for item 5 relative to the level of field practice placement (Figure 1, Table 2 and Table 3 PLCFP GLLRM columns, and Table S1 in Supplemental File S1).

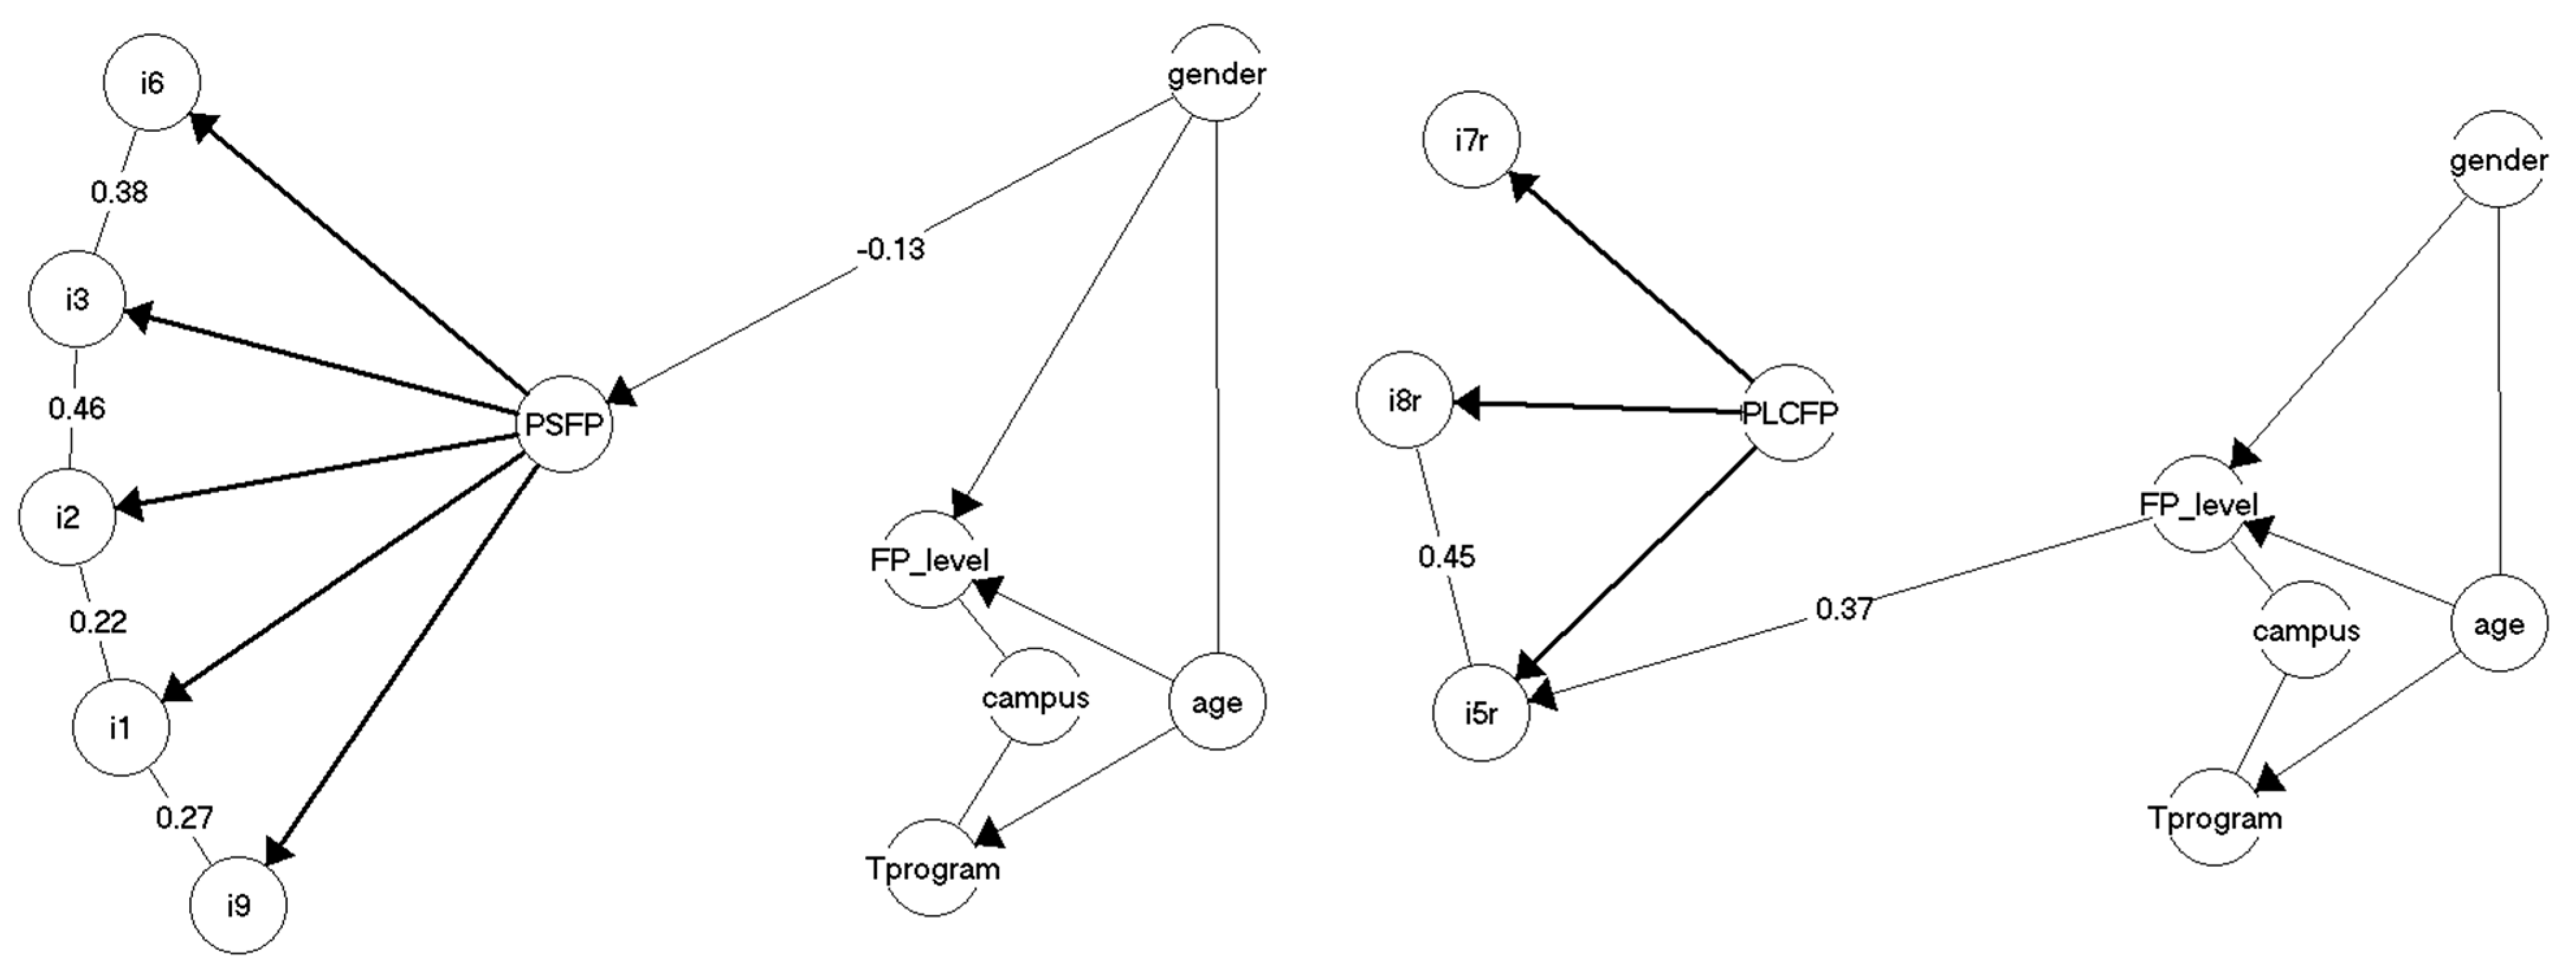
3.1.1. Local Response Dependence and Differential Item Functioning

In order to ensure that the local response dependence and DIF interaction terms included in the two subscale GLLRMs were warranted, confirmatory tests for both were conducted.
Table S1 in Supplemental File S1 contains the results of these tests as well as the strength of the local response dependence and the DIF in the form of gamma correlation coefficients. The evidence for local dependency of items was very strong in all cases, and all correlations were medium strong to very strong. The evidence of DIF for item 5 in the PLCFP subscale was also strong and showed a systematic increasing risk of students endorsing that “things did not go as they wanted” during their latest field practice placement with increasing level of the field practice placement, no matter their level of perceived lack of control in the field practice.
In order to evaluate the impact of the DIF for item 5 in the PLCFP subscale, DIF-equated scores were computed (Table S2 in Supplemental File S1). This showed the impact of DIF to be substantial at the individual level, as adjustments were as high as 0.75 points on the score. In terms of bias in group comparisons, failure to adjust for the DIF would introduce almost ½ of a point’s bias on the mean scores for two groups when comparing mean perceived lack of control scores across levels of field practice placements (Table S3 in Supplemental File S1). Thus, the groups of students in level II and III field practice placements would wrongfully be found to have mean perceived lack of control scores that were almost ½ a point to high compared to students in level I field practice if the DIF was not resolved.

3.1.2. Targeting and Reliability

The targeting of the PSFP subscale was good for all students (71% of the maximum information obtained). The targeting of the PLCFP was a little poorer and dependent on the level of field practice completed (67%, 60%, and 66% of the maximum information obtained, respectively, for field practice levels I, II, and III) (Table 4). It was evident that both the PSFP and the PLCFP items required higher levels of perceived stress/perceived lack of control to occur more often than experienced by the majority of the student teachers; i.e., the items were too “hard” for the study sample. However, while the maximum information was obtained towards the high end of both subscales, for the PSFP subscale there is quite high information along most of the scale and where the majority of students are located; this was to a lesser degree so for the PLCFP subscale (Figure S1 in Supplemental File S1). The average reliability of both the PSFP and the PLCFP subscales was below 0.70, while the reliability of the PSFP subscale was 0.72 for male students only and the reliability of the PLCFP subscale was 0.71 for students in level I field practice only (Table 4).

3.2. Criterion Validity

For all criterion validity analyses, PLCFP scores were adjusted for DIF prior to analyses (c.f. Table S2 in Supplemental File S1).

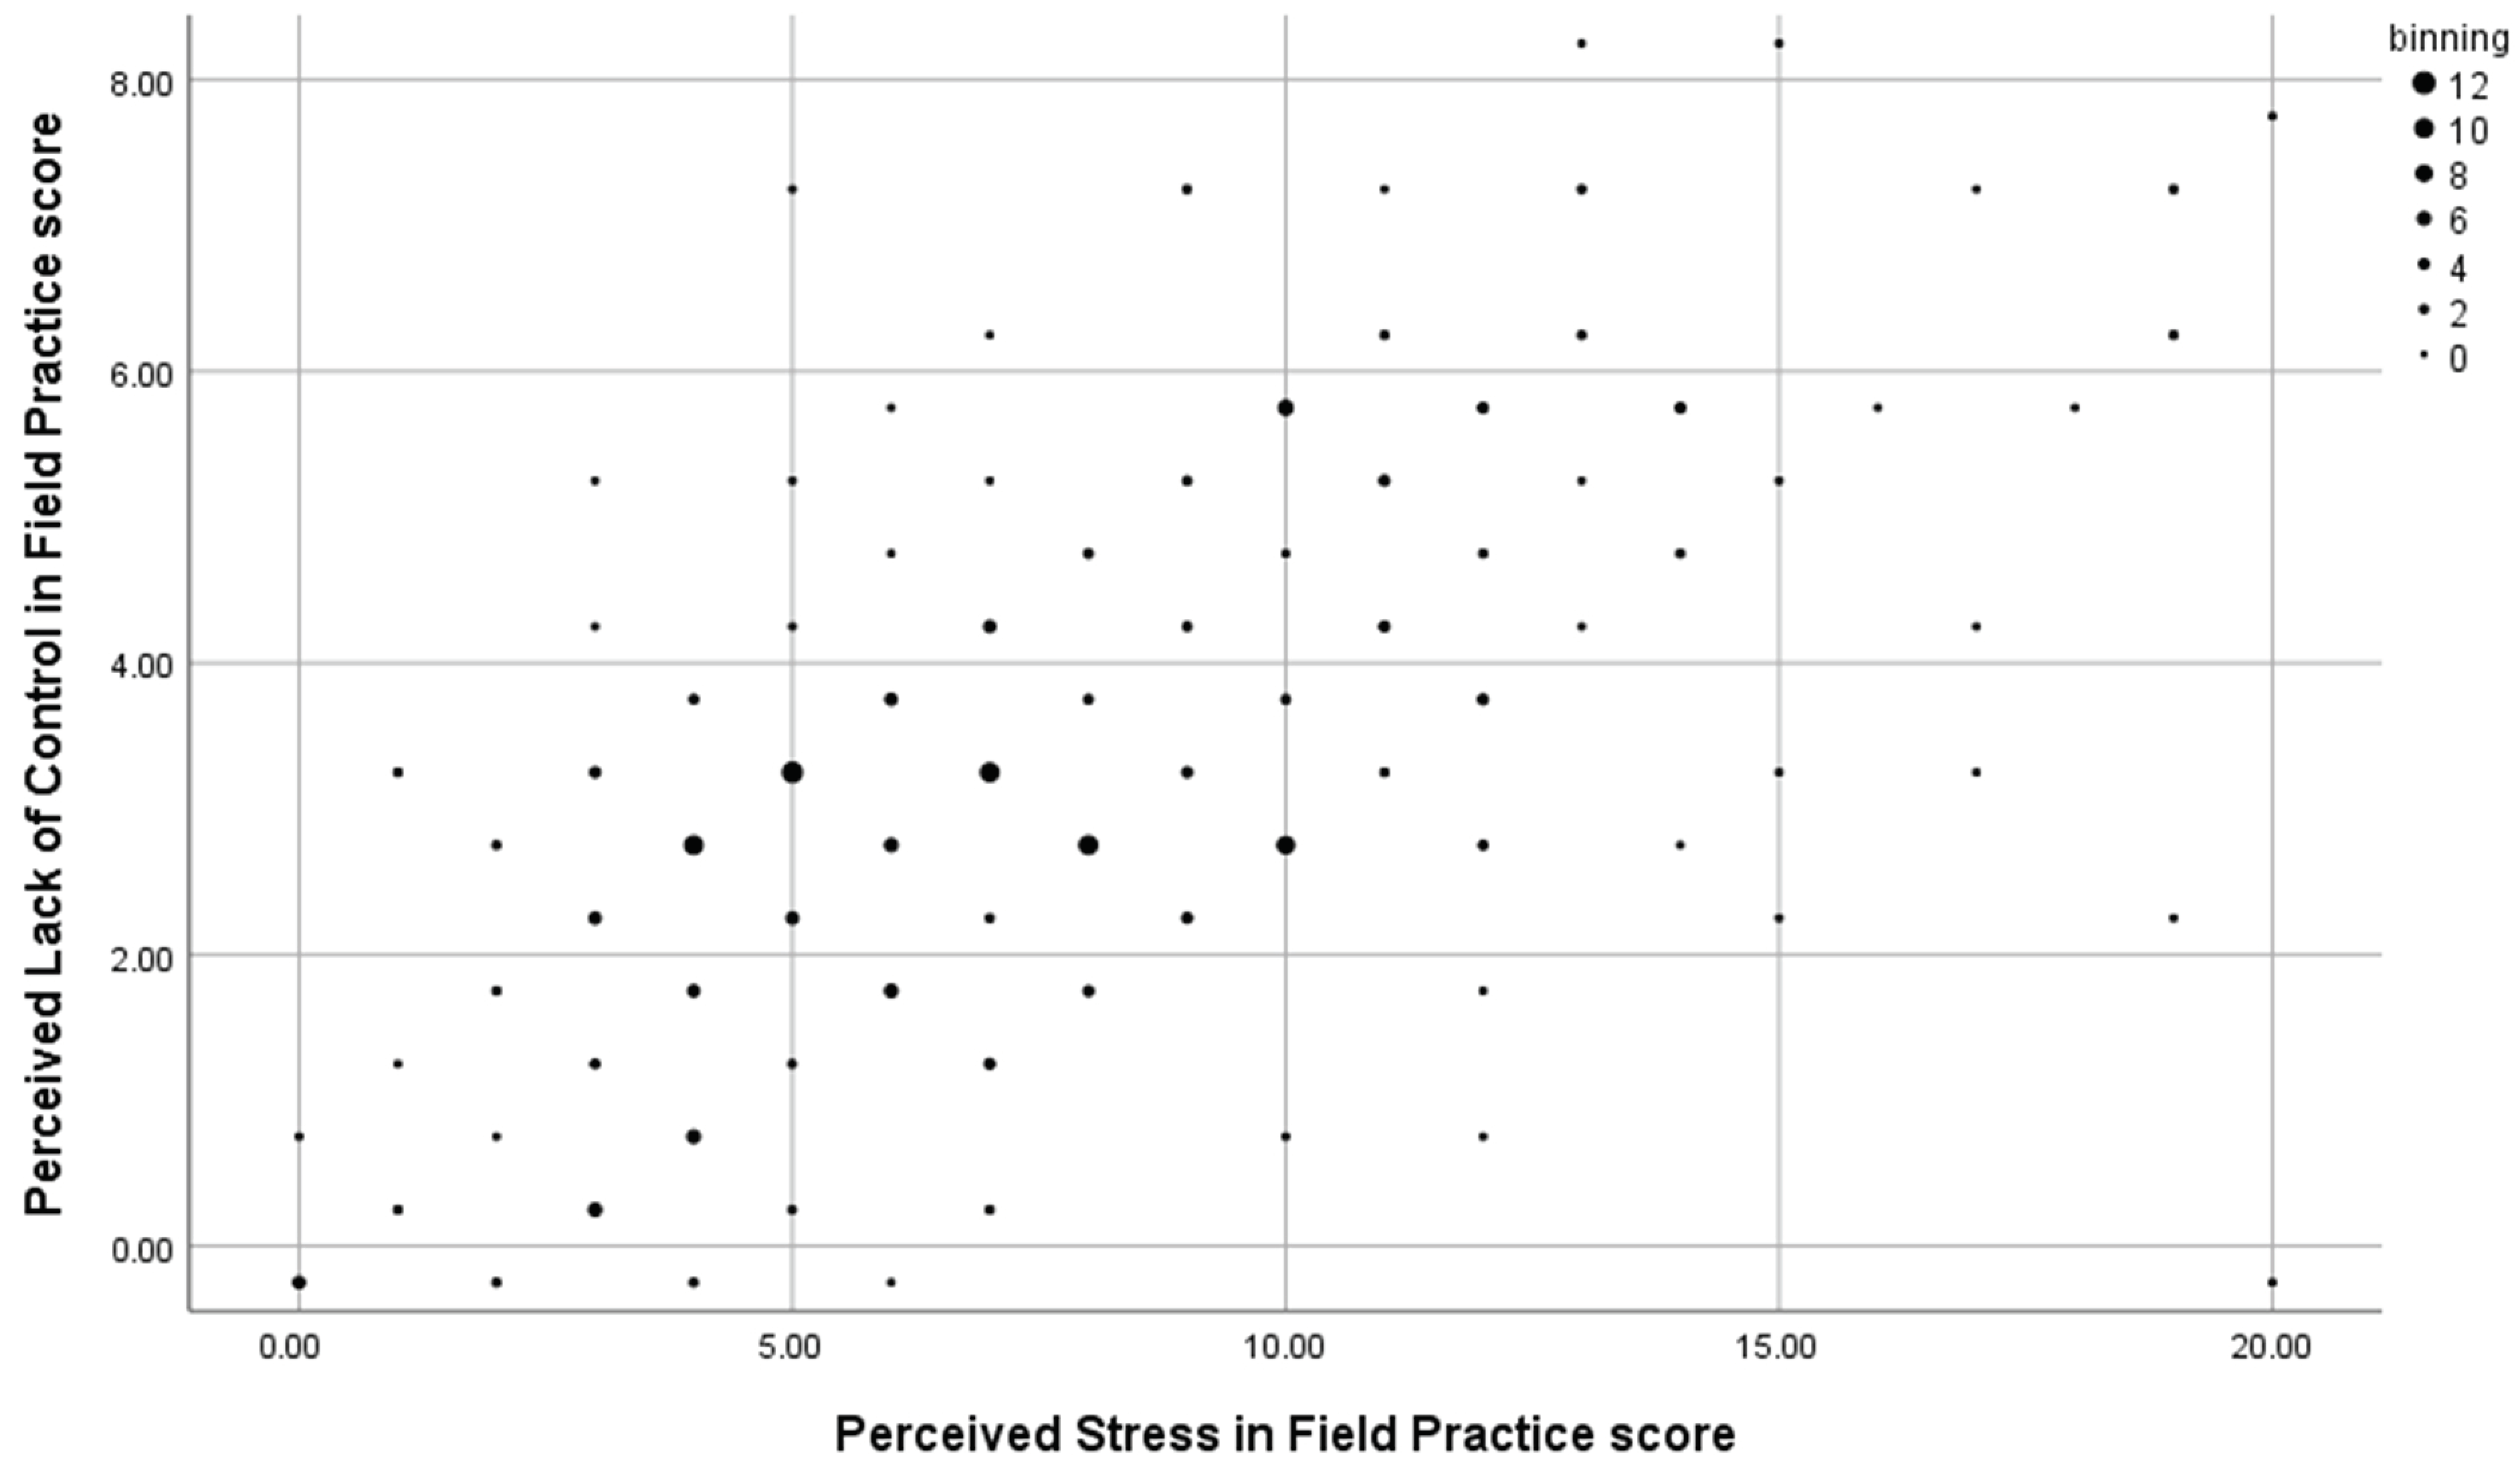
3.2.1. Correlation of Perceived Stress and Perceived Lack of Control in Field Practice

The plot of the sum scores of the Perceived Stress and Perceived Lack of Control in Field Practice (Figure 2) shows that while the entire score range was utilized on the PSFP subscale, no students scored at the uppermost end of the PLCFP subscale. While Figure 2 also shows the expected, strong and positive correlation between the subscale scores (Pearsons’ r = 0.593, p < 0.0001), it also showed that some students with high perceived stress scores had low perceived lack of control scores and vice versa.

3.2.2. Levels of Field Practice and Perceived Stress and Perceived Lack of Control in Field Practice

The results of the analyses of variance by general linear models, which were conducted to test the relationship between levels of field practice and perceived stress and perceived lack of control in field practice, respectively, while controlling for any effect of gender, age, campus, and type of teacher education program, provided simple results. None of the variables controlled for had any effect on the PSFP or PLCFP scores. Thus, the results are reported as simple tests of differences in mean scores for student groups defined by the level of field practice they had just completed (Table 5).
The expected relationships between levels of field practice and perceived stress and perceived lack of control, respectively, were confirmed in both cases, but only as trends (Table 5). Thus, as expected, the mean PSFP scores increased when the level of field practice increased (not significant), while the mean PLCFP scores decreased when the level of field practice increased (p just below 5%).

3.2.3. Perceived Stress and Perceived Lack of Control in Field Practice and Exam Grades

The expected negative relationship between the teacher students’ perceived stress and perceived lack of control in their just-finished field practice placement on the one side and the main criterion of obtained grades on their field practice exam (Crit 3) was established. Thus, the mean grades for teacher students who had the lower scores on PSFP and PLCFP were higher than the mean grades for the students who had the higher PSFP and PLCFP scores (Table 6). However, the difference in grades between the low- and high-scoring students was only significant for perceived stress (and just below a 5% level), and effect sizes were, by conventional interpretation, small in both cases. The Danish grading scale is shown in Supplemental File S2 together with a description of the objectives of the three levels of field practice placements.

4. Discussion

4.1. Psychometric Properties

In the present study, one item was eliminated from both the PSFP and the PLCFP subscales in order to achieve fit to a graphical loglinear Rasch model, namely item 10 from the PSFP subscale and item 4 from the PLCFP subscale. Previous validity studies, which have used comparable methods to study the psychometric properties and dimensionality of the PSS-10 with higher education students, have also eliminated an item from each subscale in order to reach a fitting model. Nielsen and Dammeyer’s [24] study with Danish psychology and technical university students eliminated item 6 from the PS subscale, as did Martinez-Garcia et al. [15] in their study of Spanish student teachers. With regard to the PLC subscale, Martinez-Garcia et al. [15] also eliminated item 4, while Nielsen and Dammeyer [24] did not eliminate any items from the PLC subscale. Thus, in terms of the number of fitting items, the present findings compare to previous research.
Previous validity studies of the PSS-10 with higher education students, which investigated the local independence of items with various methods, have found extensive issues related to a lack of independence. Martinez-Garcia et al. [15] only reported evidence of local dependence between items 5 and 7 in the PLC subscale for the Spanish student teachers, while both Nielsen and Dammeyer [24], with Danish psychology and technology students, and Medvedev et al. [48], with New Zealand health science and technology students and US psychology students, reported that all items in the PS and the PLC subscales, respectively, were involved in local dependencies with other items. Thus, in this respect, the PSFP and the PLCFP subscales are comparable to previous findings on the original PSS-10 subscales.
In the present study, we did not discover any evidence of DIF in the PSFP subscale but evidence of DIF relative to the level of field practice placement in the PLCFP subscale. Previous research on the PSS-10 has repeatedly found evidence of DIF in relation to many different background variables for the PSS-10 items across many different samples (see [24], for a review of this). For higher education samples, Nielsen and Dammeyer [24] found evidence of DIF related to academic disciplines for one item in each of the subscales, as well as evidence of gender DIF for item 1 in the PS subscale. Martinez-Garcia et al. [15], however, did not find evidence of any DIF for Spanish student teachers. Further studies with student teachers and specifically the PSS subscales adapted to field practice are needed to investigate this issue further.
The measurement precision of the PSFP and PLCFP subscales for the student teachers in field practice could certainly be better. In terms of targeting, the PSFP was satisfactorily targeted to the student teachers, while targeting of the PLCFP subscale was a little poorer and slightly varied across the levels of field practice, though not in an ordered manner (c.f. Table 4). Previous studies have reported better targeting of the PS and PLC subscales for higher education students [15,24], and thus, the versions adapted for field practice are slightly less well-suited for their target populations than the original subscales for higher education students. The same is more or less the case in terms of reliability, as these are comparable to the reliability reported by Nielsen and Dammeyer [24] for psychology and technical university students but lower than reliabilities reported by Martinez-Garcia et al. [15] for student teachers. A possible explanation for this discrepancy could very well lie in the fact that items were found to be conditionally independent in Martinez-Garcia et al.’s [24] study, while in both the current study and Nielsen and Dammeyer [24] more or less all items were involved in local dependence, and this is known to affect reliability negatively [26].
This study was conducted during the COVID-19 pandemic, which was an entirely new situation for student teachers to engage in field practice in schools that, to some degree, would be expected to impose a greater degree of less and lack of control on the students, even if the field practice placements ran almost as they did prior to the pandemic. The influence of such added pressure on the psychometric properties of the PSS-10 could not be foreseen due to the very particular circumstances in society. It has previously been suggested across studies that the PSS-10 performs better with stressed samples of higher education students than, for example, population samples [49]. However, the present study shows slightly poorer measurement properties for the student teachers in this situation, which would be expected to have elevated stress compared to non-pandemic times. The differences are, however, very small and could also be attributed to cultural differences compared to the Spanish student teachers in Martinez-Garcia [15] or within-culture differences to the university student sample in Nielsen and Dammeyer [24], as the teacher education in Denmark is not a university, but a university college degree.

4.2. Criterion Validity

The very strong positive correlation of the Perceived Stress and the Perceived Lack of Control in Field Practice subscales in this study supports previous findings of strong subscale correlations for the original PSS-10 with various samples; for example, for Spanish student teachers (γ-correlation = 0.425; [15]), for Danish psychology and technical university students (γ-correlation = 0.504; [24]), and for Australian population data (γ-correlation = 0.527; [49]). The findings in this study thus confirm the previous findings that perceived stress and perceived lack of control are positively related and extend the previous findings to the context of field practice placement in teacher education.
The findings that perceived stress scores increased with the level of field practice while perceived lack of control scores decreased with the level of field practice can only be considered trends in the predicted direction, as differences in mean scores are not significant or barely so (Table 5). Previous research has reported that stress levels for nursing students decreased over long field practice placements [4] and that stress levels of student teachers also decreased during their last field practice placement [16], but has not compared the stress levels for students in field practice at various stages of their education. Thus, additional longitudinal research could shed light on the shifts in perceived stress and perceived lack of control of student teachers in relation to their field practice experiences as the complexities of the field practices increase over the course of their teacher education program.
The mean exam grades for the field practice exam of the teacher students were, as expected, lower for students with higher levels of perceived stress or perceived lack of control during the field practice placement that they just completed compared to the students with lower stress and lack of control. However, effect sizes were small in both cases, and again, the results should be considered trends. Whether the fact that the study was conducted during COVID-19 semi-lockdown contributed to the small difference in grades between students perceiving high and low levels of stress and a lack of control in the field practice placement is not possible to say from this study. It does, however, point to further studies in the post-COVID-19 context in order to determine any differences from the “normal” field practice experience, and in this capacity, the results can serve as a bench mark for future studies in a less stressful future post-pandemic.

4.3. Perceived Stress and Lack of Control in Future and Broader Studies of Student Teachers in the Field Practice Context

The finding that the PSS-10 in this adapted version can provide measurement of field-practice-related perceived stress and perceived control for student teachers during the COVID-19 pandemic, though under relatively “normalized” field practice, enables broader future studies focusing both on the learning process side of field practice and/or the more psychological aspects of field practice experiences.
On the learning process side, the adapted PSS-10 opens up new avenues of research on the relationship between perceived stress and perceived lack of control on the one hand and practice-related self-efficacy on the other. For example, does the level of practice self-efficacy immediately prior to field practice predict the level of perceived stress and lack of control during field practice, and does the level of perceived stress and lack of control during field practice predict the level of practice self-efficacy prior to the next field practice placement? Such relationships appear unstudied but are in line with the continuously developing inter-relationship between self-efficacy and academic achievement over time in education [50], and as such, achievement and drop-out measures can also be included in such studies.
On the more psychological aspects of field practice experiences, as mentioned above, longitudinal studies could provide new knowledge on the shifts (or lack of shifts) in perceived stress and perceived lack of control as students move through teacher education with repeated field practice placements. Will, for example, a longitudinal design replicate the pattern of increasing stress and decreasing lack of control over time indicated in this study? Another more psychological course of research on student teacher field practice could be in the form of a link to psychotraumatology, as a recent report [51] found that 3% of Danish student teachers reported having experienced violence and/or threats while in field practice; 4% experienced differential treatment based on their sexuality, gender, race, or religion; and 1% experienced unwanted sexual attention. Thus, by including measures, for example, in the form of a purpose-specific traumatic event list, the link between potentially traumatizing experiences and perceived stress could be explored in the specific context of field practice.
Continued research on perceived stress and lack of control in teacher field practice, such as the above, would provide knowledge that might inform teacher educators and field practice schools on how to improve field practice learning processes and improve outcomes, how to prevent potentially traumatizing experiences, and how to deal with the aftermaths of such experiences effectively in order to alleviate stress and improve the psychological experience of field practice.

4.4. Strengths and Limitations

This study has three major strengths. The first is the strong psychometric foundation in the form of the fit to a graphical loglinear Rasch model for both subscales. We thus know that the criterion validity results are not biased by DIF. The second strength is that we have established that the PSS subscales adapted to the field practice context function are psychometrically comparable to the original PSS subscales. The third strength is that because the data were collected during the COVID-19 semi-lockdown, and it was possible to establish fit to graphical loglinear Rasch models for both subscales, we were able to provide benchmark scores for post-COVID-19 comparisons, both in the form of DIF-adjusted sum scores and in the form of person parameter estimates resulting from the models. Likewise, this study has three major limitations. The first is the sample size, which, even though it is very good for a first validity study, was too small for some subgroups to conduct more advanced and multivariate criterion validity analyses. The second limitation is that the study sample only comprises student teachers from a single university college. The third limitation is that the study sample only comprises student teachers in field practice placements and not students from a wider range of profession disciplines where field practice placements are part of the degree programs.

5. Conclusions

The psychometric properties of the adapted PSS-10 were in line with previous findings on the original PSS-10 subscales and are sufficiently good to use the subscale scores for research purposes but not for individual assessments. While future studies should employ larger and more diverse student samples in terms of other students from other professional disciplines where field practice placements are part of the program, in order to further investigate the applicational range of the adapted subscales as well as the generalizability of the results for student teachers, the reported score levels can be used as bench marks in post-COVID-19 studies of student teachers’ field-practice-related perceived stress.

Supplementary Materials

The following supporting information can be downloaded at: https://www.mdpi.com/article/10.3390/educsci13100983/s1, Figure S1: Item maps showing distribution of person parameter estimates and information curve above item threshold locations for the Perceived Stress in Field Practice (top left) and Perceived Lack of Control in Field Practice (top right & and both bottom) subscales.; Table S1: Conditional likelihood ratio tests of LRD and DIF interaction terms in the GLLRMs for the Perceived Stress and Perceived Lack of Control in Field Practice subscales; Table S2: DIF-equation table for the Perceived Lack of Control in Field Practice sum score to adjust for level of field practice DIF; Table S3: Bias introduced to group comparisons of perceived lack of control in field practice by unresolved DIF relative to level of field practice placement.

Funding

This research received no external funding.

Institutional Review Board Statement

The study fell within the legal boundaries defined by Danish law, wherein register- and survey-based studies do not require explicit approval from the National Committee for Health Research Ethics. This exemption is specified in part 4, Section 14(2) of the Danish Act on Research Ethics Review of Health Research Projects (Legal Information, 2017).

Informed Consent Statement

Informed consent was not required prior to the data collection for this study, as the data were collected strictly for research purposes. This decision was supported by a legal basis, found within the European General Data Protection Regulation (GDPR) Article 6, 1 e (public interest), and §10 in the Danish Data Protection regulation (research purposes). To ensure compliance with GDPR Article 13, the responsible institution provided detailed information to the participating student in connection with the data collection. This information included the voluntary nature of participation, an explanation of how personal data would be processed, and an assurance that participants could opt out of the project at any time, both before and after the study until the time of anonymization of the data, which was also stated.

Data Availability Statement

Data are available at https://zenodo.org/record/8143912.

Conflicts of Interest

The author declares no conflict of interest.

References

  1. Storrie, K.; Ahern, K.; Tuckett, A. A systematic review: Students with mental health problems—A growing problem. Int. J. Nurs. Pract. 2010, 16, 1–6. [Google Scholar] [CrossRef]
  2. Harkness, K.L.; Monroe, S.M. The assessment and measurement of adult life stress: Basic premises, operational principles, and design requirements. J. Abnorm. Psychol. 2016, 125, 727. [Google Scholar] [CrossRef] [PubMed]
  3. Pulido-Martos, M.; Augusto-Landa, J.M.; Lopez-Zafra, E. Sources of stress in nursing students: A systematic review of quantitative studies. Int. Nurs. Rev. 2011, 59, 15–25. [Google Scholar] [CrossRef]
  4. Al-Zayyat, A.S.; Al-Gamal, E. Perceived stress and coping strategies among Jordanian nursing students during clinical practice in psychiatric/mental health courses. Int. J. Ment. Health Nurs. 2014, 23, 326–335. [Google Scholar] [CrossRef] [PubMed]
  5. Wu, C.S.; Rong, J.R.; Huang, M.Z. Factors associated with perceived stress of clinical practice among associate degree nursing students in Taiwan. BMC Nurs. 2021, 1, 89. [Google Scholar] [CrossRef] [PubMed]
  6. Gardner, S. Stress among Prospective Teachers: A Review of the Literature. Aust. J. Teach. Educ. 2010, 35, 18–28. [Google Scholar] [CrossRef]
  7. Chaplain, R.P. Stress and psychological distress among trainee secondary teachers in England. Educ. Psychol. 2008, 28, 195–209. [Google Scholar] [CrossRef]
  8. Folkman, S.; Lazarus, R.S.; Dunkel-Schetter, C.; DeLongis, A.; Gruen, R.J. Dynamics of a stressful encounter: Cognitive appraisal, coping, and encounter outcomes. J. Personal. Soc. Psychol. 1986, 50, 992. [Google Scholar] [CrossRef]
  9. Lazarus, R.S. Psychological Stress and the Coping Process; McGraw-Hill: New York, NY, USA, 1966. [Google Scholar]
  10. Ngui, G.K.; Lay, Y.F. Investigating the Effect of Stress-Coping Abilities on Stress in Practicum Training. Asia-Pac. Educ. Res. 2018, 27, 335–343. [Google Scholar] [CrossRef]
  11. Ngui, G.K.; Lay, Y.F. The Effect of Emotional Intelligence, Self-Efficacy, Subjective Well-Being and Resilience on Student Teachers’ Perceived Practicum Stress: A Malaysian Case Study. Eur. J. Educ. Res. 2020, 9, 277–291. [Google Scholar]
  12. Geng, G.; Midford, R.; Buckworth, J. Investigating the stress levels of early childhood, primary and secondary pre-service teachers during teaching practicum. J. Teach. Educ. Sustain. 2015, 17, 35–47. [Google Scholar] [CrossRef]
  13. Petko, D.; Egger, N.; Cantieni, A. Weblogs in Teacher Education Internships: Promoting Reflection and Self-Efficacy While Reducing Stress? J. Digit. Learn. Teach. Educ. 2017, 33, 78–87. [Google Scholar] [CrossRef]
  14. Geng, H.; Midford, R. Investigating First Year Education Students’ Stress Level. Aust. J. Teach. Educ. 2015, 40, 1–12. [Google Scholar] [CrossRef]
  15. Martínez-García, I.; Nielsen, T.; Alestor-García, E. Perceived stress and perceived lack of control of Spanish education-degree university students: Measurement properties of the PSS10 and differences dependent on degree year, basis for admission and gender. Psychol. Rep. 2021, 125, 1824–1851. [Google Scholar] [CrossRef] [PubMed]
  16. Klassen, R.M.; Durksen, T.L. Weekly self-efficacy and work stress during the teaching practicum: A mixed methods study. Learn. Instr. 2014, 33, 158–169. [Google Scholar] [CrossRef]
  17. Hopkins, W.S.; Hoffman, S.Q.; Moss, V.D. Professional development schools and preservice teacher stress. Action Teach. Educ. 1997, 18, 36–46. [Google Scholar] [CrossRef]
  18. Klassen, R.M.; Elaine, W.; Angela, F.Y.S.; Waniwisa, H.; Marina, W.W.; Nongkran, W.; Panwadee, S.; Chaleosri, P.; Yanisa, B.; Anchalee, J. Preservice teachers’ work stress, self-efficacy, and occupational commitment in four countries. Eur. J. Psychol. Educ. 2013, 28, 1289–1309. [Google Scholar] [CrossRef]
  19. Kokkinos, C.M.; Stavropoulos, G. Burning out during the practicum: The case of teacher trainees. Educ. Psychol. 2016, 36, 548–568. [Google Scholar] [CrossRef]
  20. Cohen, S.; Williamson, G. Perceived stress in a probability sample of the United States. In The Social Psychology of Health: Claremont Symposium on Applied Social Psychology; Spacapan, S., Oskamp, S., Eds.; Sage: Newbury Park, CA, USA, 1988. [Google Scholar]
  21. Lee, B.; Jeong, H.I. Construct validity of the perceived stress scale (PSS-10) in a sample of early childhood teacher candidates. Psychiatry Clin. Psychopharmacol. 2019, 29, 76–82. [Google Scholar] [CrossRef]
  22. Eskildsen, A.; Dalgaard, V.L.; Nielsen, K.J.; Andersen, J.H.; Zachariae, R.; Olsen, L.R.; Jørgensen, A.; Christiansen, D.H. Cross-cultural adaptation and validation of the Danish consensus version of the 10-item perceived Stress Scale. Scand. J. Work. Environ. Health 2015, 41, 486–490. [Google Scholar] [CrossRef]
  23. Nielsen, T.; Dammeyer, J. Measuring higher education students’ perceived stress: An IRT-based construct validity study of the PSS-10. J. Stud. Educ. Eval. 2019, 63, 17–25. [Google Scholar] [CrossRef]
  24. Holland, P.W.; Wainer, H. Differential Item Functioning; Erlbaum: Hillsdale, NJ, USA, 1993. [Google Scholar]
  25. Marais, I. Local dependence. In Rasch Models in Health; Christensen, K.B., Kreiner, S., Mesbah, M., Eds.; ISTE and John Wiley & Sons, Inc.: London, UK, 2013; pp. 111–130. [Google Scholar]
  26. Rasch, G. Probabilistic Models for Some Intelligence and Attainment Tests; Danish Institute for Educational Research: Copenhagen, Denmark, 1960. [Google Scholar]
  27. Masters, G.N. A Rasch model for partial credit scoring. Psychometrika 1982, 47, 149–174. [Google Scholar] [CrossRef]
  28. Kreiner, S.; Christensen, K.B. Graphical Rasch Models. In Statistical Methods for Quality of Life Studies: Design, Measurements and Analysis; Mesbah, M., Cole, B.F., Lee, M.-L.T., Eds.; Springer: Boston, MA, USA, 2002; pp. 187–203. [Google Scholar] [CrossRef]
  29. Kreiner, S.; Christensen, K.B. Analysis of local dependence and multidimensionality in graphical loglinear Rasch models. Commun. Stat. Theory Methods 2004, 33, 1239–1276. [Google Scholar] [CrossRef]
  30. Kreiner, S.; Christensen, K.B. Validity and objectivity in health-related scales: Analysis by graphical loglinear Rasch models. In Multivariate and Mixture Distribution Rasch Models; Springer: New York, NY, USA, 2007; pp. 329–346. [Google Scholar]
  31. Fischer, G.H.; Molenaar, I.W. (Eds.) Rasch Models—Foundations, Recent Developments, and Applications; Springer: Berlin, Germany, 1995. [Google Scholar]
  32. Kreiner, S. The Rasch Model for Dichotomous Items. In Rasch Models Health; Christensen, K.B., Kreiner, S., Mesbah, M., Eds.; ISTE and John Wiley & Sons, Inc.: London, UK, 2013; pp. 5–26. [Google Scholar] [CrossRef]
  33. Rosenbaum, P.R. Criterion-related construct validity. Psychometrika 1989, 54, 625–633. [Google Scholar] [CrossRef]
  34. Nielsen, T.; Kreiner, S. Statistical Anxiety and Attitudes towards Statistics: Criterion-related construct validity of the HFS-R questionnaire revisited using Rasch models. Cogent Educ. 2021, 8, 1947941. [Google Scholar] [CrossRef]
  35. Lauritzen, S.L. Graphical Models; Clarendon Press: Oxford, UK, 1996. [Google Scholar]
  36. Andersen, E.B. A goodness of fit test for the Rasch model. Psychometrika 1973, 38, 123–140. [Google Scholar] [CrossRef]
  37. Kelderman, H. Loglinear Rasch model tests. Psychometrika 1984, 49, 223–245. [Google Scholar] [CrossRef]
  38. Hamon, A.; Mesbah, M. Questionnaire Reliability Under the Rasch Model. In Statistical Methods for Quality of Life Studies. Design, Measurement and Analysis; Mesbah, M., Cole, B.F., Lee, M.L.T., Eds.; Kluwer Academic Publishers: Dordrecht, The Netherlands, 2002. [Google Scholar]
  39. Kreiner, S.; Christensen, K.B. Person Parameter Estimation and Measurement in Rasch Models. In Rasch Models Health; Christensen, K.B., Kreiner, S., Mesbah, M., Eds.; ISTE and John Wiley & Sons, Inc.: London, UK, 2013; pp. 63–78. [Google Scholar] [CrossRef]
  40. Benjamini, Y.; Hochberg, Y. Controlling the False Discovery Rate: A Practical and Powerful Approach to Multiple Testing. J. R. Stat. Soc. Ser. B (Methodol.) 1995, 57, 289–300. [Google Scholar] [CrossRef]
  41. Nielsen, T. Psychometric evaluation of the Danish language version of the Field Practice Experiences Questionnaire for teacher students (FPE-DK) using item analysis according to the Rasch model. PLoS ONE 2021, 16, e0258459. [Google Scholar] [CrossRef]
  42. Kreiner, S. Introduction to DIGRAM; Department of Biostatistics, University of Copenhagen: Copenhagen, Denmark, 2003. [Google Scholar]
  43. Kreiner, S.; Nielsen, T. Item Analysis in DIGRAM 3.04. Part I: Guided Tours; Research Report 2013/06; Department of Public Health, University of Copenhagen: Copenhagen, Denmark, 2013. [Google Scholar]
  44. Kreiner, S.; Nielsen, T. Item Analysis in DIGRAM 5.01. Guided Tours; Department of Biostatistics, University of Copenhagen: Copenhagen, Denmark, 2023; Available online: https://biostat.ku.dk/DIGRAM/Item%20analysis%20in%20DIGRAM%205-01%20-%20guided%20tours.pdf (accessed on 16 March 2013).
  45. Goodman, L.A.; Kruskal, W.H. Measures of Association for Cross Classifications. J. Am. Stat. Assoc. 1954, 49, 732–764. [Google Scholar] [CrossRef]
  46. Medvedev, O.N.; Krägeloh, C.U.; Hill, E.M.; Billington, R.; Siegert, R.J.; Webster, C.S.; Booth, R.J.; Henning, M.A. Rasch analysis of the perceived Stress Scale: Transformation from an ordinal to a linear measure. J. Health Psychol. 2019, 24, 1070–1081. [Google Scholar] [CrossRef] [PubMed]
  47. Nielsen, T.; Santiago, P.H.R. Chapter 14: Using graphical loglinear Rasch models to investigate the construct validity of the Perceived Stress Scale. In Rasch Measurement: Applications in Quantitative Educational Research; Khine, M., Ed.; Springer Nature: Singapore, 2020; pp. 261–281. ISBN 978-981-15-1799-0. [Google Scholar]
  48. Bandura, A. Self-Efficacy. The Exercise of Control; W.H. Freeman and Company: New York, NY, USA, 1997. [Google Scholar]
  49. Danmarks Evalueringsinstitut. Oplevelsen af Praktik på Uddannelserne til Lærer, Pædagog, Sygeplejerske og Socialrådgiver; Danmarks Evalueringsinstitut: Holbæk, Denmark, 2022; ISBN 978-87-7182-689-0. [Google Scholar]
  50. Cox, D.R.; Spjøtvoll, E.; Johansen, S.; van Zwet, W.R.; Bithell, J.F.; Barndorff-Nielsen, O.; Keuls, M. The Role of Significance Tests [with Discussion and Reply]. Scand. J. Stat. 1977, 4, 49–70. Available online: http://www.jstor.org/stable/4615652 (accessed on 27 March 2016).
  51. Murray-Harvey, R.; Slee, P.T.; Lawson, M.J.; Silins, H.; Banfield, G.; Russell, A. Under Stress: The concerns and coping strategies of teacher education students. Eur. J. Teach. Educ. 2000, 23, 19–35. [Google Scholar] [CrossRef]
Figure 1. Final graphical loglinear Rasch models for the Perceived Stress (left) and Perceived Lack of Control (right) in Field Practice subscales. Notes. i1 through i9 denote the items of the two scales. PSFP = Perceived Stress in Field Practice subscale; PLCFP = Perceived Lack of Control in Field Practice subscale. FP_level = field practice level. TProgram = teacher program. γ-correlations are partial Goodman and Kruskal’s rank correlation for ordinal data [47]. Paths between background variables are shown without values, as these paths are not part of the measurement model. Arrows indicate a timewise causality within the model; for example, age can affect the field level of field practice, but not vice versa, while for example, field practice level, teacher program, and campus are at the same timewise level, and thus the paths between these have no arrows.
Education 13 00983 g001
Figure 2. Distribution of PSFP sum scores and DIF-adjusted PLCFP sum scores.
Education 13 00983 g002
Table 1. Characteristics of the study sample (N = 359).
Frequency (%)
Field practice placement
  Level I56 (15.6)
  Level II151 (42.1)
  Level III152 (42.3)
Campus
  Campus A236 (65.7)
  Campus B123 (34.3)
BA education program
  Regular300 (83.6)
   Other59 (16.4)
Major teaching subject a
  Danish (grade 1–6)62 (17.5)
  Danish (grade 4–10)118 (33.3)
  Mathematics (grade 1–6)18 (5.1)
  Mathematics (grade 4–10)125 (35.3)
  English (grade 1–6)8 (2.3)
  English (grade 4–10)23 (6.5)
Gender
  Female258 (71.9)
   Male101 (28.1)
Age
  Mean (SD)27.2 (6.95)
Notes. a Five students had other major teaching subjects.
Table 2. Global tests of homogeneity and invariance for the Perceived Stress and Perceived Lack of Control in Field Practice subscales.
Tests of Fit PSFP RM aPSFP GLLRM bPLCFP RM aPLCFP GLLRM c
CLRdfpCLRdfpCLRdfpCLRdfp
Global homogeneity d74.223<0.00181.0780.38668.615<0.00112.8260.985
Invariance
 Field practice level76.7460.003179.51560.09663.830<0.00128.6320.641
 Teacher program22.7230.47889.9780.16815.1150.21730.2260.261
 Campus16.3230.841103.4780.029 +18.9150.44321.2260.730
 Gender49.7230.001104.0780.026 +19.4150.19731.4260.213
 Age 31.8230.10486.9780.22924.7150.05543.5260.017 +
Notes. CLR = conditional likelihood ratio test; PSFP = Perceived Stress in Field Practice subscale; PLCFP = Perceived Lack of Control in Field Practice subscale; RM = Rasch model; GLLRM = graphical loglinear Rasch model. a. RM including all items in the respective subscale. b. GLLRM with item 10 eliminated and assuming locally dependent items (see left panel in Figure 1). c. GLLRM with item 4 eliminated, assuming items 5 and 8 to be locally dependent and item 5 to function differentially relative to field practice level (see right panel in Figure 1). d. The test of homogeneity is a test of the hypothesis that item parameters are the same for persons with low or high scores. + The Benjamini–Hochberg-adjusted critical level for false discovery rate at the 5% level was p = 0.0083 and p = 0.0017 at the 1% level.
Table 3. Item fit statistics for the Perceived Stress and Perceived Lack of Control in Field Practice subscales.
Item/Rest Score Correlations
PSFPRM aGLLRM bPLCFPRM aGLLRM c
ItemsObs γExp γpObs γExp γpItemsObs γExp γpObs γExp γp
i10.590.580.7650.580.580.352i4r0.570.580.744---
i20.650.590.0670.650.630.520i5r0.610.590.6110.720.680.361
i30.620.590.3580.610.620.918i7r0.600.590.8100.590.580.768
i60.570.580.7050.540.520.591i8r0.670.580.0480.670.680.849
i90.460.58<0.001 +0.430.460.434
i100.760.59<0.001 +---
Notes. PSFP = Perceived Stress in Field Practice subscale; PLCFP = Perceived Lack of Control in Field Practice subscale; RM = Rasch model; GLLRM = graphical loglinear Rasch model; Obs = observed; Exp = expected under the model; γ-correlations are Goodman and Kruskal’s rank correlation. a RM including all items in the respective subscale. b GLLRM with item 10 eliminated and assuming locally dependent items (see left panel in Figure 1). c GLLRM with item 4 eliminated, assuming items 5 and 8 to be locally dependent and item 5 to function differentially relative to field practice level (see right panel in Figure 1). + below the Benjamini–Hochberg-adjusted critical level for false discovery rate at 0.1% which was 0.0033.
Table 4. Targeting and reliability of perceived stress and perceived lack of control in field practice subscales.
ThetaSum Score
Scales and Subgroups
(n) a
TargetMeanTI MeanTI MaxTI Target IndexRMSE MeanRMSE MinRMSE
Target Index
TargetMeanMean SEMr b
PSFP subscale
All students (359)0.22−0.526.1208.5330.7170.4250.3420.80512.807.642.450.65
PLCFP subscale
Field practice level I (56)2.00−0.711.2581.8680.6730.8820.7320.8297.613.481.110.71
Field practice level II (151)1.54−1.121.1911.9890.5990.9330.7090.7607.473.441.080.69
Field practice level III (152)1.59−1.221.2621.9140.6590.8820.7230.8197.663.321.110.68
Notes. TI = test information; RMSE = the root mean squared error of the estimated theta score. SEM = the standard error of measurement of the observed score. r = reliability. a Targeting and reliability result are provided for subgroups of students with evidence of differential item functioning (c.f. Figure 1). b Weighted mean reliability for the Perceived Lack of Control in Field Practice subscale = 0.69.
Table 5. Mean Perceived Stress and Perceived Lack of Control in Field Practice scores for students in different levels of field practice (n = 359).
Level of Field Practice (n)Mean ScorePSFP
SE
95% CIp aMean Score bPLCFP
SE
95% CIp c
Level I (56)7.450.53[6.44; 8.49] 3.480.27[2.98; 4.04]
Level II (151)7.490.34[6.86; 8.19] 3.020.15[2.73; 3.32]
Level III (152)7.860.36[7.17; 8.52]0.3552.850.15[2.58; 3.14]0.046
Notes. PSFP: Perceived Stress in Field Practice; PLCFP: Perceived Lack of Control in Field Practice. a p-value F-test for overall difference with 1000 bootstrap samples is one-sided. b Using DIF-adjusted scores. c p-value F-test for overall difference with 1000 bootstrap samples is one-sided. Post hoc comparisons showed only field practice level 1 and 3 to differ significantly and only prior to adjusting for multiple testing.
Table 6. Mean field practice exam grades for student teachers with high and low levels of Perceived Stress and Perceived Lack of Control in Field Practice (n = 347).
Scale
Score Groups (n)
Mean GradeSE95% CIp aES
PSFP b
Low (187)8.610.21[8.20; 9.02]
High (160)7.880.13[7.37; 8.43]0.0160.232
PLCFP b
Low (151)8.490.24[8.03; 8.99]
High (196)8.110.23[7.63; 8.54]0.1320.121
Notes. PSFP: Perceived Stress in Field Practice; PLCFP: Perceived Lack of Control in Field Practice. ES: effect Size (Cohens d). a One-sided p-values with 1000 bootstrap samples. b Median-based dichotomization.
Disclaimer/Publisher’s Note: The statements, opinions and data contained in all publications are solely those of the individual author(s) and contributor(s) and not of MDPI and/or the editor(s). MDPI and/or the editor(s) disclaim responsibility for any injury to people or property resulting from any ideas, methods, instructions or products referred to in the content.

