Article

Low-Fidelity Prototyping with Design Thinking in Higher Education Management in Japan: Impact on the Utility and Usability of a Student Exchange Program Brochure

1
Bureau of Global Initiatives, University of Tsukuba, Tennodai 1-1-1, Tsukuba 305-8577, Ibaraki, Japan
2
Center for Education of Global Communication, Faculty of Humanities and Social Sciences, University of Tsukuba, Tennodai 1-1-1, Tsukuba 305-8577, Ibaraki, Japan
3
Department of Social System Design, Eikei University of Hiroshima, 1-5 Noboricho, Naka Ward, Hiroshima 730-0016, Hiroshima, Japan
*
Author to whom correspondence should be addressed.
Educ. Sci. 2023, 13(1), 53; https://doi.org/10.3390/educsci13010053
Submission received: 23 November 2022 / Revised: 9 December 2022 / Accepted: 13 December 2022 / Published: 3 January 2023
(This article belongs to the Section Higher Education)

Abstract

:
A project using design thinking (DT) was conducted among internal stakeholders of a large state Japanese university to design a user-centric brochure promoting study abroad programs at francophone partner universities. The low-fidelity prototype and the final product created with DT were tested by asking potential student-users to compare it with a standard brochure through two sets of surveys. Analysis of the quantitative and qualitative data revealed that low-fidelity prototyping was effective to enhance both the utility and usability of the final product. We also show how DT helped expose cognitive biases among designers.

1. Introduction

A project using design thinking (DT) was conducted among internal stakeholders of a large state Japanese university to design a user-centric brochure promoting study abroad programs at francophone partner universities. The initiative is one of various internationalizing projects aiming to increase student participation in those programs. This initiative was carried out conjoinedly by administrators and faculty affiliated with the Bureau of Global Initiatives (BGI), the Center for Education of Global Communication (CEGLOC), and the Student Support Center (SSC) at the University of Tsukuba (UT).
The researchers of this study used part of the data from the surveys administered during the DT project to come to their conclusions. These surveys tested two renderings of the brochure: firstly, a low-fidelity prototype, and secondly, a final product, which were compared by potential student-users with a standard brochure.

1.1. Problem and Purpose of this Study

At the researchers’ university, using promotional brochures is one among various methods aiming to promote study abroad programs. Until this project, such brochures were designed exclusively by in-house stakeholders (administration and faculty) with no evaluation as to whether such publications were tailored to the needs of the potential end-user students.
The purpose of this study is to determine whether low fidelity prototyping using design thinking methodology was effective in enhancing both the utility and usability of a brochure through its assessment by end-user surveys endorsing mixed methods that yield both qualitative and quantitative data.
To examine the surveys used in the project, the authors formulated the following two research questions to understand what is at stake for the improvement of brochure designing processes.

1.1.1. Is Low Fidelity Prototyping in Design Thinking Effective in Enhancing Both the Utility and Usability of a Brochure? (RQ1)

Designers often resort to rapid designing as low-fidelity prototypes are cheaply and easily made, provide focused feedback, and effectively present the product to the end user [1,2,3]. However, because low-fidelity prototypes might be judged as unprofessional, some designers resort to high-fidelity prototypes [4]. In this project, two main reasons underscored the making of a lo-fi prototype: Firstly, because of limited funding, asking a professional from the beginning stage to edit a brochure carried the risk of cost overruns. Secondly, the project administrators did not want students to be influenced by a professionally made product which might have taken away the benefit of filtering effects [5] (p. 10) during the testing phase [6] (p. 7).
Utility and usability—two product characteristics examined in this study—although closely connected, are not synonymous. They are comparable in that they are both important in generating a quality product: the product must be readily and intuitively operated (usability) to fulfill the assigned purpose (utility) [7]. In our analysis of the surveys, utility is linked to brochure content, and usability to its design.

1.1.2. How Is DT Effective in Identifying and Mitigating Cognitive Biases? (RQ2)

Considerable time and resources may be spent in brainstorming, innovating, and planning for the implementation of new ideas only to discover that the final product fails to gain the attention of its potential users because the project team’s assumptions on solutions suffered from several biases [8]. One of the key distinguishing features of design thinking is the implementation of prototyping, which helps avoid this pitfall by testing presumptions, benchmarking products, understanding users, and refining ideas [9].
When examining the prototypes and the responses from the surveys, the researchers noticed a potential for an ego-centric empathy gap [8,10], in which there was an overestimation of the similarity between the designers’ perspective and the people to whom the product was intended: in this case, the students, who have a different psychological framing than the designers. Liedtka [8] (p. 933) quotes the necessity of ethnographical methods described by Mariampolski [11] as a necessary step in reducing biases that are enforced by focus groups and quantitative methods. The researchers went over the extensive quantitative and qualitative data of the surveys with the intention of accurately understanding how the bias happened and how, after modifications were made based on the understanding, users felt about the new rendering and final version of the product.

1.2. Context

1.2.1. Government Incentives for Increasing Outbound Student Numbers

International student mobility is an essential tenet in the internationalization efforts of universities [12,13]. The government has conducted various programs designed to enact internationalization, such as the Global 30 project, (2009–2014) which included goals such as increasing inbound international students (135,000 in 2013 to 300,000 by 2020), developing degree programs conducted in English, nominating 13 core Japanese universities to attempt to rank themselves among the top 100 universities in established world ranking regimens, and finally to increase the number of outbound students from 60,000 in 2010 to 120,000 by 2020 [14,15]. The government has followed up the original Global 30 project with the Top Global University Project (TGUP), which will conclude in 2023. The key performance indices (KPI) of TGUP are based on three pillars, namely (a) internationalization of higher education, (b) educational reform, and (c) governance. The first pillar explicitly includes a KPI comprised of the ratio of students studying abroad under inter-university agreements to the percentage of total students of that institution [16]. The number of departures from Japan to overseas destinations can be considered encouraging, with a steady increase since 2009, culminating at 115,146 students in 2018 [17]. However, the numbers tell a slightly different story when excluding non-inter-university agreement-based figures. The primary source of change has been an increase in students who took part in programs that were more than one month and less than three months in length. Data provided from 2015 to 2021 by the Japan Student Services Organization (JASSO) show that the demand for short stays abroad has increased, yet the number of students pursuing credit-worthy international mobility has remained unchanged [17]. Japanese universities have been actively sending students abroad but have yet to achieve substantial growth in the number of university students going abroad to pursue credit-worthy studies.

1.2.2. Comparing Student Mobility of UT with Partner Universities

The mobility program in question concerns a scheme in which students at the University of Tsukuba (UT) travel to a partner university in France. Figure 1a compares the population of university students from France at UT to the population of UT students in Francophone universities. Though COVID-19 and the closure of borders resulted in the immediate and almost complete stoppage of exchange programs, the differences in numbers in pre-pandemic times (especially between 2017 and 2019) indicate a discrepant trend.
One way to look at this situation is that the trend of UT students going to France has remained stable. Yet, the influx of French students seeking mobility to UT has increased. Compared with Germany, we see that there is close to no discrepancy in inbound and outbound mobility, thus making it a successful example of international student mobility in which the outbound traffic strikes a balance with the inbound traffic (Figure 1b). For a country to become a leading destination for outbound students, a special effort needs to be made by administrators and academics. Otherwise, the ratio of outbound students to the ratio of inbound students will stay uneven.
The resultant discrepancies have financial repercussions for UT: the student numbers for France may indicate that UT uses more monetary resources than many of its partner universities, as universities typically forfeit tuition fees for international students in student mobility programs with the expectation that an equal number of local students will partake in the program to keep it balanced, thus achieving a net neutral in terms of overhead costs. Therefore, the issue is not lack of growth, but that UT cannot keep up with the change in student mobility compared with its French partner universities. One of the ways we imagined filling the gap was to conduct a project based on design thinking.

1.3. Definition and Scope of Design Thinking in This Study

Web design, video game design, user experience (UX) design, engineering, and architecture are some of the many fields that use systematic methods of design to identify end users’ needs and use these findings to make user-friendly design decisions. Design thinking is becoming more widely accepted in non-design fields such as Higher Education as a method for creatively responding to urgent problems [18,19,20,21].
Simply put, there is no one definition of design thinking. Design thinking defies convention in academic discourse because it seems to resist definition; it has been defined through the different epistemological lenses of its practitioners, theorists, and contributors.
According to the executive chair of the renowned design firm IDEO, Tim Brown, “Design thinking is a human-centered approach to innovation that draws from the designer’s toolkit to integrate the needs of people, the possibilities of technology, and the requirements for business success.” [22]. Emphasis is paid to how designers focus on things that do not exist yet (relying on hypothesis building and abductive processes). In contrast, scientists focus on measuring things that already exist (by relying on hypotheses) [8]. Other authors, such as Martin [23], describe its potential as an integrative system of thought that combines the seemingly opposite processes of analytical thinking and intuition. Micheli et al. [24] conducted a literature review of writings on design thinking and concluded that, though the literature is varied and disparate, the following ten attributes emerge: “creativity and innovation, user-centeredness and involvement, problem-solving, iteration and experimentation, interdisciplinary collaboration, ability to visualize, gestalt view, abductive reasoning, tolerance of ambiguity and failure, and blending rationality and intuition”.
Johansson-Sköldberg et al. [25] take a social constructivist approach and state that any attempts to define design thinking would lead to an “essentialist trap” and one should not go about looking for one but instead suggest where and how the term is used in different contexts. They first define design thinking and separate the strain from “designerly” thinking (emanating from an academic discourse from a spectrum of disciplines). They chart out design and “designerly” thinking into five different discourses, i.e., “creation of artifacts; as a reflexive practice; a problem-solving activity; a way of reasoning and making sense of things; and creation of meaning” [25] (p. 124). The researchers of this study draw impetus from the study as a problem-solving activity. Johansson-Sköldberg et al. [25] also identify three discourses in design thinking in the management area, i.e., IDEO’s way of working; a way to approach organizational issues, a skill needed in management; and as part of management theory. The authors locate this project in the second discourse (organizational issues and skills required to address them).
Part of the description of the scope of design thinking conducted in this project must include an explanation of the administrators’ and academics’ backgrounds and motivations. The project managers were neither trained designers nor scholarly experts in design theory; they have backgrounds in other fields (e.g., Systems Thinking and Marketing, Second Language Acquisition, etc.). The project leaders decided to embark on this design thinking initiative to solve a problem in their shared professional context, which has its roots in the internationalization efforts of Japanese universities, as described in Section 1.2.1. Moreover, they chose France as a destination because the French language section was tasked with reassessing relationships with French universities and noticed a need for updating a pre-existing brochure for studying abroad in France, all the while developing a tool that would help administrators, faculty, and students see the study abroad process in clearer terms. Instead of making simple data updates, a fundamental overhaul of the product was aimed for because interest in studying abroad in France was waning. Internationalization officers at the university were interested in expanding lessons learned from the project for scaled-up efforts in the future.
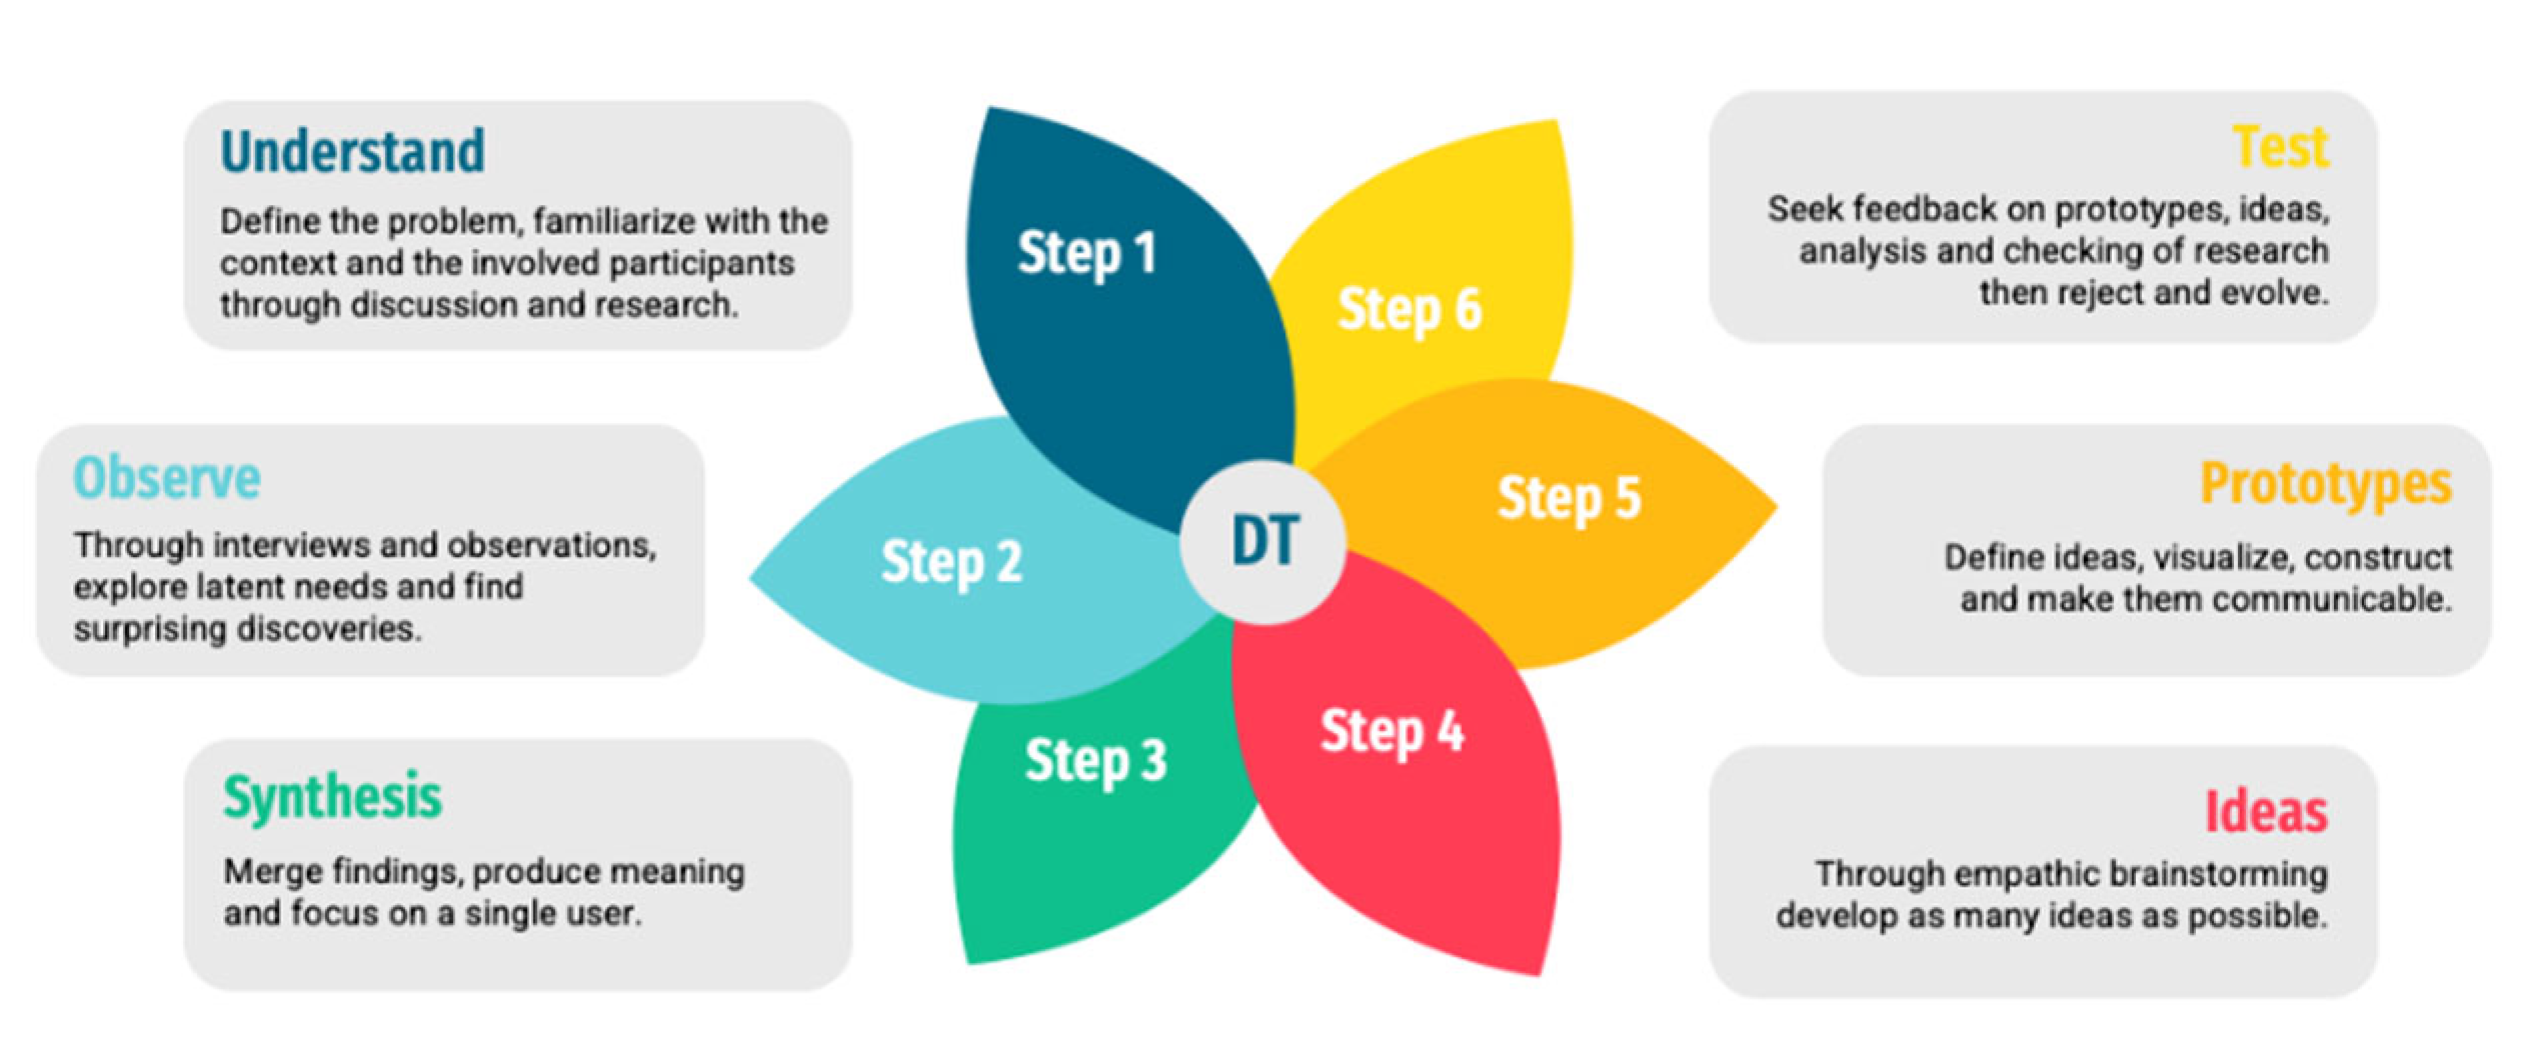
Finally, the project managers had to choose among the many versions of the design thinking process that are framed into any number of different phases, from Simon’s seminal 7 stage model [26] to IDEO’s 3 ‘I’s—Inspiration, Ideation, Implementation—model [27]. For the present experiment, they relied on the six steps of the design thinking model presented by Lewrick et al. [28]. Figure 2 shows the project’s take on the cycle in the form of a lotus wheel, where the last step can lead back into the first, or any step lead agilely into other steps through the central DT hub.

2. Methodology

2.1. Participants

The original surveys utilized convenience sampling to collect data from two cohorts of Japanese undergraduate students (G1, N = 215; G2, N = 95) enrolled in Basic French language classes (21.8%) and Basic Linguistics classes (78.2%) at UT. The first cohort of students (G1) was enrolled during the autumn semester (October–March) of 2021–2022 and the second cohort (G2) during the spring semester (May–August) of 2022. Students who completed the surveys were mostly 1st-year students (77.7%) but also 2nd- (11%), 3rd- (7.7%), and 4th-year students (3.6%). Students who had studied French or were studying it constituted 29.3% of the total number of participants.

2.2. Procedures

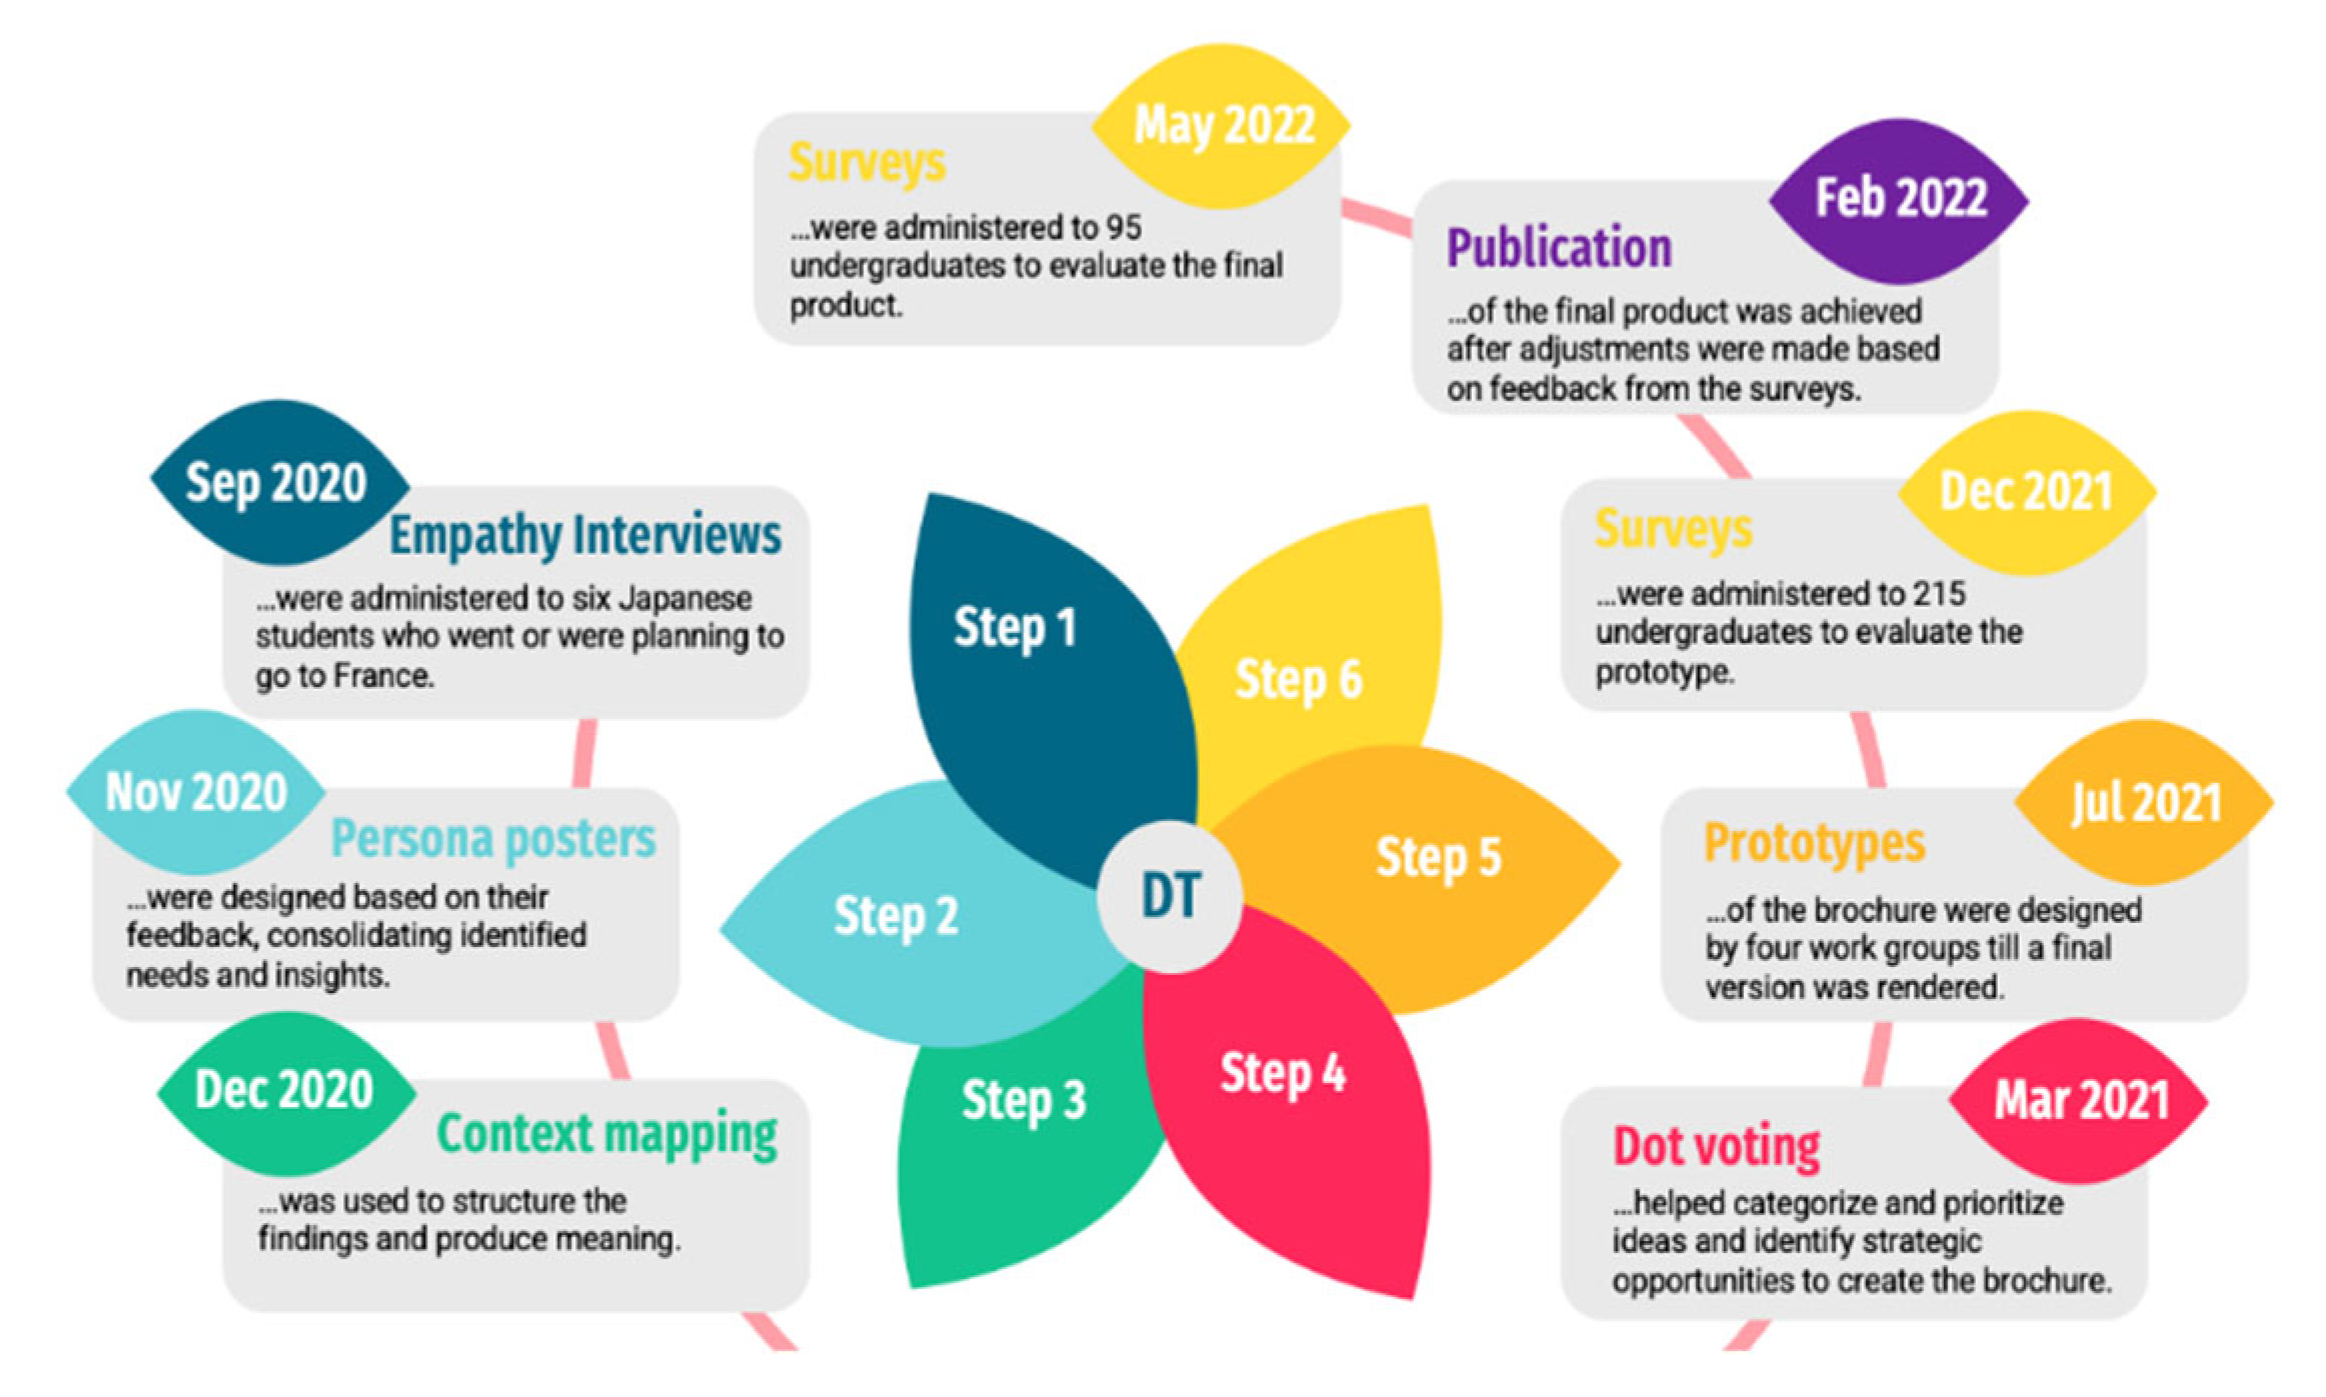
The design cycle for the new brochure spanned a total of 17 months (September 2020–February 2022) until the final product was published (Figure 3). DT tools implemented in this project were all drawn from Lewrick et al. [28].
The project managers took the first step with in-depth interviews (empathy interviews) of six Japanese students who had been to France or were planning to go. In step 2, the findings helped design six human size fictitious posters representative of the larger student body (Persona posters). These fictional characters were created to ensure the anonymity of the interviewees all the while showcasing their real-life problems, their experiences, behaviors, and goals. Empathy being a key-component of the DT process, rather than presenting raw-data on spreadsheets, such life-size posters effectively engaged the staff and faculty from the three cooperating administrations (BGI, CEGLOC, SSC) to whom they were presented, and concurred to involving them more directly with the following phases of the project: in step 3, synthesis, context mapping was used, which helped reflect on the various systems students have to navigate through to apply for a study abroad program; in step 4, ideas were categorized and prioritized through brainstorming and dot voting; in step 5, four administrative work groups created relevant content, which led to the making of a prototype brochure; finally, in step 6, the digital prototype was marked against the original brochure through a first survey.
Findings led to making substantial changes to the content and design of the brochure. The final product was published on the university website for student access in February 2022. This final brochure was then tested through a second survey in May 2022 (Figure 4).

2.3. Data Collection

A semi-structured questionnaire in Japanese was developed, test-run, then administered on two occasions. The purpose of the two sets of surveys was two-fold: firstly, the questionnaires enabled the project administrators to gather student views on the utility and usability of the brochure’s content and design; secondly, the initial survey results allowed them to remodel the prototype into a final product.
The use of both structured (Likert scale and multiple-choice questions) and semi-structured (open-ended questions) formats allowed both quantitative and qualitative analyses to render insights into the end users’ interests, needs, and expectations when handling the products.

2.4. Data Analysis

2.4.1. Quantitative Analysis

The administrators of the project adopted two 11-point numerical scales whose two reference points, 0 and 10, were given labels (for utility: 0 = Not useful, 10 = Useful; for usability: 0 = Not easy to use, 10 = Easy to use). This scale format enabled fine comparisons between two sets of items: first between the original brochure (A) and the prototype (B), and second between the original brochure (A) and the finalized product (C). A qualitative approach further informed the results (see Section 2.4.2).
The rationale behind an 11-point numerical format was foremost to ensure that greater numbers allowed respondents to differentiate in a more granular way [29,30]. Because responses were intended to be charted into bar graphs, an 11-point scale would provide sufficient contrast between two sets (AB vs. AC) to be visually significant.

2.4.2. Qualitative Analysis

Following O’Connor and Joffe’s [31] step-by-step guidelines on implementing the various stages of qualitative analysis, the questionnaire responses relating to utility and usability were further analyzed by the authors using an inductive content analysis approach.
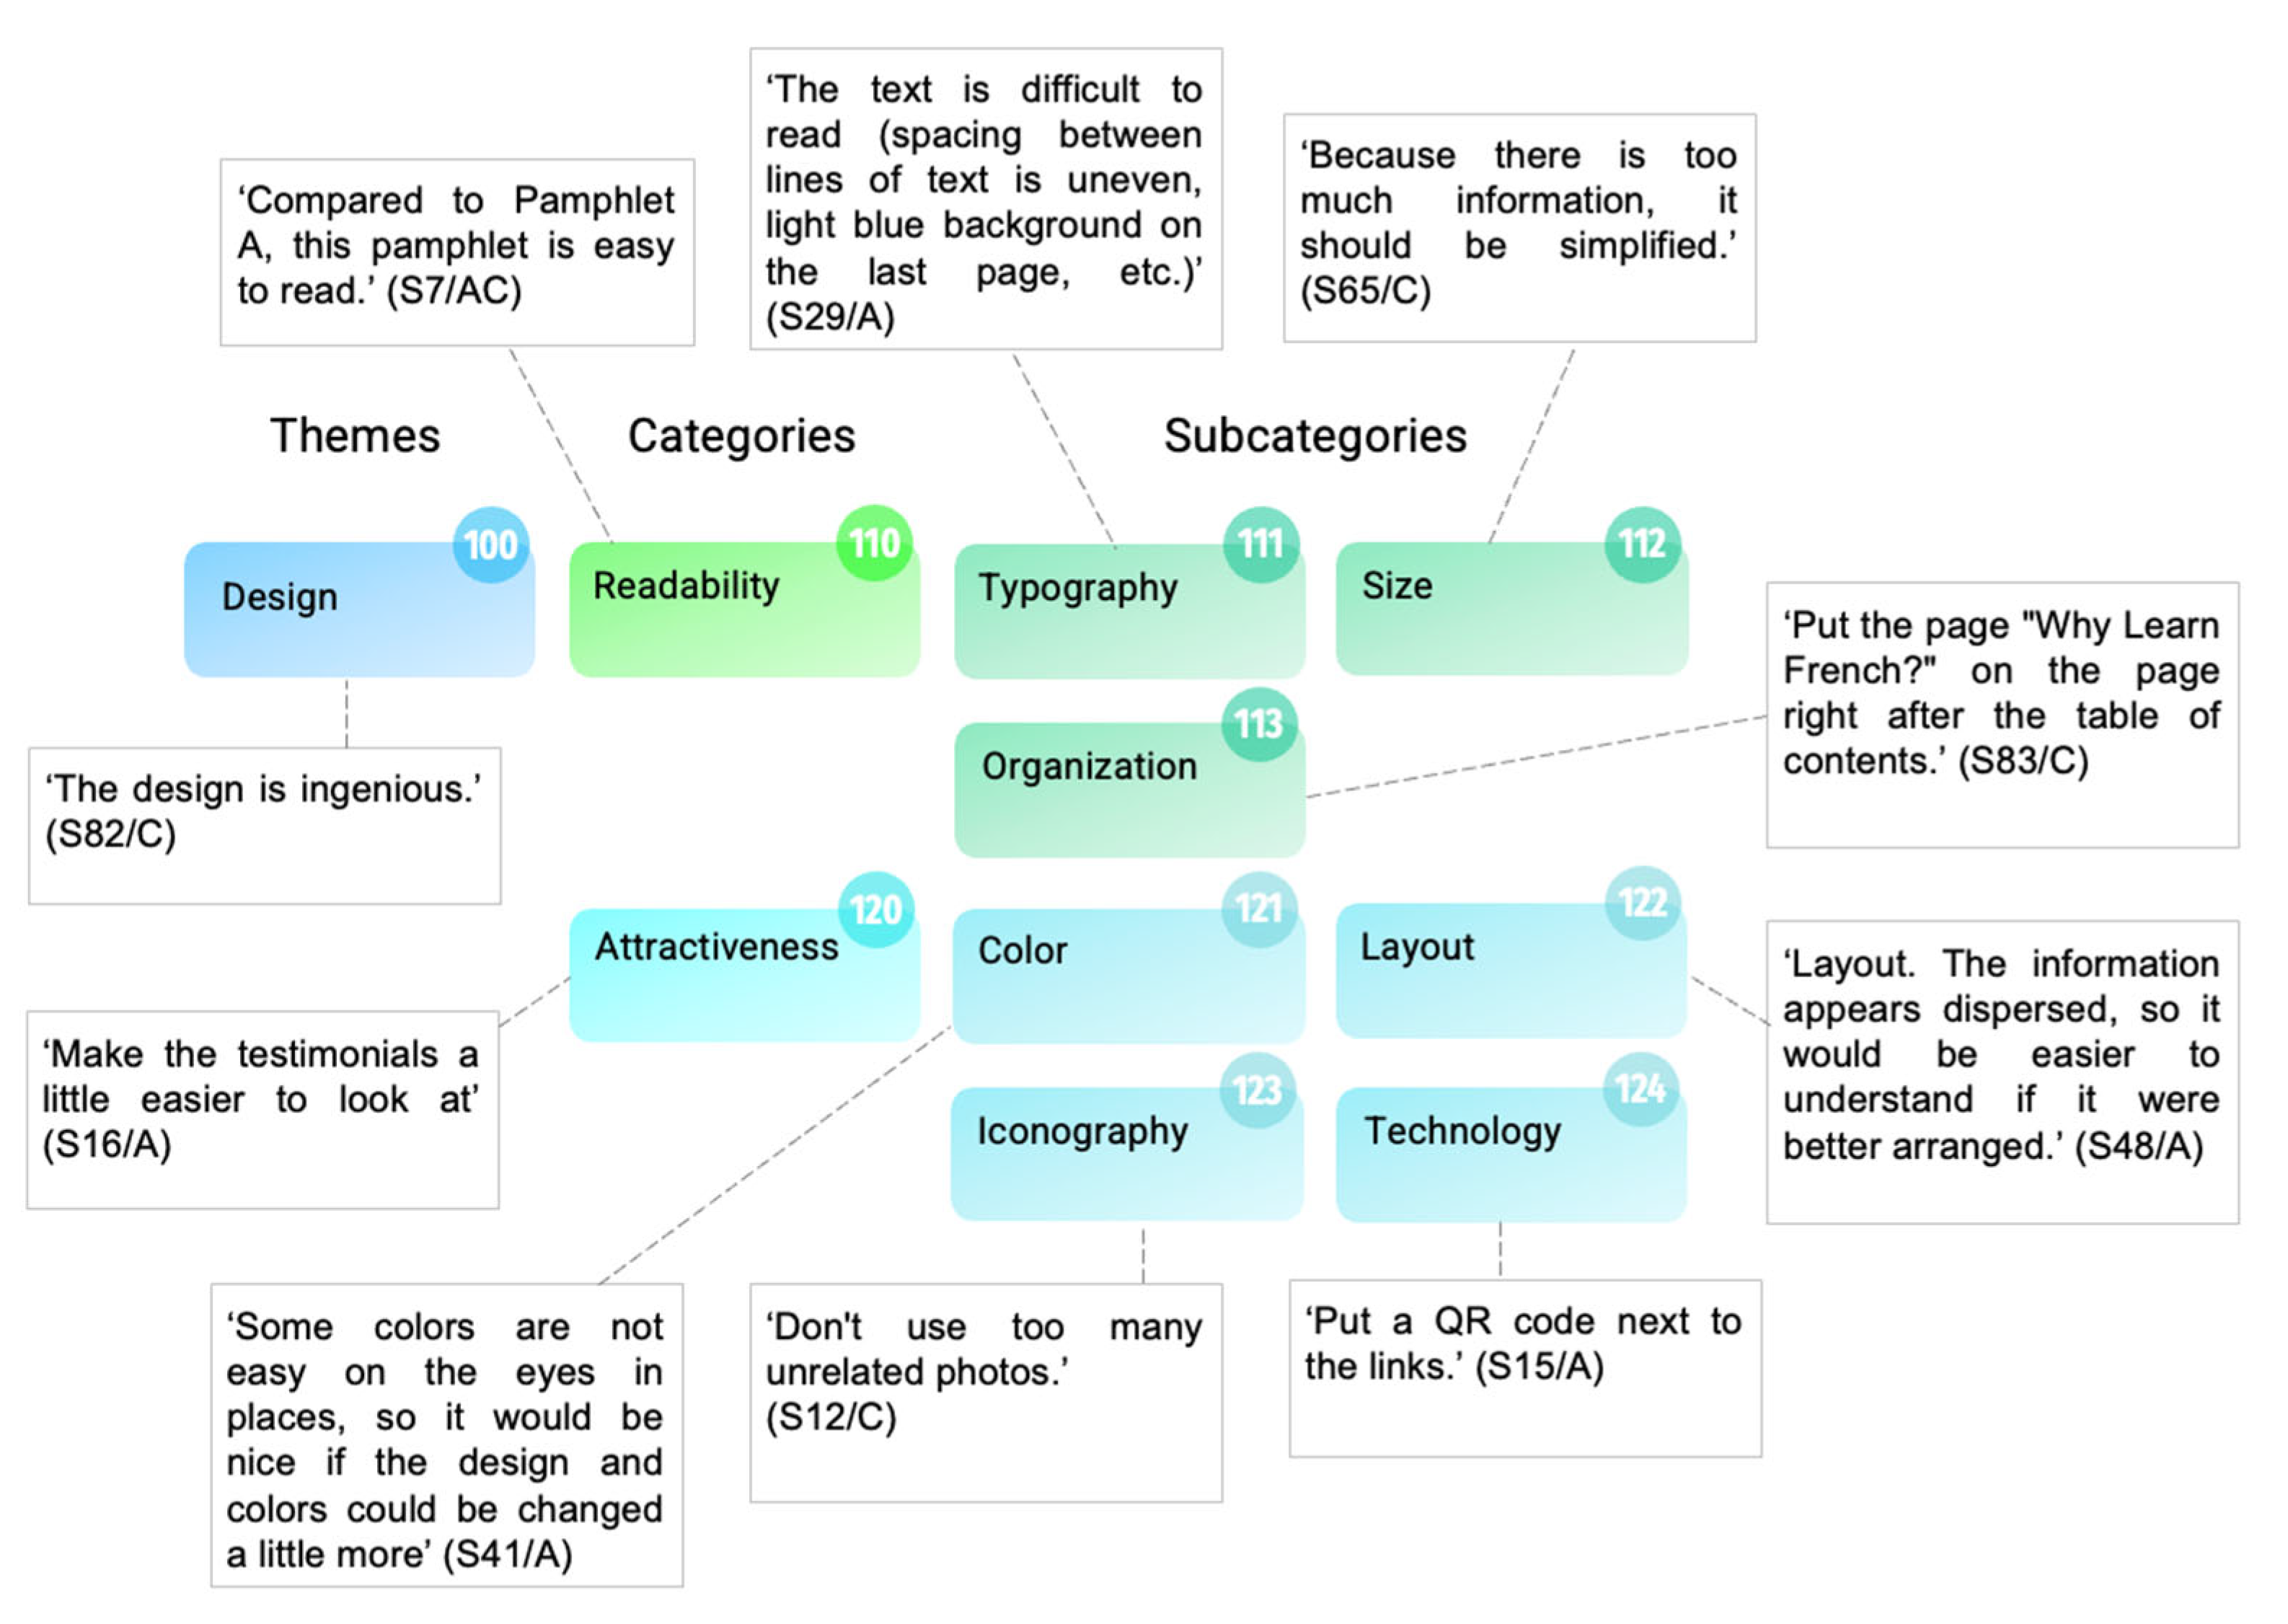
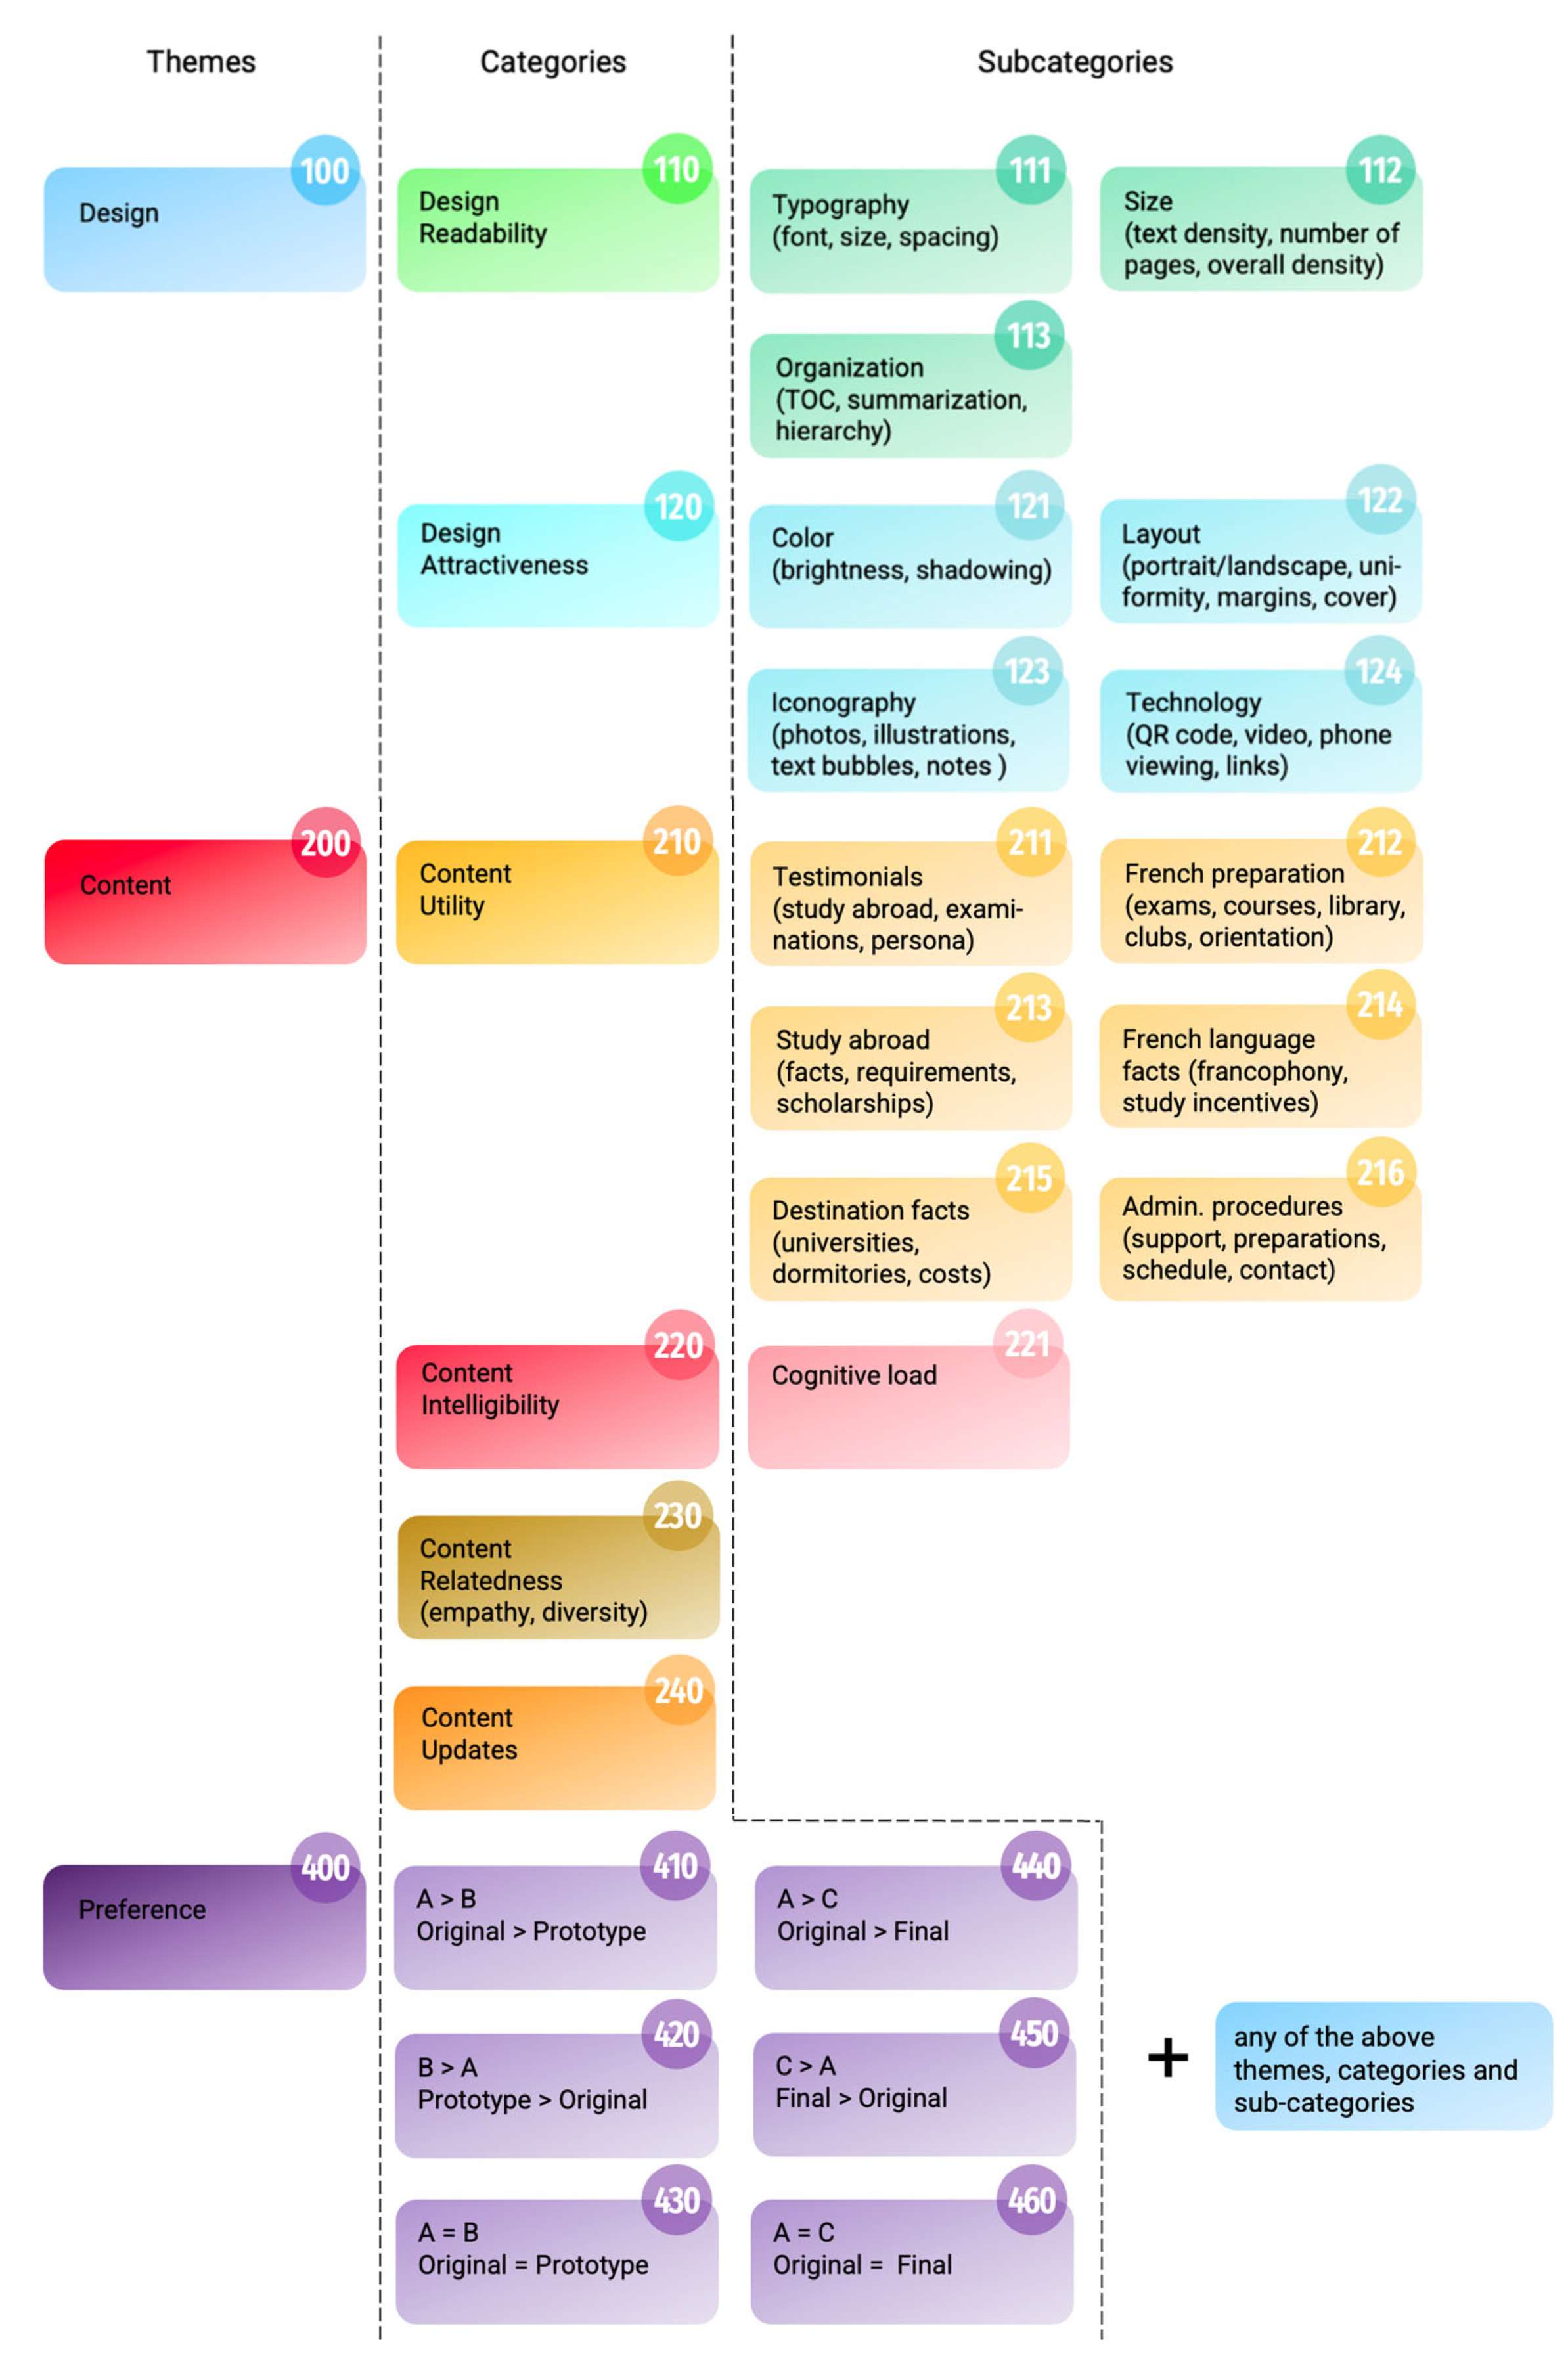
To assess the rigor and transparency of the coding frame and its application to the data in the original Japanese text, researchers conducted an intercoder reliability (ICR) assessment performed by three coders of Japanese nationality, the minimum number to validate the ICR, as demonstrated by MacPhail et al. [32]. In the first stage of the analysis, two coders (C1, C2) examined the data independently without conferral. This allowed the identification of three main themes: design, content, and preference. In the second stage, a coding frame was refined by identifying and grouping codes into categories under the three main themes (Figure 5). In the third stage, we relied on “negotiated agreement” [33] (p. 305), known to substantially increase reliability, where coders discussed any inconsistencies in coding with the mediation of the researchers, thus clarifying conflicting interpretations to further guarantee high intercoder reliability [34]. This consensus approach helped in the refinement and finalization of a definite coding frame [35] as compiled in Figure 5. Once the coding frame was defined, the researchers prepared ‘clean’ uncoded data sets for a third coder (C3) who used the defined coding frame to recode all the data.
Following this step, the authors engaged in an intercoder reliability test using percent agreement and Cohen’s κ.
Cohen’s κ helped determine if there was agreement between (1) the first coders’ (C1, C2) use of the final code frame and (2) a third coder’s (C3) use of this same code frame. The comparison was run on a single set of students’ responses to Q2—What do you like about the brochure? There was strong agreement between the coders’ use of the coding system, κ = 0.901 (95% CI [131.47, 156.32]), p < 0.001. This kappa value implied that the coding of the remaining responses in the study by single coders was a feasible and reliable procedural option. One researcher (C4) then proceeded to systematically recode the data originally coded during the previous ICR phases into a unified coded data set [36].
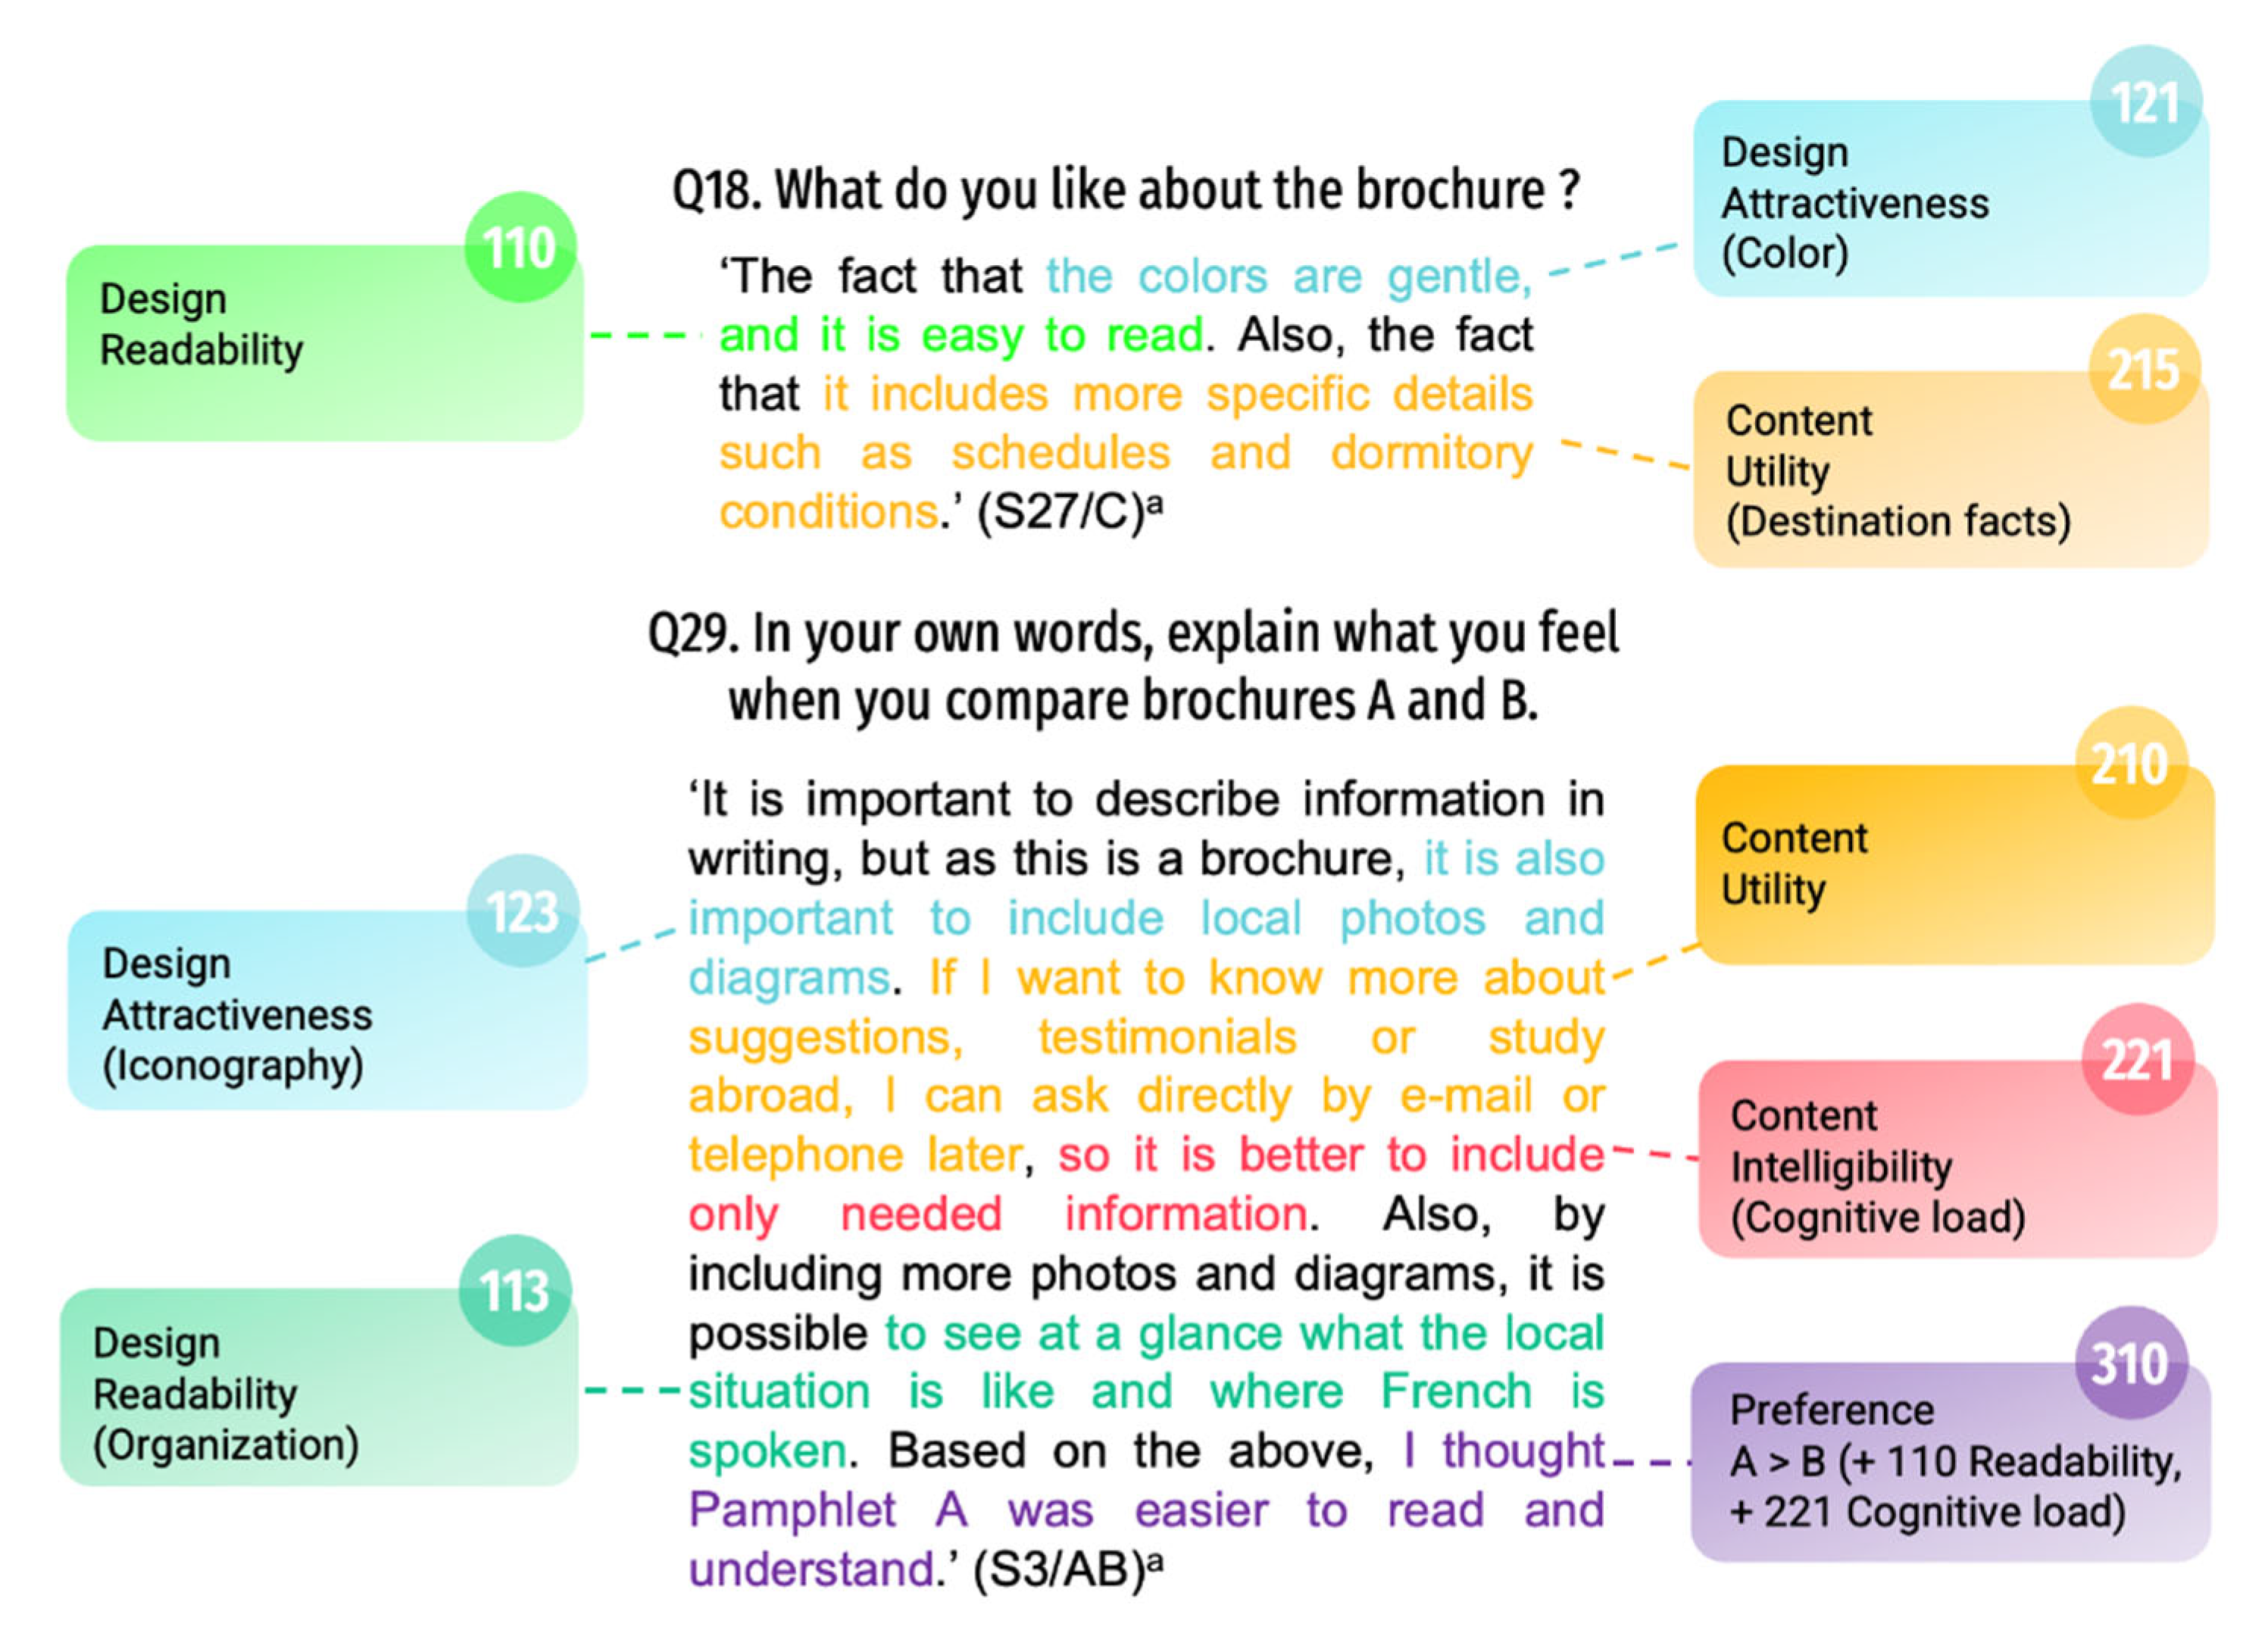
As the examples below show, coding always presents challenges because some responses contain multiple units of meaning related to different categories pertaining to one or more themes (Figure 6).

3. Results

3.1. Utility/Content

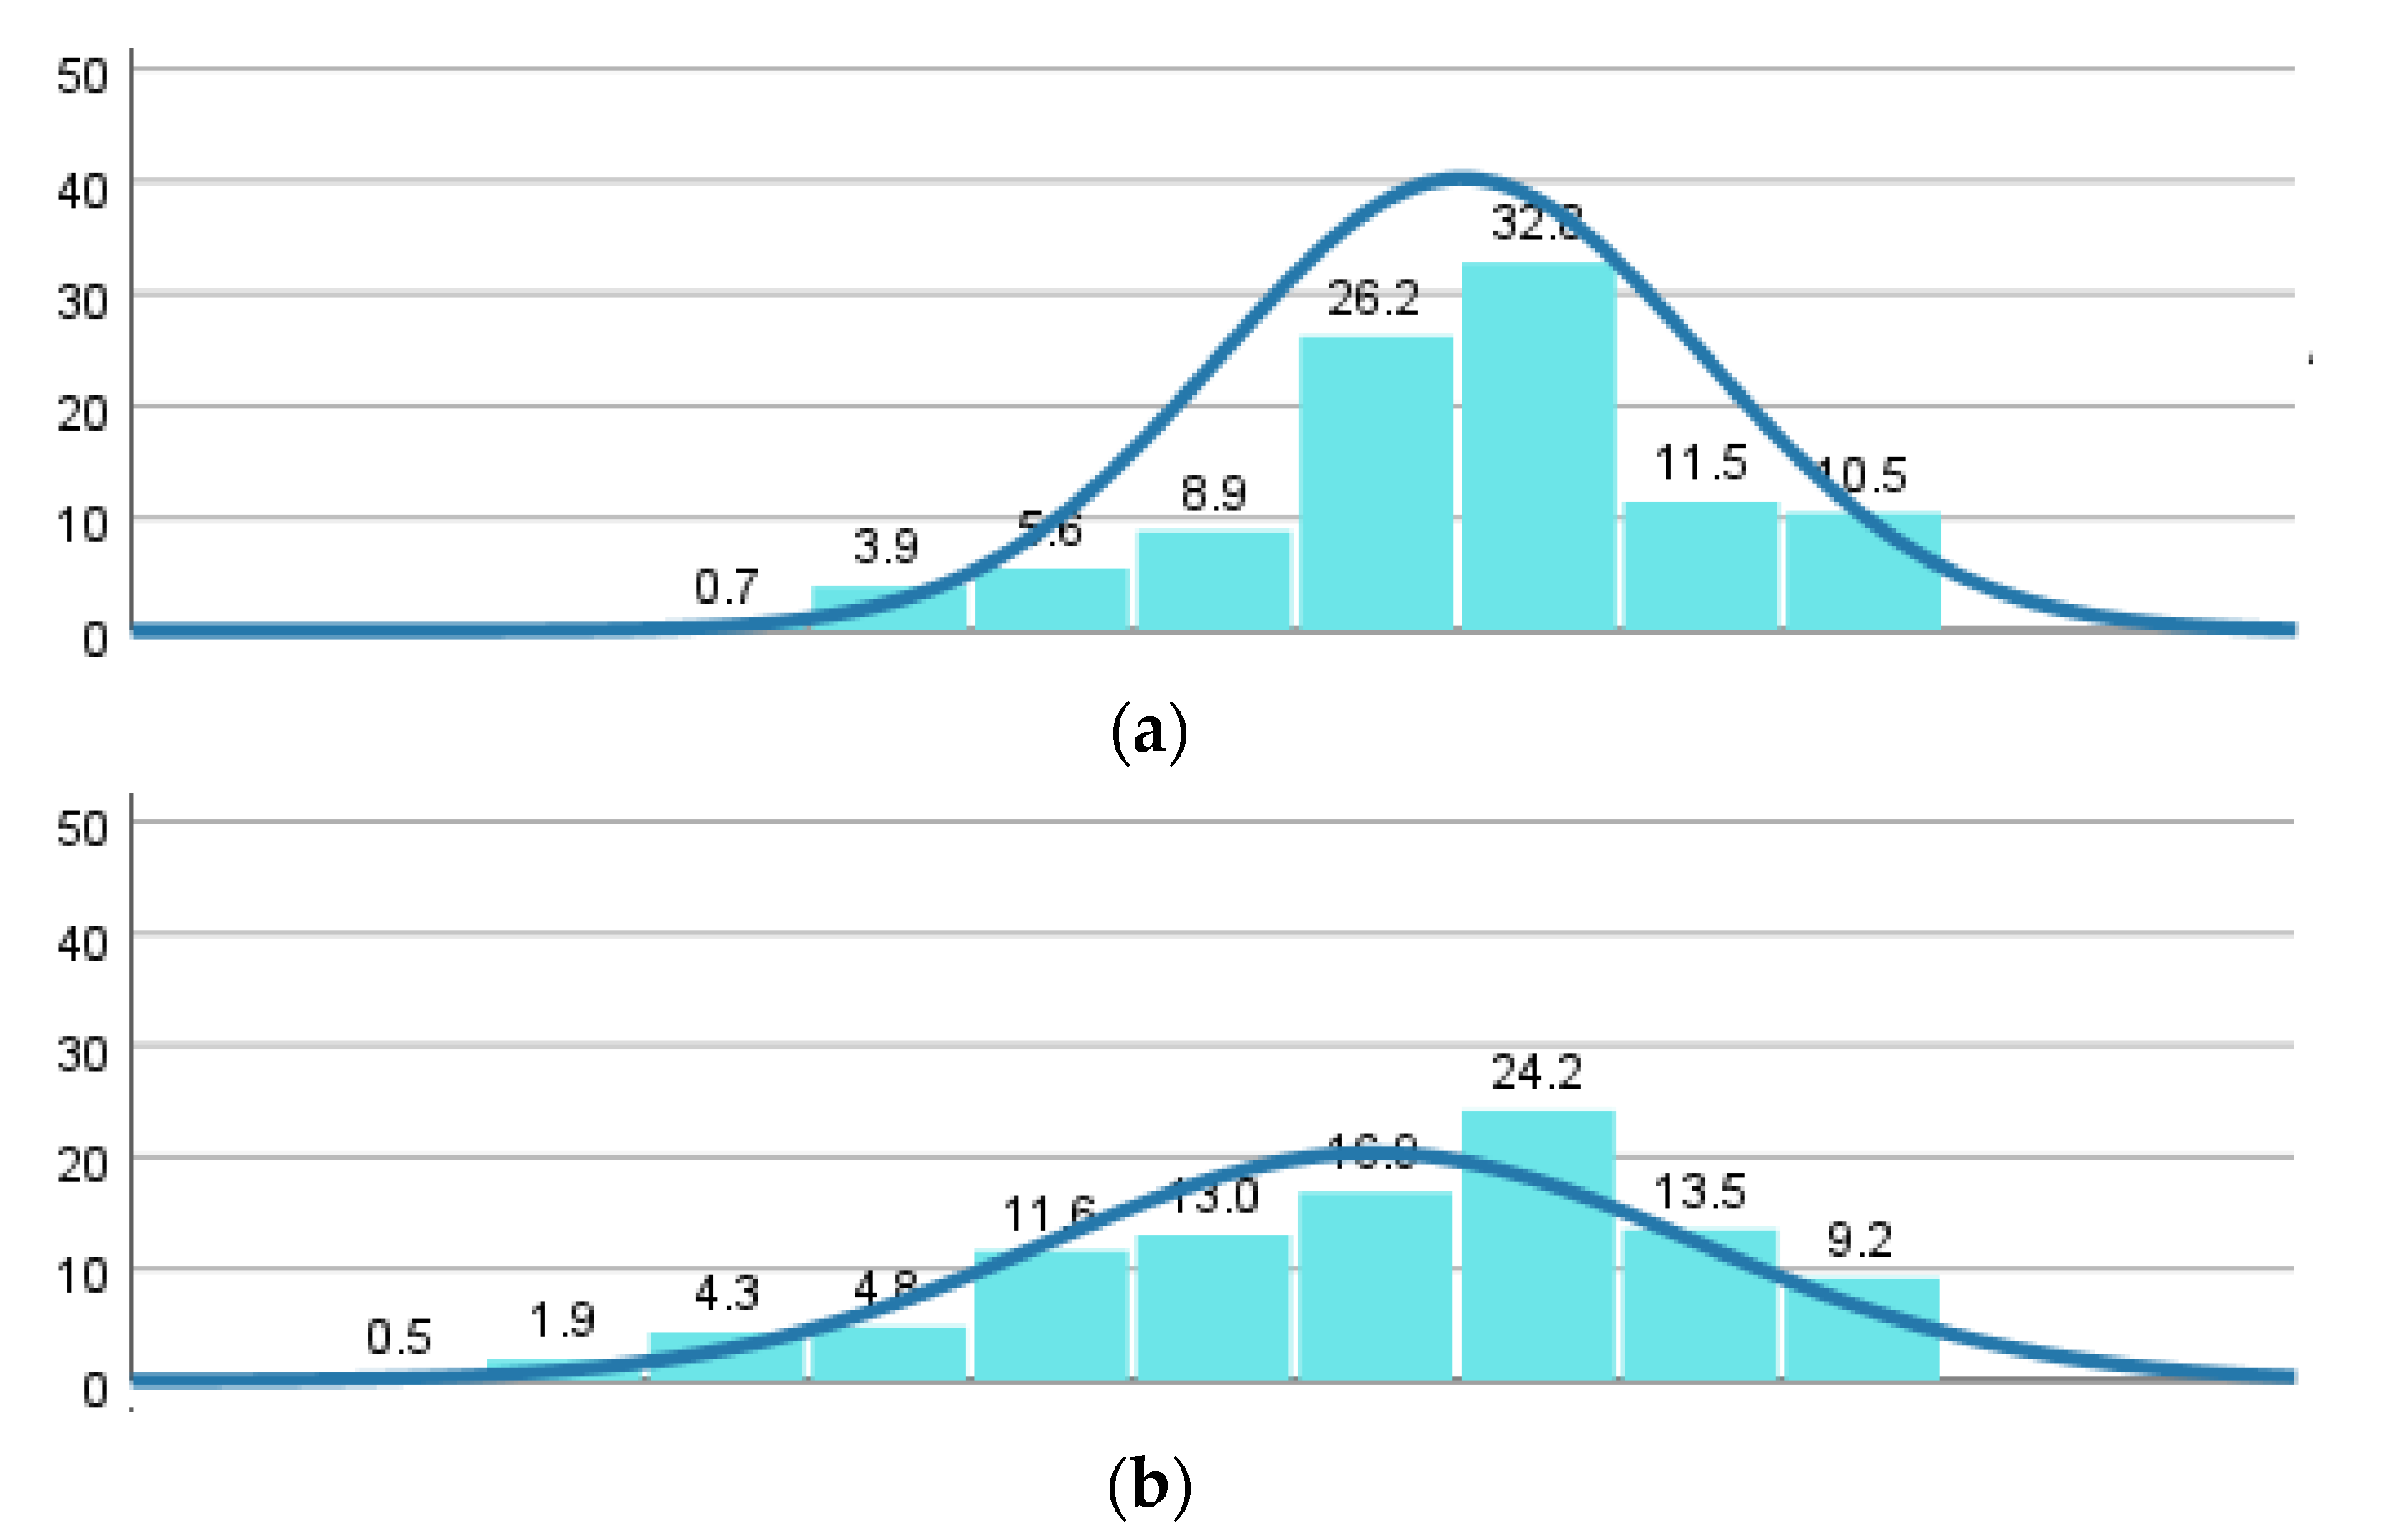
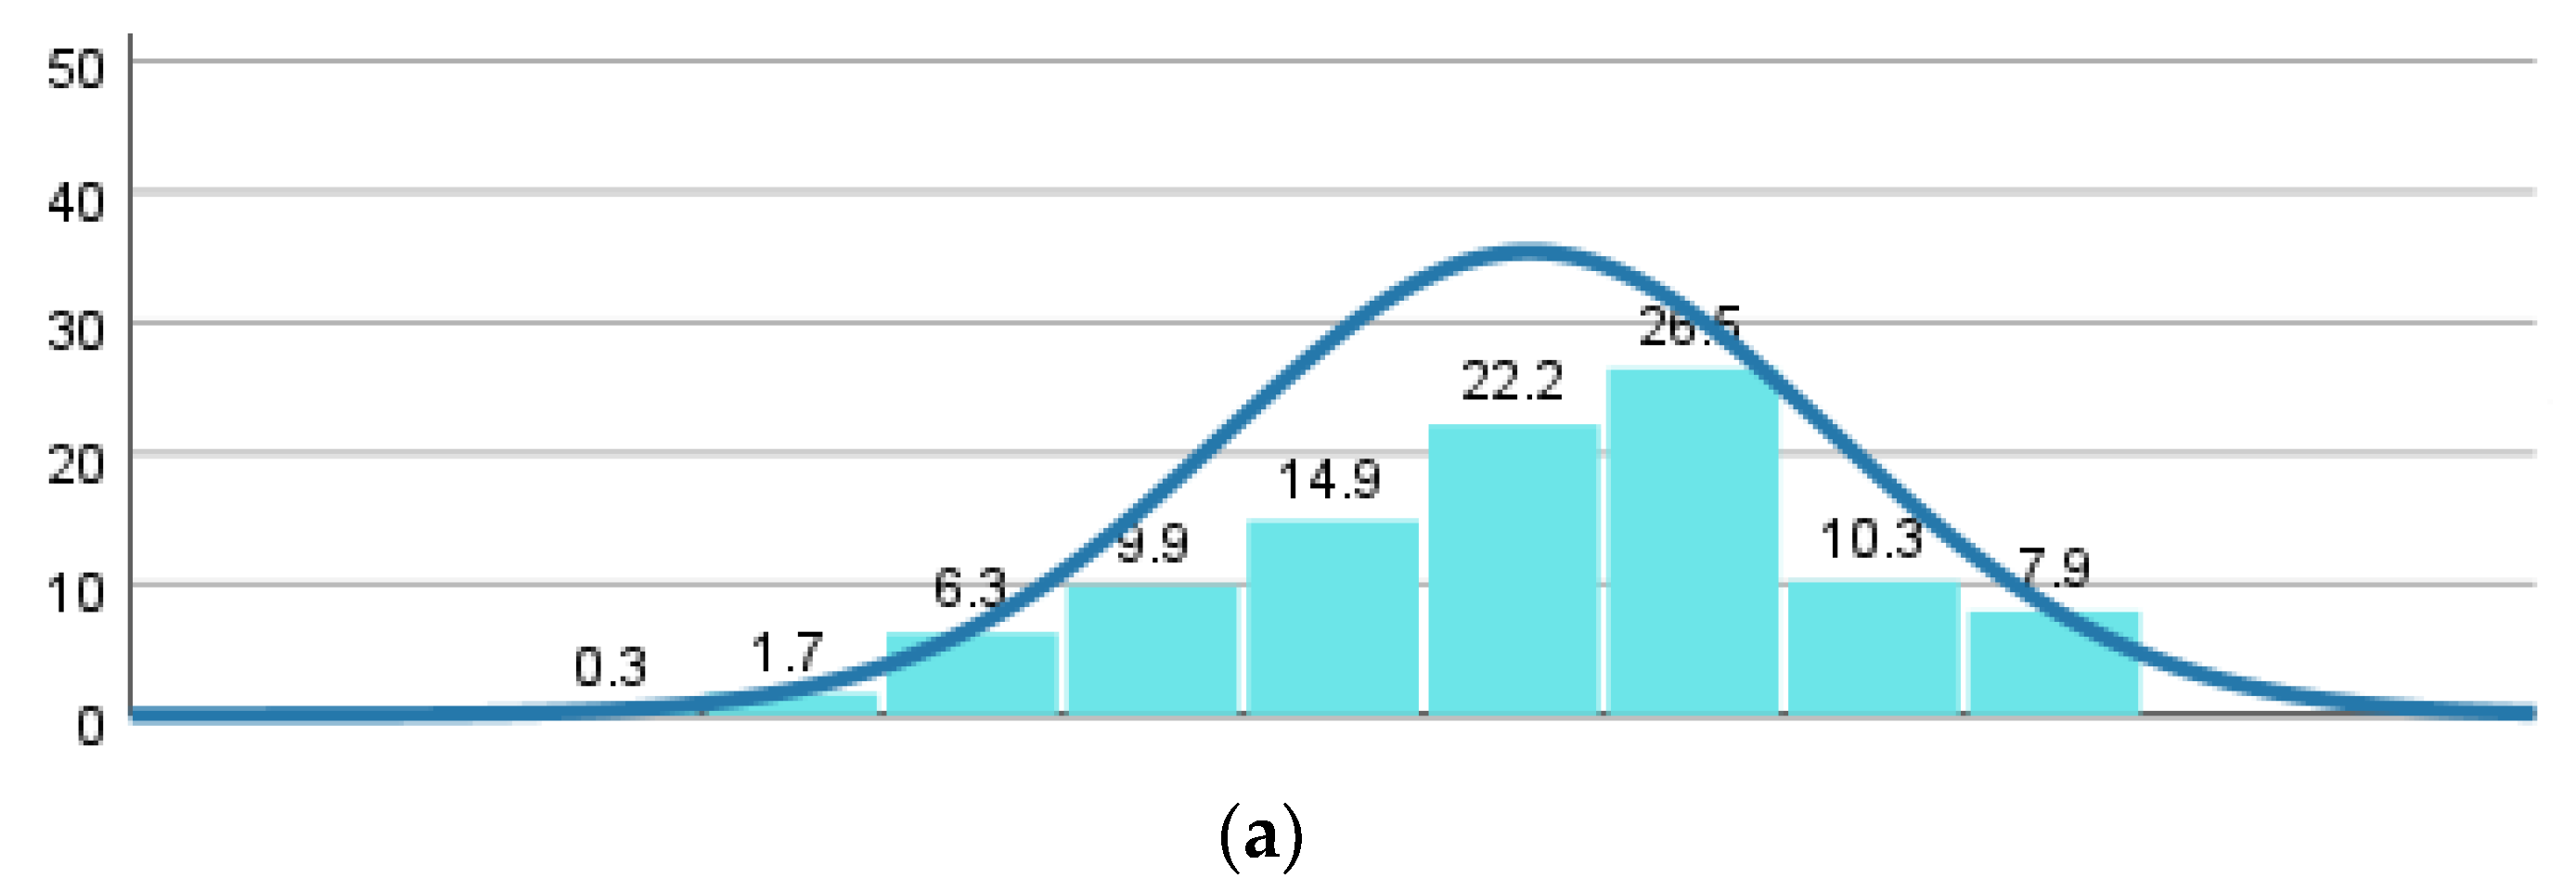
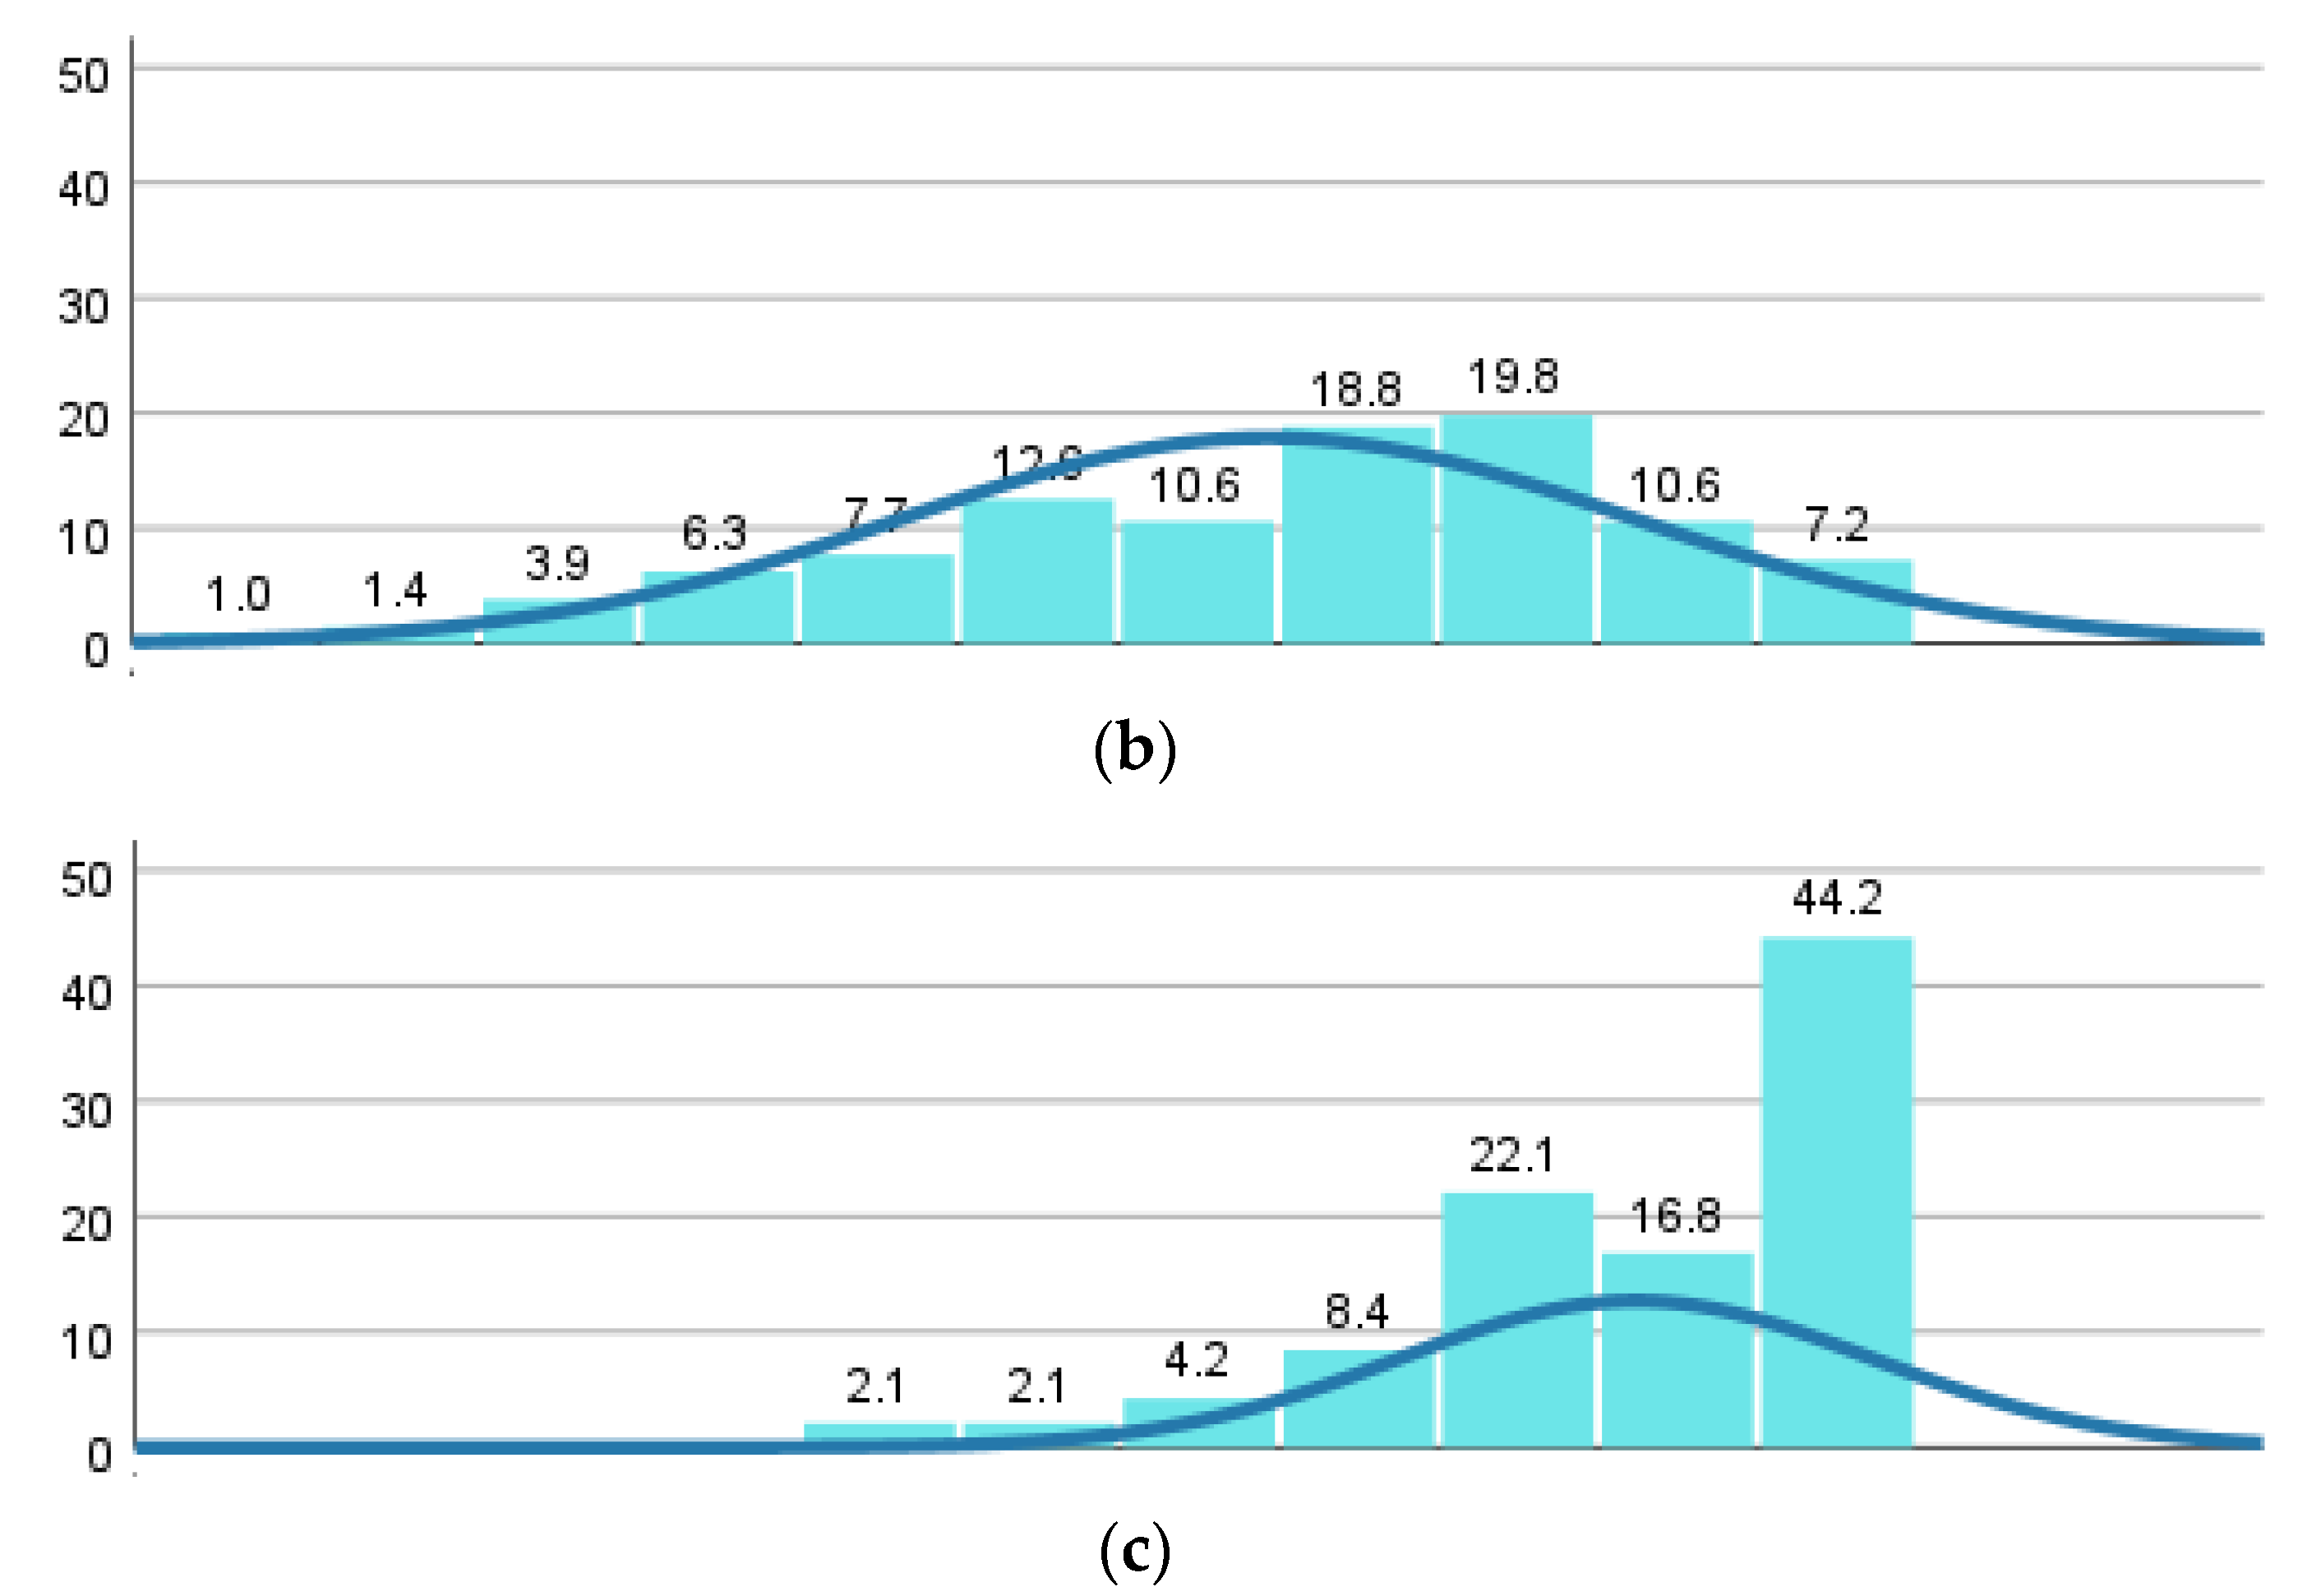
Histograms grouping distributions of scores on utility (Figure 7) show that the original brochure (A) was from the outset viewed as useful; the distribution curve is set on the right side (M = 7.53, SD = 1.493). However, the prototype histogram curve (B) is widely spread over the Y axis, accounting for much variation in appraisal (M = 6.98, SD = 2.002), and is seen as comparatively less useful than the original brochure.
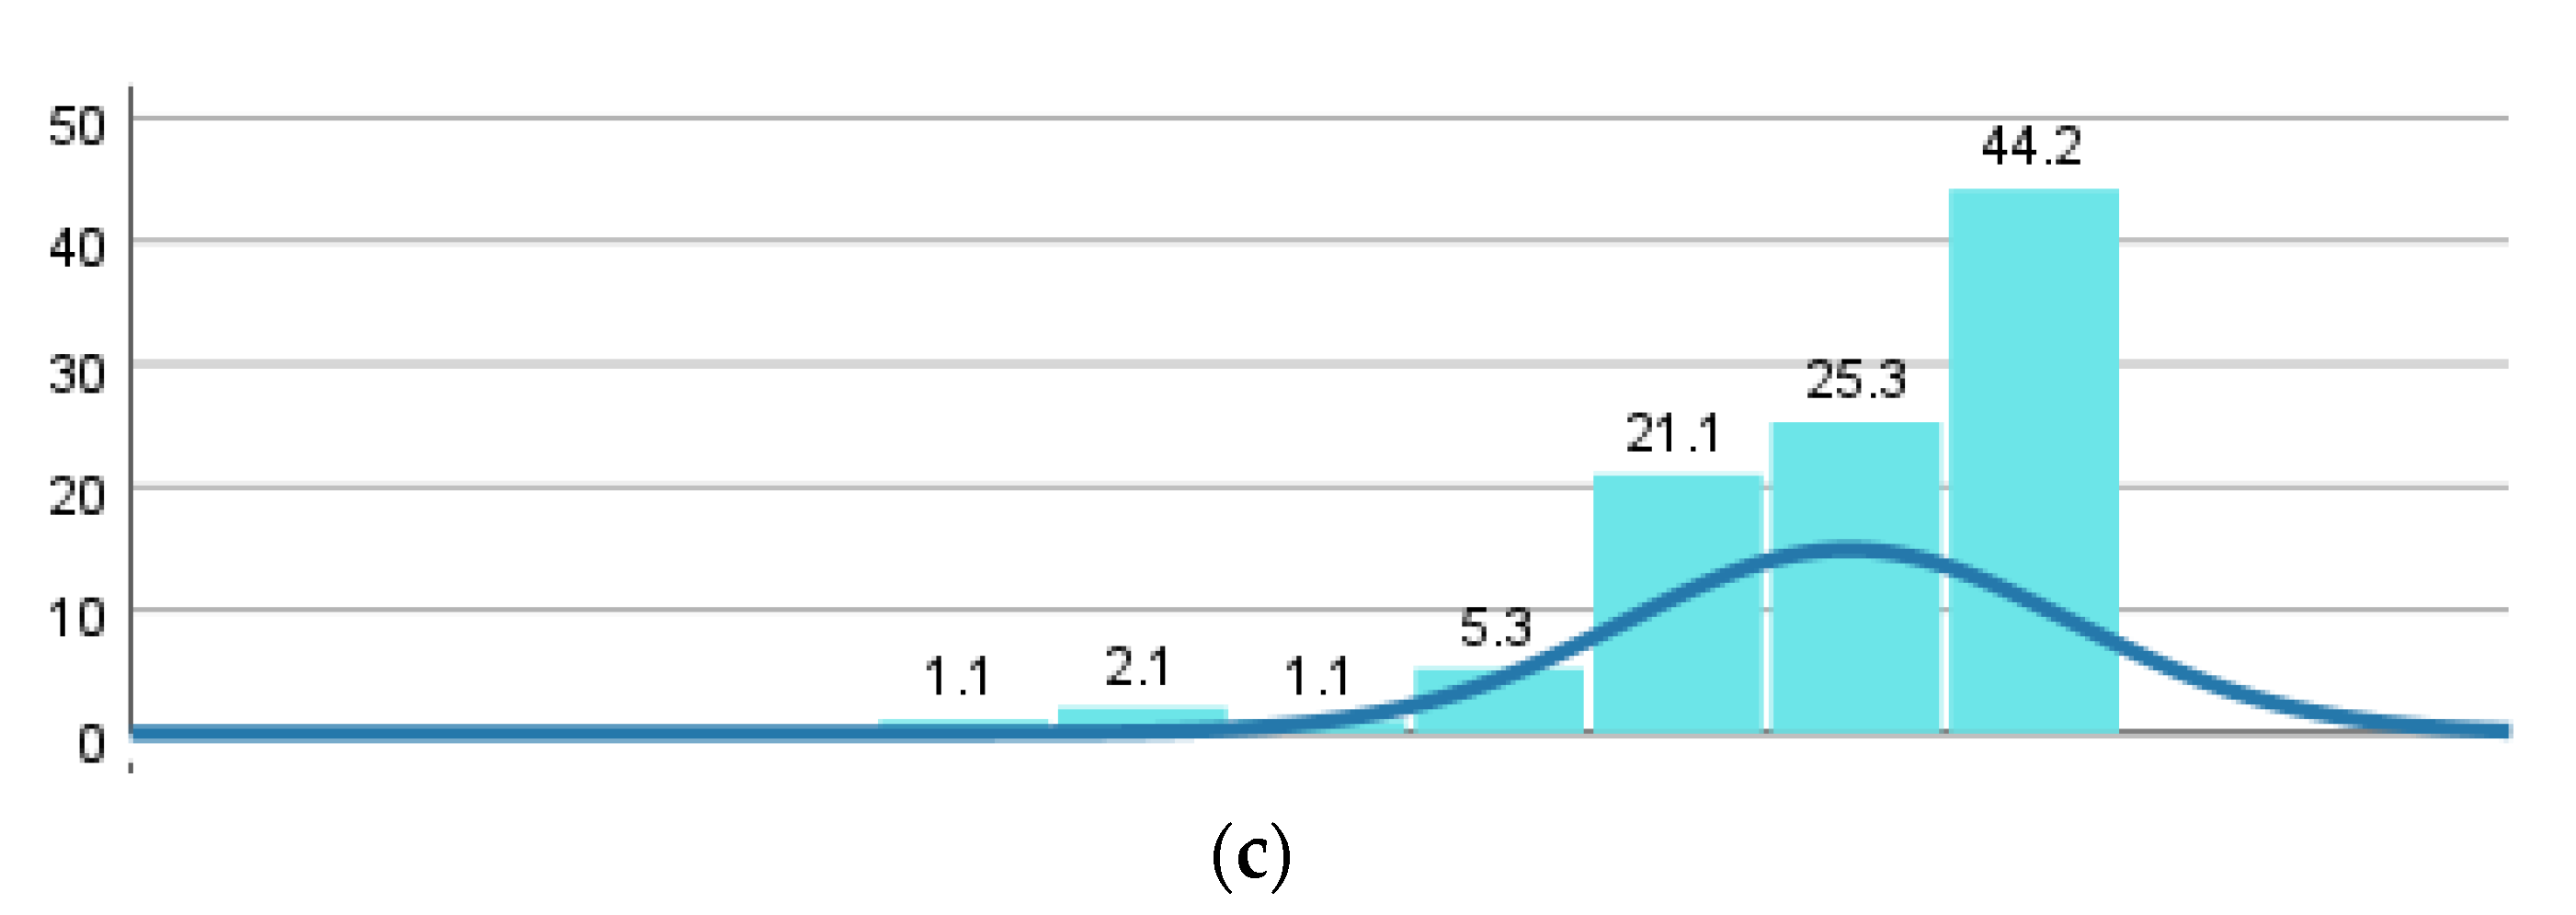
The histogram for the final product (C) tells a different story. Utility scored high on the scale; the histogram skewed to the left (M = 8.96, SD = 1.254) with a notable peak at rating score 10 (44.2%). These figures show that students favorably rated the final product. Furthermore, they found the prototype comparatively less useful, even less so than the original product.
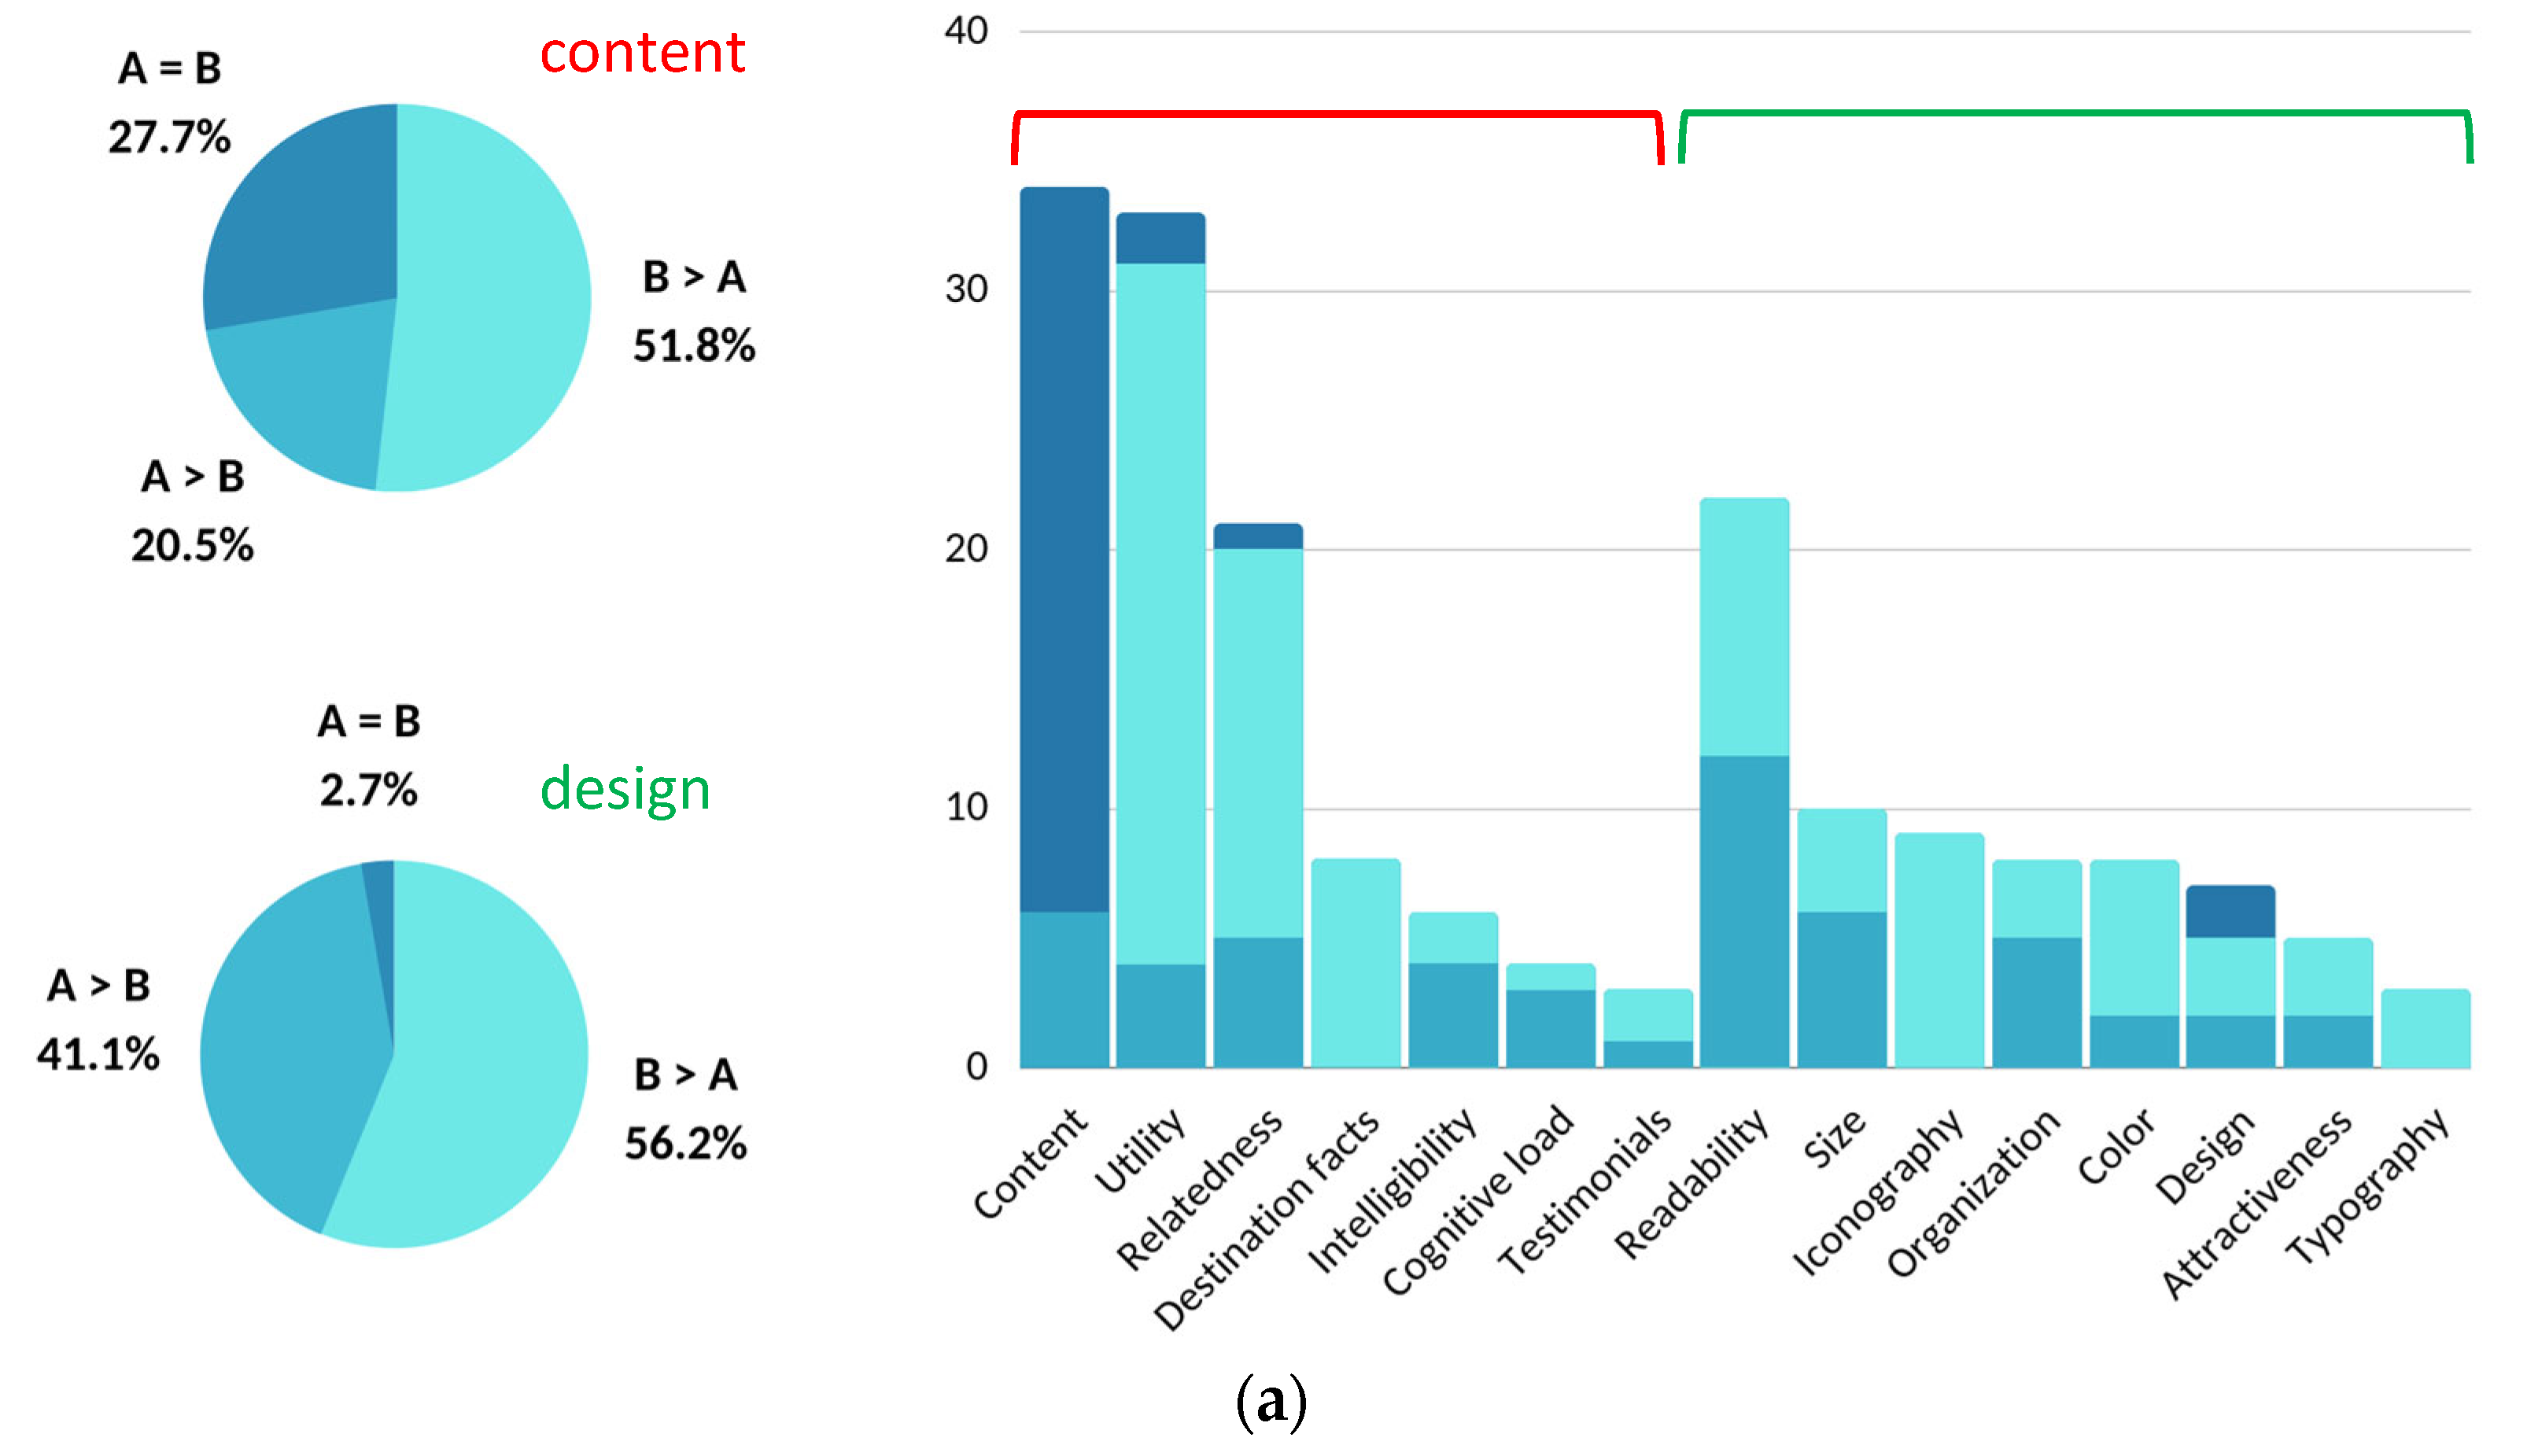
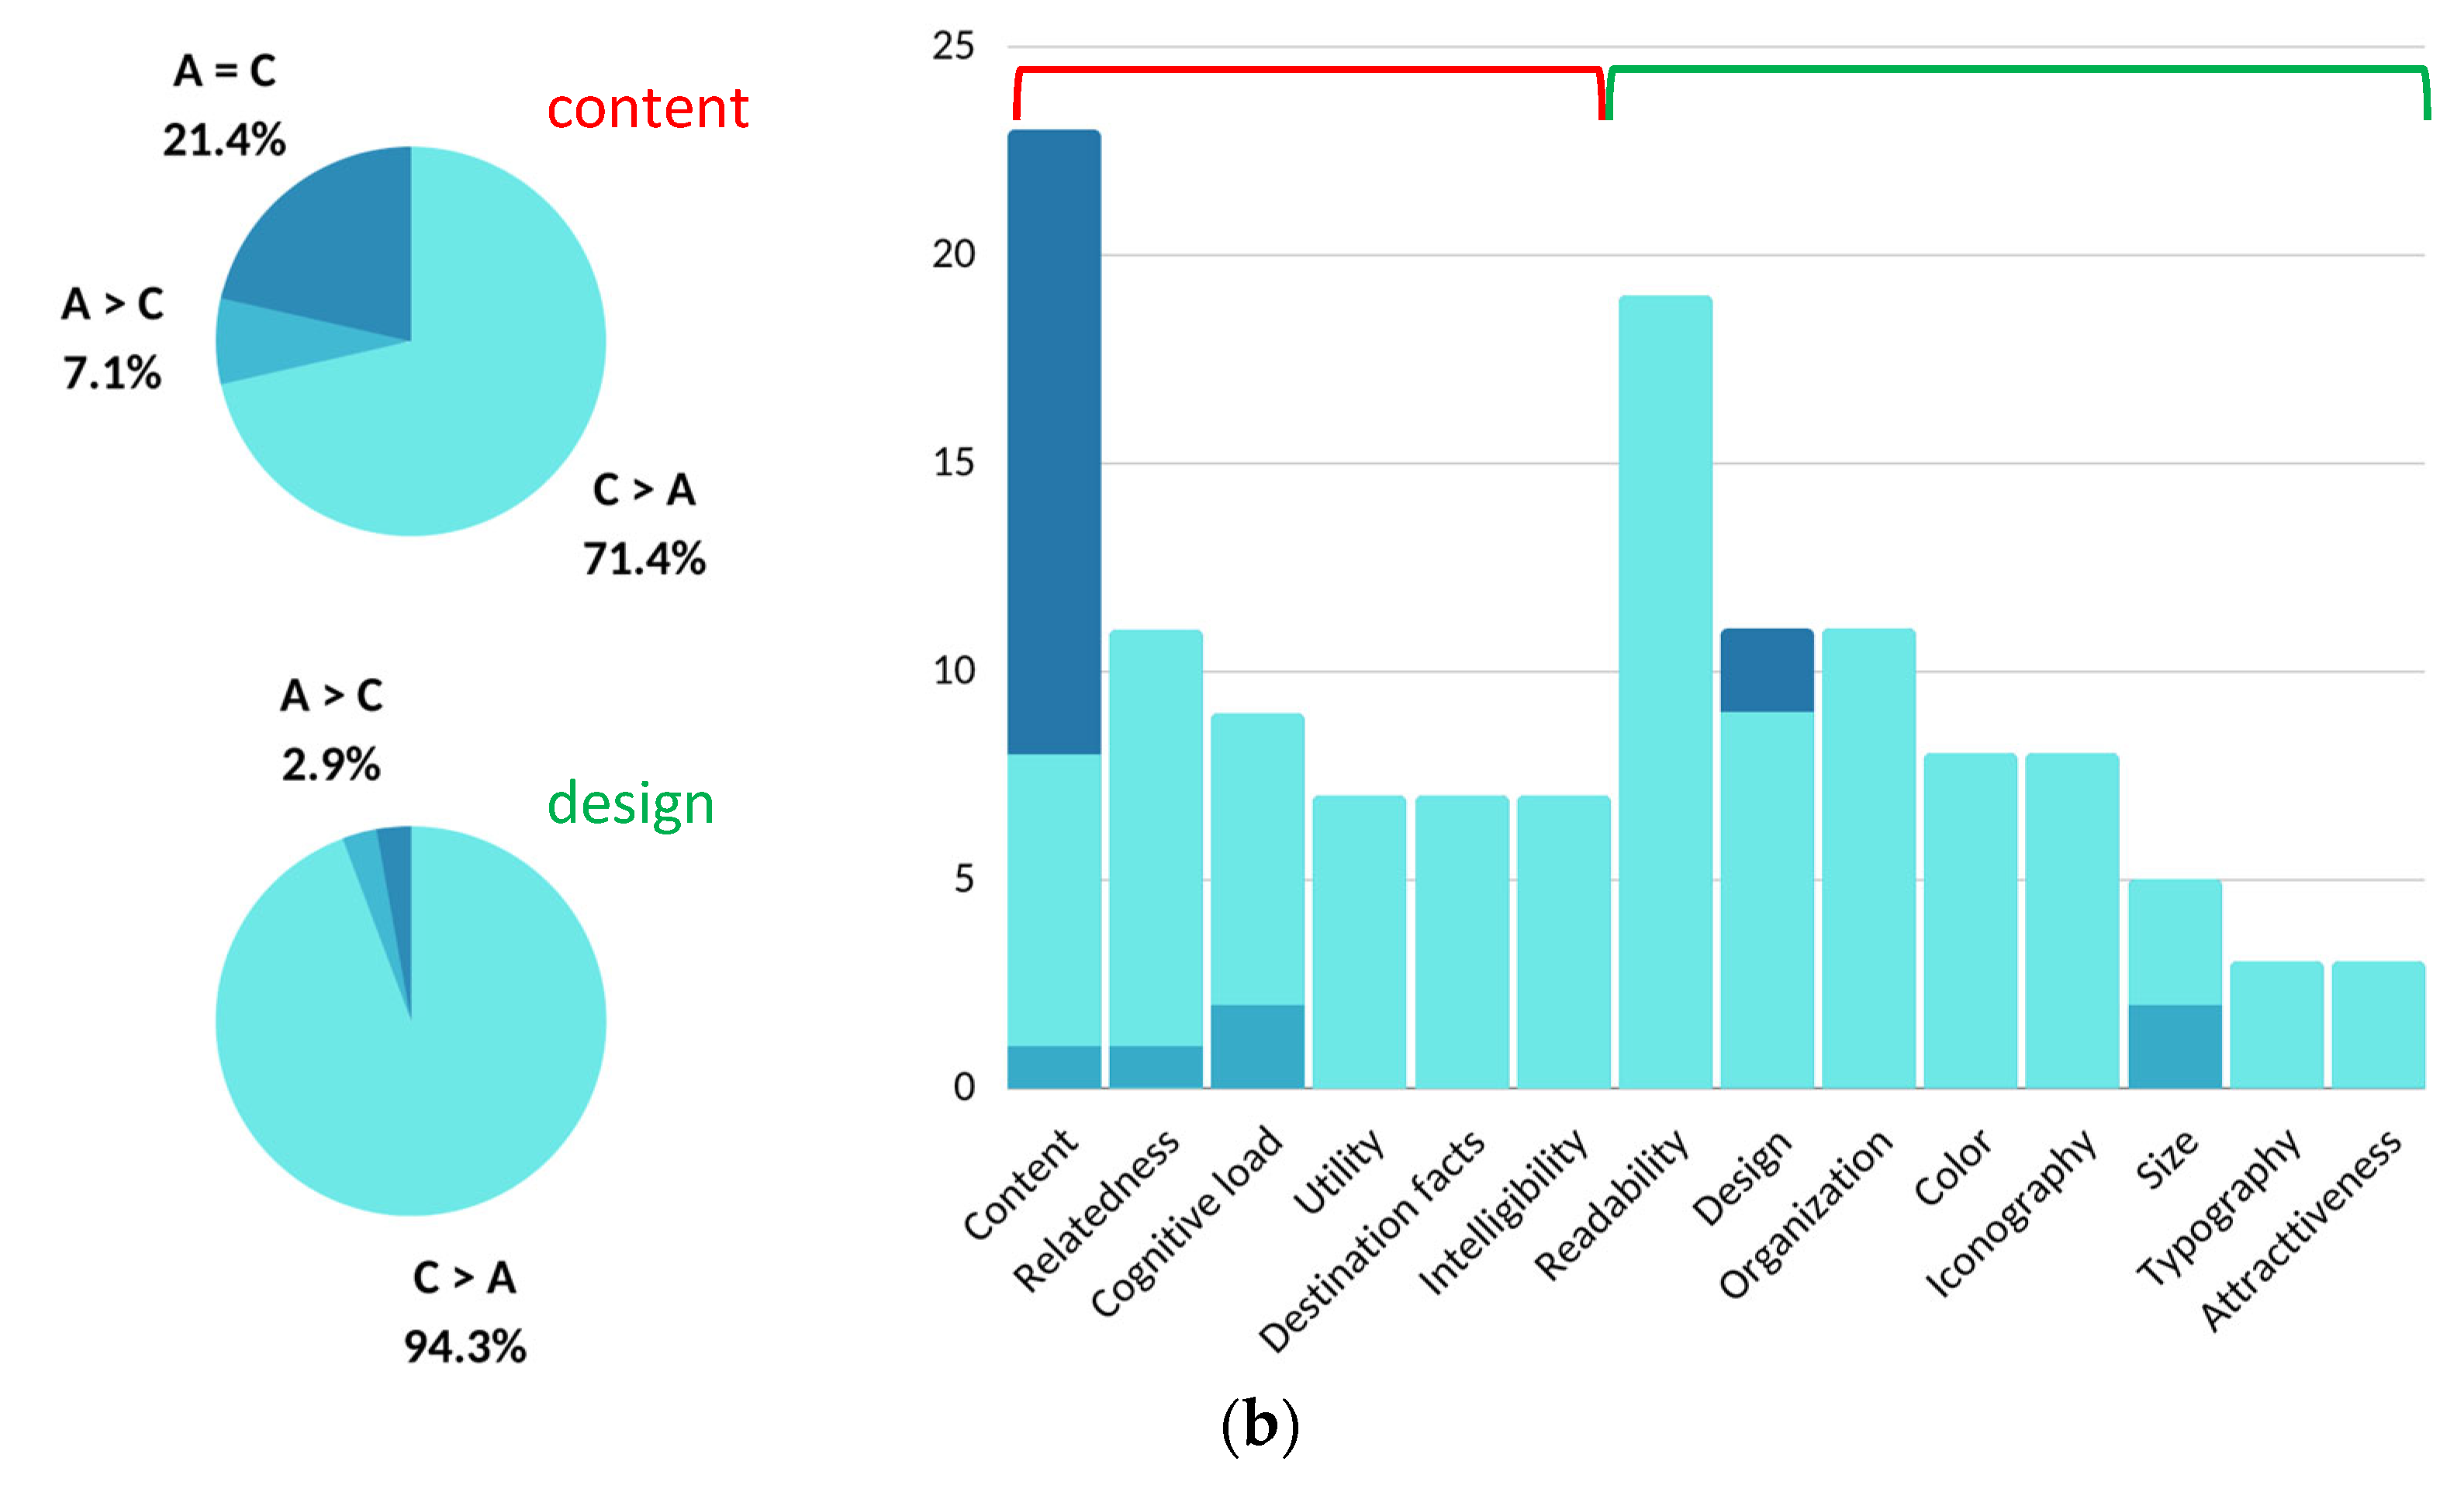
A closer look at the qualitative data reveals that students’ responses are more nuanced than when ranking their experience solely on an 11-point scale. For example, the upper pie charts and the left side of the stacked bar charts in Figure 8a,b relate to content (or utility). Overall, half of the items linked to utility are in favor of the prototype (51.8%), the other half divided between a preference for the original (20.5%) and equal appreciation of both products (27.7%). In line with the histogram in Figure 7, there is a notable leap in appreciation of the final product’s content (71.4%) over the original (C > A); the remaining assessments split between a preference for the original (A > C, 7.1%) and equal appreciation of both products (A = C, 21.4%). What this conveys is that, following the first survey, amendments made to the brochure in terms of content were significant enough that students’ assessment of utility over the original brochure would rise by 19.6% (71.4% vs. 51.8%) when viewing the final product.
Specific comments made on content have been sorted into categories and subcategories. What is most striking in the bar charts of both Figure 8a and Figure 8b is that content issues (utility, relatedness, destination facts, etc.) pertaining to the prototype (A > B) have been mostly resolved in the final product giving it primacy over the original product (C > A). This confirms the findings in the histogram regarding appraisal of content in the final product (Figure 7) that DT steps 5 and 6 (prototype and testing) were decisive in improving the product. Appendix A provides samples of students’ responses informing the product review process on content from a macro-level perspective.

3.2. Usability/Design

As with the histograms on utility, those showing distributions of scores on usability (design) follow similar patterns (Figure 9). The graphs show that brochure A was, from the outset, viewed as rather well designed (M = 7.09, SD = 1.689). As with utility, the prototype histogram shows a similar distribution, spread largely over the scale, revealing pronounced disparities in appraisal of design compared with the original brochure (M = 6.44, SD = 2.293).
The histogram for the final product on usability benefits from the same elevated appraisal as the one on utility. Usability scored high on the scale; the histogram skewed to the left (M = 8.78, SD = 1.438) with a peak on score 10 (44.2%), coincidentally and precisely the same as with utility.
A closer examination of the qualitative data demonstrates that students’ replies are more complex than when ranked only on an 11-point scale. For example, if we refer again to Figure 8a,b, the most striking feature when juxtaposing both figures is the fact that issues of design reported in the first survey regarding the prototype (A > B) seem to have been entirely settled in the final product (C > A), except for ‘size’. Students gave the final product an overwhelming scoring in terms of design preference (94.3%) over the original product. This certainly reflects the work done by the professional designer to create a unified product based on the students’ responses to the initial survey, which confirms the functional role of low-fidelity prototyping to gather user feedback. Appendix B provides samples of students’ responses regarding design which were helpful to the product review process from a macro-level perspective.

4. Discussion

4.1. RQ 1. Is Low Fidelity Prototyping in Design Thinking Effective in Enhancing Both the Utility and Usability of a Brochure?

To answer this question, we have looked at two sets of data from the survey: utility and usability. The findings above confirm the RQ1 assumption that lo-fi prototyping (vs. hi-fi prototyping) ensures sufficient quality feedback to improve the final product.
For this project, resorting to the making of a mock-up brochure, i.e., prototyping, was by far the most efficient means of collecting quick and precise feedback from the students before finalizing the brochure into a professionally made product. Students testing the prototype specified areas for improvement that the project administrators subsequentially asked a professional graphic designer to include in a final product. As mentioned above, improvements on utility and usability were largely reflected in the published brochure. Similarly, utility and usability were both given significantly higher scores on the Likert scales than the prototype and the original brochure (Figure 7 and Figure 9).
It is noteworthy that students made straightforward remarks concerning the poor quality of the prototype in terms of aesthetics. As one student pointed out regarding the prototype: ‘[…] while the design of the pamphlet shows that it has been updated to reflect recent trends, the use of default speech bubbles and other elements and the uncomfortable typography give it a strange, amateurish feel’ (S122/AB/Q29). Another student captured the discrepancy of professionalism between the in-house edited product (original brochure (A)) and the expert made product (final product (C)): ‘While A gave the impression of having been created by a university professor, C gave the impression of having been created by someone interested in design and composition’ (S42/AC/Q29). Typical comments of this sort, although dispersed throughout the survey, did not hinder students from making precise remarks related to both utility and usability. Wiklund et al. [38] have indeed shown that aesthetics do not influence perceptions of usability and this project’s simple—even ‘amateurish’—prototype, allowed for detailed feedback covering both aspects. In brief, numbers from Figure 7, Figure 8 and Figure 9 reveal that resorting to low-fidelity prototyping and testing it by end users has been an effective tool and efficient, in terms of time and costs, for the project administrators’ production of a final product better tailored to the students. In this respect, the lo-fi prototype fulfilled its purpose, which was not to gain approval from the end users as a completed product, but to act as a source of data for further improvement.

4.2. RQ 2. How Is DT Effective in Identifying and Mitigating Cognitive Biases?

When the administrators embarked on this project, they sensed that both administrators and academics lacked understanding of the needs of students who had gone or were planning to go abroad. Therefore, they conducted a series of empathy interviews (step 1, Understand) and used the findings to create life-size persona posters (step 2, Observe) for faculty and staff to absorb the visual and verbal data. When faculty and staff workgroups created the prototype brochure (step 5), it was suggested that all six personas be included as is. Unexpectedly, the survey results from end users regarding the prototype were noticeable in that personas were unpopular among potential users; it topped the list of elements least necessary (42.22%, Q21). Detailed responses of students on the following question 22 regarding the prototype (Q22: If you could change one thing about brochure B–prototype–, what would it be?) revealed that the main reason was linked to size (and by extension to cognitive load), i.e., there were too many personas. Out of the seventeen comments made on testimonials, nine (52.9%) suggested to reduce the number of personas, three (17.6%) recommended they be made more readable, two (11.7%) offered to have them entirely removed, and only one thought to have information added.
This led to a discussion among the researchers regarding the reasons that guided the project designers to incorporate the personas into the prototype when, initially, they were only meant to serve as a tool to help designers visualize the goals, desires, and needs of a typical user [28] (p. 97).
The researchers reached four points in the discussion.
Firstly, there was a possibility of an ego-centric empathy gap [8,10]; there was an overestimation of the similarity between the designers’ perspective and the people for whom the product was intended, in this case the students, who have a different psychological framing than the designers. Paradoxically, the personas created during empathy interviews may have led the designers to feel too much empathy toward the initial interviewees (step 1), making them overly eager to share the results with the potential users, and consequently making them lose sight of those users’ more immediate needs and concerns.
Secondly, in the same vein, forgoing the finalized persona posters felt like a loss of time and investment; humans are naturally loss averse, a cause of the “endowment effect” in which designers’ attachment to what they already have or made makes it more difficult to give it up in the interest of creating a more improved solution [39]. Furthermore, the designers’ lack of expertise likely caused them to miss the objectives of step 2 (observation), which were, at this point, primarily about gathering and documenting insights on user profiles and their needs (the personas) rather than producing a functional product.
However (third point considered), the ensuing prototype and surveys helped the team correct the ego-centric empathy gap and the endowment effect by acknowledging that users did not want to be shown all the persona data. They were then able to follow the recurrent advice to reduce the number of personas, retaining a single exemplar. This allowed them to decrease greatly the bulk of testimonials, lessen the reading load, and reorganize the content for improved legibility as suggested by respondents.
Finally, the “context mapping” exercise (step 3) indicated that students have little or no awareness of the support available upon their return from a study abroad sojourn; this backend feature, unknown to the audience, prompted the designers to add a section to the persona which shows returnees’ social support availability through counseling and on-campus social clubs. This addressed the core concern of the interviewed student who had experienced intense feelings of discomfort upon returning home prematurely due to COVID-19, and whose testimonial was kept in the final persona. It was also a “gut” feeling to include such information after talking to a traumatized student who had left a deep impression on the interviewers. They decided to inform students about returnee support in a society where seeking mental health support is still not the norm.
The survey result for the final product, which includes a single persona, was now less of an issue among users. However, tellingly, four comments (22.2% of Q21 responses on the final product, down from 42.22% of Q21 responses on the prototype) still pointed to testimonials as the least necessary element in the final brochure. Nonetheless, the project designers decided to keep the work to show that support is available for students who need it before and after studying abroad. The issue goes back to the difference between what designers do (i.e., invent) and analysts do (i.e., seek and understand data). Had the six personas not been included in the prototype, the designers would not have known it would be highly unpopular, and they would never have ended up keeping the one and final persona which mattered.
The question remains at large: are the designers still suffering from an ego-centric empathy gap when insisting on including the persona element? Suppose the designers take negative feedback from end users and incorporate it into the product by eliminating the feature. They then subscribe to the design thinking adage to listen to the end user. On the other hand, if they ignore the data because they have additional data that users are not privy to, they are closer to taking a “designerly” stance, as demonstrated by Nintendo and Apple, who famously ignore user input [40]. In the end, a balanced approach was considered as a viable means of designing the product.

5. Conclusions

This study determined that low fidelity prototyping using design thinking methodology was effective in enhancing both the utility and usability of a brochure. End-user surveys endorsing mixed methods that yielded both qualitative and quantitative evidence were used.
The study focused on the effects of DT on low-fidelity prototyping in HEI when creating a specific product for its students. Although the above discussion targeted one item, personas, excluding an in-depth and detailed exploration of all categories and subcategories that would have unnecessarily lengthened this paper, the case on personas substantiates quantitative results by exemplifying how low-fidelity prototyping was effective in eliciting detailed information from the survey respondents. The quality and quantity of responses allowed the designers to implement end users’ recommendations following the user-experiment phase (step 6 testing). Both utility and usability were positively impacted by the feedback.
The study findings not only provide evidence for the efficacy of DT prototyping but also show that interaction with potential users (testing the prototype) yields superior outputs than when a product is entirely in-house-made by internal stakeholders. The recommendation that stems from this insight is that documenting the opinions and experiences of students that have been abroad (step 1, empathizing) and of potential users, i.e., students who have not yet participated in study abroad programs (step 6, testing), helps decision makers check their assumptions, learn faster, and make informed decisions that lead to innovative solutions, not just solutions reached through incidental and incremental gains.
However, this study harbored several limitations which included: (i) Out-of-field project managers and researchers: the administrators of the project and investigators in the study were not specialists of DT; they, respectively, used and analyzed DT for the first time; the lack of experience may have affected the overall DT process, finer areas of implementation of DT tools, and their analysis. More experience might have yielded different outcomes. (ii) Time: DT is supposed to help accelerate designing processes, but the project was assigned to staff and faculty burdened by other responsibilities who took their time with the DT process; the span of 17 months might have also affected outcomes. (iii) Uneven HR personnel participation: personnel engagement from concerned administrations was unregular; the study has not assessed how the collective input influenced the prototype. (iv) Survey research: the study does not tell us if low-fidelity prototyping through DT is more or less effective than other design methods apart from the in-house designing done until then. Such limitations should be considered when assessing the present study.
Finally, it remains to be assessed whether this new rendering of the promotional brochure will effectively incite Japanese students to study abroad in French speaking countries and have a noticeable impact on the number of outbound students and, by the same token, effectually contribute to the university’s general internationalization efforts.

Author Contributions

Conceptualization, methodology, M.K.S. and B.J.; software, B.J.; validation, M.K.S. and T.Y.; formal analysis, B.J.; investigation, M.K.S. and B.J.; resources, M.I.; data curation, M.K.S., B.J. and T.Y.; writing—original draft preparation, M.K.S., B.J. and T.Y.; writing—review and editing, M.K.S., B.J., T.Y. and M.I.; supervision, M.K.S.; project administration, B.J. and M.I. All authors have read and agreed to the published version of the manuscript.

Funding

The project was subsidized by the Center for Education of Global Communication (CEGLOC) as a part of the three year “Educational Strategy Promotion Project Support Program” (2020–2022) at the University of Tsukuba in collaboration with the Bureau of Global Initiatives and the Student Support Center.

Institutional Review Board Statement

This study did not require ethical approval.

Informed Consent Statement

Informed consent was obtained from all subjects involved in the study.

Data Availability Statement

All data can be obtained from the corresponding author.

Conflicts of Interest

The authors declare no conflict of interest.

Appendix A

Figure A1. Macro-level analysis of student responses on content (sample). S = Student ID number, A = original brochure, B = prototype, C = final brochure.
Education 13 00053 g0a1

Appendix B

Figure A2. Macro-level analysis of student responses on design (sample). S = Student ID number, A = original brochure, B = prototype, C = final brochure.
Education 13 00053 g0a2

References

  1. Black, A. Visible planning on paper and on screen: The impact of working medium on decision-making by novice graphic designers. Behav. Inf. Technol. 1990, 9, 283–296. [Google Scholar] [CrossRef]
  2. Landay, J.A.; Myers, B.A. Sketching interfaces: Toward more human interface design. Computer 2001, 34, 56–64. [Google Scholar] [CrossRef] [Green Version]
  3. Wong, Y.Y. Rough and ready prototypes: Lessons from graphic design. In Proceedings of the Posters and Short Talks of the 1992 SIGCHI Conference on Human Factors in Computing Systems, Monterey, CA, USA, 3–7 May 1992; pp. 83–84. [Google Scholar] [CrossRef] [Green Version]
  4. Newman, M.W.; Landay, J.A. Sitemaps, storyboards, and specifications: A sketch of web site design practice. In Proceedings of the 3rd Conference on Designing Interactive Systems: Processes, Practices, Methods, and Techniques, New York, NY, USA, 17–19 August 2000; pp. 263–274. [Google Scholar] [CrossRef]
  5. Nissinen, T. User Experience Prototyping—A Literature Review. Bachelor’s Thesis, University of Oulu, Oulu, Finland, 2015. [Google Scholar]
  6. Lim, Y.K.; Stolterman, E.; Tenenberg, J. The anatomy of prototypes: Prototypes as filters, prototypes as manifestations of design ideas. ACM Trans. Comput.-Hum. Interact. (TOCHI) 2008, 15, 1–27. [Google Scholar] [CrossRef]
  7. Nielsen, J. Usability 101: Introduction to Usability. Nielsen Norman Grp. 2012. Available online: https://www.nngroup.com/articles/usability-101-introduction-to-usability/ (accessed on 3 June 2022).
  8. Liedtka, J. Perspective: Linking design thinking with innovation outcomes through cognitive bias reduction. J. Prod. Innov. Manag. 2015, 32, 925–938. [Google Scholar] [CrossRef]
  9. Lande, M.; Leifer, L. Prototyping to learn: Characterizing engineering students’ prototyping activities and prototypes. In Proceedings of the ICED 09, the 17th International Conference on Engineering Design, Palo Alto, CA, USA, 24–27 August 2009; pp. 507–516. [Google Scholar]
  10. Van Boven, L.; Dunning, D.; Loewenstein, G. Egocentric empathy gaps between owners and buyers: Misperceptions of the endowment effect. J. Personal. Soc. Psychol. 2000, 79, 66. [Google Scholar] [CrossRef]
  11. Mariampolski, H. The power of ethnography. J. Mark. Res. Soc. 1999, 41, 1–12. [Google Scholar] [CrossRef]
  12. Knight, J. Internationalization: Elements and Checkpoints. CBIE Research, 1 January 1994. [Google Scholar]
  13. Knight, J. Internationalization: A decade of changes and challenges. International Higher Education, 9 January 2008. [Google Scholar] [CrossRef] [Green Version]
  14. Ota, H. Internationalization of higher education: Global trends and Japan’s challenges. Educ. Stud. Jpn. 2018, 12, 91–105. [Google Scholar] [CrossRef]
  15. Yonezawa, A. Challenges of the Japanese higher education amidst population decline and globalization. Glob. Soc. Educ. 2020, 18, 43–52. [Google Scholar] [CrossRef]
  16. Kuroda, K.; Sugimura, M.; Kitamura, Y.; Asada, S. Internationalization of Higher Education and Student Mobility in Japan and Asia; Background Paper for the 2019 Global Education Monitoring Report: Migration, Displacement, And Education; UNESCO: London, UK, 2018. [Google Scholar]
  17. JASSO. Results of the 2020 Survey of Japanese Students Studying Abroad. 2022, pp. 1–7. Available online: https://www.studyinjapan.go.jp/ja/_mt/2022/11/date2020n.pdf (accessed on 17 May 2022). (In Japanese).
  18. Gardner, L. Can design thinking redesign higher ed. The Chronicle of Higher Education, 10 September 2017; Volume 64. [Google Scholar]
  19. Reneau, C.M. Empathy by Design: The Higher Education We Now Need. In Achieving Equity in Higher Education Using Empathy as a Guiding Principle; IGI Global: Hershey, PA, USA, 2022; pp. 121–140. [Google Scholar]
  20. Vaugh, T.; Finnegan-Kessie, T.; Donnellan, P.; Oswald, T. The potential of design thinking to enable change in higher education. All Irel. J. High. Educ. 2020, 12, 3. [Google Scholar]
  21. Vaugh, T.; Finnegan-Kessie, T.; White, A.; Baker, S.; Valencia, A. Introducing Strategic Design in Education (SDxE): An approach to navigating complexity and ambiguity at the micro, meso and macro layers of Higher Education Institutions. High. Educ. Res. Dev. 2022, 41, 116–131. [Google Scholar] [CrossRef]
  22. IDEO Design Thinking. Available online: https://designthinking.ideo.com/ (accessed on 30 June 2022).
  23. Martin, R. The Design of Business: Why Design Thinking Is the Next Competitive Advantage; Harvard Business Press: Boston, MA, USA, 2009. [Google Scholar]
  24. Micheli, P.; Wilner, S.J.; Bhatti, S.H.; Mura, M.; Beverland, M.B. Doing design thinking: Conceptual review, synthesis, and research agenda. J. Prod. Innov. Manag. 2019, 36, 124–148. [Google Scholar] [CrossRef]
  25. Johansson-Sköldberg, U.; Woodilla, J.; Çetinkaya, M. Design thinking: Past, present, and possible futures. Creat. Innov. Manag. 2013, 22, 121–146. [Google Scholar] [CrossRef]
  26. Simon, H.A. The Sciences of the Artificial, Reissue of the Third Edition with a New Introduction by John Laird; MIT Press: Cambridge, MA, USA, 2019. [Google Scholar]
  27. Brown, T.; Wyatt, J. Design thinking for social innovation. Dev. Outreach 2010, 12, 29–43. [Google Scholar] [CrossRef] [Green Version]
  28. Lewrick, M.; Link, P.; Leifer, L. The Design Thinking Toolbox: A Guide to Mastering the Most Popular and Valuable Innovation Methods; John Wiley & Sons: Hoboken, NJ, USA, 2020. [Google Scholar]
  29. Bendig, A.W. Transmitted information and the length of rating scales. J. Exp. Psychol. 1954, 47, 303–308. [Google Scholar] [CrossRef] [PubMed]
  30. Garner, W.R. Rating scales. Discriminability and information transmission. Psychol. Rev. 1960, 67, 343–352. [Google Scholar] [CrossRef]
  31. O’Connor, C.; Joffe, H. Intercoder reliability in qualitative research: Debates and practical guidelines. Int. J. Qual. Methods 2020, 19, 1–13. [Google Scholar] [CrossRef]
  32. MacPhail, C.; Khoza, N.; Abler, L.; Ranganathan, M. Process guidelines for establishing intercoder reliability in qualitative studies. Qual. Res. 2016, 16, 198–212. [Google Scholar] [CrossRef]
  33. Campbell, J.L.; Quincy, C.; Osserman, J.; Pedersen, O.K. Coding in-depth semistructured interviews: Problems of unitization and intercoder reliability and agreement. Sociol. Methods Res. 2013, 42, 294–320. [Google Scholar] [CrossRef]
  34. Burla, L.; Knierim, B.; Barth, J.; Liewald, K.; Duetz, M.; Abel, T. From text to codings: Intercoder reliability assessment in qualitative content analysis. Nurs. Res. 2008, 57, 113–117. [Google Scholar] [CrossRef]
  35. Joffe, H.; Yardley, L. Content and thematic analysis. In Research Methods for Clinical and Health Psychology; Marks, D.F., Yardley, L., Eds.; Sage Publications: Southend Oaks, CA, USA, 2003; pp. 56–68. [Google Scholar]
  36. MacQueen, K.M.; McLellan, E.; Kay, K.; Milstein, B. Code- book development for team-based qualitative analysis. CAM J. 1998, 10, 31–36. [Google Scholar] [CrossRef]
  37. Ismailov, M.; Ono, Y. Assignment design and its effects on Japanese College Freshmen’s motivation in L2 emergency online courses: A qualitative study. Asia-Pac. Educ. Res. 2021, 30, 263–278. [Google Scholar] [CrossRef]
  38. Wiklund, M.E.; Thurrott, C.; Dumas, J.S. Does the fidelity of software prototypes affect the perception of usability? Proc. Hum. Factors Soc. Annu. Meet. 1992, 36, 399–403. [Google Scholar] [CrossRef]
  39. Kahneman, D.; Knetsch, J.L.; Thaler, R.H. Experimental tests of the endowment effect and the Coase theorem. J. Political Econ. 1990, 98, 1325–1348. [Google Scholar] [CrossRef] [Green Version]
  40. Verganti, R. Radical design and technology epiphanies: A new focus for research on design management. J. Prod. Innov. Manag. 2011, 28, 384–388. [Google Scholar] [CrossRef]
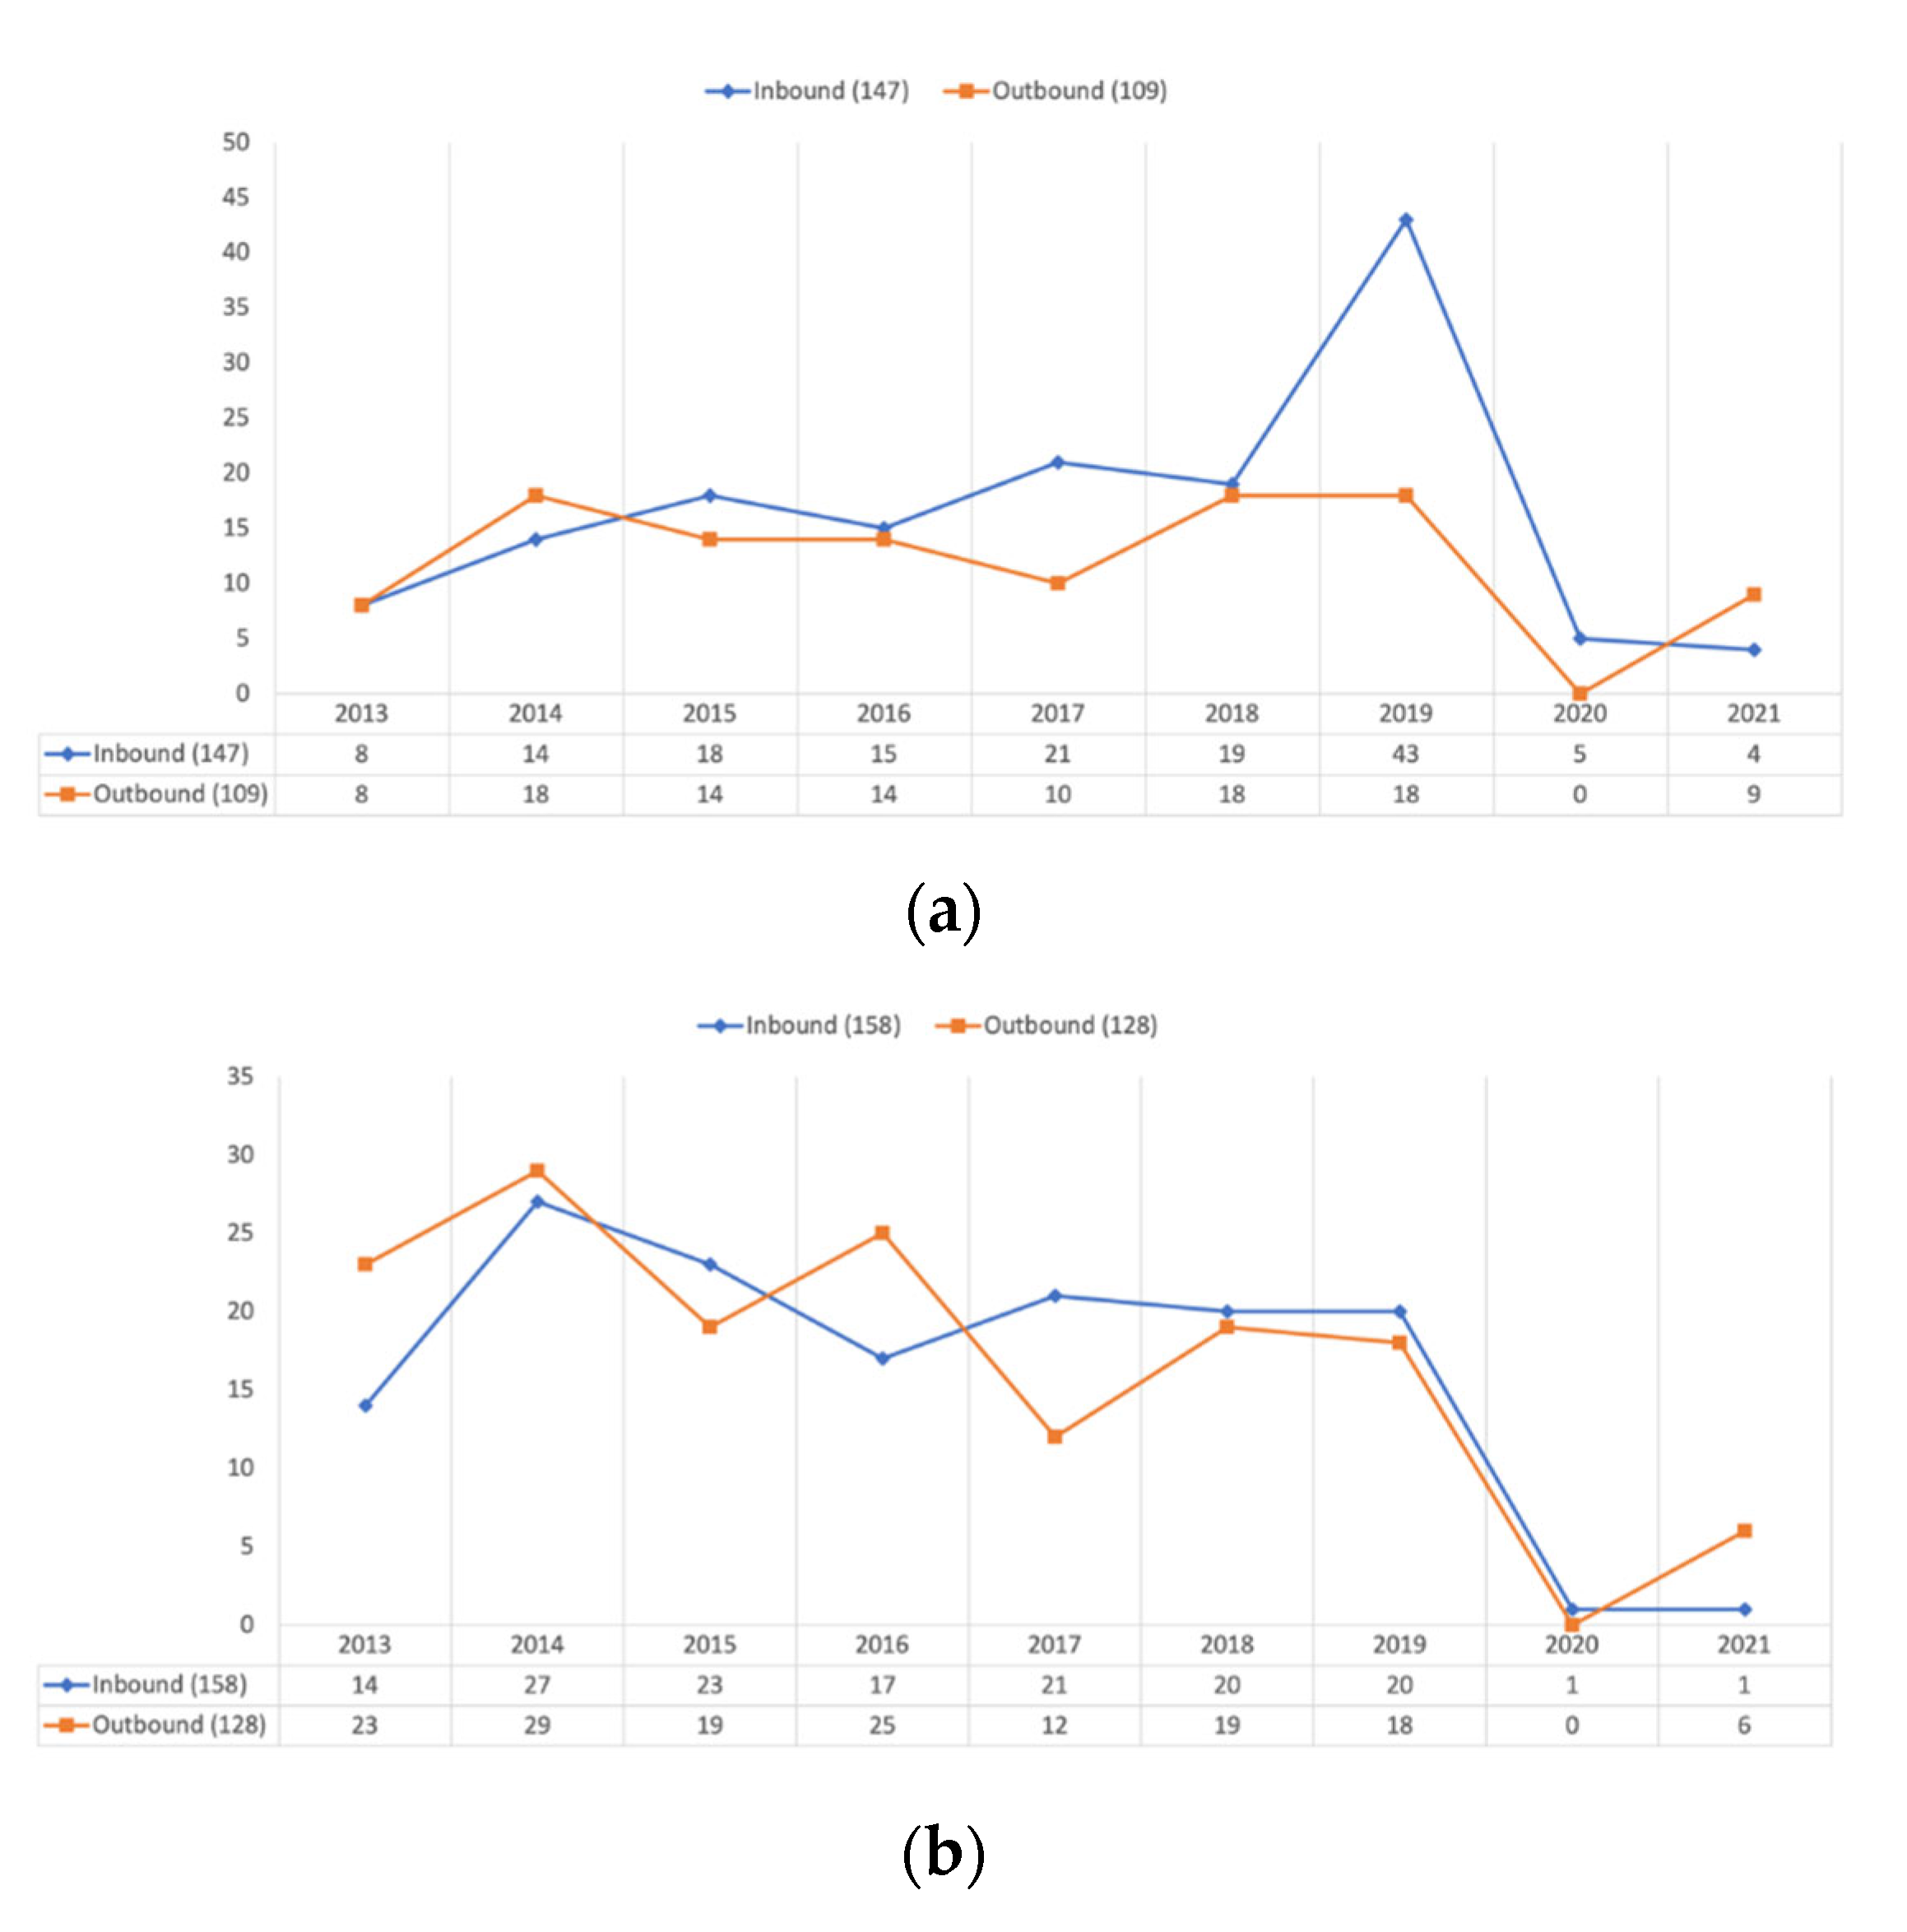
Figure 1. Student mobility between the University of Tsukuba and selected foreign universities: (a) French universities; (b) German universities. Data collected from the Bureau of Global Initiatives of the University of Tsukuba.
Education 13 00053 g001
Figure 2. Six Stages of Design Thinking.
Education 13 00053 g002
Figure 3. Brochure creation schedule. For descriptions of DT tools, see Lewrick and alt. [28] (empathy interview, p. 57; persona posters, p. 97; context mapping, p. 133; dot voting, p. 159; prototypes, p. 199).
Education 13 00053 g003
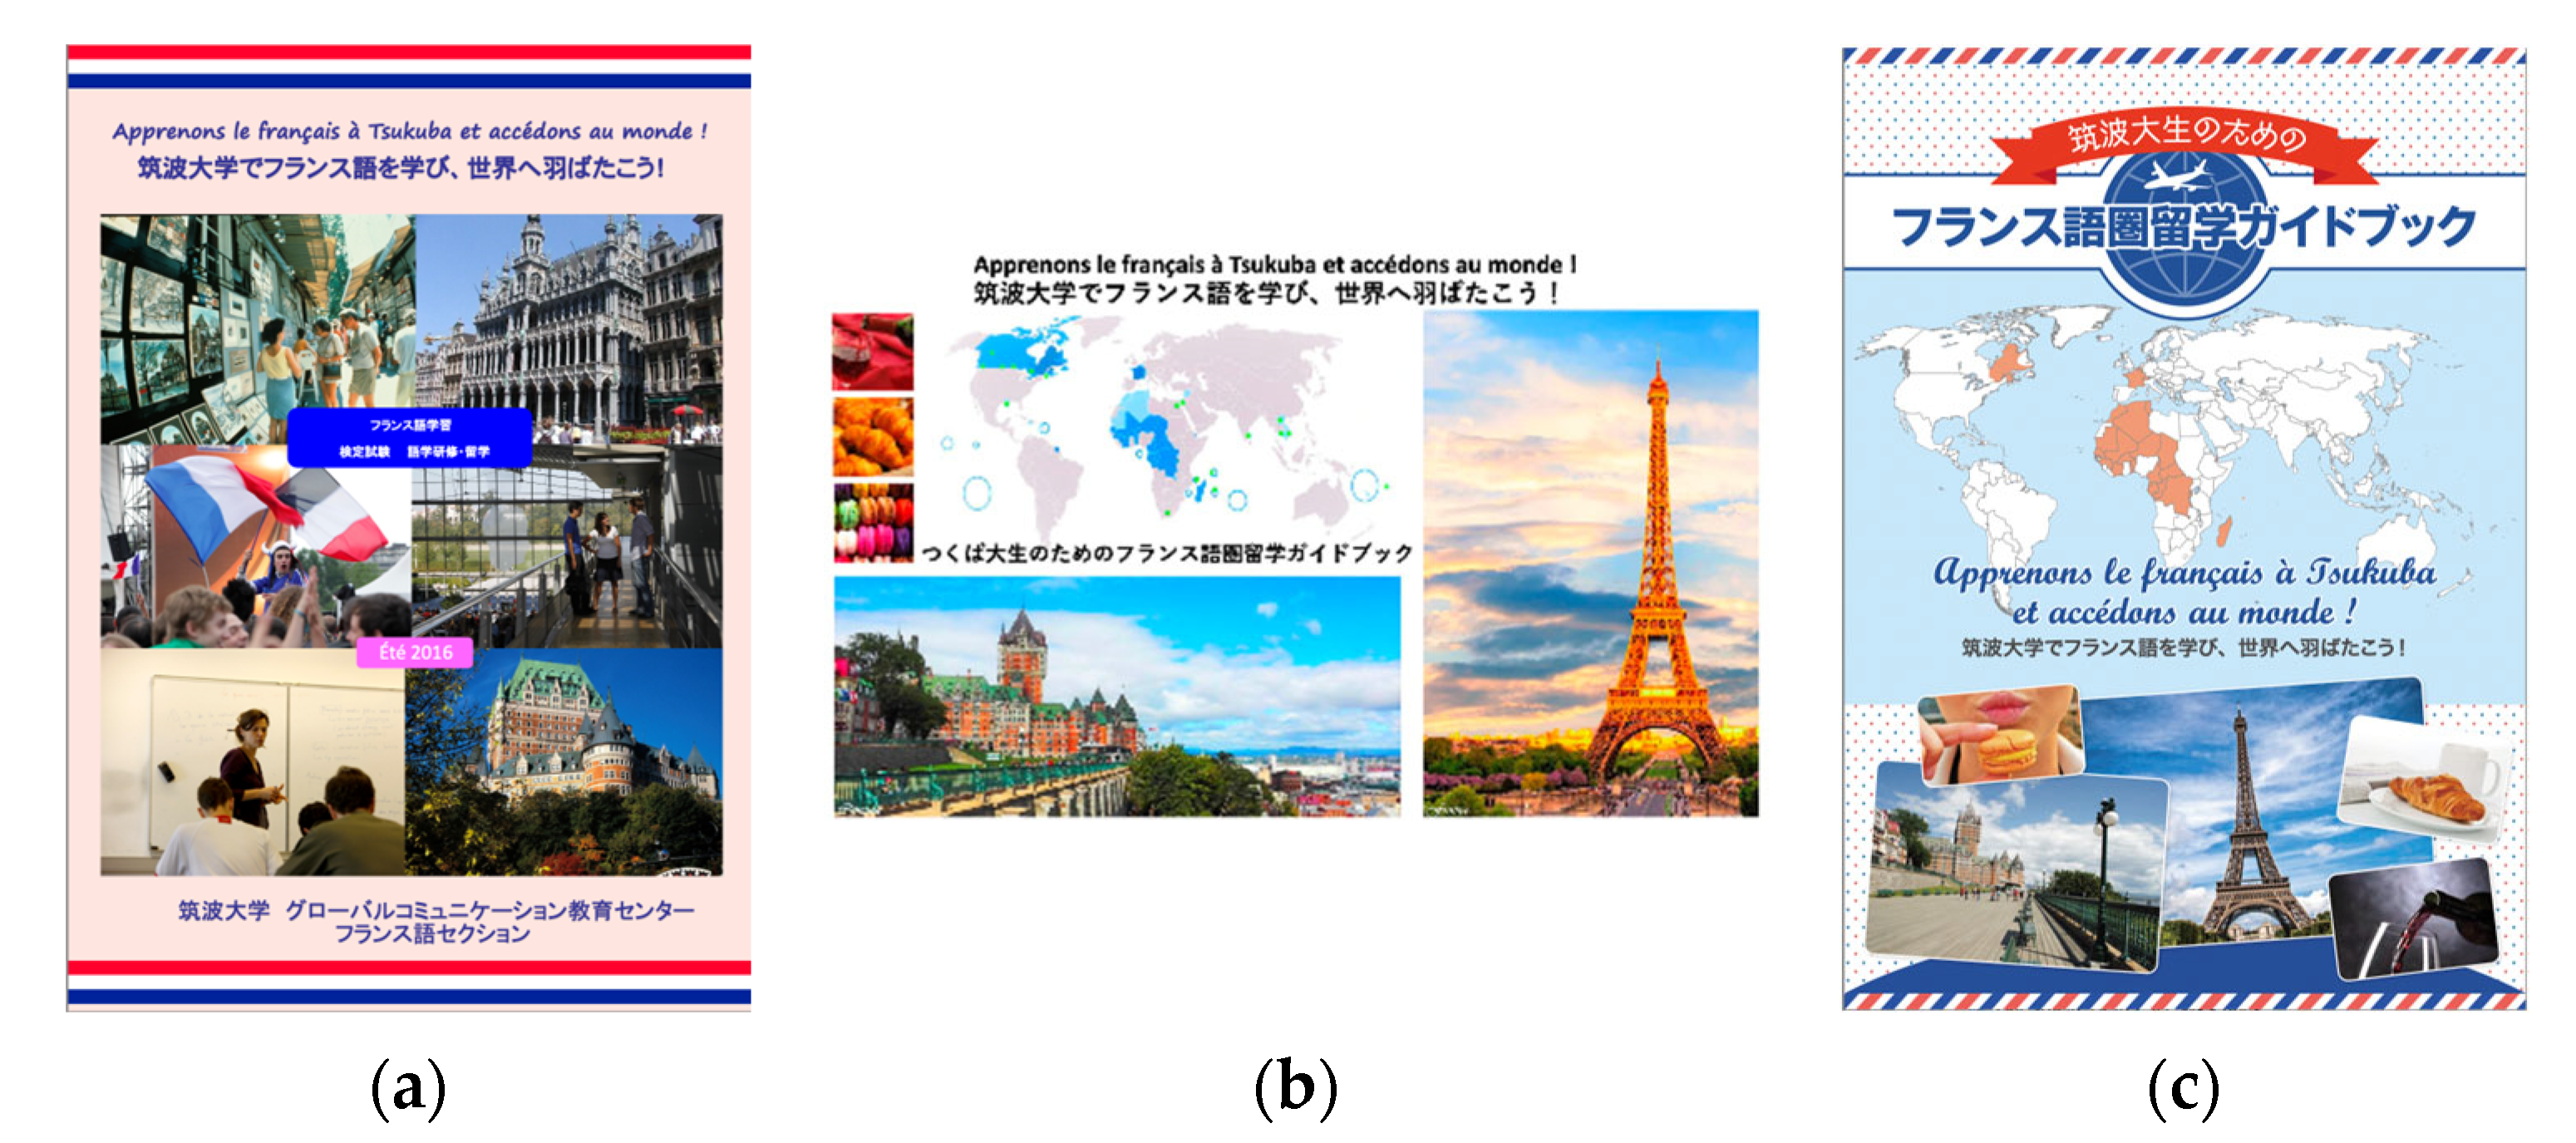
Figure 4. Brochure Covers and page count: (a) original (8 pp); (b) prototype (26 pp); (c) final (21 pp). Data collected from the French Language Department, Center for Education of Global Communication, University of Tsukuba.
Education 13 00053 g004
Figure 5. Coding frame defined through intercoder reliability (ICR) assessment.
Education 13 00053 g005
Figure 6. Micro-level analysis of student responses. Circled numbers refer to codes (see Figure 5). Boxed data descriptions appear in order of theme, category (sub-category). Figure layout based on Ismailov and Ono [37]. a S = Student ID number, A = original brochure, B = prototype, C = final brochure.
Education 13 00053 g006
Figure 7. Histograms showing distributions of scores on perceived utility of three types of brochures. Q9-17. How would you rate the brochure in terms of usefulness? (a) Original brochure, M = 7.53, SD = 1.493; (b) prototype brochure, M = 6.98, SD = 2.002; (c) final brochure, M = 8.96, SD = 1.254.
Education 13 00053 g007aEducation 13 00053 g007b
Figure 8. (a) Original brochure (A) vs. prototype (B). Q29: In your own words, explain how you feel comparing Brochure A and Brochure B; (b) original brochure (A) vs. final product (C). Q29: In your own words, explain how you feel comparing Brochure A and Brochure C.
Education 13 00053 g008aEducation 13 00053 g008b
Figure 9. Histograms showing distributions of scores on perceived usability of three types of brochures. Q9–17: How would you rate the brochure in terms of ease of use? (a) Original brochure, M = 7.09, SD = 1.689; (b) prototype brochure, M = 6.44, SD = 2.293; (c) final brochure, M = 8.78, SD = 1.438.
Education 13 00053 g009aEducation 13 00053 g009b
Disclaimer/Publisher’s Note: The statements, opinions and data contained in all publications are solely those of the individual author(s) and contributor(s) and not of MDPI and/or the editor(s). MDPI and/or the editor(s) disclaim responsibility for any injury to people or property resulting from any ideas, methods, instructions or products referred to in the content.