Article

An Empirical Study of Students’ Perception of and Key Factors Affecting Overall Satisfaction in an Intensive Block Mode and Flipped Classroom

1
School of IT and Engineering, Melbourne Institute of Technology, 288 La Trobe Street, Melbourne, VIC 3000, Australia
2
Design and Creative Technology, Torrens University Australia, 196 Flinders Street, Melbourne, VIC 3000, Australia
3
School of Computing and Information Technology, Faculty of Engineering and Information Sciences, University of Wollongong, Northfields Ave, Wollongong, NSW 2522, Australia
4
Centre of Learning, Melbourne Institute of Technology, 288 La Trobe Street, Melbourne, VIC 3000, Australia
*
Author to whom correspondence should be addressed.
Tayab D. Memon and Saad S. Hashmi were previously affiliated with Melbourne Institute of Technology when this research was conducted.
Educ. Sci. 2022, 12(8), 535; https://doi.org/10.3390/educsci12080535
Submission received: 8 July 2022 / Revised: 26 July 2022 / Accepted: 5 August 2022 / Published: 9 August 2022

Abstract

:
Results of recent studies have suggested that intensive methods of delivery might improve engagement, attendance, and achievement for students from diverse backgrounds. Contributing to this area of inquiry, this study assesses how students perceived their experience studying a certificate course that was delivered in an online intensive block mode and flipped classroom (BMFC), pedagogy amidst COVID-19 restrictions. The subjects were students enrolled at Melbourne Institute of Technology between July 2021 and January 2022 across four certificate courses, three at postgraduate and one at undergraduate level. These certificate courses differed from normal degree courses in several aspects: (a) a shorter 4-week (undergraduate) or 5-week (postgraduate), instead of a 12-week duration, (b) subjects were taken sequentially instead of concurrently as in a normal semester, (c) taught using an online flipped classroom rather than the in-class approach, and (d) open to both high-school leavers and mature aged students who did not study full-time. A questionnaire involving 10 perception-based questions was used to survey students’ satisfaction with the BMFC delivery, in relation to their learning and engagement experience. The mean, median, and mode calculated from the responses revealed that students regarded the BMFC approach as more satisfied than not on a 5-star rating scale in 7 out of the 10 questions. This is further supported by high correlations among the questions (the lowest at r = 0.48 and the highest at r = 0.87). Multiple regression analysis using the first nine questions as predictors of the 10th question (overall satisfaction) revealed that six of these are statistically significant predictors (p < 0.05) of the overall satisfaction, implying that an increase in the overall satisfaction can potentially be achieved by improving these key factors of the BMFC delivered certificate courses. Our findings correlate with existing research that student learning and engagement might be improved by intensive modes of delivery. Furthermore, the BMFC pedagogy proposed in our study differentiates us from existing research, where block scheduling was used only in a face-to-face delivery in pre COVID-19 environment. Our study, therefore, contributes a novel delivery method for learning and teaching that is suitable for both online and face-to-face mode in a post COVID-19 era.

1. Introduction

On 30 April 2021, the Australian Government announced a package of measures to support non-uni higher education providers (NUHEPs) most affected by COVID-19 and border closures [1]. This package included $26.1 million for 5000 short course places for domestic students at NUHEPs, for delivery in Semester 2, 2021. Melbourne Institute of Technology (MIT), being a NUHEP that has campuses both in Melbourne and Sydney, was successful in gaining federal support to offer several short courses in the form of two undergraduate courses, including Undergraduate Certificate in Information Technology (UCIT), Undergraduate Certificate in Cybersecurity and Networking (UCCN), and three postgraduate certificates, including Graduate Certificate in Cyber Security and Networking (GCCN), Graduate Certificate in Information Technology (GCIT), and Graduate Certificate in Data Analytics (GCDA). These undergraduate and postgraduate certificates were designed to be completed within a shorter duration than the normal degree, so that graduates could return to the workforce and become productive as soon as possible. In meeting such requirements, MIT designed the short courses to run in a 4-week (for undergraduate courses) or 5-week (for postgraduate courses) block mode, with students taking one unit after another, instead of concurrently, as in the normal semester system. In addition, due to the cohort of students which include both school leavers and students who are studying part-time, a flipped classroom approach was adopted, with most of the learning materials made available prior to the start of each block, and having a two-hour weekly workshop delivered through the Zoom platform, where students met their instructor and received the support they needed on their study.
Recent research has suggested that intensive modes of delivery might improve engagement, attendance, and achievement for students from diverse backgrounds [2]. One mode of intensive delivery that is related to this study is block teaching [3]. Block teaching has previously been applied in the delivery of tertiary education in Australia, one such example being Victoria University (VU), which experimented with using block teaching in their first-year engineering degree, and had found the delivery mode positively affected student outcomes [4]. However, while the VU block mode example was delivered in a face-to-face teaching environment, the national and state lockdown in 2021 meant that face-to-face teaching was not feasible, and so the delivery of the MIT block mode was exclusively online. There are thus several distinct differences between the block mode previously delivered, and the approach by MIT, presenting an opportunity to investigate the extent to which the block mode delivery works in alternative educational contexts.
Firstly, units in a certificate course were of a shorter duration, that is, in 4-week or 5-week block mode. Secondly, they were delivered one after the other (i.e., taking one block at a time). Thirdly, they were taught using a flipped learning pedagogy and delivered entirely online. Fourthly, they were open to school leavers, and those who were already in the workforce.
We have recently studied how the flipped learning (FL) approach has impacted our student’s perception in attaining the graduate attributes (GAs) in capstone project units at MIT [
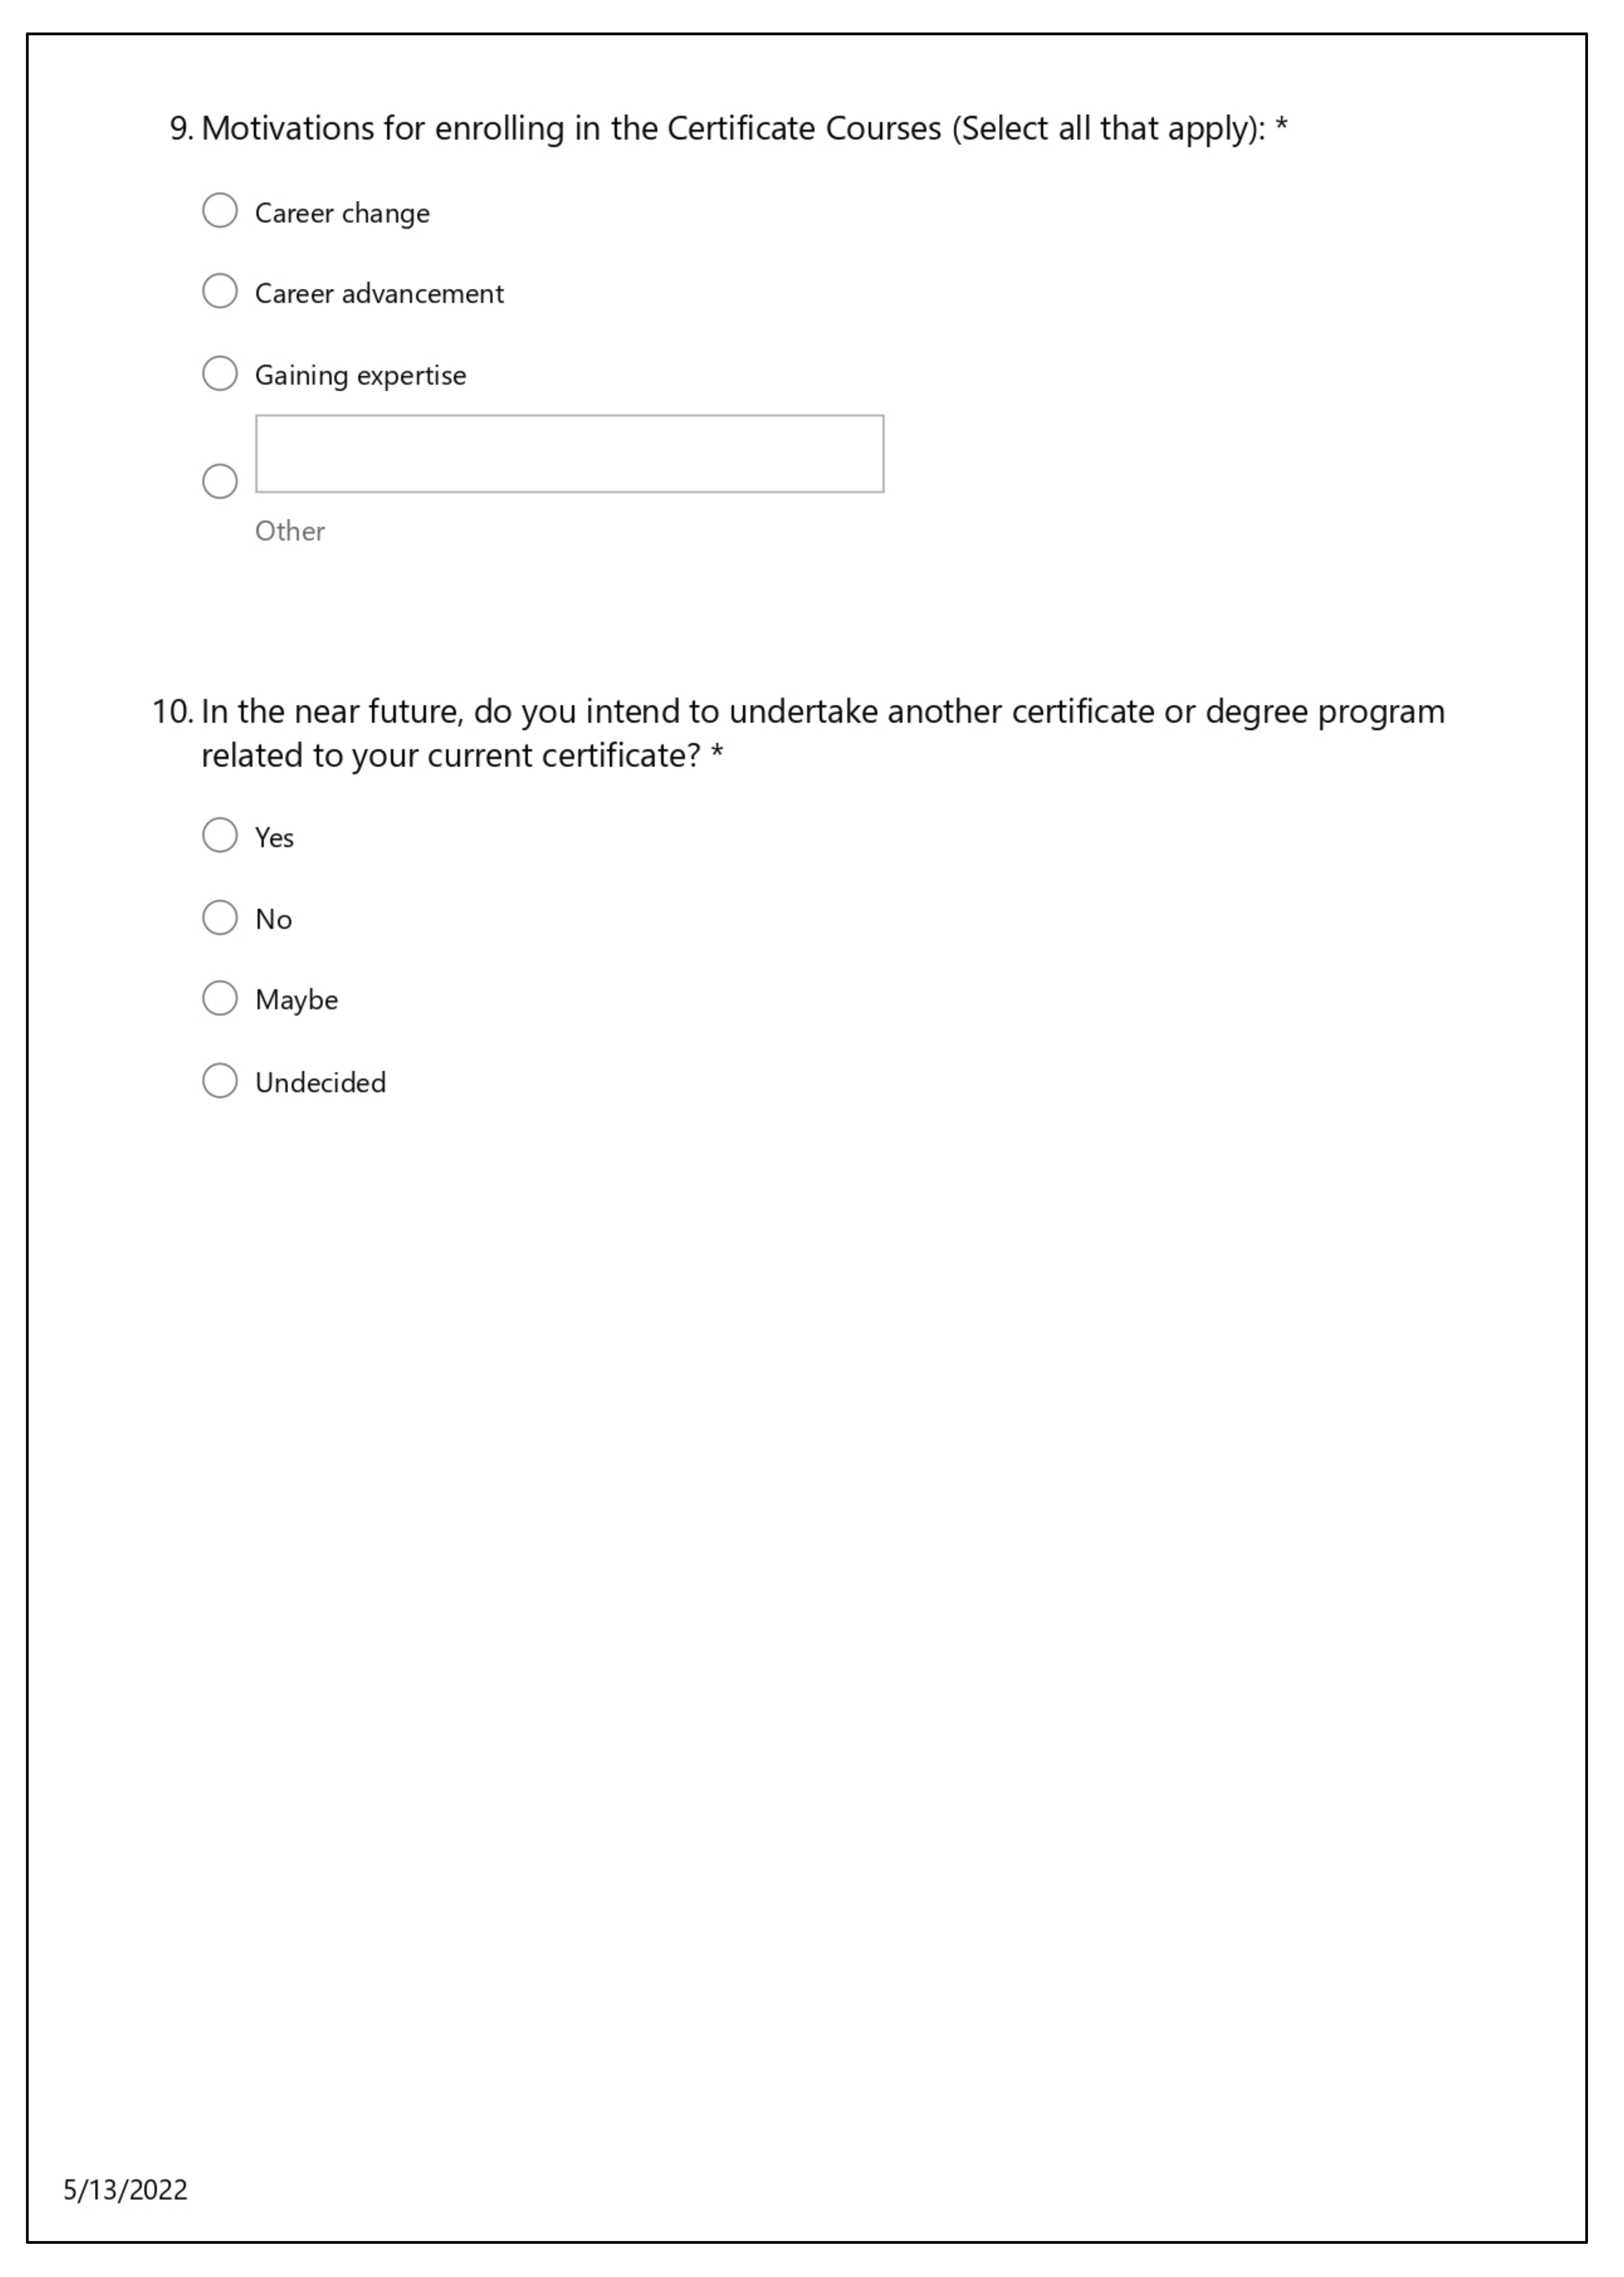
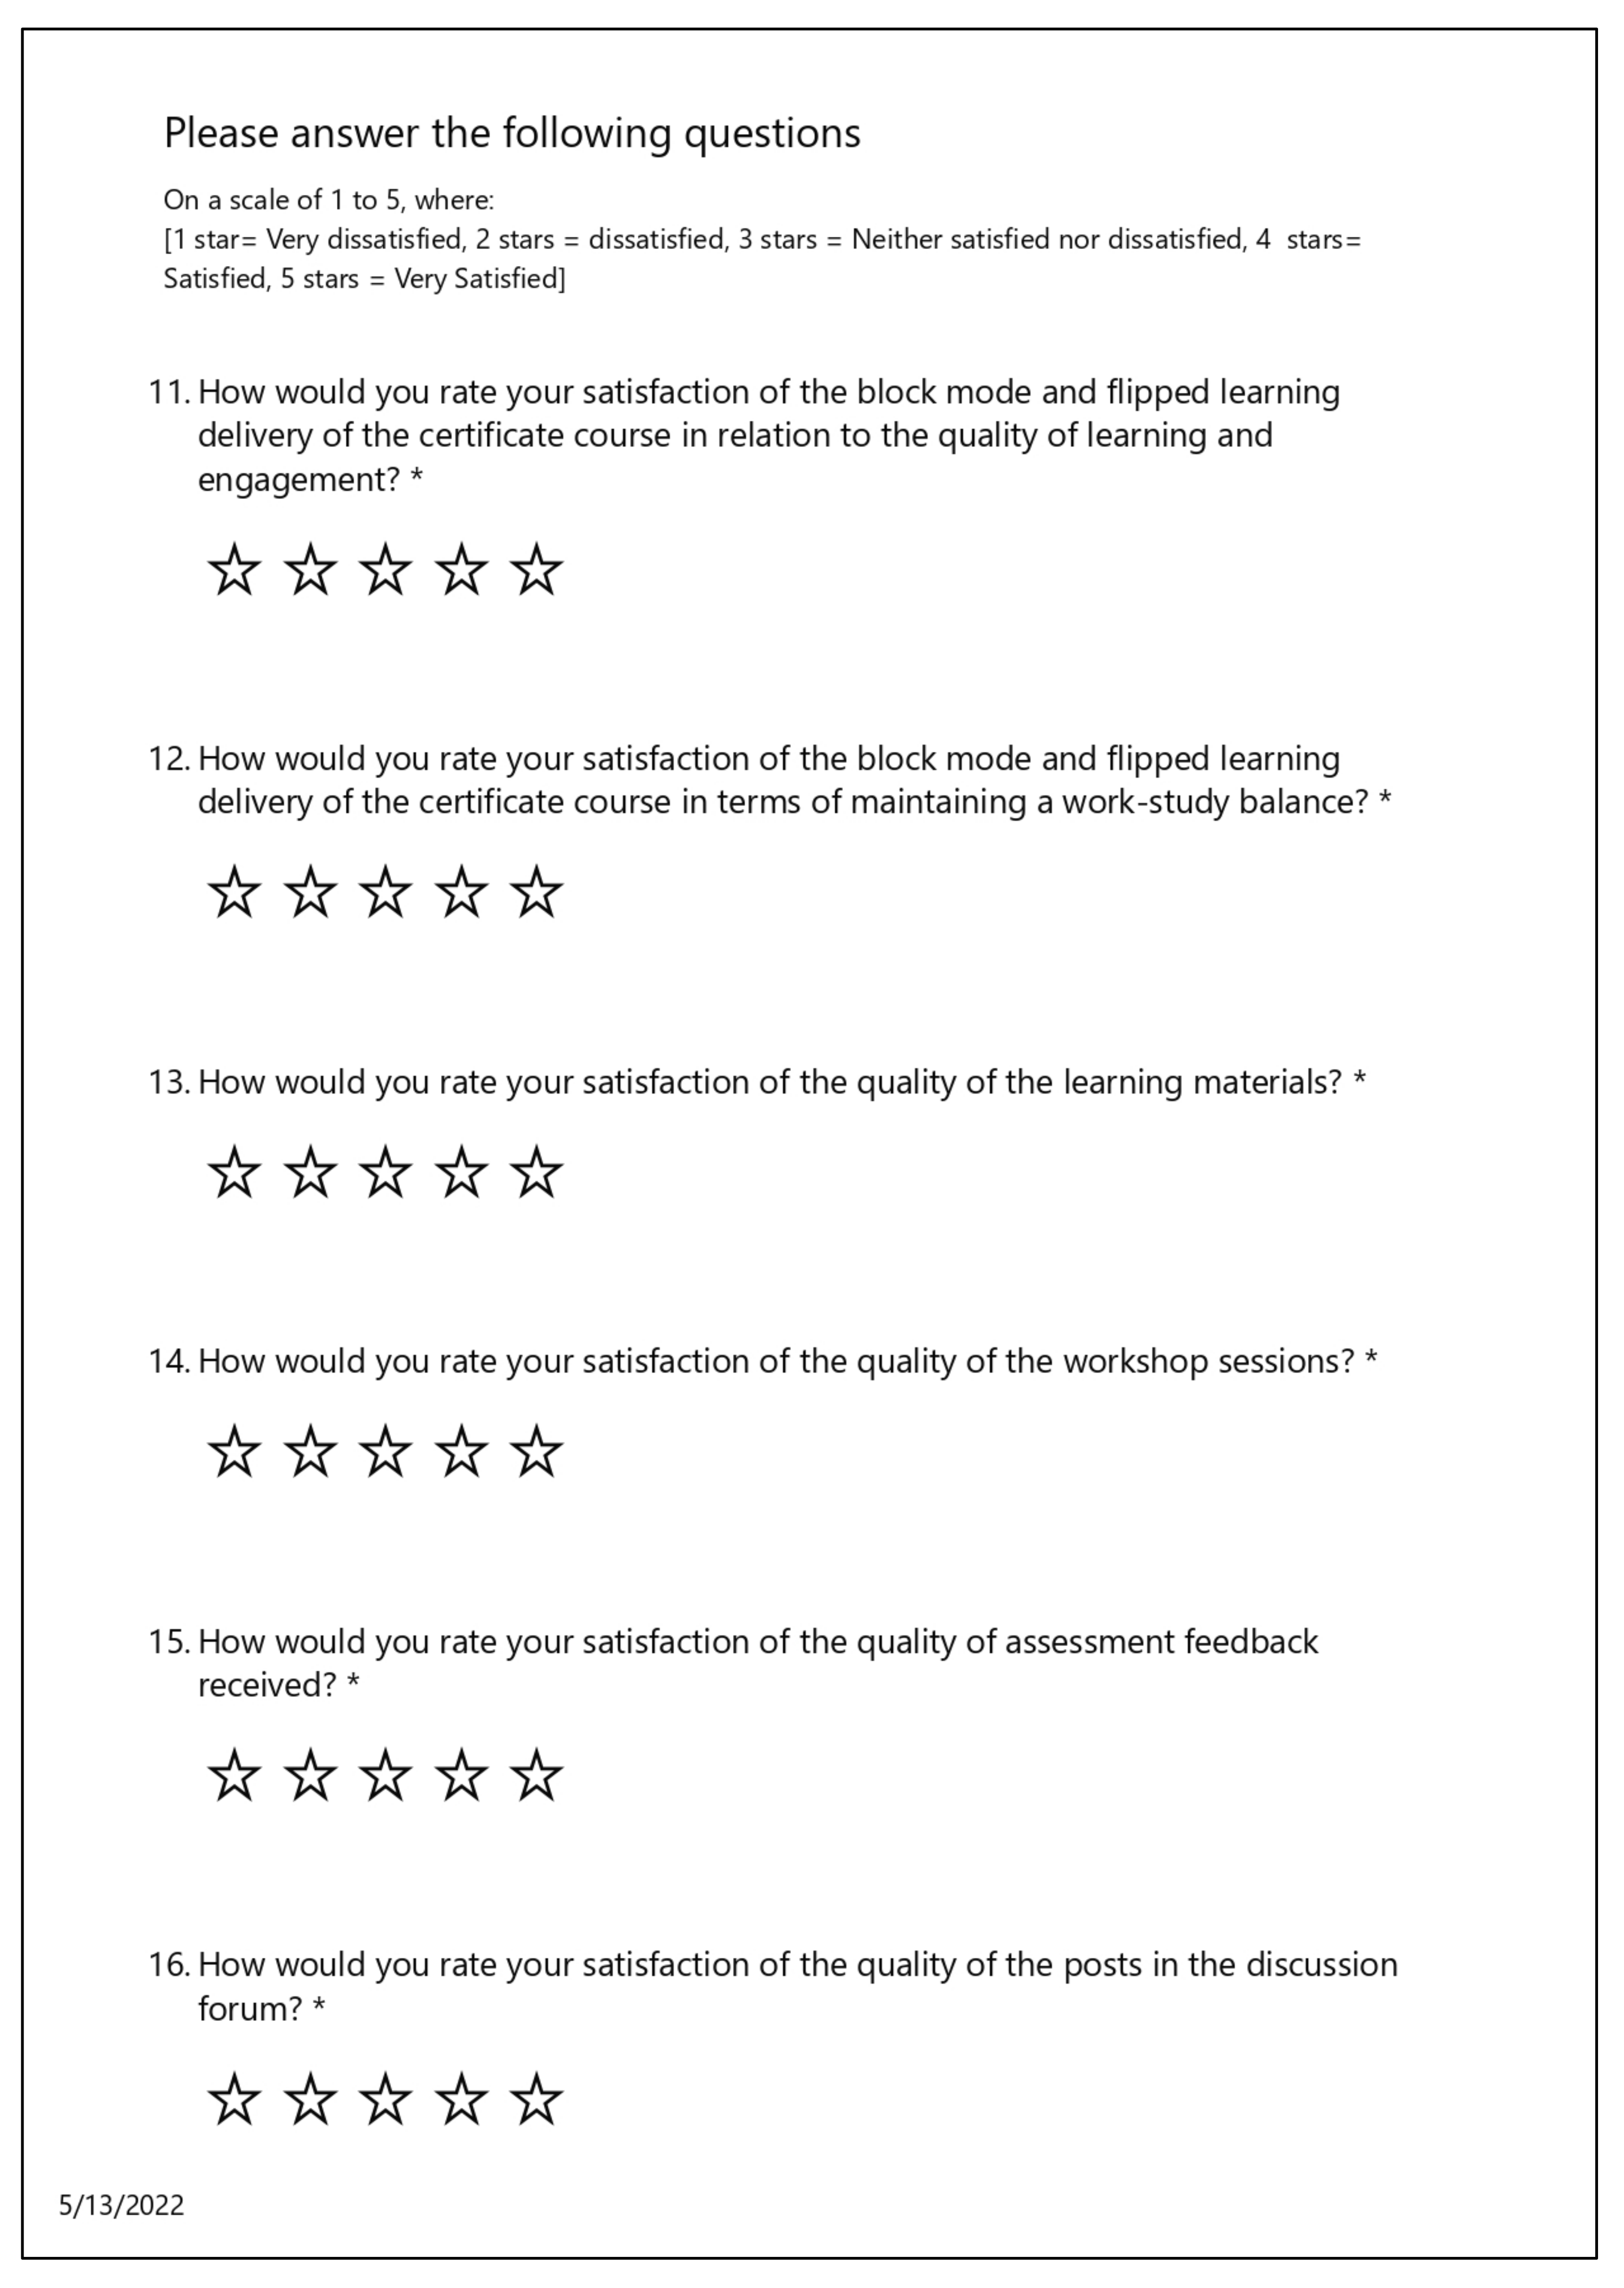
5]. Building on our recent work, this project addresses how students perceive their learning and engagement, while studying one of the five certificate courses at MIT between July 2021 and January 2022, over two repetitions of the undergraduate course and three repetitions of the postgraduate courses. Each repetition of the undergraduate certificate consists of four 4-week blocks, while each repetition of a postgraduate certificate consists of three 5-week blocks, one for each subject of each certificate. By capturing the students’ feedback using an online questionnaire, we want to understand how satisfied students are with their overall learning and engagement experiences based on 10 perception questions, the first nine of which focus on one key aspect of their learning and engagement experience, including the quality of learning materials, pre-recorded lectures, assessments, feedback, academic services, etc. In summary, the two main objectives of this research are:
  • Assessing students’ perception of the BMFC delivery in meeting their expectations of learning and engagement.
  • Clarifying the key aspects or factors of the certificate courses, which include quality of learning materials, pre-recorded lectures, assessments, feedback, etc., that are significant in influencing students’ overall satisfaction.
An understanding of these significant factors will provide guidance on how to improve students’ satisfaction in future offerings of these courses, and the viability of BMFC delivery as a whole, together with an improved theoretical understanding of the nature of student satisfaction of novel educational delivery modes.
The rest of the paper is organized as follows. Section 1.1, on Literature Review, will overview related research to our study. 
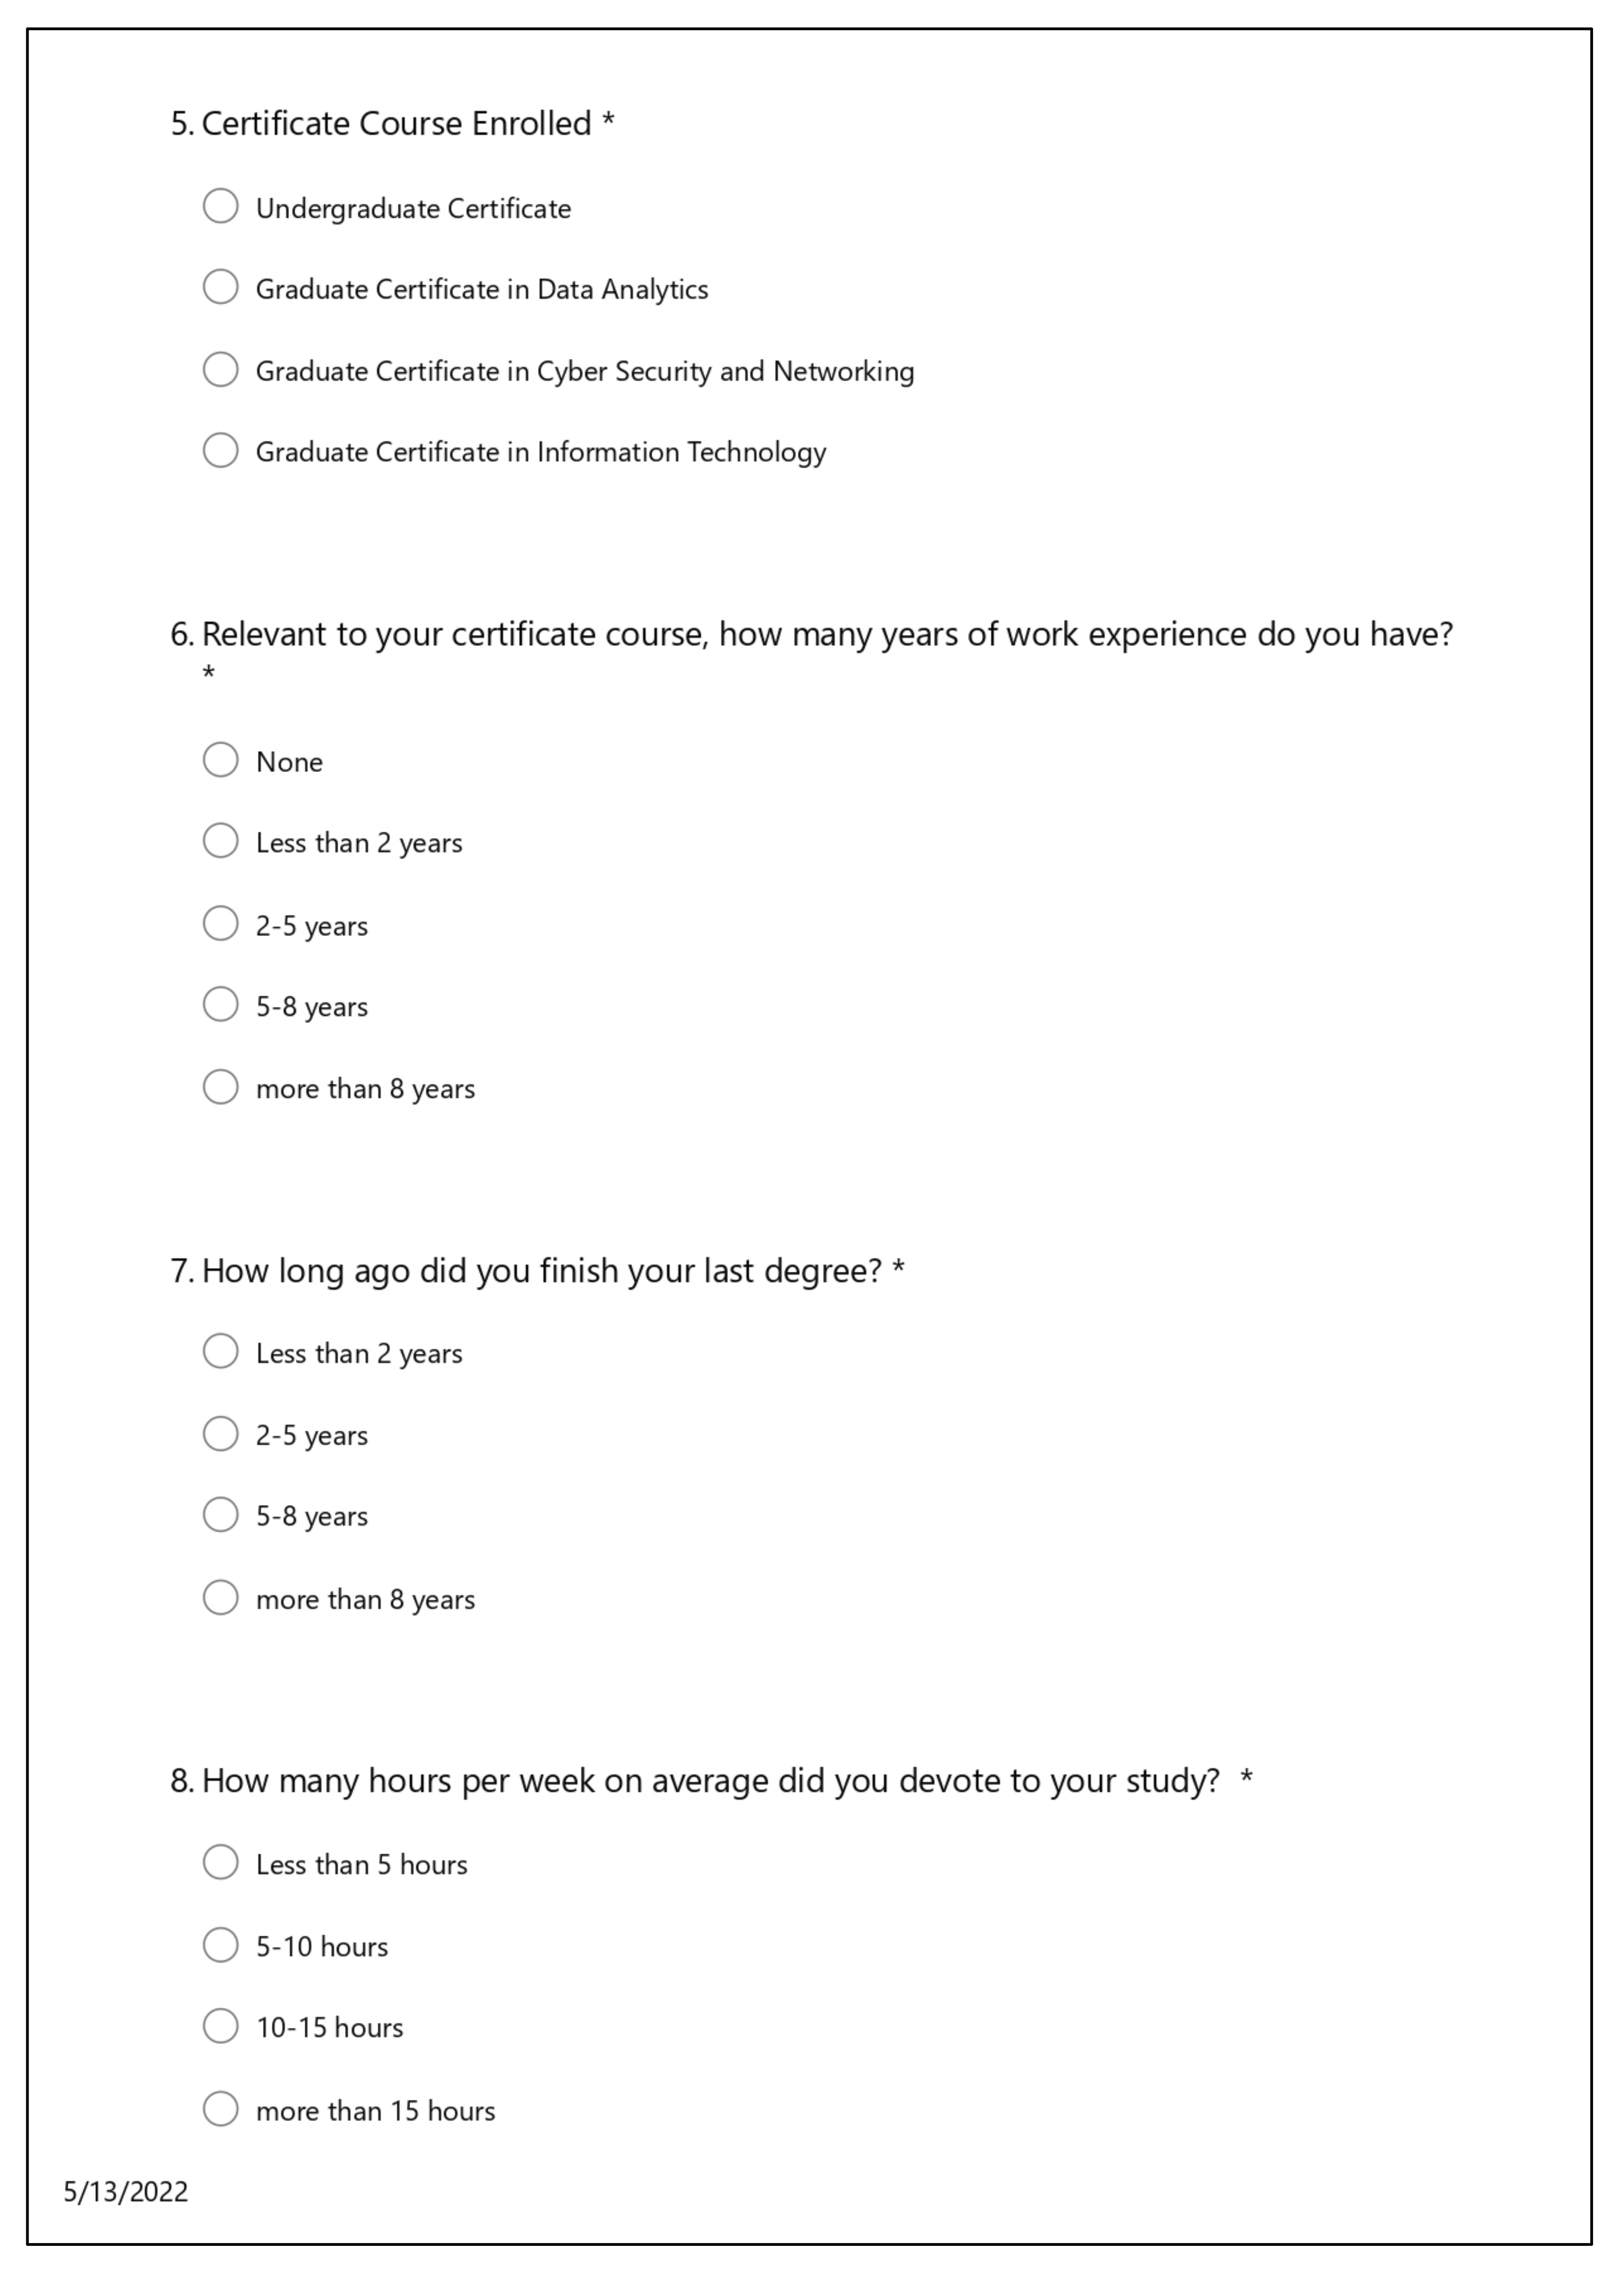
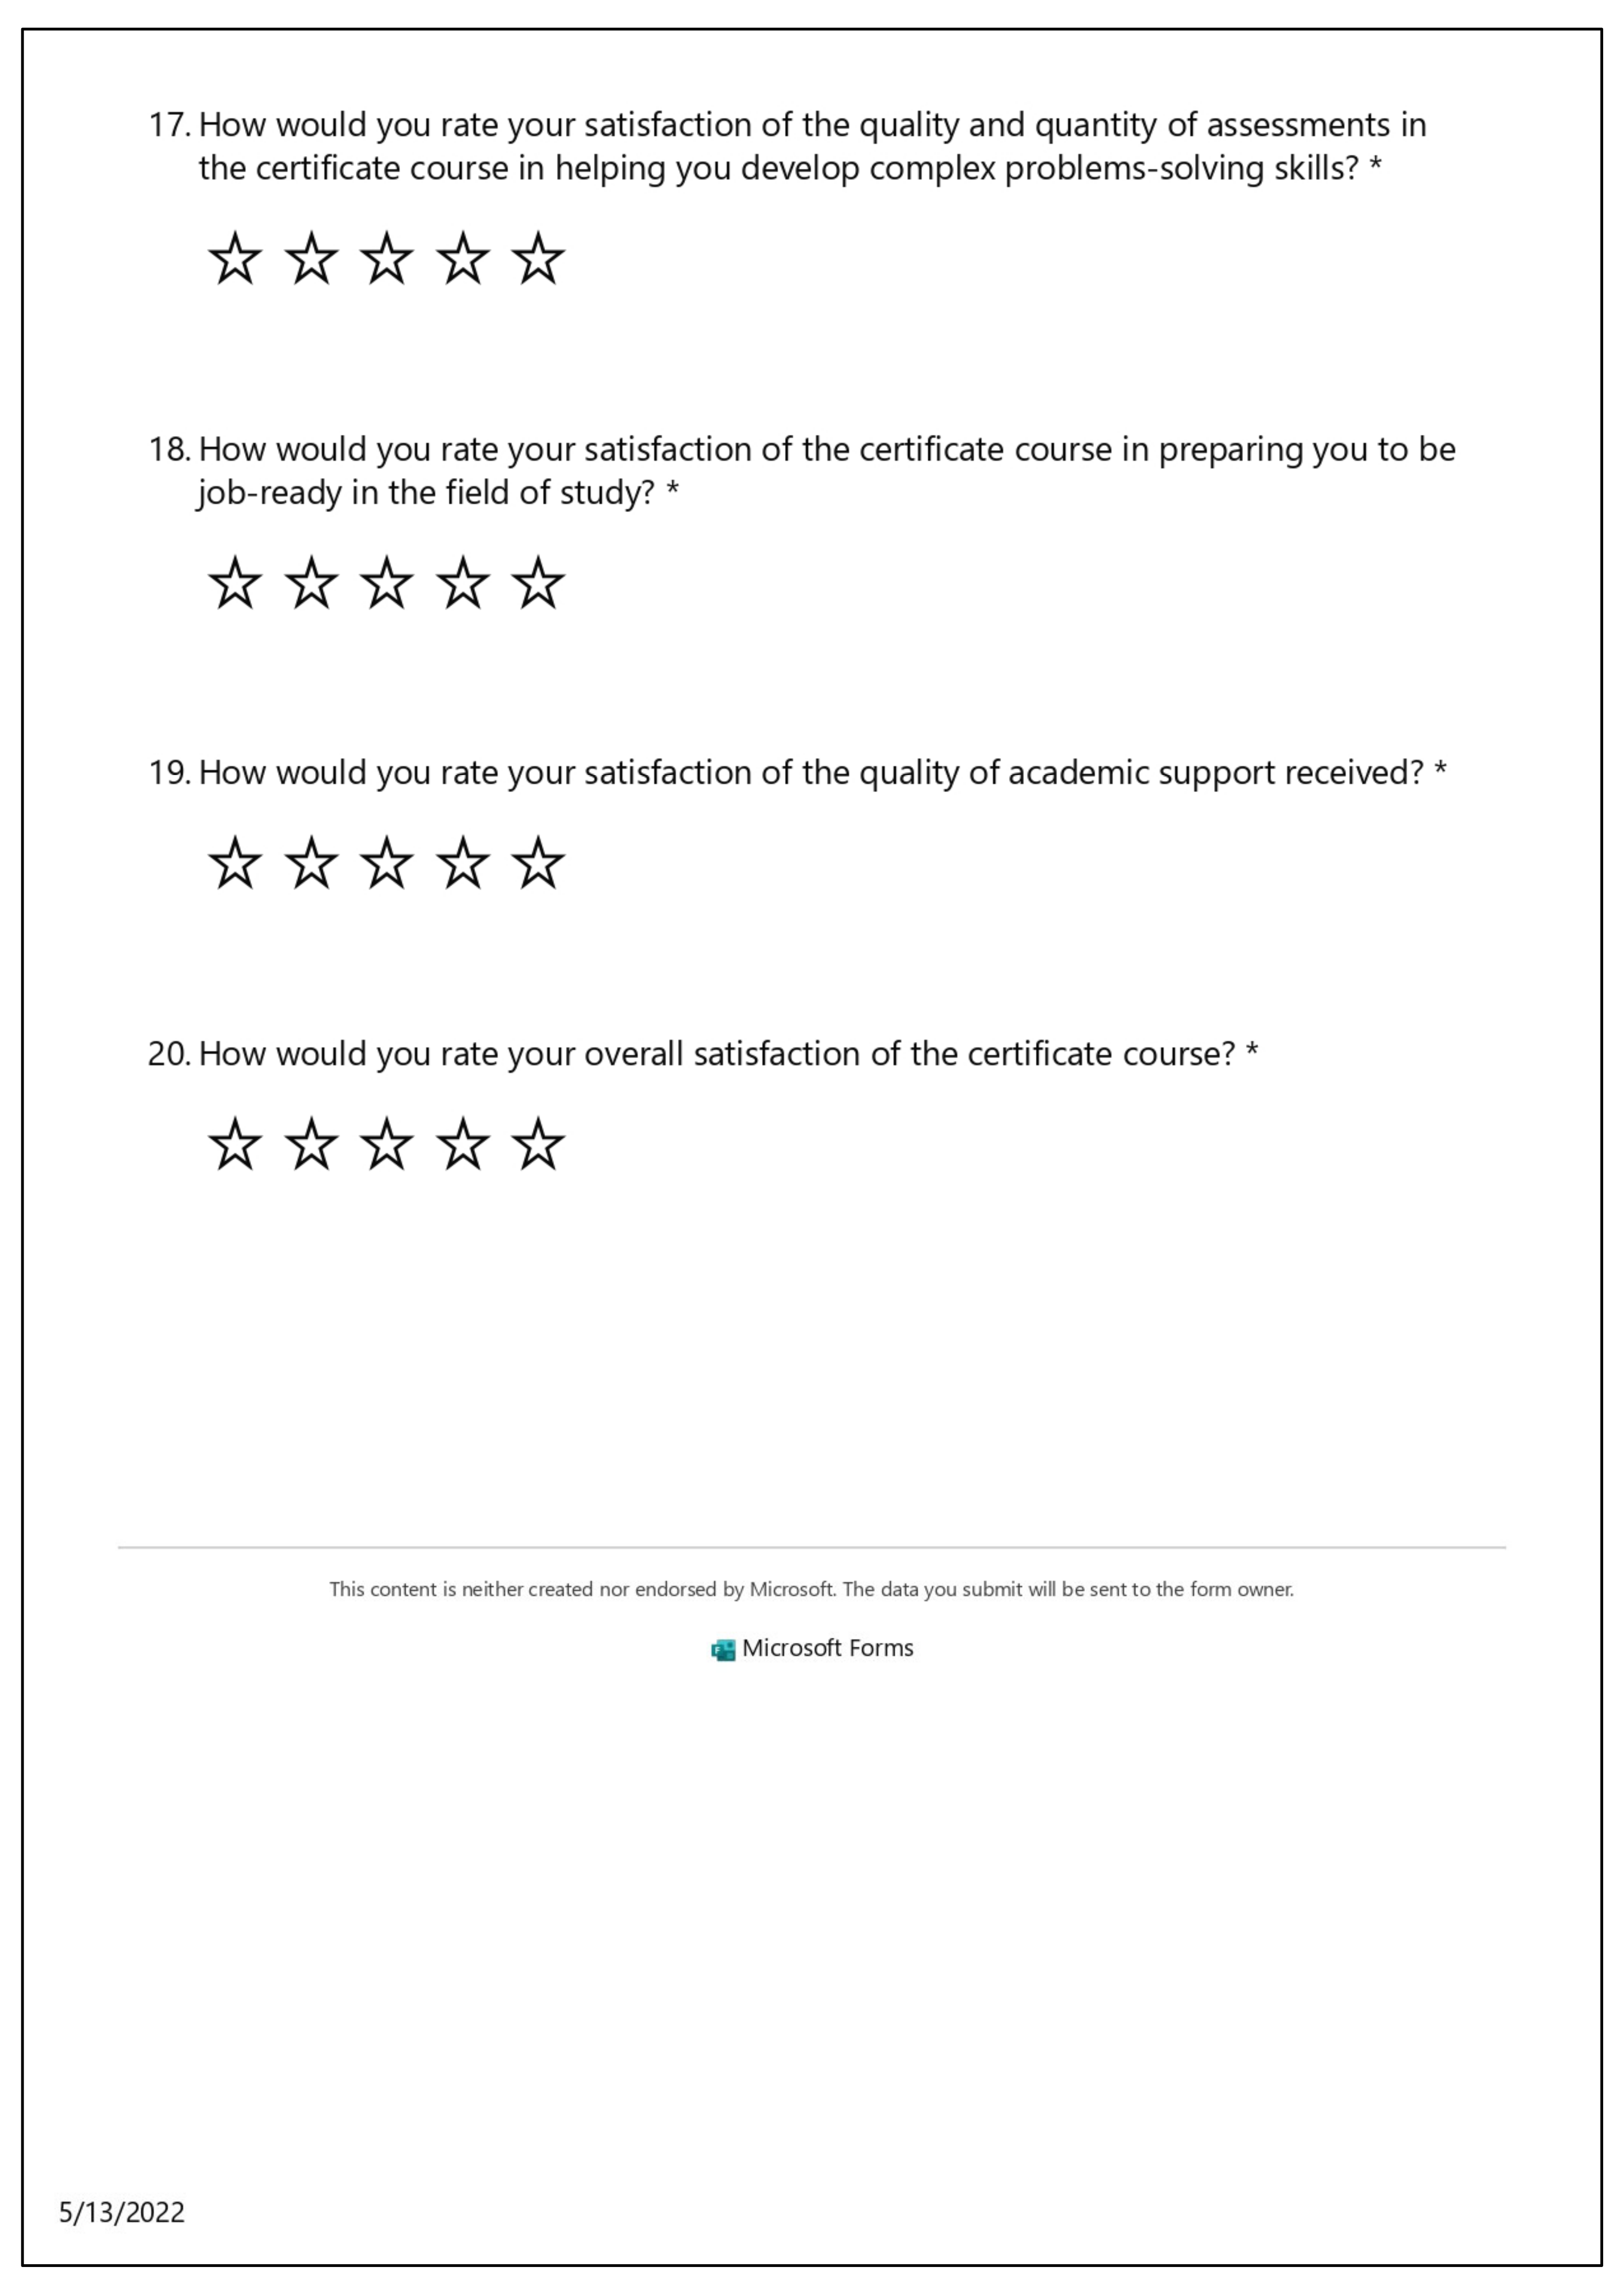
Section 2, on Materials and Methods, will describe the approach and methodology we have adopted for this study, and describe the empirical data collected using an online questionnaire we have developed to survey students’ perception on their experience studying the certificate courses at MIT, delivered in an intensive block mode, and flipped classroom (BMFC) pedagogy. Section 3, on Results, will present statistical analyses of the survey data, while the Discussion in Section 4 explains the implications of our study based on the results. Lastly, the Conclusion, in Section 5, summarises the objectives and contributions of this research, as well as highlighting potential future work arising from this study.

1.1. Literature Review

In recent times, block mode has gained attention as an instructional delivery method in which students are only allowed to enroll in one unit at a time and it is completed in a short, intensive period before moving onto another. This teaching approach has the benefit of keeping students focused on a single unit at a time. In the Australian context, block mode delivery has been shown to positively affect students’ satisfaction in their courses, academic outcomes, and career mentality [6,7,8]. Likewise, students’ satisfaction and performance in the block mode delivery of a first-year undergraduate degree has been previously reported [9]. The authors found a substantial increase in performance in a certain subset of students, but also reported a decrease in course satisfaction.
In [10], the authors analyzed students’ engagement and performance for first-year engineering students, whose instruction was based on a block mode problem-based learning delivery approach. The study revealed that students’ engagement and performance increased, along with a similar increase in the quality of learning. The effects of block mode learning on students’ performance among students with specialized needs, such as those who were repeating their units, were reported in [11]. The results showed improvement in students’ academic performance.
However, studies on the effectiveness of teaching and the quality of learning by students in intensive mode courses have not always been positive. In [12], the authors examined the practices and challenges of modular/block teaching in Ethiopian higher education institutions by collecting data using surveys and interviews. Their analysis of the data revealed that while modular/block teaching might help students to focus on a single subject at a time, it does not give adequate attention to practical skills. Because of this, they argued that theory has not informed practice, and vice versa, thereby diminishing the credibility of learning. Another criticism of block teaching came in the form of an open letter by an anonymous student of Victorica University, entitled “Against the block model” [13]. In the letter, the student wrote as someone who had experienced firsthand the VU-model, stating that block teaching had brought confusion and alienation to new or struggling students, and caused them to fall behind. Whereas, inevitably, there are pros and cons to most pedagogical approaches, including block teaching, the authors of [14] concluded in their report, commissioned by the Australian Department of Education and Training in 2015–2017, that both students and teachers reported many benefits of the intensive model, provided that it was planned well, to avoid such risks as student and staff burnout.
On the other hand, flipped learning is a method of teaching and learning that derives its name from the way it flips, or inverts, the structure of the traditional classroom model [15]. It can be considered a specific type of blended learning [16,17] that requires students to combine various types of learning to improve engagement, and use teaching resources effectively [18,19,20,21,22]. The adoption of a flipped classroom approach is also partly driven by the decreasing attendance rate of lectures, and the increasing demand for a flexible learning approach [23,24]. The key objective of using a flipped approach is to utilize class time productively by moving the information transmission out of the classroom to promote active exchange and socializing between teachers and learners, as well as among learners in class. According to [24], analysis reveals that flipped learning positively impacts student performance regardless of the level of education and disciplines, yet the effect might be different, depending on the flipped classroom design.
In practice, the combination of block mode delivery and flipped classroom has not been used commonly, or intentionally, in either online or traditional classroom setting. We believe there is a genuine research gap in this area of research that requires careful investigation and reflection. Equally important is the study for improvement of the certificate courses at MIT, which is anticipated to be offered again in the future. It is critical that we understand the students’ perception of the delivery and teaching approach of the certificate courses to optimize both educational quality and enrolment. We also anticipate the findings of our study will add to the body of knowledge among the higher education community, who are considering the possible adoption of hybrid and intensive block mode teaching in the near future.

2. Materials and Methods

2.1. Methodological Approach

To answer the research question, we have decided to follow a survey methodology by collecting data using an online questionnaire, administered to students after they have completed their respective certificate course. We have modelled our survey after [25], which has been validated for evaluating students’ perspectives on the Flipped Classroom across several dimensions, in turn having several items in each dimension. In this study, the 10 perception questions are associated with the ‘Reflection’ dimension.
The questionnaire was divided into two sections. The first section comprised nine participant related questions (see Table 1), which gathered demographic details of the students who responded. The second section comprised the group of 10 perception questions (see Table 2) that surveyed students’ perceptions on the key elements, or factors, in the delivery of the certificate courses. The rating scale used for these 10 questions is the star rating, with the highest rating being five stars, while the lowest rating being one star. The choice of this rating was decided in consultation with the campus administration at MIT. There has been study in the open literature on impacts of different pictural scale to responses. In [26], the authors concluded from their study that response categories can have a significant effect on respondent answers, and that heart and star designs received lower average scores compared to the other formats. A copy of the online survey is included in Appendix A (Figure A1).
The participant related questions of the first section are included to understand the background of the student cohort. For example, students’ prior work experience (D3), in any field, determines their motivation towards learning and engagement that could lead to a career change, or enabling them to apply for promotion in their organization. Likewise, the relevant work experience (D5) determines students’ commitment towards upskilling themselves with relevant knowledge and skills in their course. The information of their last degree (D6) helps us understand how long students have been away from studies and will be useful for understanding the impact of new pedagogies, such as flipped learning, on their learning and motivation. As stated earlier, most students enrolled in the certificate course were domestic students whose study received support from the federal government. To assess how the BMFC delivery approach might impact work-life balance (D7), the question on the number of hours students committed to their study was asked. The gender (D1) question was asked to determine if this might contribute to differences in students’ responses to the 10 perception questions.
In Table 2, the 10 perception questions can be further grouped into four categories. The first category, which included P1 and P10, was meant to assess the overall satisfaction of students in the BMFC delivery approach. The second category, including P7 and P8, was to evaluate how satisfied students were with their certificate courses in helping them become job-ready by enhancing their ability to solve complex problems. The third and fourth categories of questions were designed to understand students’ perception of different elements of the BMFC pedagogy. These elements included academic support provided in, and out, of the class (P4 and P6), learning materials (P3), which included lecture slides, pre-recorded lectures, laboratory exercises, problem-based learning tutorials, assessments, feedbacks provided on their assessments (P5), and the relevancy of these assessments in preparing them to solve complex problems (P7). The second perception (P2) question, together with D7 that relates to the number of hours weekly dedicated for study, sought to clarify how students assessed the BMFC teaching approach in meeting their needs, in relation to work-study balance.

2.2. Online Survey

The certificate courses offered by the Melbourne Institute of Technology were in the form of an Undergraduate Certificate in Information Technology (UCIT), and three postgraduate certificates, including Graduate Certificate in Cyber Security and Networking (GCCN), Graduate Certificate in Information Technology (GCIT), and Graduate Certificate in Data Analytics (GCDA). All these certificate courses were selected to be administered, and the survey and data were collected to understand the learner’s perception about the BMFC pedagogy. The survey included their consent for utilization of the collected data for research. Approval was obtained from the MIT Scholarship and Research Committee for the survey data collection and use for research purpose only.
Overall, 168 survey responses were received out of a total of 565 enrolled students across the four certificate courses, that is, 30%. The total number of responses from the undergraduate certificate was 20 (12% of the responses) and the total number of responses from the postgraduate certificates (including GCCN, GCIT, and GCDA) was 148 (88% of the responses). It is clear from the survey data that there was a higher percentage of responses coming from the postgraduate cohort, when compared to the undergraduate cohort. Table 3 summarizes the respondents by the level of certificates they studied, and their gender.

3. Results

In this section, we present the results of statistical analysis of the online questionnaire, based on the data collected. Firstly, we assess the reliability of the online survey by computing the Cronbach’s α coefficients based on the 10 perception questions described in Table 2. Next, we present the mean score (standard deviation), median, and mode for each of the questions based on the survey data. Thirdly, we present the results of a correlation analysis between the set of 10 perception questions. Lastly, we present the results of multiple regression analysis to explain the key factors that are statistically significant in affecting the overall satisfaction in the block mode, flipping learning delivery of the certificate courses.

3.1. Cronbach’s α Coefficients

A total of 168 responses were collected across two offerings of the certificate courses. The Cronbach’s α coefficient (a value between 0 and 1) was calculated based on the 10 perception questions (P1 to P10 in Table 2) using Equation (1). It shows the reliability of the overall survey by highlighting the high internal consistency among the survey items [27].
C r o n b a c h s   α = k k 1 s y 2 s i 2 s y 2
where k is the number of responses, s y 2 is the variance for the total score calculated from summing up the scores over the P1 to P10 for each response, and s i 2 is the variance for each individual question, P1 to P10, over the total number of responses, with i = 1 , , 10 . Based on the survey data, the Cronbach’s α is computed to be 0.96, indicating a high internal consistency among the 10 perception questions.

3.2. Descriptive Statistics

In this section, we will present the mean and standard deviation, the median, and the mode for each of the 10 perception questions, based on the scores given by the 168 responses. While the means, median and mode are all considered as measures of central tendency of a distribution, we observed in our analysis that the distribution of scores for each of the 10 questions did not conform nicely to a normal distribution (see Table 4, column 2). In other words, we contend that the mode, and, to a lesser extent the median, will be a better measure of the central tendency for these distributions of scores.

3.3. Correlation Analysis of the 10 Perception Questions

The correlation matrix (see Figure 1) computed comprises correlation coefficients (value between −1 and 1) that indicate the consistency of students’ responses to the 10 perception questions (P1 to P10). A correlation coefficient value of –1 implies that students had opposite satisfaction levels for the given two perception questions, whereas a value of +1 implies that students had same satisfaction levels.
The lowest correlation coefficient is 0.48 (between P2 and P6) and the highest is 0.87 (between P8 and P10). We were also interested in knowing the consistency of correlation values across different perception questions. Subsequently, we computed the mean correlation values of students’ responses for each perception question. Let Ci,j be the correlation coefficient of students’ responses for perception questions i and j. Let n be the number of perception questions. Then, the mean correlation coefficient (MCC) for perception question i is computed as:
C i ¯   =   j = 1 n C i , j     n 1     :   j i
where C i ¯ is the MCC for perception question i.
The MCC of each perception question, calculated from Equation (2), is shown in Table 5. Question P10 has the highest MCC value of 0.79. This implies that P10 has the highest pair-wise correlation with every other question. We can therefore assume that a high satisfaction score of P10 implies that the satisfaction score across other perception questions is also high, and vice versa for low satisfaction score of P10.

3.4. Key Factors Affecting Overall Satisfaction in the BMFC Approach

To determine the key factors that may affect the overall satisfaction in the block mode and flipped classroom approach used in the delivery of the certificate courses, we resort to multiple regression analysis involving the first nine perception questions, namely P1 to P9, as the predictor variables, and the last question (i.e., P10) as the outcome variable. The rationale for this modelling decision is that the first nine questions can be seen as ascertaining students’ satisfaction of a specific element of the delivery, which contributes to their overall perception of the certificate courses by the students.
The model takes the form of the following linear regression equation:
P10 = a0 + a1 × P1 + a2 × P2 + a3 × P3 + a4 × P4 + a5 × P5 + a6 × P6 + a7 × P7 + a8 × P8 + a9 × P9
where:
  • P10 represents the outcome variable, P1 represents the first question or predictor variable, P2 the second, …, P9 the last question or predictor variable;
  • a0 the y-intercept of the regression equation;
  • ai for i = 1, …, 9 the regression coefficients for the 9 predictors, respectively.
Table 6, Table 7 and Table 8 present the results of solving the regression model of Equation (3) based on the survey data.

4. Discussion

4.1. Difference in Overall Satisfaction between Undergraduate and Postgraduate Responses

As mentioned earlier in Section 2.2, it is clear from the survey data that there was a higher percentage of responses coming from the postgraduate cohort, when compared to the undergraduate cohort. The difference in overall satisfaction (P10) between the undergraduate and postgraduate responses, in terms of the mean and mode, is illustrated in Figure 2. The means of the overall satisfaction ratings of undergraduate and postgraduate responses are 2.45 and 3.31, respectively. On the other hand, the modes of the overall satisfaction ratings of undergraduate and postgraduate responses are 1 and 4. These values revealed that the overall satisfaction from the postgraduate cohort was significantly higher than that of the undergraduate one. There could be various reasons for the higher satisfaction ratings among postgraduate students, such as the maturity level, previous work experience, prior education experience, etc. We intend to explore the reasons leading to this difference in our future work.

4.2. Key Factors Affecting Students’ Overall Satisfaction in the BMFC Delivery

In summary, the results of the multiple regression analysis indicated that the model explained 90% of the variance in the data, which was due mainly by six out of nine of the predictors, which include P1, P3, P4, P7, P8, and P9. These six predictors are statistically significant while the other three, including P2, P5, and P6, are not. Another multiple regression was run by including only the six significant predictors, and the outcome variables returned a similar result, which is the reduced model captures around 90% of the variance in the data.
Based on these results, we postulate that the six significant predictor variables can be viewed as key factors that, with improvements made, will likely improve overall student satisfaction in the BMFC delivery of the certificate courses. These key factors include:
  • the quality of learning and engagement (P1);
  • the quality of the learning materials (P3);
  • the quality of the workshop sessions (P4);
  • the quality and quantity of assessments in the certificate course in helping you develop complex problems-solving skills (P7);
  • preparing you to be job-ready in the field of study (P8);
  • the quality of academic support received (P9).

5. Conclusions

This paper reported an empirical study performed to understand how students perceived their experience studying one of several certificate courses at Melbourne Institute of Technology (MIT), Australia, between July 2021 and January 2022, where the authors of this study are affiliated. These certificate courses were delivered in an intensive block mode and flipped classroom (BMFC) pedagogy, which was a first at MIT. Until recently, the institute had been delivering its courses using a traditional 12-week trimester system. These certificate courses were different in several aspects, including (a) a shorter 4-week duration for undergraduate, or 5-week duration for postgraduate units, (b) the units were taken in sequence instead of parallelly, as in a normal trimester, (c) all activities were online rather than in-class, and (d) students included both school leavers and mature aged students.
By capturing students’ feedback using an online questionnaire, this study aimed to understand how satisfied students were with their overall learning and engagement experiences based on 10 perception questions, the first nine of which focused on one key aspect of their learning and engagement experience, including the quality of learning materials, pre-recorded lectures, assessments, feedback, academic services, etc. Our goals and contributions included: (1) assessing students’ perception of the BMFC delivery in meeting their expectations on learning and engagement, and (2) clarifying the key aspects or factors of the certificate courses, which included quality of learning materials, pre-recorded lectures, assessments, feedback, etc., that were significant in influencing the overall students’ satisfaction.
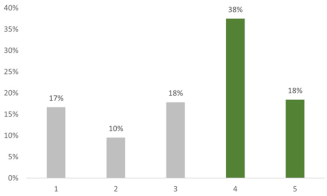
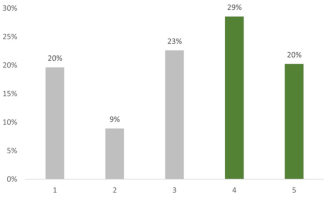
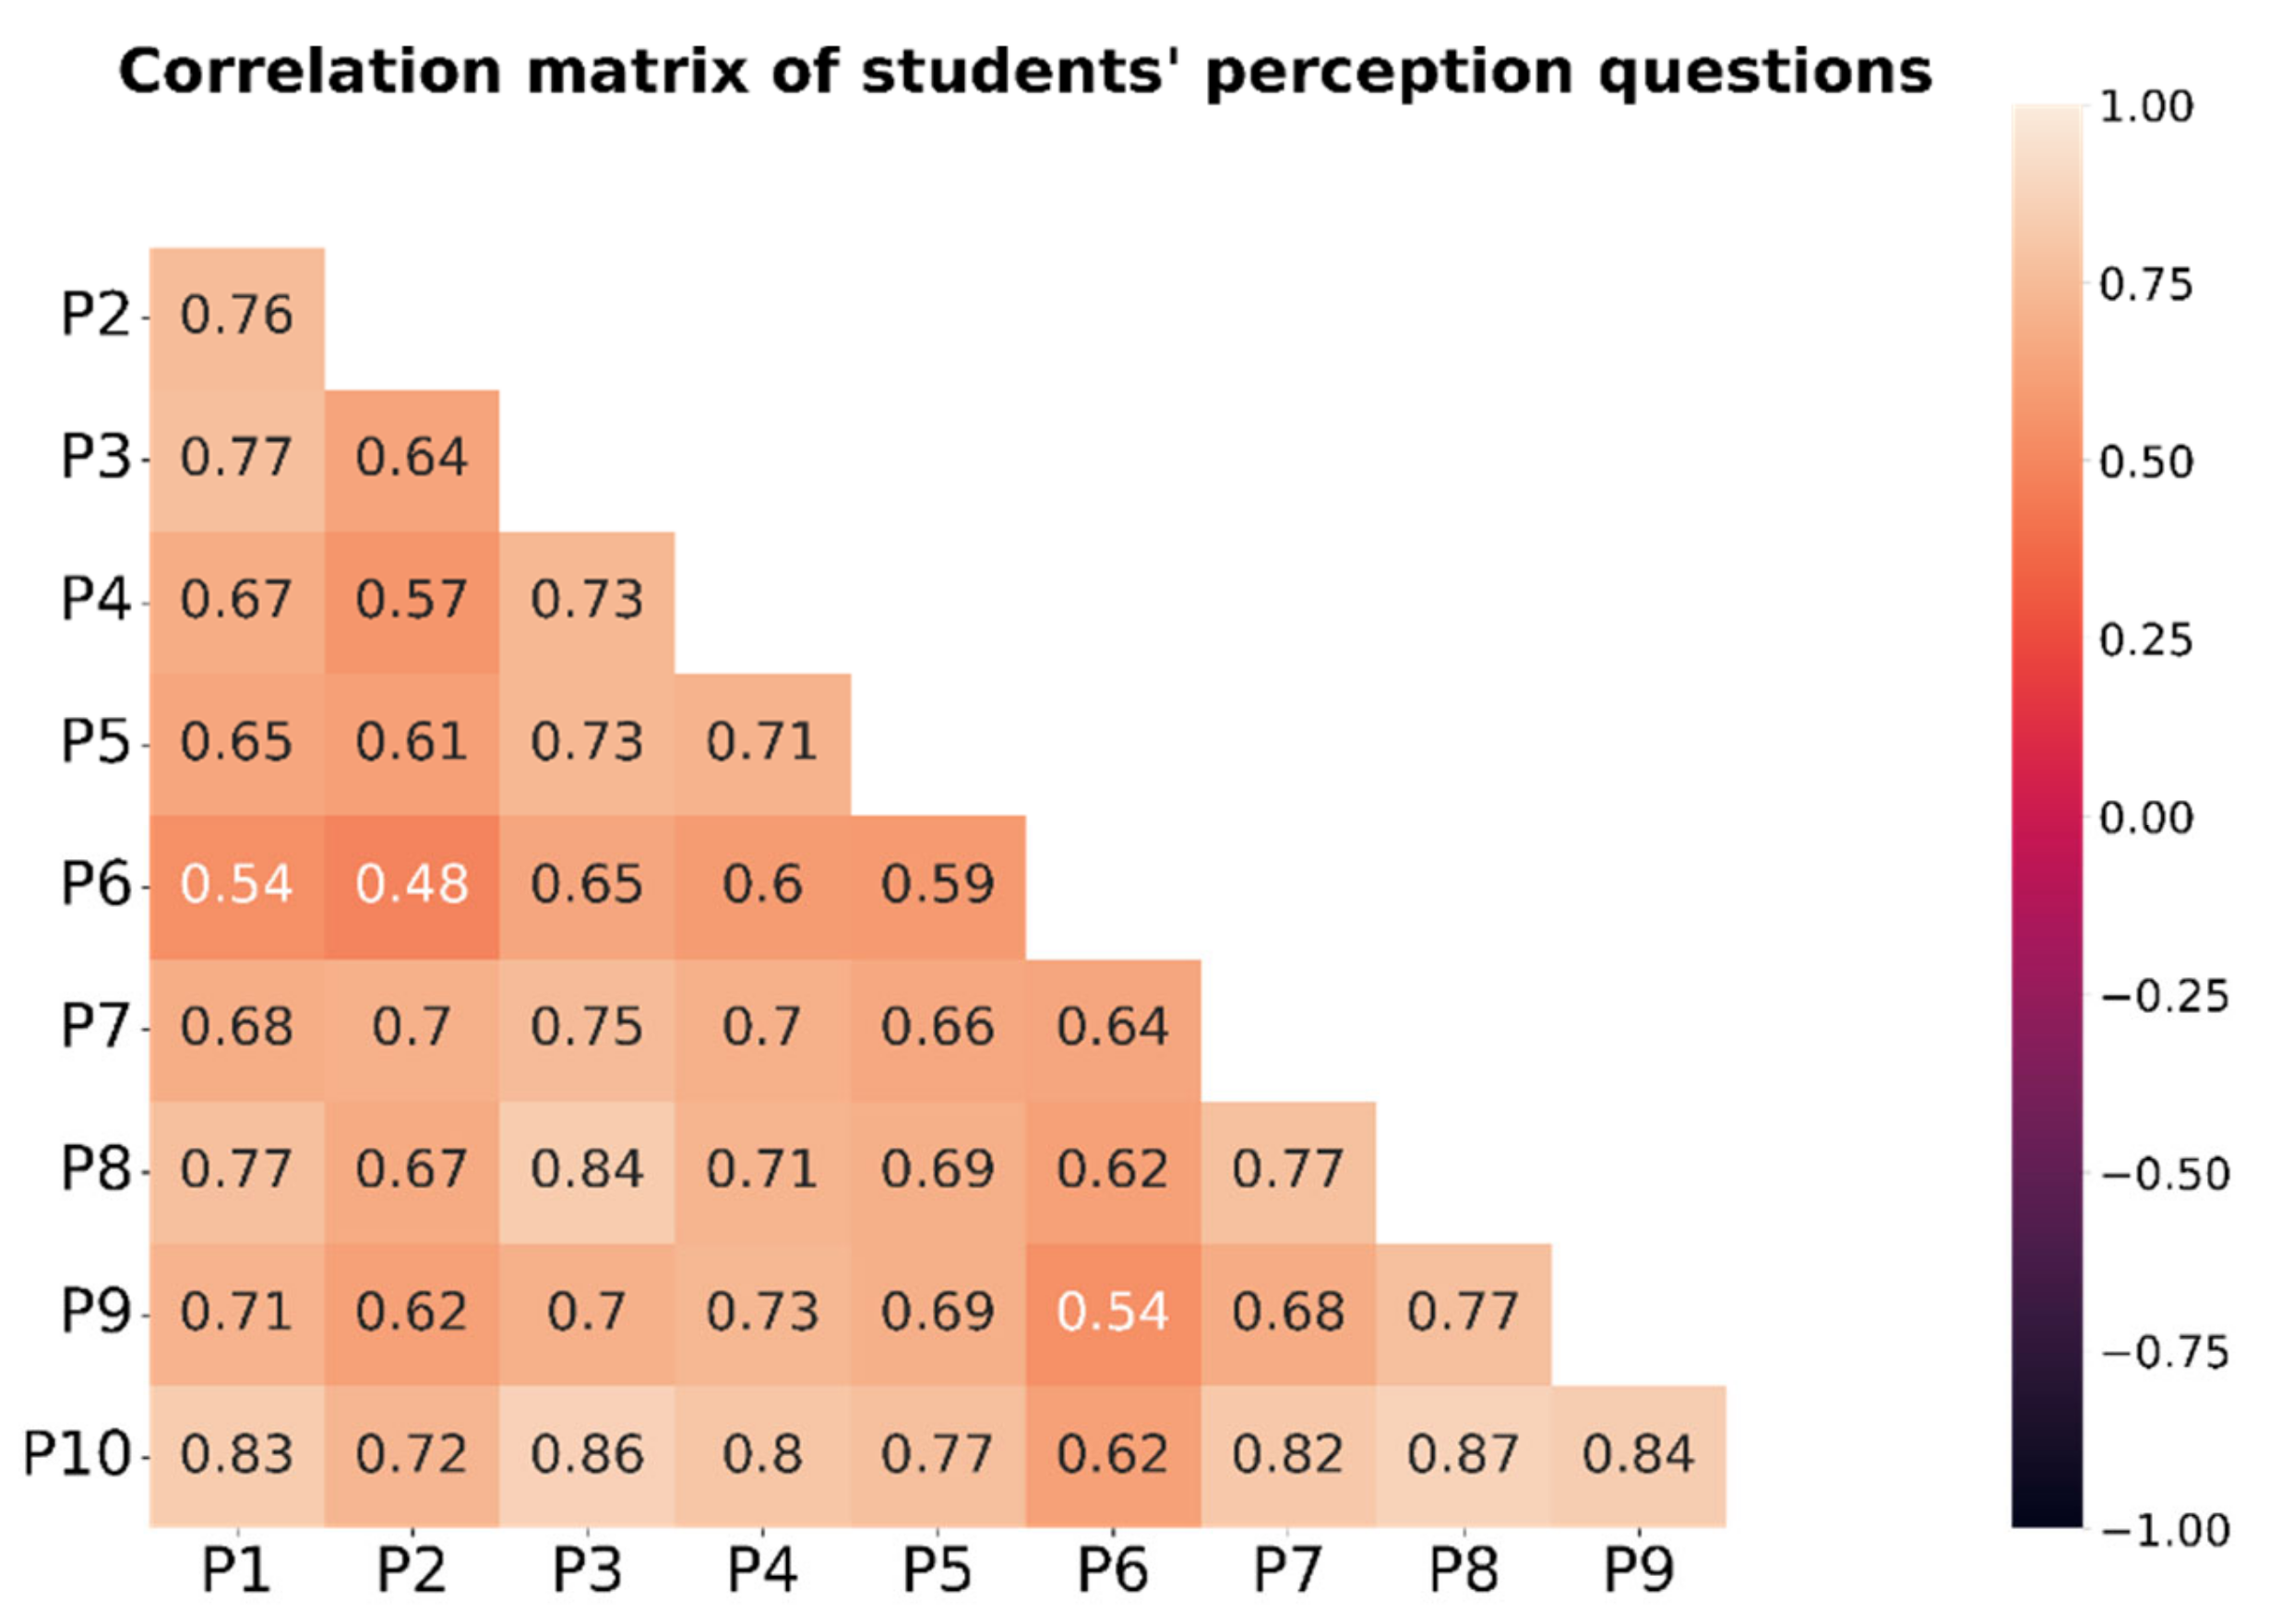
Statistical analysis on the questionnaire data was performed post-survey. The mean (standard deviation), median, and mode calculated from the responses revealed that students regarded the BMFC approach as being positive on a 5-star rating scale in 7 out of the 10 perception questions. This is supported by high pairwise correlations among the questions (the lowest at r = 0.48 and the highest at r = 0.87). In addition, multiple regression analysis using the first nine perception questions as predictors for the 10th question (overall satisfaction) revealed that six of these were statistically significant predictors (p < 0.05) of the overall satisfaction of the students surveyed, implying that an increase in the overall satisfaction could potentially be achieved by improving these key factors of the BMFC delivered certificate courses.
The findings of this study are equally relevant to other delivery modes in higher education, including distance learning and remote learning. By assessing students’ perception using a survey instrument such as the one proposed in this study, one can ascertain how satisfied students are with the learning and engagement in their study. In addition, one can also identify the key factors that may affect students’ overall satisfaction, while studying under a particular delivery mode. In turn, we anticipate that the results reported will add to the body of knowledge among the higher education community on the impact of innovative teaching and delivery approaches on students’ satisfaction on their learning and engagement post COVID-19.

Author Contributions

Conceptualization, P.K., F.R., T.D.M. and S.S.H.; methodology, P.K., F.R., T.D.M. and S.S.H.; software, P.K. and S.S.H.; validation, P.K., F.R., T.D.M. and S.S.H.; formal analysis, P.K., T.D.M. and S.S.H.; investigation, all authors.; resources, all authors; data curation, P.K.; writing—original draft preparation, P.K., F.R., T.D.M. and S.S.H.; writing—review and editing, all authors; supervision, P.K., F.R. and T.D.M.; project administration, P.K. and F.R.; funding acquisition, P.K., F.R. and R.K. All authors have read and agreed to the published version of the manuscript.

Funding

This research received no external funding.

Institutional Review Board Statement

The study was conducted according to the guidelines of the Declaration of Helsinki and approved by the Human Ethics Research Sub-Committee (25 March 2022) of the Scholarship and Research Committee of Melbourne Institute of Technology (Approval No. HERC-012022 on 25 March 2021).

Informed Consent Statement

Informed consent was obtained from all subjects involved in the study.

Data Availability Statement

Data used in this project has been collected by approval from the MIT Human Ethics Research Sub-Committee (25 March 2022). The data can be made available for interested readers by formal correspondence to Chair, Human Ethics Research Committee, Melbourne Institute of Technology, 288 La Trobe Street, Melbourne, VIC 3000, Australia.

Conflicts of Interest

The authors declare no conflict of interest.

Appendix A

Figure A1. Online survey used in the study.
Education 12 00535 g0a1Education 12 00535 g0a2Education 12 00535 g0a3Education 12 00535 g0a4Education 12 00535 g0a5Education 12 00535 g0a6

References

  1. Stacey, V. Australian Government Pumps $53M into International Education. The PIE News. Available online: https://thepienews.com/news/australian-govt-pumps-53m-package-into-international-education/ (accessed on 11 April 2022).
  2. Kuiper, A.; Solomonides, I.; Hardy, L. Time on task in intensive modes of delivery. Distance Educ. 2015, 36, 231–245. [Google Scholar] [CrossRef]
  3. Dixon, L.; O’Gorman, V. “sBlock teaching”–exploring lecturers’ perceptions of intensive modes of delivery in the context of undergraduate education. J. Furth. High. Educ. 2020, 44, 583–595. [Google Scholar] [CrossRef]
  4. Loton, D.; Stein, C.; Parker, P.; Weaven, M. Introducing block mode to first-year university students: A natural ex-periment on satisfaction and performance. Stud. High. Educ. 2022, 47, 1097–1120. [Google Scholar] [CrossRef]
  5. Memon, T.D.; Jurin, M.; Kwan, P.; Jan, T.; Sidnal, N.; Nafi, N. Studying Learner’s Perception of Attaining Graduate Attributes in Capstone Project Units Using Online Flipped Classroom. Educ. Sci. 2021, 11, 698. [Google Scholar] [CrossRef]
  6. Zeldenryk, L.; Bradey, S. The flexible learning needs and preferences of regional occupational therapy students in Australia. High. Educ. Res. Dev. 2013, 32, 314–327. [Google Scholar] [CrossRef]
  7. Karaksha, A.; Anoopkumar-Dukie, S.; Grant, G.; Davey, A.K.; Nirthanan, S.N.; Arora, D.; McDermott, C. Benefits of intensive mode teaching to improve student performance. Proceedings of The 6th International Conference of Education, Research and Innovation (ICERI), Seville, Spain, 18–20 November; 2013. Available online:http://www98.griffith.edu.au/dspace/bitstream/handle/10072/59795/90003_1.pdf (accessed on 15 April 2022).
  8. Harvey, M.; Power, M.; Wilson, M. A review of intensive mode of delivery and science subjects in Australian uni-versities. J. Biol. Educ. 2017, 51, 315–325. [Google Scholar] [CrossRef]
  9. Samarawickrema, G.; Cleary, K. Block Mode Study: Opportunities and Challenges for a New Generation of Learners in an Australian University. Stud. Success 2021, 12, 13–23. [Google Scholar] [CrossRef]
  10. Mccluskey, T.; Smallridge, A.; Weldon, J.; Loton, D.; Samarawickrema, G.; Cleary, K. Building on the VU Block foundations: Results from the inaugural first year cohort. Res. Dev. High. Educ. Next Gener. High. Educ. Chall. Chang. Oppor. 2020, 42, 61–72. [Google Scholar]
  11. Samarawickrema, G.; Galloway, T.; Raponi, K.; Everett, G. A Participatory Evaluation of Transforming First Year LLB Into Block Mode. Leg. Educ. Rev. 2020, 30, 1–17. [Google Scholar] [CrossRef]
  12. Sewagegn, A.A.; Diale, B.M. Modular/Block teaching: Practices and challenges at higher education institutions of Ethiopia. Teach. High. Educ. 2021, 26, 776–789. [Google Scholar] [CrossRef]
  13. Overland Literary Journal. Against the Block Model (n.d.). Available online: https://overland.org.au/2020/02/against-the-block-model/ (accessed on 15 April 2022).
  14. Male, S. Student Experiences of Threshold Capability Development with Intensive Mode Teaching. Ph.D. Thesis, University of Tasmania, Burnie, Australia, 2018. [Google Scholar]
  15. Bergmann, J.; Sams, A. Flip Your Classroom: Reach Every Student in Every Class Every Day; International Society for Technology in Education: Washington, DC, USA, 2012. [Google Scholar]
  16. Bonk, C.J.; Graham, C.R. The Handbook of Blended Learning: Global Perspectives, Local Designs; John Wiley & Sons: Hoboken, NJ, USA, 2012. [Google Scholar]
  17. Osguthorpe, R.T.; Graham, C.R. Blended learning environments: Definitions and directions. Q. Rev. Distance Educ. 2003, 4, 227–233. [Google Scholar]
  18. Davies, R.S.; Dean, D.L.; Ball, N.L. Flipping the classroom and instructional technology integration in a college-level information systems spreadsheet course. Educ. Technol. Res. Dev. 2013, 61, 563–580. [Google Scholar] [CrossRef]
  19. Brewer, R.; Movahedazarhouligh, S. Successful stories and conflicts: A literature review on the effectiveness of flipped learning in higher education. J. Comput. Assist. Learn. 2018, 34, 409–416. [Google Scholar] [CrossRef]
  20. Gilboy, M.B.; Heinerichs, S.; Pazzaglia, G. Enhancing Student Engagement Using the Flipped Classroom. J. Nutr. Educ. Behav. 2015, 47, 109–114. [Google Scholar] [CrossRef] [PubMed]
  21. Milman, N.B. The flipped classroom strategy: What is it and how can it best be used? Distance Learn. 2012, 9, 85. [Google Scholar]
  22. Tan, D.Y.; Kwan, W.L.; Koh, L.L.A.; Pee, G.-Y.M.; Lur, K.T.; Yeo, Z.Y. Virtual Dissection Activities as a Strategy for Blended Synchronous Learning in the New Normal. In Proceedings of the 2022 IEEE Global Engineering Education Conference (EDUCON), Tunis, Tunisia, 28–31 March 2022; pp. 565–570. [Google Scholar] [CrossRef]
  23. Sadler-Smith, E.; Smith, P.J. Strategies for accommodating individuals’ styles and preferences in flexible learning programmes. Br. J. Educ. Technol. 2004, 35, 395–412. [Google Scholar] [CrossRef]
  24. Strelan, P.; Osborn, A.; Palmer, E. The flipped classroom: A meta-analysis of effects on student performance across disciplines and education levels. Educ. Res. Rev. 2020, 30, 100314. [Google Scholar] [CrossRef]
  25. Chen, L.; Chen, T.-L.; Chen, N.-S. Students’ perspectives of using cooperative learning in a flipped statistics classroom. Australas. J. Educ. Technol. 2015, 31, 6. [Google Scholar] [CrossRef]
  26. Toepoel, V.; Vermeeren, B.; Metin, B. Smileys, Stars, Hearts, Buttons, Tiles or Grids: Influence of Response Format on Substantive Response, Questionnaire Experience and Response Time. Bull. Sociol. Methodol./Bull. Méthodologie Sociol. 2019, 142, 57–74. [Google Scholar] [CrossRef] [Green Version]
  27. Tavakol, M.; Dennick, R. Making sense of Cronbach’s alpha. Int. J. Med. Educ. 2011, 2, 53. [Google Scholar] [CrossRef] [PubMed]
Figure 1. Correlation coefficients of students’ perception questions (P1 to P10).
Education 12 00535 g001
Figure 2. Mean and mode of the overall satisfaction (P10) ratings by undergraduate and postgraduate students. Postgraduate students have a higher overall satisfaction of the certificate courses.
Education 12 00535 g002
Table 1. Participant related questions included in the first section of the questionnaire.
CodeDescriptionChoices
D1 *GenderMan, Woman, Non-binary, or Prefer not to say
D2Employment StatusFull-time, Part-time, Casual, Unemployed, or Other
D3How many years of work experience do you have?Less than 2 years, 2–5 years, 5–8 years, or more than 8 years
D4Certificate Course EnrolledUndergraduate Certificate, Graduate Certificate in Data Analytics, Graduate Certificate in Cyber Security and Networking, Graduate Certificate in Information Technology, or Other
D5Relevant to your certificate course, how many years of work experience do you have?None, Less than 2 years, 2–5 years, 5–8 years, or more than 8 years
D6How long ago did you finish your last degree?Less than 2 years, 2–5 years, 5–8 years, or more than 8 years
D7How many hours per week on average did you devote to your study?Less than 5 h, 5–10 h, 10–15 h, or more than 15 h
D8Motivations for enrolling in the Certificate Courses (Select all that apply):Caree change, Career advancement, Gaining expertise, or Other
D9In the near future, do you intend to undertake another certificate or degree program related to your current certificate?Yes, No, Maybe, or Undecided
* ‘D’ in front of a number in the Code column above denotes ‘Demographic’.
Table 2. Students’ perception questions in the online questionnaire.
CodeQuestionResponse
P1 *How would you rate your satisfaction of the block mode and flipped learning delivery of the certificate course in relation to the quality of learning and engagement?⭐⭐⭐⭐⭐
P2How would you rate your satisfaction of the block mode and flipped learning delivery of the certificate course in terms of maintaining a work-study balance?⭐⭐⭐⭐⭐
P3How would you rate your satisfaction of the quality of the learning materials?⭐⭐⭐⭐⭐
P4How would you rate your satisfaction of the quality of the workshop sessions?⭐⭐⭐⭐⭐
P5How would you rate your satisfaction of the quality of assessment feedback received?⭐⭐⭐⭐⭐
P6How would you rate your satisfaction of the quality of the posts in the discussion forum?⭐⭐⭐⭐⭐
P7How would you rate your satisfaction of the quality and quantity of assessments in the certificate course in helping you develop complex problems-solving skills?⭐⭐⭐⭐⭐
P8How would you rate your satisfaction of the certificate course in preparing you to be job-ready in the field of study?⭐⭐⭐⭐⭐
P9How would you rate your satisfaction of the quality of academic support received?⭐⭐⭐⭐⭐
P10How would you rate your overall satisfaction of the certificate course?⭐⭐⭐⭐⭐
* ‘P’ in front of a number in the Code column above denotes ‘Perception’.
Table 3. Survey respondents grouped by certificate level, subjects, and their gender.
Certificate LevelTotal EnrolmentNo. of ResponsesMaleFemalePrefer Not to Say
Undergraduate58201901
Postgraduate507148105367
Total565168124368
Table 4. Measures of central tendency for each of the 10 perception questions.
QuestionPercentage Rated between “4–5” for Each of the 10 Perception QuestionsMean (Stdev) *MedianMode
P1 Education 12 00535 i0013.39 (1.40)4.04.0
P2 Education 12 00535 i0023.52 (1.26)4.04.0
P3 Education 12 00535 i0033.07 (1.41)3.04.0
P4 Education 12 00535 i0043.39 (1.33)4.04.0
P5 Education 12 00535 i0052.98 (1.47)3.04.0
P6 Education 12 00535 i0063.40 (1.27)4.04.0
P7 Education 12 00535 i0073.41 (1.31)4.04.0
P8 Education 12 00535 i0082.97 (1.31)3.03.0
P9 Education 12 00535 i0093.32 (1.34)4.04.0
P10 Education 12 00535 i0103.21 (1.39)3.04.0
* Standard Deviation.
Table 5. Mean correlation coefficient (MCC) of perception questions. P10 has the highest mean correlation coefficient.
Question CodeMCC
P10.71
P20.64
P30.74
P40.69
P50.68
P60.59
P70.71
P80.75
P90.70
P100.79
Table 6. The results of running multiple regression on the model of Equation (3), where the value of R Square (bold) shows that the model captures 90% of the variance in the data.
Multiple R0.951173
R Square0.904731
Adjusted R Square0.899304
Standard Error0.441799
Observations168
Table 7. The model of Equation (3) is a significant predictor of the outcome variable P10, which is the overall satisfaction, with F(9,158) = 166.72, p < 0.05.
ANOVA Alpha (α)0.05
dfSSMSFp-Valuesig
Regression9292.868832.54098166.726.39 × 10−76yes
Residual15830.839490.195187
Total167323.7083
Table 8. The coefficients (a0, …, a9) are not all significant based on the p-value < α, which is 0.05. In the table, only the predictors P1, P3, P4, P7, P8, and P9 are significant contributors in capturing the variance in the data (see bold on the p-value column). Comparing the values of the coefficients, we can observe that a2, a5 and a6 (see bold on the coefficients column) have lesser effects on the model than the rest of the coefficients.
CoeffStd Errt Statp-ValueLowerUpperVif
Intercept−0.357240.119601−2.986920.003268−0.59346−0.12101
P10.1736490.0478753.6271150.0003860.0790910.2682073.82641
P20.023640.0460530.5133230.608442−0.067320.11462.867605
P30.197430.0523043.7746470.0002260.0941250.3007364.669344
P40.1132760.0451382.5095390.0130960.0241240.2024293.088265
P50.0675960.0389511.7354370.084613−0.009330.1445272.805563
P6−0.048670.037966−1.282030.20171−0.123660.0263131.981199
P70.1757750.0487933.6024410.0004220.0794040.2721463.520929
P80.155720.0580412.6829070.0080750.0410830.2703574.916368
P90.2430690.0459475.2902634.02 × 10−70.1523210.3338183.226117
Publisher’s Note: MDPI stays neutral with regard to jurisdictional claims in published maps and institutional affiliations.

