Article

Self-Regulated Learning Strategies as Predictors of Perceived Learning Gains among Undergraduate Students in Ethiopian Universities

1
Institute of Medical Education, University Hospital, LMU Munich, 80336 Munich, Germany
2
Institute of Educational Research (IER), Addis Ababa University, Addis Ababa P.O. Box 1176, Ethiopia
3
Department of Psychology, College of Social Sciences and the Humanities, University of Gondar, Gondar P.O. Box 196, Ethiopia
4
Department of Psychology, Jimma University, Jimma P.O. Box 378, Ethiopia
5
Department of Educational Planning and Management, Jimma University, Jimma P.O. Box 378, Ethiopia
6
Department of Teacher Education and Curriculum Studies, Jimma University, Jimma P.O. Box 378, Ethiopia
*
Author to whom correspondence should be addressed.
Educ. Sci. 2022, 12(7), 468; https://doi.org/10.3390/educsci12070468
Submission received: 4 May 2022 / Revised: 26 June 2022 / Accepted: 28 June 2022 / Published: 6 July 2022

Abstract

:
Despite increasing focus on the importance of self–regulated learning for undergraduate students in universities in recent years, very little is known about its specific features in universities in developing countries, in general, and Ethiopia, in particular. This study examined the relationships of self-regulated learning strategies (SRLSs) with perceived learning and further assessed the relationships within the SRLS components in Ethiopian public universities. For this, the authors adopted Pintrich’s self-regulation theory as a guiding framework and used structural equation modeling (SEM) analysis. The sample used in the analysis pooled survey data from three randomly selected public universities and included volunteer undergraduate students having a major in Business and Economics and Engineering and Technology fields (n = 1142; male = 700 and female = 442), with mean age = 21.98 and SD = 2.50. The results indicated that the student SRLS and perceived learning gains scores were average values in terms of the magnitude of those measured variables. A two–step hierarchical regression analysis showed that the five components of SRLS that emerged from SEM analysis significantly predicted students’ perceived learning over and above the control variables (ΔR2 ≥ 0.38 and 39%) for the total samples. Moreover, the regression results showed that greater predictions were observed for the help–seeking component (0.35 ≤ β ≥ 0.47) than others, significantly positively predicting the perceived learning for the total samples. Overall, the findings of this study indicate that the SRLSs are relevant mechanisms to aid student success in higher education. The implications of the study are highlighted.

1. Introduction

It is becoming increasingly clear that successful higher education (HE) students are those who can independently plan academic activities, collaborate with others, work in teams, and clearly communicate ideas both in the physical and digital spaces [1,2]. Moreover, they are active and informed citizens who act with moral and ethical integrity [3]. These stated descriptors of successful HE students are inarguably positive outcomes, representing a combination of both academic and non–academic results [4] of effective teaching and learning in universities [5]. Indeed, planning, collaboration, teamwork, and communication all require the motivation to engage [6], some cognitive understanding of the tasks [7], and above all, cognitive and emotional capacity to self–monitor and regulate behavior [8].
The quality of undergraduate students’ learning experience is a primary concern of higher education institutions (HEIs) in the 21st century [9]. At present, a pedagogical paradigm shift is underway in HE in many parts of the world. This paradigm is characterized by a shifting away from focusing purely on the substantive contents of subject matter towards examining the learning mechanisms and processes [10,11], and this shift is now widely considered as a best practice in undergraduate education [12]. Guided by this, more practical approaches and methods are included in undergraduate courses, for example, problem–based learning, inquiry learning, project work, and simulations of workplace environments using computer-assisted learning [13,14,15,16]. Similarly, many HE academics have designed a range of practices to equip students with job-related skills to ease their transition into the world of work [17]. These efforts are happening primarily to leverage 21st–century learning by creating caring, diverse classroom cultures and improving the quality of students learning experience, thereby advancing the outcomes of undergraduate education [18].
The stakeholders of HE understand that such positive outcomes do not occur by default and undoubtedly require the exertion of continual effort and commitment [19]. Scholars argue that the overarching development of student learning experiences and outcomes requires a change in the curriculum [20], a shift in pedagogical perspective [21,22], a conducive learning environment [23,24], relevant mechanisms and processes [25], and thought and self–reflection [26,27]. The self–regulated learning strategies (SRLSs) are generally accepted as a playing a relevant role in undergraduate students’ success [28].
Self-regulated learning (SRL) denotes “an active, constructive process whereby learners set goals for their learning and attempt to monitor, regulate, and control their cognitions, motivation, and behavior, guided and constrained by their goals and the contextual features in the environment” [29] (p. 453). In the context of undergraduate education, this could mean, for example, students spending time in extra thought regarding how they learn and the strategies they will need to succeed in their enrolled coursework [30]. To achieve a specific learning goal, a self–regulated learner uses metacognitive, motivational, and behavioral processes, for instance, goal setting, metacognitive monitoring, help–seeking, and self–regulation [31]. However, in most empirical studies focusing on the effectiveness of SRLSs on undergraduate student’s learning, the relationship has been examined between the SRLSs and the learning outcomes (actual learning and perceived learning) [32]. It is important to clarify that actual learning and perceived learning are separate and distinct concepts [33], and also have variances in their assessment methods.
Actual learning reflects a change in knowledge identified by rigorous learning measures, and perceived learning represents the student’s self–reported gains in knowledge or skills [34]. Seen from the perspective of assessment, actual learning is assessed using direct measures, whereas perceived learning is assessed using indirect measures of learning. Elbeck and Bacon [35] describe direct measures as “scoring a student’s task performance or demonstration as it relates to the achievement of a specific learning goal” (p. 282). Direct measures of learning consist of diverse assessment tools far beyond multiple-choice exams. For example, case write–ups, practical tests, live and video simulations, or oral examinations scored with rubrics [14,36,37]. Perceived learning can be measured by self-reports of “the difference between the skills, competencies, content knowledge and personal development demonstrated by students at two points in time” [38] (p. xi) and via self–reports. In this sense, self–reporting of learning is a type of indirect measure obtained through a student’s gains in knowledge, skills, and values, generally based on some reflection and introspection [39]. Hence, it is clear that direct measures are measures of actual learning, and self–reporting of learning gains, one type of indirect assessment, is a measure of perceived learning.
The SRLS is relevant for undergraduate students being prepared for lifelong learning and the capacity to transfer skills, knowledge, and abilities [40]. Given the broader context that requires university students to manage their day–to–day lives as part of their time management at university, it is important to conceptualize SRLSs more broadly through the strategic components, including metacognition, time and study environment management, peer learning, and help–seeking [41].
Metacognition refers to the student’s awareness, knowledge, and control of cognition [42]. The metacognitive strategies comprise three general processes: planning, monitoring, and regulating, which makes the control and self–regulation aspects of metacognition apparent [43]. Another relevant component of the SRLS is that of time and study environment management. Time and study environment management is an important means to actively manage when, where, and for how long students engage in activities, if necessary, to reach their academic goals. Effort regulation is another component, in which a student manages their ability to control their effort and attention. Effort management reflects a commitment to completing one’s study goals, even under challenging circumstances [44]. Another component of the SRLS is managing the support of others, which comes from peers and instructions [45].
Self–regulated learning strategies (SRLSs) are relevant mechanisms for students to learn effectively through the process [46]. However, minimal evidence exists that assesses whether the undergraduate curricula provide students the opportunities to develop such relevant skills [8]. A growing body of research shows that most undergraduate students face a range of new challenges when they study at university, primarily due to the changed circumstance in the learning and study environment, and a corresponding failure to use SRLSs [47]. This deficiency is one source of weakness in using effective learning skills, both in face–to–face and digital learning environments, and a contributor to poor academic performance [48].
Although many researchers have investigated the impact of SRLSs on academic outcomes such as grades [49,50,51], little is known about the use of SRLSs for perceived learning outcomes [52]. Moreover, there is limited empirical evidence in the HE research literature regarding how the SRLSs and perceived learning gains are related in the context of African higher education. Given this reality, it is important to study the SRLSs and other social–contextual factors and whether they contribute to students’ learning, rather than focusing narrowly on outcome measures such as undergraduate students’ acquired knowledge, values, and practical competence [53]. The purpose of the current study was to examine the relationships between SRLSs and perceived learning gains in order to determine whether evidence supports the connection between SRLSs and undergraduate learning. The following research questions guided the study:
  • What is the state of SRLSs and perceived learning among undergraduate students in Ethiopia?
  • To what extent do the SRLS components relate to one another as perceived by undergraduate students in the context of Ethiopian universities?
  • Do the SRLS components predict a university student’s perceived learning after accounting for the control factors in universities in Ethiopia?
The following hypotheses were formulated:
Hypothesis H1.
There is a significant positive relationship between the SRLS components in undergraduate students in a university setting.
Hypothesis H2.
There is a significant positive relationship between SRLS and the perceived learning in undergraduate students in a university setting.

2. Materials and Methods

2.1. Study Design

This study used a cross–sectional survey design to collect quantitative data from the undergraduate students enrolled in majors in the college of Business and Economics and the college of Engineering and Technology, in three public universities in Ethiopia. This cross–sectional study design was found to be appropriate because it allowed the authors to collect data from a large pool of undergraduate student participants.

2.2. Theoretical Framework and Empirical Background

Zimmerman [42] describe SRL and performance as “the processes whereby learners personally activate and sustain cognitions, affects, and behaviors that are systematically oriented toward the attainment of personal goals”. This corresponds to the view of Pintrich [29] that self–regulation is the regulation of cognition, motivation behavior, and context. Seen in this way, self–regulation is “an active, constructive process whereby learners set goals for their learning and then attempt to monitor, regulate, and control their cognition, motivation, and behavior, guided and constrained by their goals and the contextual features in the environment” [31] (p. 453). A focus on SRL has emanated from the empirical evidence that shows that self–regulatory learning is an effective means to improve achievements of students [54,55]. Moreover, the potency of the SRL components has been empirically justified. For example, a study highlighted that ”metacognitive skillfulness outweighs intelligence as predictor of learning performance” [56] (p. 159).
HE students having well–developed SRLSs understand how to evaluate their academic abilities, monitor their learning and development progress over time, strategically make efforts, and utilize opportunities in the environment to help achieve their goals [46]. Moreover, they were found to achieve higher performance in terms of both academic and non–academic outcomes [52].
Triggered mainly by the heightened interest in learning strategies in HE, numerous studies have been undertaken on the corresponding measures of SRL. The SRL consists of the cognitive, metacognitive, behavioral, motivational, and emotional/affective aspects of learning. However, in contrast to the original version of the motivated strategies for learning questionnaire (MSLQ) [45], subsequent usage of this instrument did not capture the broad variants of SRL. Both Zimmerman and Schunk [57] and Pintrich [44] acknowledge the complexity of the research, which is due to a broad range of self-regulation perspectives, leading to varied assessment methods.
A systematic review of the self-report instruments of SRL in HE categorized the existing instruments into two broad categories of process–oriented and component–oriented instruments [58]. According to the same authors, process–oriented implies a focus on the nature of the process, whereas component–oriented implies a focus on the components. Hence, unlike the process–oriented self–report instruments, these component-oriented instruments focus on the self-regulation strategies.
In this study, the authors used a component-oriented self–report of SRLSs including components suggested in the literature such as metacognitive strategies and resource management strategies [59]. Furthermore, resources are defined broadly in terms of time, study environment context, and peers and instructors [44,60]. The focus on SRLSs is consistent with this study’s primary concerns to investigate the undergraduate students’ use of SRLS.

2.3. Participants of the Study

The study population included undergraduate students in the setting of Ethiopian public universities. The study samples were selected using a three–stage sampling strategy. First, the different public universities were classified into six clusters as proposed by the Ethiopian Higher Education Relevance and Quality Agency’s (HERQA’s) recent classification. From this, one cluster was selected. The selection of the cluster determined the universities to be involved in the study. Then, three universities were selected randomly from the specified cluster based on three generations of the universities’ schemes proposed by HERQA. Then, a stratified sampling technique was used to select 10% of the students from each of the sampled universities, stratified by college, class year, and gender.
The sample used in the analysis pooled survey data from three randomly selected public universities and included undergraduate students having majors in Business and Economics and Engineering and Technology fields. Of the 1250 administered consent forms, 50 were deemed non-responders as they did not return the questionnaires. In addition, another 4.64% (n = 58) of participants’ survey responses were discarded prior to data analysis because of partial response (i.e., more than 50% of the necessary information was not completed). Hence, the final sample participants consisted of 1142 undergraduate students. More detailed information about the study participants’ demographic profile is presented in the results section.

2.4. Data Collection Instrument and Validty Evidences

In this study, the authors used a contextually modified SRLS questionnaire [61]. This questionnaire was originally extracted from the Motivated Strategies for Learning Questionnaire (MSLQ), which was developed to measure the types of learning strategies and academic motivation used by college students [62]. The original MSLQ has relevant components to measure the overall learning strategies and motivation, consisting of ten components [30]. Although empirical data exist on the validation of the MSLQ, questionnaire, Boekaerts and Corno [63] identified substantial variability in SRL assessment methods across the existing empirical studies. Hence, following Pintrich [29], this study questionnaire consisted of 26 items used to measure the five SRLS’s components, namely, metacognition, time and study environment management, effort regulation, peer learning, and help–seeking.
For this study, the measurement model was specified a priori, and the construct was analyzed using covariance–based structural equation modeling using the maximum likelihood estimation method [64] within the Stata statistical analysis package [65]. Accordingly, items were allowed to load on only one hypothesized factor, factors were allowed to correlate freely, factor variances were set to one, and error terms were not allowed to correlate. The factorial validity of the scores derived from the scale was assessed by examining the item factor loadings. Here, items were considered for deletion if they displayed large standardized residuals (>2) or if an item had a low factor loading <0.40 [66]. Of the total number of 27 items, only one produced a factor loading below 0.04 and was removed from the model.

2.5. Data Analyses Methods

This part of the report presents the analyses and interpretations of the results of the study. The summaries of results are presented in tables and figures so as to help readers easily understand the major results and the meanings attached to them. The tables and figures are also organized systematically so that the demographic characteristics of the students are first presented to give the general overview of the participants in the study. Second, the factor structures of the SRL construct and the correlation within the factors for all samples are presented to give basic information about the factor loadings and structures, and demonstrate the interrelationship between the SRL factors. Third, three separate partial correlation analyses are presented to demonstrate the levels of associations found between the anticipated independent variables (demographic and contextual factors) and dependent variables of interest (perceived learning and development outcomes). Finally, results of the regression analyses are presented using the regression models and summary tables representing the prediction of variables in a two-step hierarchical regression analysis.
In this study, the authors used a two–step hierarchical regression analysis, allowing the contextual variables to predict the outcomes measured, followed by the addition of the SRL variables in the second step. We entered potent contextual predictors in step one, followed by the SRL components in a second step to determine the degree of variance in each outcome explained by the second step (the SRL components). Figure 2 illustrates simplified visual models of the general regression model.

2.6. Preliminary Analyses

Estimates of internal consistency for the total scale and each subscale were calculated using a pilot sample of reliability of volunteer undergraduate students in the College of Education and Behavioral Sciences at Jimma University (n = 44). Estimates of internal consistency for the pilot study exceeded α > 0.70. These alpha coefficients are acceptable according to the psychological research literature [67].
In order to identify the potent contextual variables, the authors ran three separate partial correlations analyses, testing the independent relationship of each contextual variables against each outcome measure. The partial correlation analysis presents the partial correlation coefficient of a specified variable with each variable in a variable list after removing the effects of all other variables in the variable list. The corresponding significance is also reported. The independent variables included the following ten variables: university, college, gender, age, resident, Ethiopian Preparatory School Completion Exam (EPSCE), attendance rate, study hours, overall academic preparation, and academic preparation during the regular program. Table 1 presents the partial correlation analyses results for the three dependent variables (gains in personal and social development, gains in general education, and gains in practical competence).
As shown in Table 1, independent variables such as resident, class year, attendance, and academic preparation had a significant p-value, meaning these independent variables had a consistent significant relationship with each outcome variable measure while controlling the effect of the other independent variables on each outcome measure. These four contextual variables were used in the regression models and in the description of the results.

3. Results

This section presents the findings of the study. For simplicity of the presentation the substantive contents are divided into three major sub headings: Section 3.1 Results of demographic information and descriptive analysis; Section 3.2. Results of factor structure and model fitness; and Section 3.3. Results of regression analyses using SEM.

3.1. Demographic Information and Descriptive Analyses Results

Demographic Information about the Student Participants

The study participants included in the final analysis were volunteer students (n = 1142; male = 700 and female = 442) from three universities in Ethiopia with Mean age = 21.98 and SD = 2.50. Table 2 presents the demographic information of the student participants.
As shown in Table 2, in our sample there were more male undergraduate students than female students. The reported gender proportion in this study, that is, 61.3% males and 38.7% females, is similar to that of a recent government report that revealed a similar proportion of males and females in the entire HE system in the country. In terms of major area discipline, a large majority (66%) of the sampled undergraduate students were Engineering majors, and the remaining 34% were Business majors. In terms of the residential status, most of the students lived on campus, accounting for 73% and 84% of the women and men students, respectively. Compared to the men students, the proportion of women students who lived off campus was slightly higher (11% more than the men participants). Of the total sample of undergraduate students involved in this study, only 20% were first-year students, 30% were second-year, 32% were third-year, and the remaining 18% were fourth–and–fifth-year students. Almost all of the fourth–and–fifth-year students were Engineering majors.
Seen from the attendance and preparation perspective, most of the students attended more than 75% of the regular classes, and were prepared or somewhat prepared. However, it was concerning that nearly 10% of the students attended less than 50% of the regular classes. It was also concerning that another 16% of the students were not prepared for the academic activities.

3.2. Results of Descriptive Statistics for the SRL Components and Perceived Learning Gains

We also present a descriptive statistics table summarizing the scores for the dependent and independent variables. This is a helpful table for thinking about the data analysis and the statistical procedures. Table 3 shows the summary results of the descriptive statistics (means, standard deviations) for the SRLS and perceived learning gains components, in addition to the number of items and Cronbach alphas.
As shown in Table 3, the most prevalent self-regulatory strategy reported by the undergraduate student sample was students’ time management and study skills (M = 2.62, SD = 0.67), whereas the least prevalent strategy reported was effort regulatory behavior (M = 2.38, SD = 0.75). In terms of perceived learning gains, the scores for the three components were above average and slightly higher than the scores for the SRL components, with the mean ranging between 2.72 and 2.78. As the results of the reliability analysis for each component indicate, the Cronbach alpha coefficient ranged between 0.72 and 0.90 (Table 3).

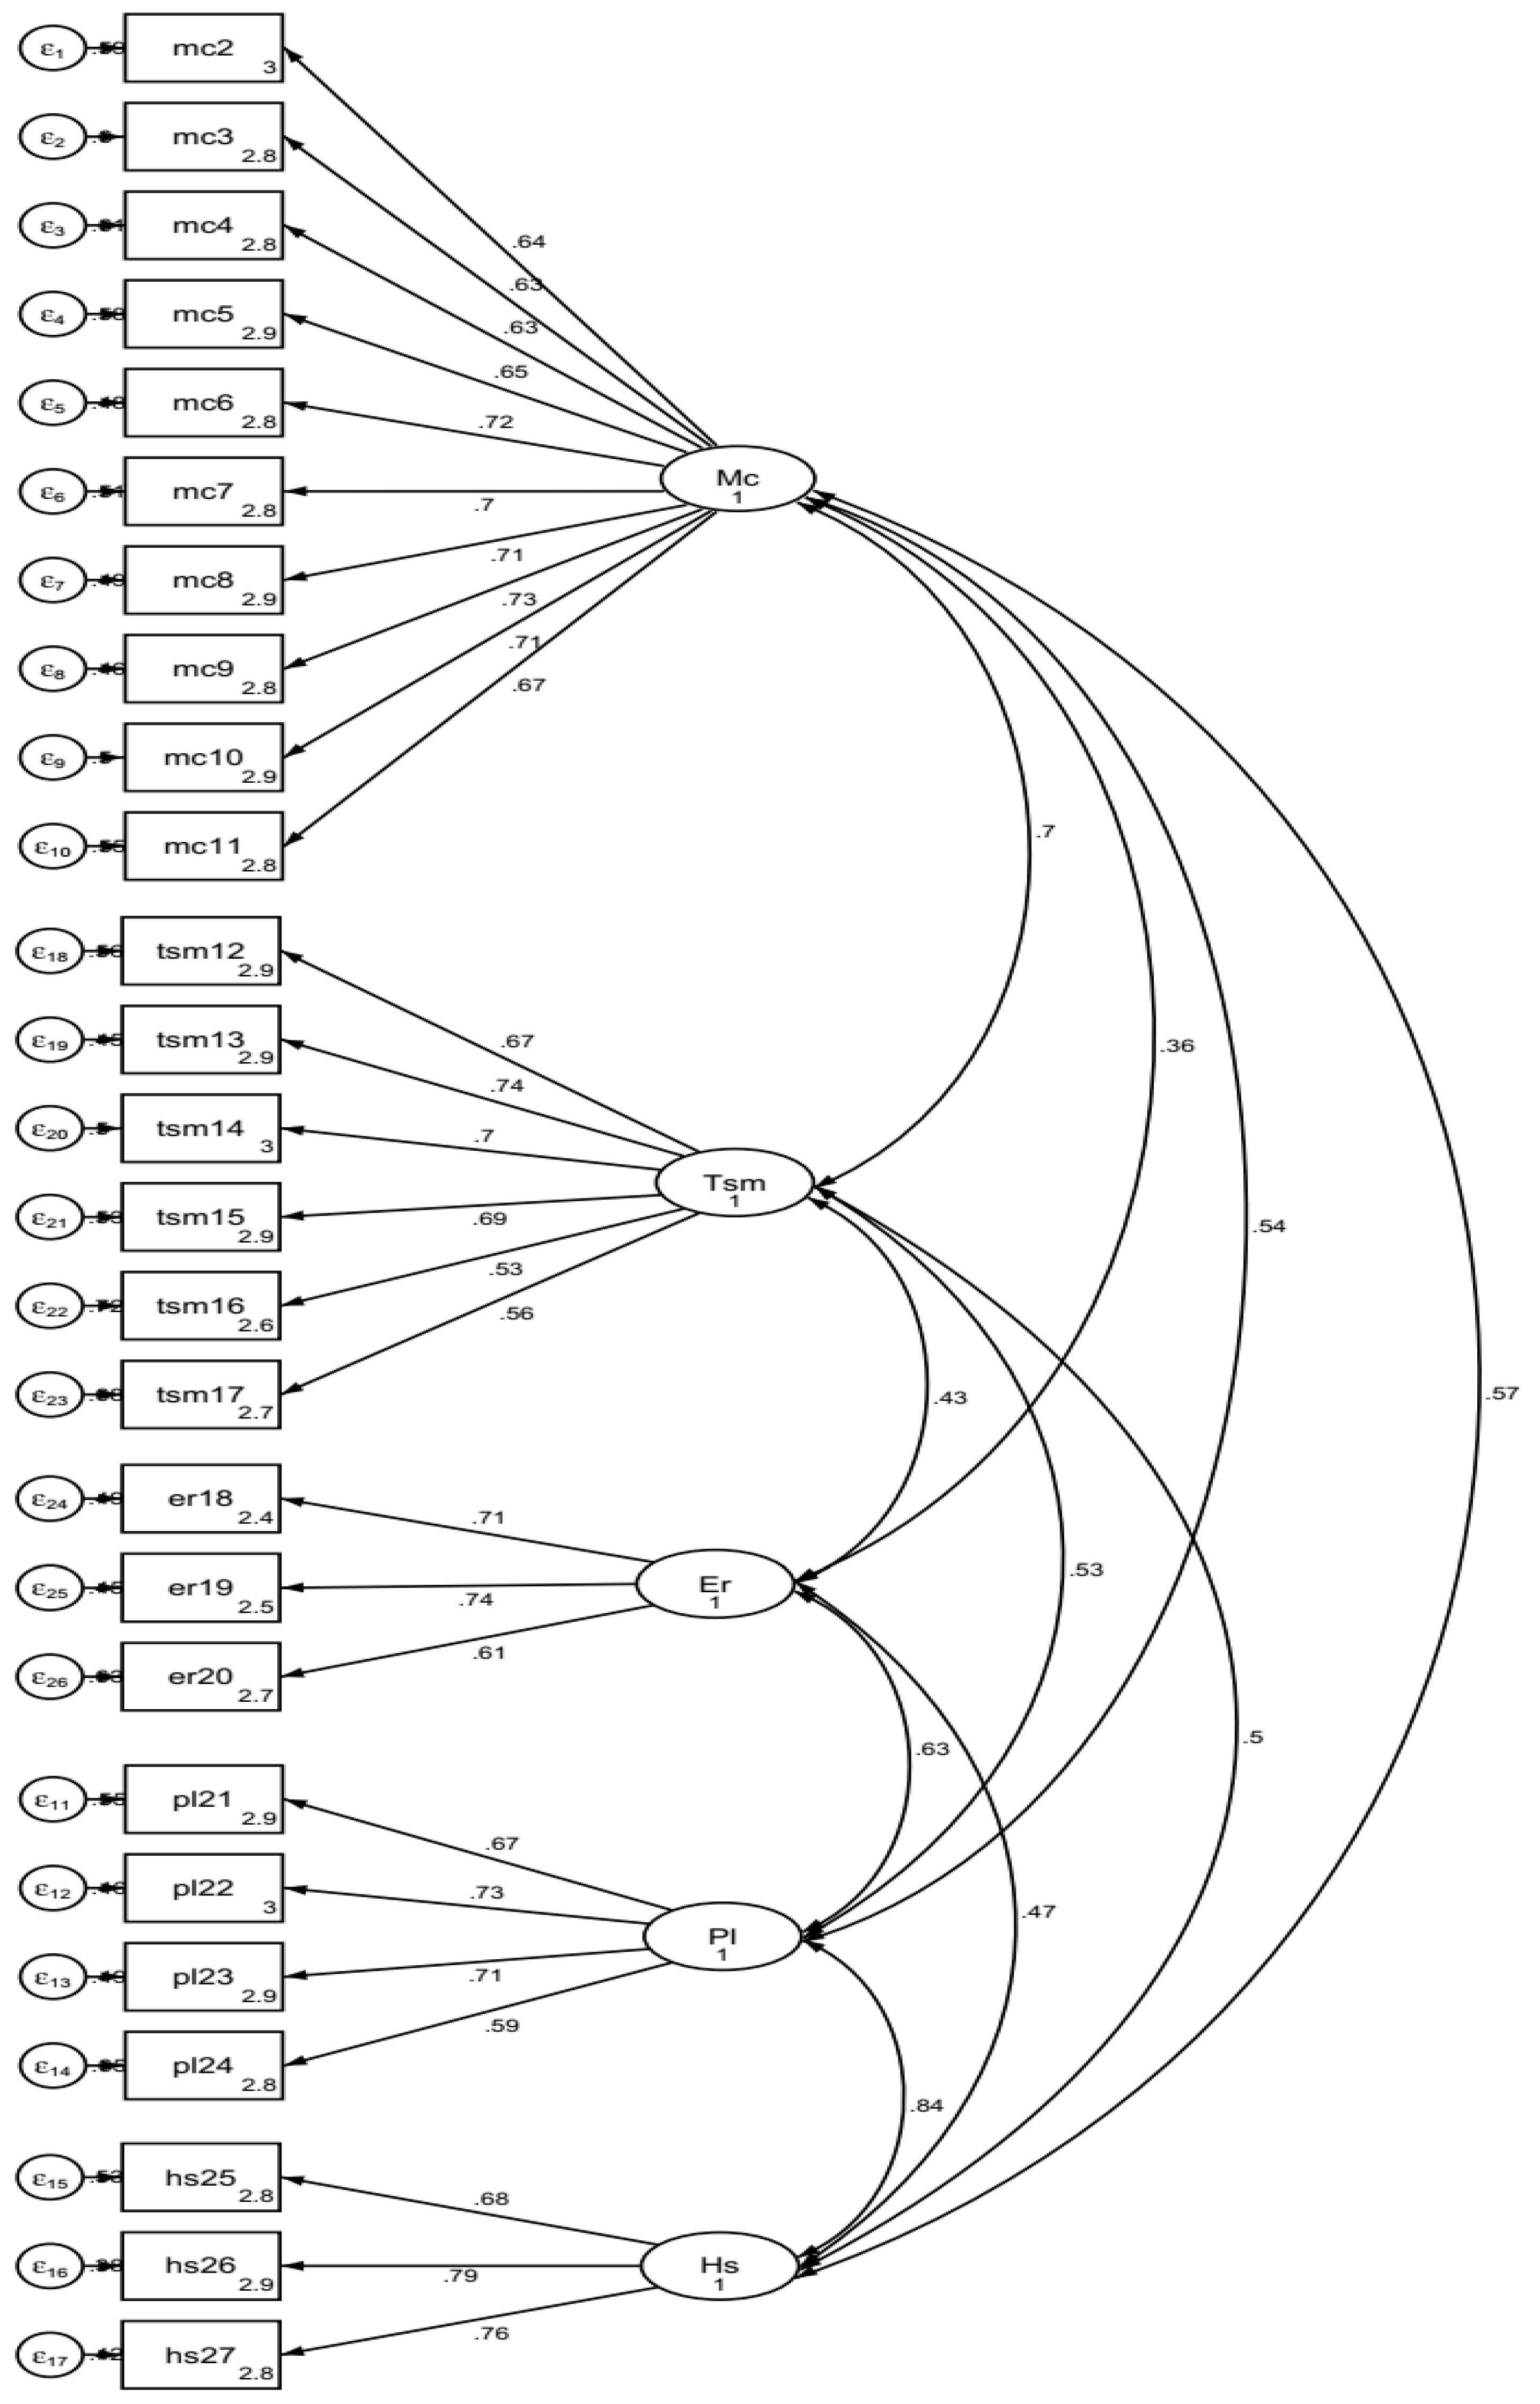
3.3. Results of the SRLS’s Factor Structure and Model−Fit Using SEM

In this section, summary results of the SRLS factor structure, correlations between the SRLS model components, and model fit tests are briefly presented. The summary of the model fit tests is presented along with the standard criteria recommended in the psychology and education literature. Figure 1 illustrates the structure of the five–factor SRLS model.
As shown in Figure 1, for all SRLS components, moderate to high proportions of the common variance were explained by the items with the factor loadings ranging between 0.53 to 0.79. In terms of the association, the five–factor SRLS model components had low to moderate correlations, with r mainly ranging between 0.36 and 0.63. However, a number of factors exhibited relatively higher correlations (i.e., the correlations between the metacognition and time and study environment management components (r = 0.70), and between peer learning and help–seeking components (r = 0.84).
Model fit was assessed according to the chi–square (ꭓ2) test and multiple indices. The chi–square test [68] was used to assess the absolute fit of the five–factor SRLS model to the data, but this test rejected the five–factor model, as is often the case when applied to large samples [69,70]. In addition, the authors used five additional indices, namely, the comparative fit index (CFI), the Tucker–Lewis index (TLI), coefficient of determination (CD), the root mean square error of approximation (RMSEA), and the standardized root mean square residual (SRMR), to assess the model fit. The CFI, TLI, and CD range from 0 to 1, with the common value for an acceptable model fit being 0.90 or greater [69,71,72]. The interpretation of the RMSEA and SRMR was based on suggested values, namely, less than 0.05 represents a close model fit, 0.05 to 0.08 represents a reasonable fit, 0.08 and 0.10 indicates a mediocre fit, and greater than 0.10 represents an unacceptable fit [73,74]. Based on these standard indexes as reference points, post-estimation analyses were performed to evaluate the goodness of fit of the five-factor SRLS model. According to the summary results, CFI = 0.90, TLI = 0.89, CD = 1.00, RMSEA = 0.06, and SRMR = 0.05. These results of the goodness–of–fit statistic tests indicated that the five–factor SRLS model had acceptable fit indexes.

3.4. Results of Hierarchical Multiple Regression Ananlyses

In this study, the authors used a two–step hierarchical multiple regression, where the controlling (personal and social–contextual) variables and the five–factor SRLS components entered the model in separate steps called “blocks”. The authors used this to statistically “control” the selected controlling variables and examine whether adding the SRLS components significantly improved the regression models’ ability to predict the criterion variables (perceived learning gains). Accordingly, the authors wanted to know whether the five–factor SRLS components predict the outcome variables (perceived learning gains) over and above the control variables.
In this analysis, the three perceived learning gains variables were the outcome variables. As shown in Figure 1, in the first step, the authors included the four controlling variables (predictor variables) independently (resident, class year, attendance rate, and academic preparedness). In the second block, the authors added the SRLS components representing the interaction between controlling variables and the SRLS components combined. If the interaction term (SRLS) statistically predicts each outcome variable above and beyond the controlling variables, then we conclude there is a significant second block or step–2 prediction effect. Figure 2 illustrates the structural representation of the 2–step hierarchical multiple regression model.
As illustrated in Figure 2, there were two clusters of regression models drawn from the independent variables, including the controlling variables (personal and social–contextual) variables and the outcome variables. Step two extended the models further to include the five–factor SRLS components as predictors, along with the controlling variables, to measure the net effects of the SRLS components.
In the first step, the control variables statistically predicted the perceived learning outcomes for the total sample, when first entered into the regression model (step 1: Model 1 Adjusted R2 = 0.6, F[4, 1137] = 20.33, p < 0.001; Model 2 Adjusted R2 = 0.6, F[4, 1137] = 19.65, p < 0.001; Model 3 Adjusted R2 = 0.5, F[4, 1136] = 14.87, p < 0.001). When the SRLS components were added to the regression models, they resulted in significant changes in the overall prediction of the three models (step 2: Model 1 Adjusted R2 = 0.44, ΔR2 = 0.38, ΔF for ΔR2 [9, 1132] = 78.98, p < 0.001; Model 2 Adjusted R2 = 0.45, ΔR2 = 0.39, ΔF for ΔR2 [9, 1132] = 86.19, p < 0.001; Model 3 Adjusted R2 = 0.43, ΔR2 = 0.38, ΔF for ΔR2 [9, 1132] = 79.83, p < 0.001). It is clear from the ΔR2 of the three regression models that the added five-factor SRLS components show a significant improvement in the adjusted R2 (the proportion of variance in DV explained by the model). These results indicate that the inclusion of the five-factor SRLS components resulted in substantial changes in the models’ capacity to predict the measured outcomes. Table 4 presents a summary of the two-step hierarchical regression analysis for the controlling variables and the five SRLS components predicting the three student learning outcomes.
In step 1, by entering the control variables, the three models accounted for 0.05 to 0.06 of the variances explained in the three perceived learning outcomes, and these were statistically significant according to the corresponding F–statistics and p–values (Table 4). In step 2, the control variables and the five-factor SRLS components together accounted for 0.43 to 0.45 of the variances explained in the three models (R2 = 0.43 to 0.45), and these results show an increase in the variance explained compared to the variances explained in step one of the three regression models. Hence, by adding the SRLS components, the models explain additional variance (ΔR2 = 0.38 to 0.39), and these ΔR2 were also statistically significant according to the corresponding ΔF–statistics and p–values.
A further analysis of the results in Table 3 shows that only two of the controlling variables, student residence type and academic preparation, had a statistically significant prediction in the three models. Moreover, it was clear that three of the five SRLS components had significant positive predictions for the three perceived learning outcomes. The beta values for each predictor in the three models indicate that the help–seeking component of the SRLS was the best predictor of the perceived learning outcomes (β = 0.35 to 0.47), followed by peer learning (β = 0.18 to 0.20), and time and study management (β = 0.10 to 0.14) components. However, the two controlling variables of resident type and academic preparation were the worst predictors (β = 0.05 to 0.07). These results, in addition to the additional variance explained, collectively indicate that, in step 2, the SRLS components, rather than the control variables, contributed to the predictions of the outcome measures (the three perceived learning gains). The results of these regression analyses show that the variance in students’ perceived learning can be attributed to the SRL components, over and above the control (personal and social–contextual) variables, with ∆R2 of 0.38 to 0.39 for the three regression models where the addition of the SRLS components resulted in a significant positive change.

4. Discussion

According to the findings of this study, the use of SRLSs by the undergraduate students and the perceived learning scores were moderate, which indicates average performance. Furthermore, the use of the effort regulation strategy was found to be low. These results coincide with Arum and Roksa [75] and reports indicating limited academic engagement and learning outcomes in undergraduate education. The use of these strategies would not be adequate to cope with the challenges of the 21st century and the development of essential employability skills among the undergraduate students. This may be because HEIs’ cultures and practices do not allow having a great concern for students’ learning [76,77] or lack the mechanisms and processes to promote students’ success [78,79]. SRLSs are generally accepted as playing a relevant role in undergraduate students’ success Zimmerman and Schunk [57] because high self–efficacy and the goal–directed use of learning strategies are critical [80]. Hence, applying instructional strategies that promote SRLSs in undergraduate programs would contribute positively to promoting students’ learning.
In terms of the SRLS factor structure, there were moderate to high factor loadings for the five SRLS factors (Figure 1). These item–level factor loadings indicated the adequacy of the model in creating a common factor space for the measured factors. However, due to the lack of an a priori-tested SRLS model, it was not possible to compare the factor loadings with those of other similar studies. It is important to note that the overall reliability of the scale is very high (α = 0.92) and no single item had a loading below the recommended threshold of λ = 0.40 [81]. Moreover, the results of the reliability analyses for the different components were found to be acceptable for all the measured SRLS components >0.70 [67]. In summary, the factorial validity of the construct was verified. The acceptability of the different model testing indices provides supporting evidence for the adequacy of the model to fit with the student sample data.
As illustrated in Figure 1, the different factors did not show any excessive correlations between the five–factor SLRS components. It is clear that there are low to moderate, and high, correlations among the variables, with the correlation coefficients varying between 0.36 and 0.84; the majority of these have moderate correlations [82]. The correlations between the SRLS components reported in this study are similar to the correlation results previously reported for the SRLS, although fewer or other components may be included in previous studies. For example, a study conducted on college students found a significant positive correlation between metacognitive self–regulation, time and study environment management, and effort regulation [83]. A similar study reported that the correlations within the cognitive and metacognitive self–regulation strategies ranged from 0.54 to 0.77 [84]. The present study correlation results (Figure 1) corroborate the findings reported in the literature, albeit with a greater variety in SRLS components. These testify to the interdependence among the factors, and the absence of excessive and negative relationships between the SRLS components.
The regression analysis results indicated that three of the five SRLS components consistently predicted the three perceived learning gains, indicating the relevance of these components in the Ethiopian HE context. The SRLS components of academic preparation and residence type predicted students’ perceived learning. Among the five SRLS components, time and study environment management, peer learning, and help seeking showed higher prediction ability. Regarding undergraduate students’ SRLS components, help–seeking showed a higher prediction ability for perceived learning. The strength of this association remained fairly stable across the three perceived learning types. This is similar to the findings of studies reported in the literature. For example, a study found significant correlations between the MSLQ self–reported scores and academic performance [51]. Similarly, Varasteh, Ghanizadeh [85] reported that learners’ self-regulation had a significant influence on language achievement.
In the 21st century, the need for HE academics to utilize SRLSs in undergraduate education is crucial [40]. Different strategies exist to promote undergraduate students’ use of SRL, which have been associated with higher levels of students’ success in higher education. These include the teaching of the SRLSs by a HE academic member, supporting the students’ efforts to self-regulate, using students’ study logs, and scaffolding [86].

Study Limitations

This study was not without limitations. First, the sample included in this study comprised students from the selected public universities and included undergraduate students having majors in the Business and Economics and Engineering and Technology fields. Future research should include students from a large pool of major fields to fully represent the HE populations. Future research should include the motivational components of the self-regulation. It is clear from the reviewed literature that actual learning and perceived learning are indeed separate and distinct, both conceptually and methodologically. Although the current study utilized the perceived learning outcomes, this does not represent actual learning. Based on this, future research should focus on utilizing a combination of the actual and perceived measures to triangulate the findings and provide more robust evidence of the relationships between SRLSs and learning, in the HE context.
This study’s specifications of the four contextual factors, five components of undergraduate students’ SRLSs, and three components of their perceived learning outcomes are limited by the nature of theoretical and empirical work in these areas. Thus, there is considerable conceptual and item-content restrictions across these measures. Our evidence was also hindered by the use of the SRLS components instead of SRLS strategies of the same SRLS’s construct. Overall, the current range of the nine potential factors of undergraduate students’ perceived learning outcomes are indicative of measures representing fewer underlying mechanisms by which students’ perceived learning outcomes maybe predicted. However, these were not exhaustive of the correlates of perceived learning outcomes.

5. Conclusions and Implications

Among the international literature, this study is the first to empirically test the factor structure of the five–factor SRLS model and analyze the relationships between these components as predictors of perceived learning in HE. The results are generally congruent with similar studies reporting the relationships between the SRLS components and learning in general. The results offer empirical support for current debates on the quality of teaching and learning in HE. Aspects of the SRLS components that are far higher than the selected social–contextual factors are substantially associated with perceived learning in HE. This result indicates the relevance of the SRLS components in HE. Among the five SRLS components, help seeking showed the highest prediction ability for the three measures of the perceived learning gains. Time and study management and peer learning were significantly positively associated with the perceived learning components. However, metacognition and effort regulations predicted none of the perceived learning components.
High–achieving students in HE are characterized by qualities that, in part, are affected by academic preparation and attendance, and the use of SRLS. Thus, universities should consider this carefully to improve the quality of teaching and learning for undergraduate programs.
The findings of this study provide a new way of understanding SLRSs from a component perspective via the five–factor model to promote students’ perceived learning. The findings of this study specifically highlight the time and study environment management, peer learning, and help–seeking components of self-regulated learning strategies as the potential components that are useful for promoting the perceived learning of undergraduate students, thereby increasing their likelihood of success in undergraduate education. Further research regarding university students’ SRLSs and their contributions toward developing students’ actual learning with more robust measures of outcomes is needed. Empirical research is needed to analyze the implications of incorporating a holistic intervention in light of these findings. Moreover, there is a need to understand how best to utilize SRLSs to drive positive non-academic outcomes in a university learning environment.

Author Contributions

Conceptualization, T.T., A.A. and K.G.; methodology, T.T., A.A., K.G. and B.F., validation, K.G., B.F., W.M. and T.T.; formal analysis, T.T., M.S. and M.F.; investigation, W.M., K.G., A.A. and B.F.; resources, T.T., W.M., K.G. and B.F.; data curation, M.S. and M.F.; writing—original draft preparation, A.A., K.G., B.F., W.M. and T.T.; writing—review and editing, M.S. and M.F., visualization, T.T., M.S. and M.F.; supervision, M.S., M.F., W.M., B.F. and K.G.; project administration, W.M., T.T., K.G., A.A. and B.F. All authors have read and agreed to the published version of the manuscript.

Funding

This research was funded by the College of Education and Behavioral Sciences, Jimma University, Ethiopia, grant number CE/RPG/15.

Institutional Review Board Statement

The study protocol was approved by the Institutional Review Committee of the Department of Teacher Education and Curriculum Studies, Jimma University (Ref. no: TECS 163/15 and date of approval 8 April 2015).

Informed Consent Statement

Written informed consent has been obtained from the study participants prior to data collection.

Data Availability Statement

Not applicable.

Acknowledgments

The authors appreciate the undergraduate students of Business and Economics Colleges and Technology Colleges at Jimma University, Mettu University, and Mizan Tape Universities for their cooperation in filling out questionnaires. Moreover, the authors are grateful to Birhanu Tafesse for his expert review of the instrument used for data collection in this study.

Conflicts of Interest

The authors declare no conflict of interest.

References

  1. Arum, R.; Roksa, J.; Cook, A. Improving Quality in American Higher Education: Learning Outcomes and Assessments for the 21st Century; Jossey-Bass: San Francisco, CA, USA, 2016. [Google Scholar]
  2. Tadesse, T.; Gillies, R.; Campbell, C. Assessing the dimensionality and educational impacts of integrated ICT literacy in the higher education context. Australas. J. Educ. Technol. 2018, 34, 88–101. [Google Scholar] [CrossRef] [Green Version]
  3. Virtanen, A.; Tynjälä, P. Factors explaining the learning of generic skills: A study of university students’ experiences. Teach. High. Educ. 2019, 24, 880–894. [Google Scholar] [CrossRef]
  4. Anderson, P.; Fraillon, J. What makes a difference? How measuring the non-academic outcomes of schooling can help guide school practice. In Proceedings of the ACER’s 14th Annual Research Conference: Assessment and Student Learning: Collecting, Interpreting and Using Data to Inform Teaching, Perth, Australia, 16–18 August 2009. [Google Scholar]
  5. Bradforth, S.; Miller, E.R.; Dichtel, W.R.; Leibovich, A.K.; Feig, A.L.; Martin, J.D.; Bjorkman, K.S.; Schultz, Z.D.; Smith, T.L. University learning: Improve undergraduate science education. Nature 2015, 523, 282–284. [Google Scholar] [CrossRef] [PubMed] [Green Version]
  6. Yearwood, T.L.; Jones, E.A. Understanding what influences successful black commuter students’ engagement in college. J. Gen. Educ. 2012, 61, 97–125. [Google Scholar] [CrossRef]
  7. Sakurai, Y.; Pyhältö, K. Understanding students’ academic engagement in learning amid globalising universities. In Annual Review of Comparative and International Education; Wiseman, A.W., Ed.; Emerald Publishing Limited: Bingley, UK, 2018; pp. 31–38. [Google Scholar]
  8. Babayigit, B.B.; Guven, M. Self-regulated learning skills of undergraduate students and the role of higher education in promoting self-regulation. Eurasian J. Educ. Res. 2020, 20, 47–70. [Google Scholar] [CrossRef]
  9. Seifert, T.A.; Pascarella, E.T.; Goodman, K.M.; Salisbury, M.H.; Blaich, C.F. Liberal arts colleges and good practices in undergraduate education: Additional evidence. J. Coll. Stud. Dev. 2010, 51, 1–22. [Google Scholar] [CrossRef]
  10. Kivunja, C. Do you want your students to be job-ready with 21st century skills? Change pedagogies: A pedagogical paradigm shift from Vygotskyian social constructivism to critical thinking, problem solving and Siemens’ digital connectivism. Int. J. High. Educ. 2014, 3, 81–91. [Google Scholar] [CrossRef] [Green Version]
  11. Song, X. “Critical thinking” and pedagogical implications for higher education. East Asia 2016, 33, 25–40. [Google Scholar] [CrossRef]
  12. Kilgo, C.A.; Sheets, J.K.E.; Pascarella, E.T. The link between high-impact practices and student learning: Some longitudinal evidence. High. Educ. 2015, 69, 509–525. [Google Scholar] [CrossRef]
  13. Fink, M.C.; Heitzmann, N.; Siebeck, M.; Fischer, F.; Fischer, M.R. Learning to diagnose accurately through virtual patients: Do reflection phases have an added benefit? BMC Med. Educ. 2021, 21, 523. [Google Scholar] [CrossRef]
  14. Fink, M.C.; Reitmeier, V.; Stadler, M.; Siebeck, M.; Fischer, F.; Fischer, M.R. Assessment of diagnostic competences with standardized patients versus virtual patients: Experimental study in the context of history taking. J. Med. Internet Res. 2021, 23, e21196. [Google Scholar] [CrossRef] [PubMed]
  15. Prosser, M.; Sze, D. Problem-based learning: Student learning experiences and outcomes. Clin. Linguist. Phon. 2014, 28, 131–142. [Google Scholar] [CrossRef]
  16. Verbic, G.; Keerthisinghe, C.; Chapman, A.C. A project-based cooperative approach to teaching sustainable energy systems. IEEE Trans. Educ. 2017, 60, 221–228. [Google Scholar] [CrossRef]
  17. Santos, J.; Figueiredo, A.S.; Vieira, M. Innovative pedagogical practices in higher education: An integrative literature review. Nurse Educ. Today 2019, 72, 12–17. [Google Scholar] [CrossRef] [PubMed]
  18. Tarbutton, T. Leveraging 21st century learning & technology to create caring diverse classroom cultures. Multicult. Educ. 2018, 25, 4–6. [Google Scholar]
  19. McNeil, H.P.; Scicluna, H.; Boyle, P.; Grimm, M.; Gibson, K.; Jones, P.D. Successful development of generic capabilities in an undergraduate medical education program. High. Educ. Res. Dev. 2012, 31, 525–539. [Google Scholar] [CrossRef]
  20. Olapade-Olaopa, O.; Adaramoye, O.; Raji, Y.; Fasola, A.O.; Olopade, F. Developing a competency-based medical education curriculum for the core basic medical sciences in an African medical school. Adv. Med. Educ. Pract. 2016, 7, 389–398. [Google Scholar] [CrossRef] [Green Version]
  21. Bloom, L.; Kowalske, K.; Dole, S. Transforming pedagogy: Changing perspectives from teacher-centered to learner-centered. Interdiscip. J. Probl. Based Learn. 2015, 10, 1. [Google Scholar]
  22. Tadesse, T.; Gillies, R.; Manathunga, C. Shifting the instructional paradigm in higher education classrooms in Ethiopia: What happens when we use cooperative learning pedagogies more seriously? Int. J. Educ. Res. 2020, 99, 101509. [Google Scholar] [CrossRef]
  23. Ahmed, Y.; Taha, M.H.; Al-Neel, S.; Gaffar, A. Students’ perception of the learning environment and its relation to their study year and performance in Sudan. Int. J. Med. Educ. 2018, 9, 145–150. [Google Scholar] [CrossRef]
  24. Tadesse, T.; Melese, W.; Ferede, B.; Getachew, K.; Asmamaw, A. Constructivist learning environments and forms of learning in Ethiopian public universities: Testing factor structures and prediction models. Learn. Environ. Res. 2022, 25, 75–95. [Google Scholar] [CrossRef]
  25. Hsieh, T.-L. Motivation matters? The relationship among different types of learning motivation, engagement behaviors and learning outcomes of undergraduate students in Taiwan. High. Educ. 2014, 68, 417–433. [Google Scholar] [CrossRef]
  26. Picton, C.; Kahu, E.R.; Nelson, K. Hardworking, determined and happy’: First-year students’ understanding and experience of success. High. Educ. Res. Dev. 2018, 37, 1260–1273. [Google Scholar] [CrossRef]
  27. Yucel, R.; Bird, F.; Young, J.; Blanksby, T. The road to self-assessment: Exemplar marking before peer review develops first-year students’ capacity to judge the quality of a scientific report. Assess. Eval. High. Educ. 2014, 39, 971–986. [Google Scholar] [CrossRef]
  28. Park, S.; Kim, N.H. University students’ self-regulation, engagement and performance in flipped learning. Eur. J. Train. Dev. 2022, 46, 22–40. [Google Scholar] [CrossRef]
  29. Pintrich, P.R. An achievement goal theory perspective on issues in motivation terminology, theory, and research. Contemp. Educ. Psychol. 2000, 25, 92–104. [Google Scholar] [CrossRef] [Green Version]
  30. Pintrich, P.R.; Garcia, T. Self-regulated learning in college students: Knowledge, strategies, and motivation. In Student Motivation, Cognition, and Learning. Essays in Honor of Wilbert J. McKeachie; Pintrich, P.R., Brown, D.R., Weinstein, C.E., Eds.; Routledge: London, UK, 1994; pp. 113–133. [Google Scholar]
  31. Pintrich, P.R. Chapter 14—The role of goal orientation in self-regulated learning. In Handbook of Self-Regulation; Boekaerts, M., Pintrich, P.R., Zeidner, M., Eds.; Academic Press: San Diego, CA, USA, 2000; pp. 451–502. [Google Scholar]
  32. Rasheed, R.A.; Kamsin, A.; Abdullah, N.A. An approach for scaffolding students peer-learning self-regulation strategy in the online component of blended learning. IEEE Access 2021, 9, 30721–30738. [Google Scholar] [CrossRef]
  33. Sitzmann, T.; Ely, K.; Brown, K.G.; Bauer, K.N. Self-assessment of knowledge: A cognitive learning or affective measure? Acad. Manag. Learn. Educ. 2010, 9, 169–191. [Google Scholar] [CrossRef]
  34. Bacon, D.R. Reporting actual and perceived student learning in education research. J. Mark. Educ. 2016, 38, 3–6. [Google Scholar] [CrossRef] [Green Version]
  35. Elbeck, M.; Bacon, D. Toward universal definitions for direct and indirect assessment. J. Educ. Bus. 2015, 90, 278–283. [Google Scholar] [CrossRef]
  36. Fink, M.C.; Reitmeier, V.; Siebeck, M.; Fischer, F.; Fischer, M.R. Live and video simulations of medical history-taking: Theoretical background, design, development, and validation of a learning environment. In Learning to Diagnose with Simulations; Fischer, F., Opitz, A., Eds.; Springer Nature: Cham, Switzerland, 2022; pp. 109–122. [Google Scholar]
  37. Reddy, Y.M.; Andrade, H. A review of rubric use in higher education. Assess. Eval. High. Educ. 2010, 35, 435–448. [Google Scholar] [CrossRef]
  38. McGrath, C.H.; Guerin, B.; Harte, E.; Frearson, M.; Manville, C. Learning Gain in Higher Education; RAND Corporation: Santa Monica, CA, USA, 2015. [Google Scholar]
  39. Thomas, L.J.; Parsons, M.; Whitcombe, D. Assessment in smart learning environments: Psychological factors affecting perceived learning. Comput. Hum. Behav. 2019, 95, 197–207. [Google Scholar] [CrossRef]
  40. Russell, J.M.; Baik, C.; Ryan, A.T.; Molloy, E. Fostering self-regulated learning in higher education: Making self-regulation visible. Act. Learn. High. Educ. 2020, 23, 97–113. [Google Scholar] [CrossRef]
  41. Pintrich, P.R.; Smith, D.A.F.; Garcia, T.; McKeachie, W.J. Reliability and predictive validity of the motivated strategies for learning questionnaire (MSLQ). Educ. Psychol. Meas. 1993, 53, 801–813. [Google Scholar] [CrossRef]
  42. Zimmerman, B.J. A social cognitive view of self-regulated academic learning. J. Educ. Psychol. 1989, 81, 329–339. [Google Scholar] [CrossRef]
  43. Lai, E.R. Metacognition: A Literature Review. Pearson Assessments. 2011. Available online: http://images.pearsonassessments.com/images/tmrs/Metacognition_Literature_Review_Final.pdf (accessed on 1 June 2022).
  44. Pintrich, P.R. A conceptual framework for assessing motivation and self-regulated learning in college students. Educ. Psychol. Rev. 2004, 16, 385–407. [Google Scholar] [CrossRef] [Green Version]
  45. Pintrich, P.; Smith, A.; Garcia, T.; Mckeachie, J. A Manual for the Motivated Strategies for Learning Questionarie (MSLQ). ERIC. 1991. Available online: https://files.eric.ed.gov/fulltext/ED338122.pdf (accessed on 1 June 2022).
  46. Vrieling, E.; Stijnen, S.; Bastiaens, T. Successful learning: Balancing self-regulation with instructional planning. Teach. High. Educ. 2018, 23, 685–700. [Google Scholar] [CrossRef] [Green Version]
  47. Hadwin, A.F.; Winne, P.H. Promoting learning skills in undergraduate students. In Enhancing the Quality of Learning: Dispositions, Instruction, and Learning Processes; Kirby, J.R., Lawson, M.J., Eds.; Cambridge University Press: Cambridge, UK, 2012; pp. 201–227. [Google Scholar]
  48. Yot-Domínguez, C.; Marcelo, C. University students’ self-regulated learning using digital technologies. Int. J. Educ. Technol. High. Educ. 2017, 14, 38. [Google Scholar] [CrossRef]
  49. Richardson, M.; Abraham, C.; Bond, R. Psychological correlates of university students’ academic performance: A systematic review and meta-analysis. Psychol. Bull. 2012, 138, 353–387. [Google Scholar] [CrossRef] [Green Version]
  50. Broadbent, J.; Poon, W.L. Self-regulated learning strategies & academic achievement in online higher education learning environments: A systematic review. Internet High. Educ. 2015, 27, 1–13. [Google Scholar]
  51. Papageorgiou, E. Self-Regulated learning strategies and academic performance of accounting students at a South African university. South Afr. J. High. Educ. 2022, 36, 251–278. [Google Scholar]
  52. Anthonysamy, L.; Koo, A.-C.; Hew, S.-H. Self-regulated learning strategies and non-academic outcomes in higher education blended learning environments: A one decade review. Educ. Inf. Technol. 2020, 25, 3677–3704. [Google Scholar] [CrossRef]
  53. Caspersen, J.; Smeby, J.-C.; Aamodt, P.O. Measuring learning outcomes. Eur. J. Educ. 2017, 52, 20–30. [Google Scholar] [CrossRef]
  54. Schunk, D.H. Modeling and attributional effects on children’s achievement: A self-efficacy analysis. J. Educ. Psychol. 1981, 73, 93–105. [Google Scholar] [CrossRef]
  55. Schunk, D.H. Sequential attributional feedback and children’s achievement behaviors. J. Educ. Psychol. 1984, 76, 1159–1169. [Google Scholar] [CrossRef]
  56. Veenman, M.V.J.; Spaans, M.A. Relation between intellectual and metacognitive skills: Age and task differences. Learn. Individ. Differ. 2005, 15, 159–176. [Google Scholar] [CrossRef]
  57. Zimmerman, B.J.; Schunk, D.H. Handbook of Self-Regulation of Learning and Performance; Routledge: New York, NY, USA; Taylor & Francis Group: Abingdon, UK, 2011. [Google Scholar]
  58. Roth, A.; Ogrin, S.; Schmitz, B. Assessing self-regulated learning in higher education: A systematic literature review of self-report instruments. Educ. Assess. Eval. Account. 2016, 28, 225–250. [Google Scholar] [CrossRef]
  59. Pintrich, P.R. Taking control of research on volitional control: Challenges for future theory and research. Learn. Individ. Differ. 1999, 11, 335–354. [Google Scholar] [CrossRef]
  60. Pintrich, P.R.; Zusho, A. Student Motivation and Self-Regulated Learning in the College Classroom; Springer: Dordrecht, The Netherlands, 2007; pp. 731–810. [Google Scholar]
  61. Chalachew, A.A.; Lakshmi, V.H. Factors influence students self-regulation learning towards their academic achievement in undergraduate programs in Ethiopia. Abhinav Natl. Mon. Refereed J. Res. Arts Educ. 2013, 2, 30–40. [Google Scholar]
  62. Pintrich, P.R.; De Groot, E.V. Motivational and self-regulated learning components of classroom academic performance. J. Educ. Psychol. 1990, 82, 33–40. [Google Scholar] [CrossRef]
  63. Boekaerts, M.; Corno, L. Self-regulation in the classroom: A perspective on assessment and intervention. Appl. Psychol. 2005, 54, 199–231. [Google Scholar] [CrossRef]
  64. Reinartz, W.; Haenlein, M.; Henseler, J. An empirical comparison of the efficacy of covariance-based and variance-based SEM. Int. J. Res. Mark. 2009, 26, 332–344. [Google Scholar] [CrossRef] [Green Version]
  65. Acock, A.C. Discovering Structural Equation Modeling Using Stata; Stata Press Books: College Station, TX, USA, 2013. [Google Scholar]
  66. Kline, R. Principles and Practice of Structural Equation Modeling; Guilford Press: New York, NY, USA, 1998. [Google Scholar]
  67. Nunally, J.; Bernstein, I. Psychometric Theory; McGraw Hill: New York, NY, USA, 1994. [Google Scholar]
  68. Cochran, W.G. The χ2 test of goodness of fit. Ann. Math. Stat. 1952, 23, 315–345. [Google Scholar] [CrossRef]
  69. Bollen, K.A. Structural Equations with Latent Variables; Wiley: New York, NY, USA, 1989. [Google Scholar]
  70. Browne, M.W.; Cudeck, R. Alternative ways of assessing model fit. Sage Focus Ed. 1993, 154, 136–180. [Google Scholar] [CrossRef]
  71. Bentler, P.M.; Bonett, D.G. Significance tests and goodness of fit in the analysis of covariance structures. Psychol. Bull. 1980, 88, 588–606. [Google Scholar] [CrossRef]
  72. Hu, L.-T.; Bentler, P.M. Cutoff criteria for fit indexes in covariance structure analysis: Conventional criteria versus new alternatives. Struct. Equ. Modeling A Multidiscip. J. 1999, 6, 1–55. [Google Scholar] [CrossRef]
  73. Browne, M.W.; Cudeck, R. Alternative ways of assessing model fit. Sociol. Methods Res. 1992, 21, 230–258. [Google Scholar] [CrossRef]
  74. Schreiber, J.B.; Nora, A.; Stage, F.K.; Barlow, E.A.; King, J. Reporting structural equation modeling and confirmatory factor analysis results: A review. J. Educ. Res. 2006, 99, 323–337. [Google Scholar] [CrossRef]
  75. Arum, R.; Roksa, J. Limited learning on college campuses. Society 2011, 48, 203–207. [Google Scholar] [CrossRef] [Green Version]
  76. Tadesse, T.; Manathunga, C.; Gillies, R. Making sense of quality teaching and learning in higher education in Ethiopia: Unfolding existing realities for future promises. J. Univ. Teach. Learn. Pract. 2018, 15, 4. [Google Scholar] [CrossRef]
  77. Myers, C.B.; Myers, S.M. The use of learner-centered assessment practices in the United States: The influence of individual and institutional contexts. Stud. High. Educ. 2015, 40, 1904–1918. [Google Scholar] [CrossRef]
  78. Veer Ramjeawon, P.; Rowley, J. Knowledge management in higher education institutions: Enablers and barriers in Mauritius. Learn. Organ. 2017, 24, 366–377. [Google Scholar] [CrossRef]
  79. Kahu, E.R.; Nelson, K. Student engagement in the educational interface: Understanding the mechanisms of student success. High. Educ. Res. Dev. 2018, 37, 58–71. [Google Scholar] [CrossRef]
  80. Schneider, M.; Preckel, F. Variables associated with achievement in higher education: A systematic review of meta-analyses. Psychol. Bull. 2017, 143, 565. [Google Scholar] [CrossRef]
  81. Stevens, J. Applied Multivariate Statistics for the Social Sciences; Lawrence Erlbaum Associates: Mahwah, NJ, USA, 2002. [Google Scholar]
  82. Lenhard, W.; Lenhard, A. Computation of effect sizes. Psychometrica. 2016. Available online: https://doi.org/10.13140/RG.2.2.17823.92329 (accessed on 1 June 2022).
  83. Wolters, C.A.; Brady, A.C. College students’ time management: A self-regulated learning perspective. Educ. Psychol. Rev. 2021, 33, 1319–1351. [Google Scholar] [CrossRef]
  84. VanZile-Tamsen, C.; Livingston, J.A. The differential impact of motivation on the self-regulated strategy use of high-and low-achieving college students. J. Coll. Stud. Dev. 1999, 40, 54–60. [Google Scholar]
  85. Varasteh, H.; Ghanizadeh, A.; Akbari, O. The role of task value, effort-regulation, and ambiguity tolerance in predicting EFL learners’ test anxiety, learning strategies, and language achievement. Psychol. Stud. 2016, 61, 2–12. [Google Scholar] [CrossRef]
  86. Wandler, J.B.; Imbriale, W.J. Promoting undergraduate student self-regulation in online learning environments. Online Learn. 2017, 21, n2. [Google Scholar] [CrossRef] [Green Version]
Figure 1. Structural representation of the 5–factor SRL model. Rectangles represent observed variables. Ovals represent latent variables. The εs values are residual terms denoting measurement errors. A single arrow head drawn from the oval to the rectangle represents the path connection between the measurement variable and the latent factor. A double-headed arrow drawn between two ovals represents correlation. The acronym Mc represents metacognition, Tse represents time and study management, and Er represents effort regulation; Pl represents peer learning and Hs represents help seeking.
Education 12 00468 g001
Figure 2. Structural representation of the 2–step hierarchical multiple regression model. Rectangles represent observed variables. Ovals represent latent variables. The εs values are residual terms denoting measurement errors. A single arrow head drawn from the oval to the rectangle represents the path connection between the measurement variable and the latent factor. A double-headed arrow drawn between two ovals represents correlation. The acronym ar represents attendance rate, ap represents academic preparation, Mc represents metacognition, Pl represents peer learning, and Hs represents help–seeking; TSE represents time and study management and Er represents effort regulation.
Education 12 00468 g002
Table 1. Summary of the partial correlation analyses for the demographic and contextual factors and learning outcomes (n = 1142).
Independent VariablesGains in Personal and Social DevelopmentGains in General EducationGains in Practical Competence
Parr Corr.p-ValueParr Corr.p-ValueParr Corr.p-Value
University−0.0270.368−0.0350.238−0.0390.195
Major Field−0.0420.162−0.0580.051−0.0560.060
Gender−0.0210.471−0.0280.344−0.0420.159
Age0.0070.8110.0150.6090.0150.619
Resident−0.0700.018 *−0.0740.012 *−0.0750.012 *
EPSCE0.0100.7390.0070.8240.0130.669
Class Year−0.0830.005 *−0.0850.004 *−0.0800.007 *
Attendance0.0920.002 *0.0790.008 *0.0650.030 *
Study hours 0.0130.6690.0200.4940.0090.761
Academic preparation0.1290.000 *0.1320.000 *0.1160.000 *
EPSCE = Ethiopian Preparatory School Completion Exam, * p values significant < 0.05.
Table 2. Students’ demographic information and contextual factors (n = 1142).
UniversityFrequencyPercent
Jimma59552.1
Mizan-Tipe32528.5
Metu22219.4
College attendedFrequencyPercent
Engineering63855.9
BECO50444.1
GenderFrequencyPercent
Female44238.7
Male70061.3
AgeFrequencyPercent
16–1914712.9
20–2260152.6
23–2422820.0
25–3916614.5
Resident statusFrequencyPercent
FemaleMaleFemaleMale
Living on campus321 58973%84%
Living off campus12111127%16%
Class yearFrequencyPercent
1st Year31027.1
2nd Year23820.8
3rd Year42637.3
4th and 5th Year 116814.7
Student Attendance rateFrequencyPercent
Less than 50%1069.28
51–74%24921.80
75–94%32628.55
95–100%46140.37
Academic preparationFrequencyPercent
Not prepared18916.55
Somewhat prepared50243.96
Prepared45139.49
1 The students of the 4th and 5th years were merged as there were minimal 4th-year participants involved. The 4th-year students in the sample universities had fieldwork for the industrial attachment course.
Table 3. Summary results of the descriptive statistics for the five SRLS components and the three perceived learning gains components.
VariableObservationMeanStandard DeviationItems in a ComponentCronbach
Alpha α
Metacognition11422.600.66100.90
Time and study management11422.620.6760.81
Effort regulation11422.380.7530.72
Peer learning11422.560.6840.76
Help seeking11422.600.7830.78
Total260.92
Gains in personal and social development11422.780.7260.86
Gains in general education11422.780.7930.82
Gains in practical competence11422.720.7740.83
Total130.93
Table 4. Results of hierarchical multiple regression analyses for SRLS and perceived learning gains (n = 1142).
Step OneGeneral EducationPersonal and Social DevelopmentPractical Competence
B βB βB βB βB βB β
Constant−0.18 −0.17 −0.09
Resident−0.12−0.08 ** −0.13−0.08 ** −0.12−0.08 **
Class Year−0.06−0.10 ** −0.06−0.09 ** −0.05−0.09 **
Attendance Rate0.070.11 *** 0.060.10 ** 0.040.08 *
Academic preparation0.110.13 *** 0.120.13 *** 0.100.12 ***
Adjusted R20.06 0.06 0.05
F200.33 190.65 140.87
Step Two
Constant −0.04 −0.01 0.06
Resident −0.07−0.04 −0.08−0.05 * −0.07−0.05 *
Class year −0.02−0.03 −0.01−0.02 −0.01−0.02
Attendance rate 0.010.01 −0.00−0.00 −0.02−0.03
Academic preparation 0.060.07 ** 0.060.07 ** 0.040.05 *
Metacognition 0.030.03 0.000.00 0.000.01
Time and study management 0.110.10 ** 0.140.12 ** 0.150.14 ***
Effort regulation 0.050.04 0.010.01 0.010.01
Peer learning 0.070.06 0.210.18 * 0.210.20 *
Help seeking 0.510.47 *** 0.430.39 *** 0.340.35 ***
Adjusted R2 0.44 0.45 0.43
ΔR2 0.38 0.39 0.38
ΔF 780.98 860.19 790.83
* p < 0.05, ** p < 0.01, *** p < 0.001.
Publisher’s Note: MDPI stays neutral with regard to jurisdictional claims in published maps and institutional affiliations.

