Abstract
The purpose of this research was to identify “threshold” concepts in introductory statistics courses by surveying engineering students. Threshold concepts are those ideas that bind a subject together and are fundamental to the thinking and practice within a discipline. In this exploratory study, the aim was to answer the following questions: What are the learners’ assessments of the proposed threshold concepts? Based on the learners’ assessments, which of the four threshold characteristics best describes the selected threshold concepts? What are the final proposed threshold concepts that incorporate the learners’ perspectives? What is the perception held by learners about the theory’s impact on the learning and teaching processes? Using qualitative and quantitative exploratory analysis to answer these questions, all students in the College of Engineering and Applied Science who took one of the 29 sections of the course Introductory Statistics offered at the University of Colorado at Boulder were surveyed. The findings reveal there are differences in threshold concepts identified by instructors and learners. The learners added 11 concepts to the 18 proposed by the instructors as threshold concepts. Based on these inputs, a list of potential threshold concepts incorporating the two perspectives—that of instructor and that of learner—was created, and a framework of knowledge to support curriculum design was developed. An important suggestion for future research is to explore how to incorporate these threshold concepts in redesigning the syllabi of such courses, depending on the proposed framework.
1. Introduction
People understand the word “Statistics” in different ways. Most of them focus on the outcomes and the results such as the tables and figures [1]. However, statistics also includes all the processes from: collecting, analyzing, and interpreting the data [2,3]. Everyone in our society utilizes and interacts with numbers, yet it is difficult to comprehend their significance. Here, is where the importance of statistics comes to play its role to a broader audience in both the education and the business sectors [1,2]. Statistics is an essential component in almost every field of study, not just mathematics as expected [4,5], and it can be a challenging subject to impart and to learn. Most often, students view statistics as a branch of mathematics because it uses mathematical formulas. As a result, students look at statistics through a mathematical lens rather than a statistical lens. The statistical lens provides a window through which to view the bigger picture, allowing statistics to make sense [6].
The big difference between mathematics and statistics is that mathematics calculations deal with numbers only, whereas statistics calculations have a direct consideration of the issue under study and are used to elucidate findings. According to Meyer and Land [6], the majority of students know how to do mechanical things, such as to calculate a sample variance, run a regression, and test a hypothesis, but they do not have a feel for the bigger picture and how to interpret numbers. Students also have difficulty understanding the basic concepts of probability [4], and instructors should not underestimate this fact. According to Garfield and Ahlgren [4], the misconception in students’ understanding of statistics and their application should be changed. Students have a negative attitude towards understanding probability because it focuses more on a statistical perspective and understanding than just mathematical calculations, so instructors typically have difficulty teaching it [5]. Lee and Meletiou [7] have shown that students are challenged by understanding specific statistical topics such as graphical representations—histograms and bar charts, for example. They also found that students have difficulty comprehending other statistics-related topics, such as sampling distributions, hypotheses, and statistical tests.
Koparan [5] identified seven difficulties that instructors and students face in preparing lectures and understanding statistics, respectively: (1) being motivated to learn; (2) encountering and mastering mathematical concepts such as algebraic formulas; (3) understanding concepts rather than simply memorizing them; (4) focusing on numbers through a broader lens rather than a mathematical perspective; (5) making qualitative interpretations based on quantitative data; (6) realizing that similar words have different meanings and unique statistical significance; and (7) depending on the context to understand the content.
How do we—authors—address these issues? We do so by using threshold theory, which is based on the work by [8], who stated that a change from student-centered pedagogy to student-focused pedagogy by developing relationship between student and instructor can improve cognitive levels and learning quality. This change can be facilitated by asking students about the difficulties they face in understanding their subjects through various feedback mechanisms. Instructors then use student inputs to identify “threshold concepts,” which provides the shift in teachers’ perspectives from a focus on critical topics to a focus on helping students learn and comprehend the threshold concepts [8,9,10].
According to the threshold concepts theory, these are the concepts that bind a subject together and are crucial to the thought and practice of a discipline [6,9,10]. They have the following four general characteristics:
- They are transformative. Once a concept is understood, its potential effect on student understanding and behavior marks a significant shift in the perception of a subject or part thereof.
- They are irreversible. The change of perspective marked by the understanding of a threshold concept is unlikely to be forgotten, nor can it be unlearned without considerable effort.
- They are integrative. Threshold concepts expose the previously misunderstood or unknown interrelatedness of something.
- They are troublesome. Some threshold concepts are potentially (and possibly inherently) difficult to understand without intention and effort.
There is a fifth general characteristic that is used to describe threshold concepts: they are bounded; they may have terminal frontiers that border new conceptual areas. However, this characteristic does not apply to statistical learning and teaching and is beyond the scope of this study.
Threshold concepts lead not only to transformation of thought by the students, but also to a transfiguration of identity—a feeling of “belonging” to a discipline—and the adoption of an extended discourse of a subject [9] (p. 375). When these concepts for a subject are absorbed, students can become experts in their field of study [11,12,13].
It is important to recognize that threshold concepts are building blocks for fostering understanding within a discipline [10]. It has long been a matter of concern to instructors in higher education because certain students “get stuck” at points in the curriculum whereas other students grasp the concepts with comparative ease [12]. The identification of threshold concepts by learners, working in conjunction with instructors to do so, helps instructors understand exactly where students are “stumbling” in their learning efforts and thus an exerted, focused and targeted approach can topic comprehension and understanding. For example, Srivastava [13] noted that the identification and sequential approach to (a threshold concept) enhanced the effectiveness of a computer science curriculum.
In addition to students acquiring true comprehension and command of a subject, another benefit of threshold theory is knowing the effect of the preliminal variation between learners’ knowledge before entering the “cognitive tunnel” [14]—the knowledge students have before being introduced to a threshold concept—and their understanding after they have grasped the concept. This transformation from not understanding to understanding helps instructors recognize why some learners negotiate the liminal tunnel of a subject under study effectively and efficiently, whereas others find it difficult to do so [9]. Lee and Meletiou [7] noted that because instructors comprehend statistics, some cannot understand why students have trouble understanding topics they consider to be basic and easy. According to Garfield and Ahlgren [4], when students identify threshold concepts, instructors are given insight regarding why “basic and easy” topics are troublesome to learn. This feedback helps instructors amend their instruction to target and enhance student meta-cognition and learning. Reminding instructors about these difficulties by providing feedback about challenges some students face when trying to understand a concept helps instructors provide the support needed to enhance students’ learning [4].
Currently, there is limited research that has identified the specific threshold concepts for introductory statistics courses in higher education. To address this and to respond to a call from the University of Colorado at Boulder (UCB) to explore ways to enhance retention in statistical courses at the College of Engineering and Applied Science, research was conducted (1) to understand the difficulties students face whilst learning statistics, (2) to use threshold theory to investigate whether there are differences between students and instructors in their perspectives of identifying the threshold concepts for the introductory statistics level, and (3) to distill and create a comprehensive list of threshold concepts, generated by both learners and instructors, for introductory statistics curricula for the benefit of reducing the gap of knowledge for effective delivery of the curriculum.
This exploratory study investigates the reasons that cause students to cease their efforts to learn and understand statistics. Based on the previous successes of implementing threshold theory to explain such difficulties in other disciplines and subjects [15,16,17,18], we applied this theory to answer the following main question: What are the threshold concepts on which instructors should focus when redesigning the curriculum for introductory statistics courses, taking students’ perspectives into consideration? We divided this overarching question into the following four research questions:
- What are the learners’ assessments of the proposed threshold concepts?
- Based on the learners’ assessments, which of the four threshold characteristics listed in the previous section describe the selected threshold concepts the most?
- What is the perception held by learners about the theory’s impact on the learning and teaching processes?
- What are the final proposed threshold concepts that incorporate the learners’ perspectives?
This knowledge will help efforts to redesign statistics syllabi and courses to be more effective in helping students understand statistics threshold concepts during the learning process, and in enhancing students’ learning outcomes, as has been done in other disciplines such as computer science, engineering, economics, biology, and English grammar [19]. The focus of my research was on undergraduate and graduate students at UCB, which includes national and international students. Thus, the results will be useful to both national and international academics.
2. Materials and Methods
Most efforts have focused on collecting students’ feedback and assessments on a provided list of concepts prepared by instructors [20,21,22]. Researchers found difficulties in recruiting students in such studies especially in some research methodology such as focus groups [11]. To promote and improve student engagement, we designed a survey for engineering students using the methodology described by [23]. In particular, students who attended at least one of UCB’s basic statistics courses were asked about the learning challenges they faced when enrolled in introductory statistics courses.
2.1. Study Description
Based on the method of Hoadley [23], which we modified to focus on a statistics perspective, we worked with several colleagues to generate 18 concepts that we, as instructors, considered to be threshold concepts. These concepts were used as a base to finalize the targeted list of threshold concepts based on the feedback and inputs collected from learners. Using an online questionnaire, we surveyed all the students in the College of Engineering and Applied Science who took one of the 29 statistics courses at the introductory level provided across all the colleges at UCB. The sample pool consisted of students who took these courses at UCB during the Fall 2016 semester, and it involved both undergraduate and graduate students. Based on these criteria, 1639 students were identified as the research population for this study, representing 18 departments at UCB. This study was awarded institutional review board approval by UCB.
An invitation to participate in the study was sent by e-mail to the research population. The message included a comprehensive explanation of the study as well as a link to the survey. Two reminders to participate were sent, one 2 weeks after and the other 4 weeks after the original invitation was sent.
2.2. Survey Design
As mentioned, the design of the survey was based on the questionnaire for threshold concepts created by [23]. We modified the original survey to match the targeted participants, the students. To ensure clarity and to avoid any bias or ambiguity in the adapted version of the questionnaire, intensive reviews from academics outside the study were conducted till no comment was raised. Moreover, because the topic understudy was expected to be new to most of the potential participants, we piloted the questionnaire with participants from the same targeted population (graduate and undergraduate students). The main goal of the pilot was to check if there were any questions that could be raised related to wording, style, and tone issues that were used in the survey.
Because the targeted participants were students at UCB, English was the language used for the questionnaire. The survey was created using Qualtrics software (version December 2015; Qualtrics Company, Provo, UT, USA) and it consisted of three sections: (1) information for classification, (2) fundamental statistics concepts, and (3) threshold concepts theory.
In the first section, participants were asked to provide basic demographic information, which was used to classify the respondents’ answers. This section also elicited information related to the respondents’ statistics class and teaching experiences (if the participants were also teaching assistants). Additional demographic information was provided directly by UCB’s Institutional Research to the Dean’s Office of the College of Engineering and Applied Science and included graduate or undergraduate status, cumulative grade point average, gender, declared major, degree being pursued, and which statistics class or classes respondents took. Although this demographic information was attached to specific survey responses, all identifying information was removed from the responses before data analysis.
The second section of the survey asked the students to read a description of (1) threshold theory and threshold concepts, (2) the four characteristics used to classify the concepts (transformative, irreversible, integrative, and troublesome), and (3) an example of a general threshold concept from another discipline. After the survey participants completed their reading, they were asked to list any three fundamental statistics concepts they recalled (such as probability, for example) based on their recent experience in their introductory statistics course or courses and to indicate whether they considered these concepts to be threshold concepts. Next, they were requested to select the characteristics (they were able to choose more than one) that described their concept.
Participants were then asked to review the 18 threshold concepts generated and refined earlier by my colleagues and I, and (1) to choose those concepts they felt were threshold concepts in statistics based on their understanding of threshold theory and (2) to indicate the characteristics that describe those concepts (again, with the ability to choose more than one characteristic). In this stage, they were not allowed to return to make any changes in their personal list to eliminate any influence from the instructors list. Their responses helped inform and develop answers to research questions 1 and 2.
The third section of the survey asked participants to indicate their familiarity with threshold theory by selecting one of the following statements: no exposure to the concept apart from this questionnaire, limited exposure to the concept, some understanding of the concept, moderate understanding of the concept, or strong understanding of the concept. Respondents were then asked to indicate, by selecting yes or no, whether they thought an understanding of threshold concepts and their characteristics would help them in their learning or teaching. In addition, participants were given the opportunity to expound on their answer in a text box.
Next, respondents were asked to evaluate six statements (modified from [23])—using a Likert scale (which ranged from Strongly Agree to Strongly Disagree)—to indicate their agreement with each statement on the impact of threshold theory and threshold concepts, which provided information on research question 3. The six modified statements are as follows:
- Threshold concept research can help academics focus on key ideas in a subject or discipline.
- Threshold concept research can help me focus on the difficulties in my learning.
- Threshold concept research is helpful to instructors when designing the content of a class.
- The identification of threshold concepts can help me develop better learning techniques.
- The identification of threshold concepts can help me do better on my assignments and tests.
- Threshold concepts are a useful way to link subjects/courses/modules into a coherent (degree) program.
Again, a text box was included so that respondents could comment and expand on any or all their responses.
2.3. Data Analysis
Microsoft Excel (version 15.25; Microsoft Corporation, Redmond, WA, USA) was used to store the data. Exploratory quantitative techniques such as means were used to analyze the data, assessing the agreement and differences among respondents. Grouping was used to assess open-ended answers to understand students’ perspectives more fully. These techniques helped to answer the four research questions posed earlier. Last, a list of the highest frequency threshold concepts was generated based on students’ responses as an answer to research question 4.
3. Results
3.1. Survey Section 1: Demographics
Of the 1639 surveys sent by e-mail, 183 were returned (response rate, 11.2%). Of the 183 returned, 75 (41%) were near-complete. This low response rate was expected because the survey included new terminology and a new theory that were most likely unfamiliar to potential respondents and may have been difficult for them to comprehend. Hoadley [23] had a similar experience when they addressed threshold concepts for finance.
Of the 183 responses, 130 students (71%) provided three fundamental concepts based on their point of view, as requested in the survey. Although some of them did not complete the entire survey, their inputs were considered when developing the comprehensive list of threshold concepts. General participant demographics are included in Table 1.

Table 1.
Participant demographics.
3.2. Survey Section 2, Part 1: Participant-Generated Fundamental Concepts
A total of 130 respondents listed up to three fundamental concepts, resulting in 362 separate submissions of fundamental concepts. As a result of overlap, 30 fundamental concepts were provided. For example, when respondents cited the fundamental concepts “t-test,” “correlation testing,” “p value,” “Z score,” and “ANOVA,” these concepts were categorized as “statistical tests.” Based on this example and to eliminate any biases in the grouping process, two of the researchers worked independently to develop their lists. Then, we set and compiled both as a final list. Because there were no fundamental differences between the two lists, the compiling process was mainly focused on naming the grouped concept.
Participants then indicated whether they considered them to be threshold concepts (based on their understanding of a threshold concept). Each answer was assigned a numeric value: yes, 1 point, the fundamental concept is a threshold concept; no, −1 point, the fundamental concept is not a threshold concept; and not sure, 0 point, unsure whether the fundamental concept is a threshold concept.
Respondents then assigned each fundamental concept a rating for the four threshold characteristics: Is it transformative? Is it integrative? Is it irreversible? Is it troublesome? Each answer was assigned a numeric value: yes, 1 point, the characteristic applies to the fundamental concept; no, −1 point, the characteristic does not apply to the fundamental concept; and unsure, 0 point, not sure whether the characteristic applies to the fundamental concept. These point values were used to determine the mean percentage of the four threshold characteristics (Table 2).
Table 2.
Percentage ratings for learner-proposed fundamental concepts.
All but two of the fundamental concepts proposed by participants were considered threshold concepts. Data collection and storage was not considered a threshold concept by one learner, and six respondents were unsure of whether the fundamental concept types of error was a threshold concept.
3.3. Survey Section 2, Part 2: Teacher-Generated Statistical Threshold Concepts
In this part of the survey, respondents were asked to evaluate the 18 statistical threshold concepts generated by colleagues and using the same rubric described in the previous section: Did they consider the proposed statistical threshold concept to be a threshold concept (based on their understanding of a threshold concept), and how did they rate these proposed concepts using the four threshold characteristics? These data are presented in Table 3.
Table 3.
Mean percentage ratings for teacher-proposed statistical threshold concepts based on participant understanding of threshold concepts.
If the concept was considered to be a threshold concept by 25% or more of participants, that concept was labeled a threshold concept. However, if the average concept value was between 0% and ≤25%, the participants as a group were unclear whether the concept was a threshold concept. If the average concept value was less than 0%, respondents did not consider the concept to be a threshold concept. In addition, all proposed statistical threshold concepts classified as threshold concepts were characterized by the participants as transformative and integrative. The data in Table 3 also shows that participants do not consider the majority of the instructor-proposed threshold concepts (16 of 18) to be troublesome, based on their understanding of “troublesome”.
3.4. Survey Section 3: Exposure to Threshold Theory and Impact of Threshold Concepts on Teaching and Learning
Of the 183 respondents, only one had teaching experience (as a tutor for three semesters). Therefore, the feedback in this study represents primarily the learners’ perspectives, providing instructors with concrete thoughts on which to base their curricula to improve the learning outcomes of introductory statistics courses.
3.4.1. Exposure to Threshold Theory
To explore the familiarity of the participants with threshold theory, they were asked to select the best statement that describes their exposure to threshold theory (Table 4). More than 70% of the respondents had no or limited exposure to threshold theory and concepts before this study, which was expected, because this theory is not introduced in engineering colleges in general.
Table 4.
Participant exposure to threshold concepts.
These data are telling. Seventy-three percent of respondents had no or limited exposure to the topic of threshold theory. If we, as academics, hope to help our students succeed in comprehending statistics course material—and any course material, in general—should we not expose all our learners to threshold theory and threshold concepts on a regular basis to inform our understanding of their needs and to tailor curricula appropriately?
Respondents were also asked to indicate, by selecting yes or no, whether they thought an understanding of threshold concepts and their characteristics would help them in their learning or teaching, and to explain their choice if they wished. Specifically, participants were asked the following question: Do you think an understanding of a threshold concept and the four characteristics (transformative, integrative, irreversible, and troublesome) can help you in your learning and/or teaching? Their qualitative answers, grouped by level of concept exposure, are presented in Table 5.
Table 5.
Participant answers to the question: Do you think an understanding of a threshold concept and the four characteristics (transformative, integrative, irreversible, and troublesome) can help you in your learning and/or teaching?
As seen in Table 5, students who had no exposure to threshold concepts and their characteristics agreed that knowledge of them is important, and understanding them would help them master statistics, which is a positive affirmation to encourage instructors to implement threshold theory in designing the curriculum and pedagogy. For those students who had limited exposure to threshold concepts and their characteristics, there was disparity regarding whether threshold concepts would be useful. Some emphasized the positive impact of knowing such concepts to help them retain knowledge and understand the bigger picture. Others indicated they were confused by threshold concepts, and one respondent noted they could not even envision teaching such a topic.
In some of the moderate, and strong exposure categories, all respondents noted the positive impact of knowing and understanding threshold concepts as a means of mastering statistics. In addition, one learner indicated that threshold concepts and their characteristics will support the instructor in developing teaching strategies and designing focused lessons, which will lead to better learning outcomes. Overcoming the barriers of learning that students face is one of the potential important benefits of threshold concepts, according to other learners. Still other respondents commented on the usefulness of threshold concepts in the learning process.
3.4.2. Impact of Threshold Concepts on Teaching and Learning
Last, participants were asked to use a Likert scale to indicate their level of agreement or disagreement regarding the six statements presented to them that describe the impact of threshold concepts theory in the teaching and learning processes. Respondents awarded each of the six statements a qualitative value of either Strongly Agree, Agree, Neither (respondents neither agreed nor disagreed), Disagree, Strongly Disagree, and Do Not Know (participants could not form a perspective about the statement) (Table 6). Each qualitative value was assigned a quantitative value, ranging in decreasing point order from Strongly Agree (5 points) to Do Not Know (0 point). The average mean for each response is calculated in Table 6.
Table 6.
Respondents’ perspectives on the impact of threshold theory on learning and teaching.
Table 6 shows that all six statements were evaluated by many of the participants as either Strongly Agree or Agree (64%). These results indicate that, even though the majority of the respondents had a low level of exposure to threshold theory (73%; Table 4), they developed a positive perspective and recognized its impact on learning and teaching, as demonstrated by all mean values being more than 3.0.
3.4.3. Statistics Threshold Concepts and Curriculum Design
Thirty fundamental concepts were provided by the survey respondents and 18 threshold concepts were devised, resulting in 48 concepts in total. We reviewed the concepts from both learners and instructors, and found some duplication, resulting in 29 final concepts. Table 7 provides the final proposed list of threshold concepts for introductory statistics courses, incorporating learners’ opinions. The concepts are listed in order based on their frequency. Four of the twelve concepts with the greatest frequency (n ≥ 10)— basic probability; statistical tests; research methods, methodology design; and regression—were recommended by the learners, not the instructors. These results support the need to embrace threshold theory to identify threshold concepts for courses.
Table 7.
Final list of threshold concepts for introductory statistics courses.
4. Discussion
The purpose of this research was to identify threshold concepts in introductory statistics courses by surveying engineering students. Threshold concepts are those ideas that bind a subject together and are fundamental to the thinking and practice within a discipline. We applied threshold theory to create a survey that engages educators and learners in identifying threshold concepts and their characteristics. Specifically, we sought to determine those threshold concepts on which instructors should focus when redesigning curricula for introductory statistics courses, taking students’ perspectives into consideration. The questionnaire was adapted from the one used by [23]. To ensure the changes were effectively made to achieve the target list, intensive reviews were conducted by instructors and piloted the questionnaire with similar participants to the targeted population. In the first part of the survey, respondents provided general demographic data. In the second part of the survey, participants were asked to provide up to three fundamental concepts and to indicate which concept they considered to be a threshold and which threshold characteristics applied to the concepts they provided. Respondents then evaluated 18 educator-generated statistical threshold concepts by indicating whether they considered the proposed statistical threshold concept to be a threshold concept and by selecting which threshold characteristics applied to the 18 concepts. The third part of the survey determined participants’ exposure to threshold theory and elicited their understanding of the impact of threshold concepts on teaching and learning. Most respondents believed that determining threshold concepts would assist them in understanding statistics.
A total of 1639 surveys were sent by e-mail to all students in the College of Engineering and Applied Science who took one of the 29 sections of the course Introductory Statistics offered at the UCB. Participants were asked to provide both quantitative and qualitative inputs via Likert scale assessments and to explain their responses about the impact of threshold concepts and their characteristics on the learning and teaching, respectively. According to [4], obtaining feedback through active involvement by hearing (or, in this case, reading) students’ perspectives directly from the students overcomes any shortcomings derived from the passive absorption of information. Open-ended responses enabled students to carefully consider their comments, select their views based on what they had learned, and explain them in a manner that made sense to the researcher-author of this study. This input improved our comprehension and critical evaluation of their ideas.
From a demographic perspective, we were interested to explore the impact in both gender and the education level (undergraduate or graduate). While the percentage of t females is almost matching with the percentage of the female in [24] study, we did not notice any difference in the responses between the genders. All the threshold concepts included in Table 7 have been identified by both genders. On the other hand, it was interesting to find that there were concepts emphasized at one level and not at the other. For example, Confidence and Power, and Population vs. Samples were mentioned by undergraduate students. However, many of the graduate students repeatedly mentioned Hypothesis Testing, and Regression. The experience in statistics and its applications are clear and had impacts on the participants inputs. Compiling all the survey-derived data, we created a list of threshold concepts for statistics to assist in designing effective curricula and foster positive learning outcomes. The findings reveal there are differences in threshold concepts identified by instructors and learners. Learners added 11 threshold concepts to the 18 proposed by the instructors.
To organize the findings and considering the experience and cumulative knowledge impact, we tried to adopt the proposed frameworks by [23,25] to develop a “rainbow” framework for those statistics’ threshold concepts. In this study, we presented only the concepts that had the greatest frequency (n ≥ 10). Using the revised Blooms’ taxonomy [26] and based on the participants’ inputs, we proposed three knowledge levels learners should go through to understand statistics: basic, discipline, and professional (Figure 1). The basic level was equivalent to both factual and conceptual knowledge in the revised Blooms taxonomy, while discipline and professional levels matched with procedural and metacognitive levels, respectively. We determined that, at the basic level, learners should be able to rev = call and understand fundamental information about statistical research methods and random sampling. In addition, they should be able to perform fundamental tests related to data distribution and should be familiar with statistical descriptions. As students master these concepts and improve their skills to that level, they move into the second level of learning: discipline. At the second level, they are exposed to basic probability and probability distribution. The differences between populations and samples should be clear to learners at this level. In addition, they should be able to start to apply the knowledge and skills they have thus acquired to real data, so they can identify and conduct the required analysis of the data. Last, as learners progress to learning topics at the professional level, here, they are not only able to conduct advanced analyses, such as regression and hypothesis testing, but also, they become skilled at evaluating and justifying their findings. At this level, according to the proposed statistical threshold concept rainbow (Figure 1), the students are considered statisticians!! Instructors can use this rainbow with consideration to the cognitive process structure and revised Bloom taxonomy dimensions to develop course curricula that focuses on threshold concepts that should be taught at the different knowledge levels. Additionally, considering statistics instruction, and as a continuum, leads to redesigning curricula by linking and scaffolding courses in a systematic way that helps learners build on the knowledge that they have acquired. As a reader may notice that we did not include all the identified threshold concepts in the rainbow, this provides a research opportunity to distribute the concepts according to the curricula design. Moreover, it is predicted that the use of the threshold concepts and the proposed diagram will help achieve the objective as discussed by [27] about the importance of bridging the knowledge gap between the teacher and the student.
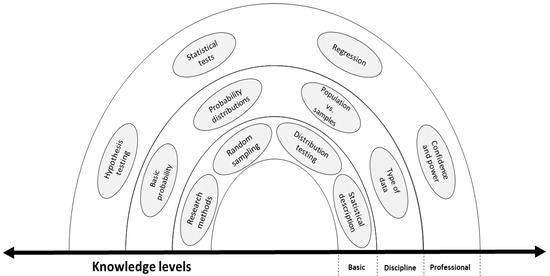
Figure 1.
Statistics threshold concepts rainbow.
Although the findings of this descriptive research contribute to statistical learning and teaching in higher education, there are limitations. The results cannot be generalized due to the fact that all respondents were UCB College of Engineering students. It is unclear whether students from other educational institutions will identify the same threshold concepts ideas as those identified in this study. This determination is an obvious avenue for future research. In addition, participants’ unfamiliarity with threshold concepts and terminology could have limited their assessments.
5. Conclusions
Based on the results of this exploratory research, it is clear that instructors and learners have differing opinions regarding what threshold concepts are in statistics. Highlighting these differences to instructors through active feedback from learners is an important contribution of the study to enhancing learning outcomes. The encouraging news is that, even those students with no exposure to threshold theory could see the benefits associated with identifying threshold concepts in statistics to potentially translate to a positive learning experience. Consequently, enhancing their understanding as a result. Therefore, educators should consider introducing threshold theory to their students to identify threshold concepts in their subjects. Instructors could then use the rainbow framework to create their curricula in a way that builds systematically on the concepts students identify, thus leading to a positive experience and better understanding of the core concepts and principles.
More research and studies should be conducted with different universities to examine replicability and validity of the results found in this study. Additionally, the final list of threshold concepts for statistics, which includes those concepts proposed by learners, should be incorporated in new studies. Validation research should be conducted via a Delphi methodology with instructors to distribute and finalize the threshold concepts through the knowledge levels with consideration from the perspective of Bloom Taxonomy. Another suggestion for future research is to determine how to incorporate the study of these findings in redesigning course syllabi using the rainbow framework, and how to deliver the identified threshold concepts in more effective ways to enhance the learning process. Future research could use the same research methods to identify threshold concepts for other disciplines and determine how to incorporate the results to redesign course syllabi using the same methodology.
Last, the amalgamation of threshold concepts from the perspectives of instructor and learner is novel and fascinating. Combining the findings of this research with other pedagogical techniques such as Backward Design and Universal Design of Learning will provide unique opportunities to enhance education. This is an area for further research.
Author Contributions
Conceptualization, W.H.B.; methodology, W.H.B. and R.L.; software, F.K.; validation, R.L., E.M.B. and K.A.A.; formal analysis, W.H.B.; data curation, W.H.B.; writing—original draft preparation, W.H.B.; writing—review and editing, R.L., P.C.O., I.U.H. and A.M.H.; visualization, P.C.O. and E.M.B. All authors have read and agreed to the published version of the manuscript.
Funding
This research received no external funding.
Institutional Review Board Statement
The Record Number for the research is 15-0680. All identifying information was removed by the Dean’s office of the College of Engineering and Applied Science.
Informed Consent Statement
Informed consent was obtained from all subjects involved in the study.
Data Availability Statement
Not applicable.
Acknowledgments
This work was supported by Laura L. B. Border, the Director of Graduate Teacher Program and college of engineering at the UCB.
Conflicts of Interest
The authors declare no conflict of interest.
References
- Hayslett, H.T. Statistics; Elsevier: Amsterdam, the Netherlands, 2014. [Google Scholar]
- Aron, A.; Aron, E.N. Statistics for Psychology, 2nd ed.; Prentice Hall: Englewood Cliffs, NJ, USA, 1999. [Google Scholar]
- National Institute on Alcohol Abuse and Alcoholism. Statistics in Research Reports: A Reader’s Guide. Alcohol Heal. Res. World 1985, 9, 38. [Google Scholar]
- Garfield, J.; Ahlgren, A. Difficulties in Learning Basic Concepts in Probability and Statistics: Implications for Research. J. Res. Math. Educ. 1988, 19, 44–63. [Google Scholar] [CrossRef]
- Koparan, T. Difficulties in Learning and Teaching Statistics: Teacher Views. Int. J. Math. Educ. Sci. Technol. 2015, 46, 94–104. [Google Scholar] [CrossRef]
- Meyer, J.H.F.; Land, R. Threshold Concepts and Troublesome Knowledge (1): Linkages to Ways of Thinking and Practising within the Disciplines. In Improving Student Learning Theory and Practice—10 Years on; Oxford Centre for Staff and Learning Development: Oxford, UK, 2003. [Google Scholar]
- Lee, C.; Meletiou-Mavrotheris, M. Some Difficulties of Learning Histograms in Introductory Statistics. In Proceedings of the Joint Statistical Meetings—Section on Statistical Education, San Francisco, CA, USA, 3–7 August 2003; pp. 2326–2333. [Google Scholar]
- Cousin, G. Neither Teacher-Centred nor Student-Centred: Threshold Concepts and Research Partnerships. J. Learn. Dev. High. Educ. 2010. [Google Scholar] [CrossRef]
- Meyer, J.H.F.; Land, R. Threshold Concepts and Troublesome Knowledge (2): Epistemological Considerations and a Conceptual Framework for Teaching and Learning. High. Educ. 2005, 49, 373–388. [Google Scholar] [CrossRef]
- Meyer, J.H.F.; Land, R.; Baillie, C. Threshold Concepts and Transformational Learning; Sense Publishers: Rotterdam, the Netherlands; Boston, MA, USA, 2010. [Google Scholar]
- Hoadley, S.; Kyng, T.; Tickle, L.; Wood, L.N. Threshold Concepts in Finance: Student Perspectives. Int. J. Math. Educ. Sci. Technol. 2015, 46, 1004–1020. [Google Scholar] [CrossRef]
- Kiley, M. Identifying Threshold Concepts and Proposing Strategies to Support Doctoral Candidates. Innov. Educ. Teach. Int. 2009, 46, 293–304. [Google Scholar] [CrossRef]
- Srivastava, S.K. Threshold Concepts Framework: An Effective Approach to Address Future Spatial Sciences Pedagogical Challenges. In Proceedings of the Queensland Surveying and Spatial Conference (QSSC), Brisbane, Australia, 13–14 September 2012; pp. 1–16. [Google Scholar]
- Green, D.A.; Loertscher, J.; Minderhout, V.; Lewis, J.E. For Want of a Better Word: Unlocking Threshold Concepts in Natural Sciences with a Key from the Humanities? High. Educ. Res. Dev. 2017, 36, 1401–1417. [Google Scholar] [CrossRef]
- Boustedt, J.; Eckerdal, A.; McCartney, R.; Moström, J.E.; Ratcliffe, M.; Sanders, K.; Zander, C. Threshold Concepts in Computer Science: Do They Exist and Are They Useful? ACM SIGCSE Bull. 2007, 39, 504–508. [Google Scholar] [CrossRef]
- Green, E.A. Building Bridges in First-Year Composition: Investigating the Support. Doctoral of Philosophy, Old Dominion University, Norfolk, VA, USA, May 2021. Available online: https://digitalcommons.odu.edu/english_etds/112 (accessed on 9 December 2021).
- Kallia, M.; Sentance, S. Threshold Concepts, Conceptions and Skills: Teachers’ Experiences with Students’ Engagement in Functions. J. Comput. Assist. Learn. 2021, 37, 411–428. [Google Scholar] [CrossRef]
- Savin-Baden, M.; Tombs, G. Threshold Concepts in Problem-Based Learning; Brill: Leiden, the Netherlands, 2018. [Google Scholar]
- Land, R.; Cousin, G.; Meyer, J.H.F.; Davies, P. Threshold Concepts and Troublesome Knowledge (3): Implications for Course Design and Evaluation. Improv. Stud. Learn. Divers. Inclusivity 2005, 4, 53–64. [Google Scholar]
- Khan, R.N. Identifying Threshold Concepts in First-Year Statistics. Educ. Res. Perspect. Int. J. 2014, 41, 217–231. [Google Scholar]
- MacDougall, M. Threshold Concepts in Statistics and Online Discussion as a Basis for Curriculum Innovation in Undergraduate Medicine. MSOR Connect. 2010, 10, 21–41. [Google Scholar] [CrossRef]
- Dunne, T.; Low, T.; Ardington, C. Exploring Threshold Concepts in Basic Statistics, Using the Internet. In Proceedings of the IASE Satellite Conference, Berlin, Germany, 11–12 August 2003. [Google Scholar] [CrossRef]
- Hoadley, S.; Tickle, L.; Wood, L.N.; Kyng, T. Threshold Concepts in Finance: Conceptualizing the Curriculum. Int. J. Math. Educ. Sci. Technol. 2015, 46, 824–840. [Google Scholar] [CrossRef]
- Ertl, B.; Luttenberger, S.; Paechter, M. The Impact of Gender Stereotypes on the Self-Concept of Female Students in STEM Subjects with an Under-Representation of Females. Front. Psychol. 2017, 8, 703. [Google Scholar] [CrossRef] [PubMed]
- Wood, L.N.; Mather, G.; Petocz, P.; Reid, A.; Engelbrecht, J.; Harding, A.; Houston, K.; Smith, G.H.; Perrett, G. University Students’ Views of the Role of Mathematics in Their Future. Int. J. Sci. Math. Educ. 2012, 10, 99–119. [Google Scholar] [CrossRef][Green Version]
- Krathwohl, D.R. A Revision of Bloom’s Taxonomy: An Overview. Theory Pract. 2002, 41, 212–218. [Google Scholar] [CrossRef]
- Epley, N.; Waytz, A. Mind Perception. In Handbook of Social Psychology, 5th ed.; Fiske, S.T., Gilbert, D.T., Lindzey, G., Eds.; John Wiley & Sons, Inc.: Hoboken, NJ, USA, 2010; Volume 2, pp. 498–541. [Google Scholar]
Publisher’s Note: MDPI stays neutral with regard to jurisdictional claims in published maps and institutional affiliations. |
© 2022 by the authors. Licensee MDPI, Basel, Switzerland. This article is an open access article distributed under the terms and conditions of the Creative Commons Attribution (CC BY) license (https://creativecommons.org/licenses/by/4.0/).