Article

Assessment of Cognitive Student Engagement Using Heart Rate Data in Distance Learning during COVID-19

by
Andrea Catalina Ladino Nocua
1,
Joan Paola Cruz Gonzalez
1,*,
Ivonne Angelica Castiblanco Jimenez
2,*,
Juan Sebastian Gomez Acevedo
3,
Federica Marcolin
2 and
Enrico Vezzetti
2
1
Industrial Engineering Department, Escuela Colombiana de Ingenieria Julio Garavito, Ak 45 205-59, Bogota 110111, Colombia
2
Department of Management and Production Engineering, Politecnico di Torino, Corso Duca degli Abruzzi 24, 10129 Turin, Italy
3
MSc in Engineering and Management, Politecnico di Torino, Corso Duca degli Abruzzi 24, 10129 Turin, Italy
*
Authors to whom correspondence should be addressed.
Educ. Sci. 2021, 11(9), 540; https://doi.org/10.3390/educsci11090540
Submission received: 2 August 2021 / Revised: 7 September 2021 / Accepted: 7 September 2021 / Published: 14 September 2021

Abstract

:
Student engagement allows educational institutions to make better decisions regarding teaching methodologies, methods for evaluating the quality of education, and ways to provide timely feedback. Due to the COVID-19 pandemic, identifying cognitive student engagement in distance learning has been a challenge in higher education institutions. In this study, we implemented a non-self-report method assessing students’ heart rate data to identify the cognitive engagement during active learning activities. Additionally, as a supplementary tool, we applied a previously validated self-report method. This study was performed in distance learning lessons on a group of university students in Bogota, Colombia. After data analysis, we validated five hypotheses and compared the results from both methods. The results confirmed that the heart rate assessment had a statistically significant difference with respect to the baseline during active learning activities, and this variance could be positive or negative. In addition, the results show that if students are previously advised that they will have to develop an a new task after a passive learning activity (such as a video projection), their heart rate will tend to increase and consequently, their cognitive engagement will also increase. We expect this study to provide input for future research assessing student cognitive engagement using physiological parameters as a tool.

1. Introduction

Education allows society and its territories to be transformed. As society changes, the education style must adapt to its demands [1]. Educational institutions focus their resources on achieving quality teaching and professional development for their students, who expect education to be suitable, reasonable, interactive, agreeable, and practical [2]. Achieving these expectations directly impacts student engagement and become a matter of concern for teachers and institutions; therefore, measuring student engagement becomes a valuable and necessary tool for institutions [2]. Student engagement has been defined as the physical or mental energy and effort students apply and invest in their academic environment [3]. Also, student engagement envelops the disposition and energy that students maintain in a learning process, persistence in the face of obstacles, and the value given to learning [4]. A higher level of student engagement generates deep learning, active participation, and a positive response to challenges [4].
The interest in raising student engagement has led to the importance of its measurement [5,6]. So far, in Colombia, student engagement has been measured using self-report methods, such as questionnaires, in which students directly report their perceptions; sometimes, these methods can be subjective and divert attention [7]. Furthermore, according to the literature review, a different approach has not yet been implemented in this country.
Higher education has been affected by the pandemic of COVID-19, generating impacts on education systems. Institutions have had to adapt their methodologies to a virtual environment and implement new teaching and online assessment strategies [8]; this transition has received different terms like remote teaching, online learning, or distance education [9]. Some obstacles students face with this situation are an unstable internet connection, restricted access to technological tools, and inadequate space to take classes [9]. Lassoued et al. have classified these difficulties into four categories: personal (self-imposed), pedagogical, technical, and financial obstacles [10].
This paper presents an investigation conducted in Colombia to measure cognitive student engagement by measuring students’ heart rate during the COVID-19. In the United States, Darnell D. K. and Krieg P. A. [7] implemented a similar method in a group of medical students; the researchers measured cognitive student engagement using wristwatch-style monitors, which detected and recorded the heart rate of the study subjects during lecture classes that applied active learning activities [7]. In India, Senthil and Lin performed a study using a wireless wearable sensor to collect the heart rate of university students for measuring engagement, comparing the heart rate in a state of rest against the heart rate during active learning activities in lecture classes [11].
The structure of this paper is as follows: first, we introduce a background of previous works focused on the diverse methods for measuring cognitive student engagement. Next, we present the methodology, divided into three phases: (1) research preparation, which describes the instruments and tools necessaries for began the data collection, (2) execution of the research. This phase includes the collection of three types of data, quantitative data of heart rate, qualitative data of annotations taken by the researchers during the development of each virtual lesson, and the qualitative data of the questionnaire, (3) and data treatment, in this phase we proceed to the cleaning and processing of data for validating five hypotheses, as well as the comparative analysis of the non-self-report method vs. the self-report method using a quadrant model. Then, we proceeded to the analysis and results of the three phases of the methodology. Finally, we reported our conclusions and future directions of research.

2. Background

Student engagement can be perceptible in the behavioral, cognitive, or affective dimensions [3]. Behavioral engagement occurs when students get involved in their learning, for example, selecting times or places to study [12]. Cognitive engagement happens when students make a mental effort on the topic they are learning; when students use deep or superficial study methods, they can identify the type of mental effort [12]. Finally, affective engagement refers to the students’ emotions, such as interest, enjoyment, or frustration [12].
Cognitive engagement is defined as the level of psychological investment that students make in the learning environment [13]. It considers mental efforts focused on reflecting, implementing strategies, and willingness to carry out the requirements for understanding complex ideas and train themselves in skills with a high degree of difficulty to master the material and achieve new knowledge [14]. Literature also describes cognitive engagement as the preference from the student of performing challenging tasks and being self-regulated, a condition that leads to planning and monitoring their own learning [15]. Cognitive engagement contributes the flexibility in problem-solving and a positive attitude toward facing failures [14].
Cognitive engagement has two levels depending on the student’s effort: superficial and active engagement [16]. Superficial engagement is a minimal effort in the learning like simple memorization, help-seeking, and effort-avoidant strategies; on the other hand, active engagement implied deep understanding and expertise in activities such as attention, planning, connecting, and monitoring the learning [14].
In the literature, the studies found have implemented different methods to measure student engagement evaluated from the perspective of the study subject, the student. These methods can be classified into two categories: self-report methods and non-self-report methods [17]. One of the characteristics of the self-report methods is that the study subjects report the data directly. The most used tools are questionnaires and interviews. On the other hand, the non-self-report methods use tools that allow collecting the data without consulting directly with the study subject, such as capturing a video during class, which can later be used to analyze the emotions that the person experiences [17]. It is important to highlight that various studies have been developed for measuring student engagement from a third-party agent perspective, like a professor, a psychologist, or a researcher; these studies include teacher ratings, observation, and many others. Our study implemented a method that determines the cognitive student engagement using the data measured directly from students. Consequently, the background is focused on giving examples of good practices implemented to determine student engagement examining the student point of view and behavior directly. In this sense, it isolates studies that assessed engagement from a third-party perspective only.
Different countries have used self-report methods; in most cases, the researchers used questionnaires or surveys created or adapted from previous investigations. Table 1 shows some studies that have used self-report methods.
In the USA, the researchers have used surveys and questionnaires to measure student engagement; they carried out activities different from the traditional class. In one case, Lei et al. applied the National Survey of Student Engagement in a lesson composed of six people; three of them were physically present, and the other three in telepresence [18]. In another study, the students developed a mobile game using a tool (GameSalad) created by the researchers, and then they measured student engagement using a questionnaire [19].
In Malaysia, Awang-Hashim R. et al. used a survey to evaluate the scale of participation in student learning at the University of Malaysia (MUSLIS) consisting of 24 items; later, they performed the data analysis using specific software [20]. In Turkey, Alion and Delialioğlu implemented m-learning material in a computer networks course to measure student engagement and motivation using the NSSE- National Survey of Student Engagement and the MSLQ- Motivated Strategies for Learning Questionnaire, m-learning is the method that allows students to acquire certain types of knowledge anywhere and anytime utilizing wireless technologies, here is important to state that e-learning materials are designed to be watched on computers, while the visualization of m-learning materials is better on tablets or smartphones [21].
In China, Zhoc et al. applied the HESES-Higher Education Student Engagement Scale survey, which allowed to evaluated five facets of student engagement: academic engagement, cognitive engagement, social engagement with classmates, social engagement with teachers, and affective engagement [22]. Another study applied a survey to measure student engagement, Ma J. et al. used a guide for the formulation of projects of innovation and technological development in a mixed environment, that is, the combination of face-to-face and virtual class; the survey evaluated three modules: behavioral, cognitive and emotional behavior [23].
Although questionnaires and surveys are the most common tools, some researchers have used other tools; for instance, in the United Kingdom, Balaam et al. developed a handheld orb named Subtle Stone for implementing an interactive method with the students, the study subjects, had to press the Subtle Stone to indicate the emotion that they were experimenting in a class [24].
Table 2 presents some studies that have used non-self-report methods in different countries. These methods usually collect and analyze data on the physiological characteristics of the study subjects, such as facial expressions, eye movement, heart rate, among others.
Some studies conducted in China, the USA, Canada, and Ireland analyze facial expressions to determine factors such as emotions or student engagement. In Hong Kong, Zeng H. et al. developed an analytical system that recognizes emotions through facial expressions, named EmotionCues; they use a camera and software that detects which emotion a student is expressing [17]. In another study conducted in China, Zhang H. et al. identified affective states such as boredom, confusion and engagement through a facial recognition system [6]. In the USA, Alkabbany et al. recorded a video during a reading of 10 to 15 min; this video focused on the angle of the posture of the face and the gaze, after, the researchers analyzed these characteristics to identify student engagement [25]; in another study also carried out in the USA, Whitehill J. et al. analyzed facial expressions using Machine Learning to determine the level of engagement [5]. In Canada, Sakulchit et al. identified the emotions that children experienced before, during and after taking a blood sample through facial expressions [26] and in the case of Ireland, using an application, Farrell et al. analyzed the subject’s head posture to determine if the student was looking at the screen. Thus, they detected the person’s emotional state, which finally allowed them to determine the student engagement [27].
Other physiological characteristics analyzed in the studies presented include the study of brain signals and eye movement. In Brazil, Herpich F. et al. measured the signals emitted by the brains of students when interacting with educational technology [28]. In Japan, Hayashi et al. used lenses with integrated electrodes to analyze the user’s eye movement and thus determine student engagement [29].
Finally, the heart rate is another physiological characteristic that researchers have used to measure student engagement [7,11]. In a study performed in the United States, Darnell D.K. and Krieg P.A. measured student engagement, specifically cognitive engagement, analyzing the students’ heart rate. Researchers analyzed the heart rate behavior using wristwatch-style monitors during active learning activities [7].
Heart rate has been a tool widely used for identifying and monitoring emotions, attention, autonomic process and mental conditions [30,31,32,33,34]; heart rate is associated with the autonomic nervous system, which responds to a stimulus or resting states [33,35]. Emotions have three components: cognitive, physiological and behavior [34]. These components allow researchers to use the heart rate to measure more advanced factors like cognitive engagement [7,35]. Cognitive engagement can be determined through the heart rate since the exposure to stimulus or tasks activates neural mechanisms and, consequently, triggers an acceleration or deceleration in the heart rate, which has been an indicator of alertness and drowsiness [36,37,38].The advantages of using heart rate include it is non-invasive, easy, and cheap to get [33,34], experiments with heart rate are simple to set up and can be used in conjunction with other biometric measures like facial expressions and respiration [38,39]. The disadvantages associated with the heart rate are the conditions of the environment under which happen the data collection since they are challenging to eliminate, and also the response time to a stimulus is long; these two points generate more uncertainty [30,40,41].
Active learning activities allow student engagement to be improved and induced [42,43]. The concept of active learning refers to activities that induce students in a thinking process about the new information and connect it with experience or knowledge [42,44]. There is a great variety of activities that can be considered as active learning, such as discussion in small groups, peer activities, individual activities that required a mental effort, interactions, study cases, problem resolution, laboratories, quizzes, and games, all of them have to guarantee that students think effectively [42,43,44,45,46]. The advantages include that students feel more secure sharing their ideas in small groups, developing critical thinking, retaining new knowledge, developing communication and leadership skills, and feeling more motivated and interested [42,44,45,46,47].
In Colombia and Latin America, as some researchers stated, the investigations regarding education and student engagement have focused on the following topics: study habits and motivation for distance learning [48], academic dropout and its relationship with the student’s conditions and the organizational context of the academic institution [49] the relationship between student engagement and academic performance determined through the academic average [50], and the relationship that emotional intelligence and happiness orientation have with student engagement [51].
Other research examines the opinion of students in schools regarding how they experience student engagement after conducting, recording, and analyzing surveys [52]. Bertel-Narváez M. P. et al. performed a literary review of education in Latin America, highlighting that the motivation of learning is a fundamental aspect of developing research in Latin America [1]. Studies and research developed in Colombia have used traditional methods such as interviews, surveys, questionnaires, and the corresponding analysis. However, in this country, the studies developed have not yet used more advanced methods, which measure student engagement with physiological characteristics.
In Colombia, the studies performed have not implemented a method that uses physiological characteristics to measure cognitive engagement. This work developed exploratory research, similarly to the analysis proposed in the United States by Darnell D.K. and Krieg P.A. [7] and adapted for this study during the pandemic. We used the heart rate for measuring cognitive student engagement. In some studies, the heart rate is also used for determining the emotional aspect [38], which means that emotional and cognitive engagement generate a variation in the heart rate. For that reason, a good way to differentiate these dimensions is through the activity or stimuli to which the student is exposed. In this study we selected active learning activities, which are focused on activating the cognitive engagement. For collecting data, the students used a heart rate band linked to a mobile application while participating in virtual lessons that contained active learning activities; every student collected her or his heart rate during four lessons; the total data collection took three months. This research took place at Escuela Colombiana de Ingeniería Julio Garavito in Bogotá, Colombia, in a sample of 20 students, from which we discarded four students after data cleaning.

3. Materials and Methods

This study adopted the methodology developed by Carrasco and cited by Viñan J.A. et al. [53]. It consists of three phases (Table 3); the first phase entails the research preparation, the second phase the execution of the research, and the third phase regards the data treatment. The objective of this study was to determine the cognitive student engagement using the heart rate as the primary measurement tool and using a questionnaire as a complementary tool.
The development and detail of each phase are described below.

3.1. Phase 1. Research Preparation

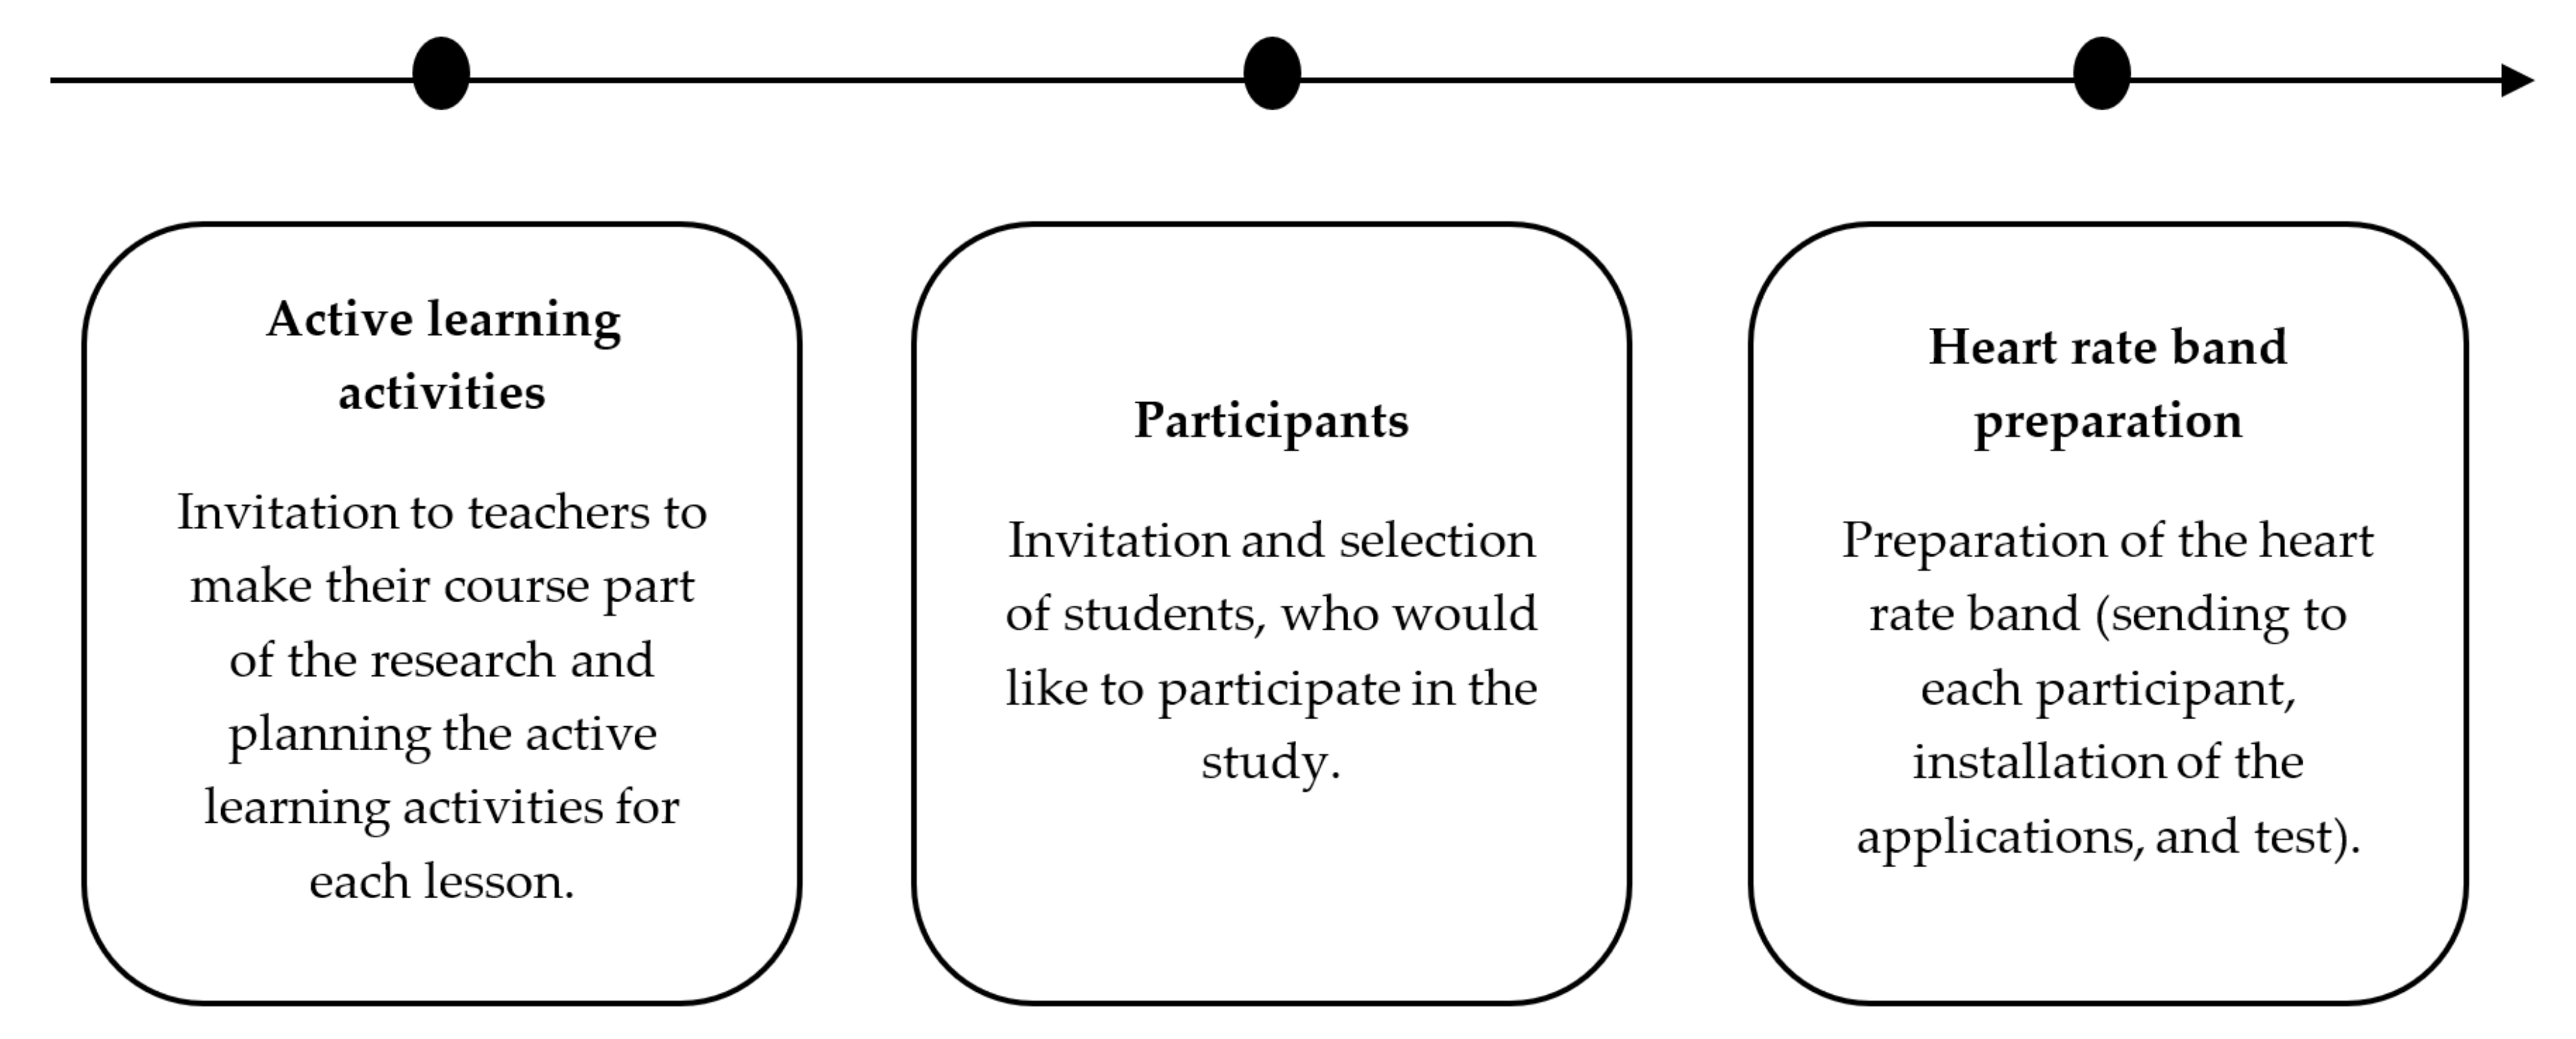
This phase consists of four activities to prepare instruments and tools necessary for began the data collection. Figure 1 details each activity.
Below, we explain the considerations made for developing each activity.

3.1.1. Active Learning Activities

All the activities planned with the professor include active learning activities performed in virtual lessons during the situation of COVID-19. In each lesson they developed the method Think Pair Share proposed by Kaddoura [54] and adapted it to this study, which we detail below:
  • Think: the professor asked a question, observation, case study, or video that induced the student to think. The student had to think and write down the answers.
  • Pair, partner or individual: students had to share the answer with one or two partners to analyze each one and reach a consensus on the best answer to the question asked. When performed individually, the student must perform an activity, as instructed by the professor.
  • Share: then, the professor asked each pair of classmates to share their answers with the whole lesson. However, in some cases, the students did not share their answers but gave the solution to the professor directly.

3.1.2. Participants

The following characteristics were important for selecting the participants:
  • They must be legal age.
  • They must have a compatible cell phone.
  • They must live in Bogotá or neighboring cities.
  • Students must participate voluntarily.
In this study, we measured the heart rate of 20 students, from which we discarded four students after cleaning the data. We defined the number of participants after reviewing the sample used in similar studies carrying out non-self-report methods. (Table 4).
Ethical considerations were taken into account following the guideline given by Escuela Colombiana de Ingeniería Julio Garavito, the area of Política de Tratamiento de Datos (Data Processing Policy Department) reviewed and approved the document of data treatment used in this study, that posteriorly was signed by each student. The following ethical guidelines were implemented in the research:
  • We preserved participants’ anonymity.
  • Each participant’s personal data was used only for the objectives of the research and we obtained the students’ permission for using these data, keeping the real name confidential.
  • The activities developed in each lesson avoided exposing participants to mental stress.
  • We informed participants about the correct use of heart rate bands, a tool that is not dangerous or risky.
  • We gave each participant an informed consent with the corresponding information about how the research will be developed.

3.1.3. Heart Rate Band Preparation

This investigation used heart rate bands, which can measure the heart rate with a frequency of one minute; these have a Photoplethysmography (PPG) heart rate sensor, which applies low-intensity infrared (IR) light on the skin. An optical sensor measures light reflection, which changes depending on the blood flow through the illuminated spot. Since blood flow changes during a heartbeat, it is possible to measure the heart rate.
The considerations for preparing the heart rate band were the following:
  • Each course was composed of 5 or 4 students who participated in the research.
  • The heart rate band must be delivered to each participant.
  • Each participant must install the heart rate recording app on their cell phone.
  • To verify the correct functioning of the heart rate band, the students made a preliminary test.

3.2. Phase 2. Execution of the Research

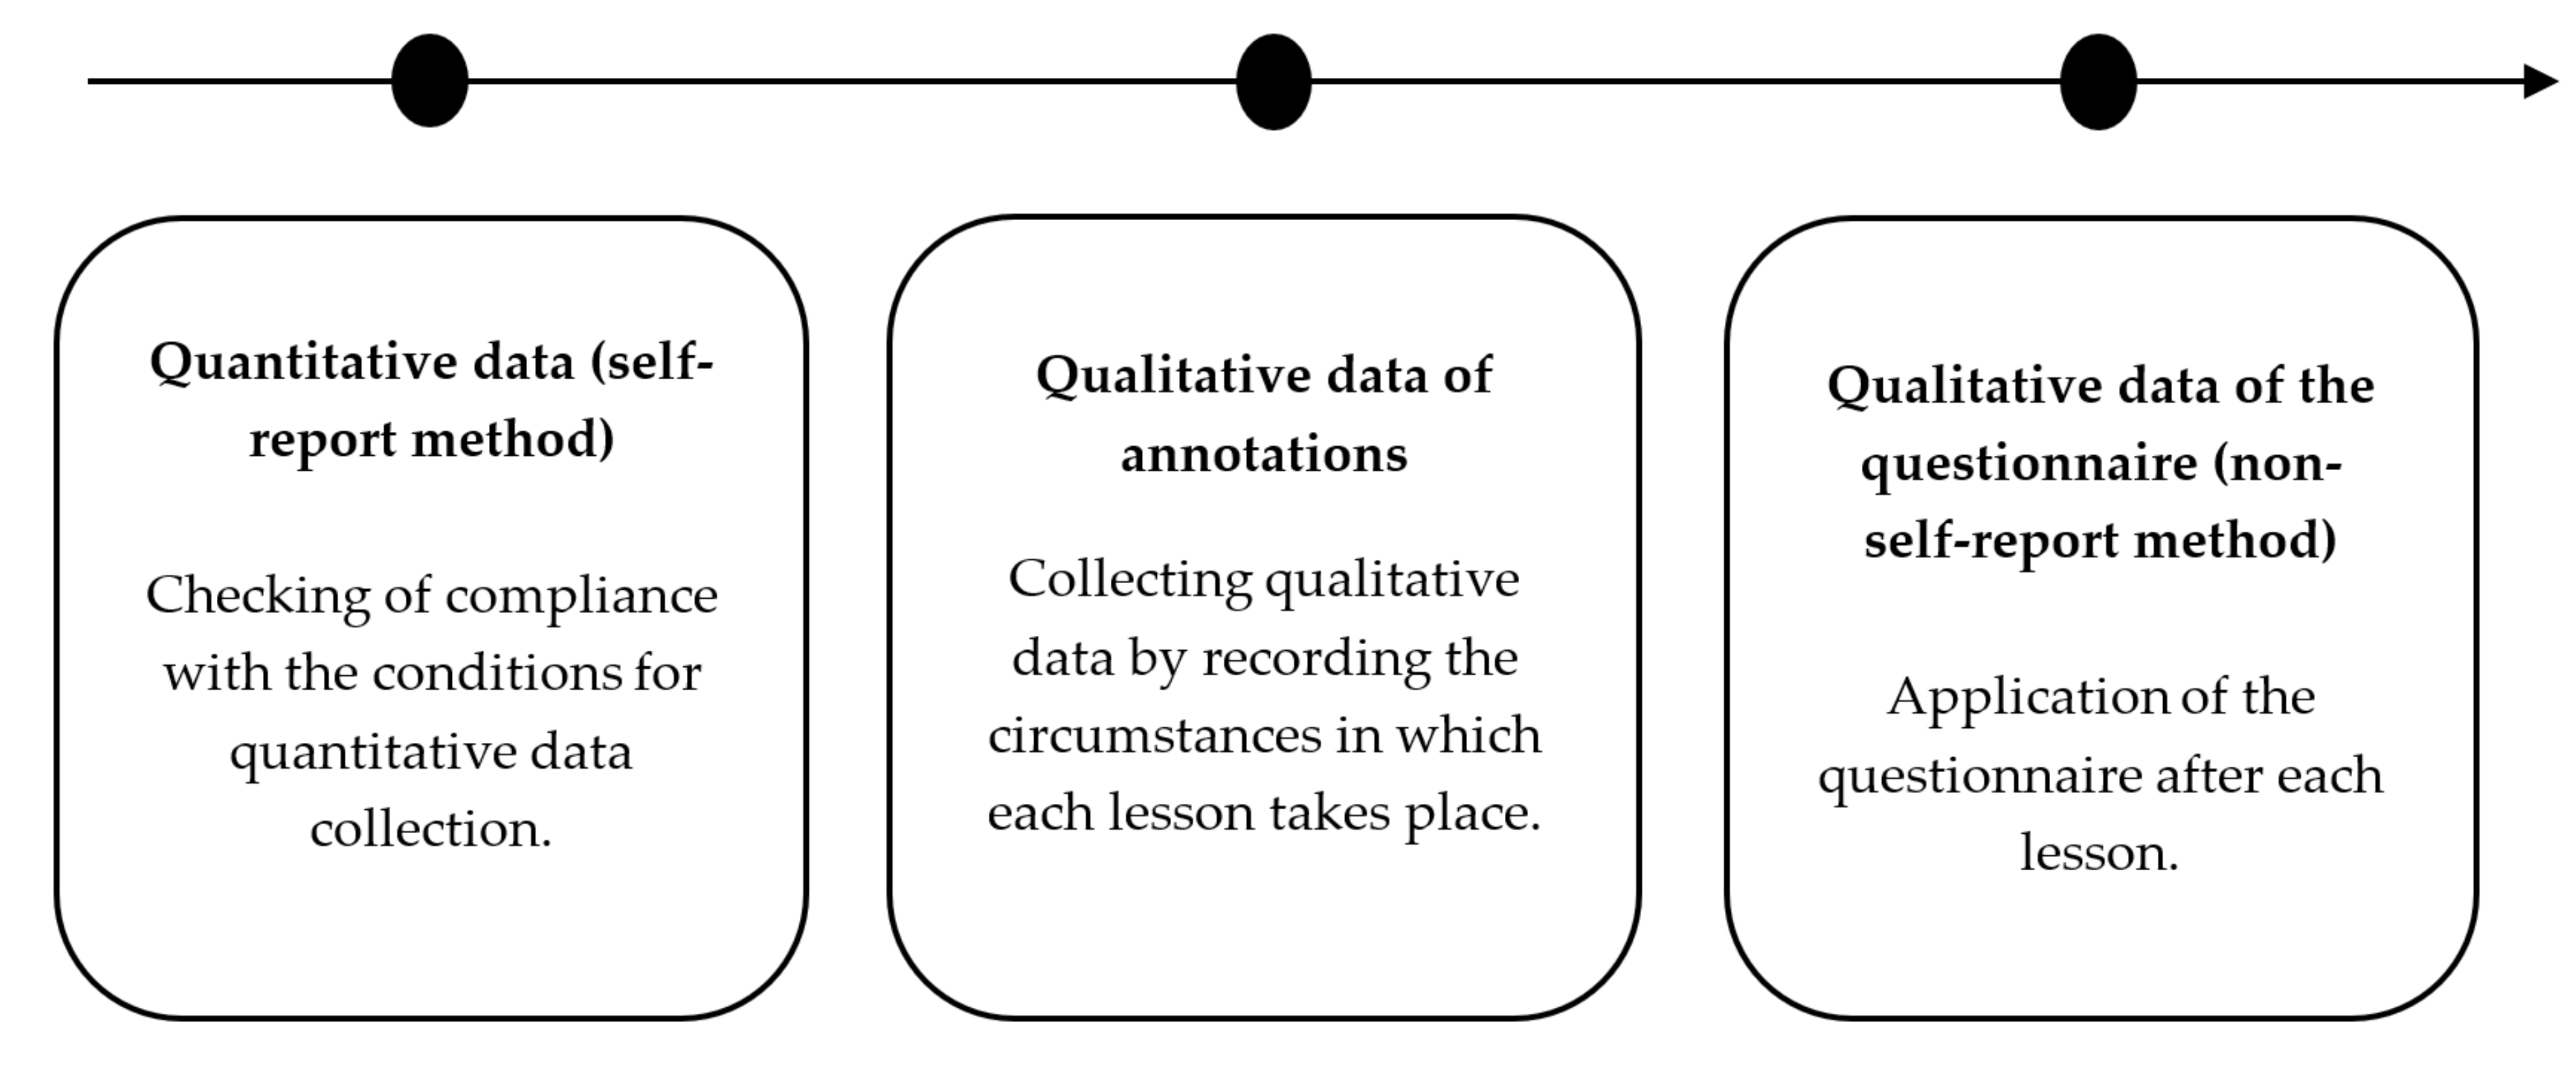
We divided the execution of the investigation into three categories, which composed the data collected: quantitative data, qualitative data of annotations, and qualitative data of the questionnaire. The quantitative data (obtained through a non-self-report method) refers to data of heart rate collected through the heart rate app during the development of each virtual lesson. The annotations of qualitative data refer to the data collected by the researchers while attending each lesson and taking note of the activities carried out and their respective time. Finally, the qualitative data refers to the questionnaire (self-report method) that each student filled out at the end of each lesson, which evaluated the cognitive student engagement. Figure 2 presents each data category collected in this phase. Below, we explain the conditions required in each data category.

3.2.1. Quantitative Data (Non-Self-Report Method)

The conditions verified in the quantitative data collection were the following:
  • The students must wear the heart rate band five minutes before starting the virtual lesson.
  • The students must activate and connect the Bluetooth between the cell phone and the heart rate band.
  • Participants must follow the instruction for measuring the baseline heart rate; it refers to each participant’s heart rate during a rest state.
  • Participants must connect to the lesson on time.
  • The participants agreed to send the data after finishing each lesson.

3.2.2. Qualitative Data of Annotations

To collect annotations qualitative data, the researchers considered the following aspects:
  • Identify when the virtual lesson started, splitting the greeting from the main topic.
  • Recognize when active learning activities started and finished.
  • Take note of the moment when participants intervened.
  • Identify activities that can generate some emotions in the participant not planned by the research.
  • Record the exact time when the virtual lesson ends.

3.2.3. Qualitative Data of the Questionnaire (Self-Report Method)

A questionnaire is a self-report tool to measure student cognitive engagement. However, using this method will allow us to compare the report made by the students and the results obtained with the measurement of heart rate and helping to identify factors that may affect the student’s heart rate behavior during lessons.
As described above, the participants filled out a questionnaire after completing each virtual lesson; the main objective is to identify the students’ cognitive engagement reported, allowing us to compare the participants’ answers and the heart rate behavior.
To identify student cognitive engagement in different contexts, the queries in the questionnaire were selected following three studies, which applied questions focused on measuring student engagement. For the design of the questionnaire for this study, we selected questions focused on measuring student cognitive engagement.
  • Study one: Exploring Factors and Indicators for Measuring Students’ Sustainable Engagement in e-Learning [55]
In this research through a questionnaire, they analyzed six factors in student engagement in the e-learning environment: factor 1. psychological motivation, factor 2. peer collaboration, factor 3. cognitive problem solving, factor 4. interactions with instructors, factor 5. community support, and factor 6. learning management. For our study, we selected and adapted factor 3 (Cognitive problem solving).
  • Study two:Examining engagement in context using experience-sampling method with mobile technology [12]
The following measures were applied in the above survey: study time, study location, reasons for study, behavioral engagement, cognitive engagement, self-efficacy, academic motivation, and prior academic achievement. For our questionnaire, we adapted the measures used in cognitive engagement.
  • Study three:Initial Development Process of a Student Engagement Scale in Blended Learning Environment [23]
In this study, Ma J. et al. designed and constructed a student engagement scale framework in higher education during blended learning environment. They evaluated the three dimensions of student engagement (cognitive, behavioral, and emotional). For our questionnaire, we selected the items used in cognitive student engagement.
Table 5 presents the format used in the questionnaire, the self-report method used in this study, which the students filled after finishing each virtual lesson. We used a Likert scale from 1 to 5 (1: totally disagree and 5: totally agree) to rate each item. The interpretation given to this scale related to cognitive student engagement was the following: An answer of 1 indicated a low cognitive engagement, an answer of 5 indicated a high cognitive engagement, and an answer of 3 was taken as a neutral position regarding the question.

3.3. Phase 3. Data Treatment

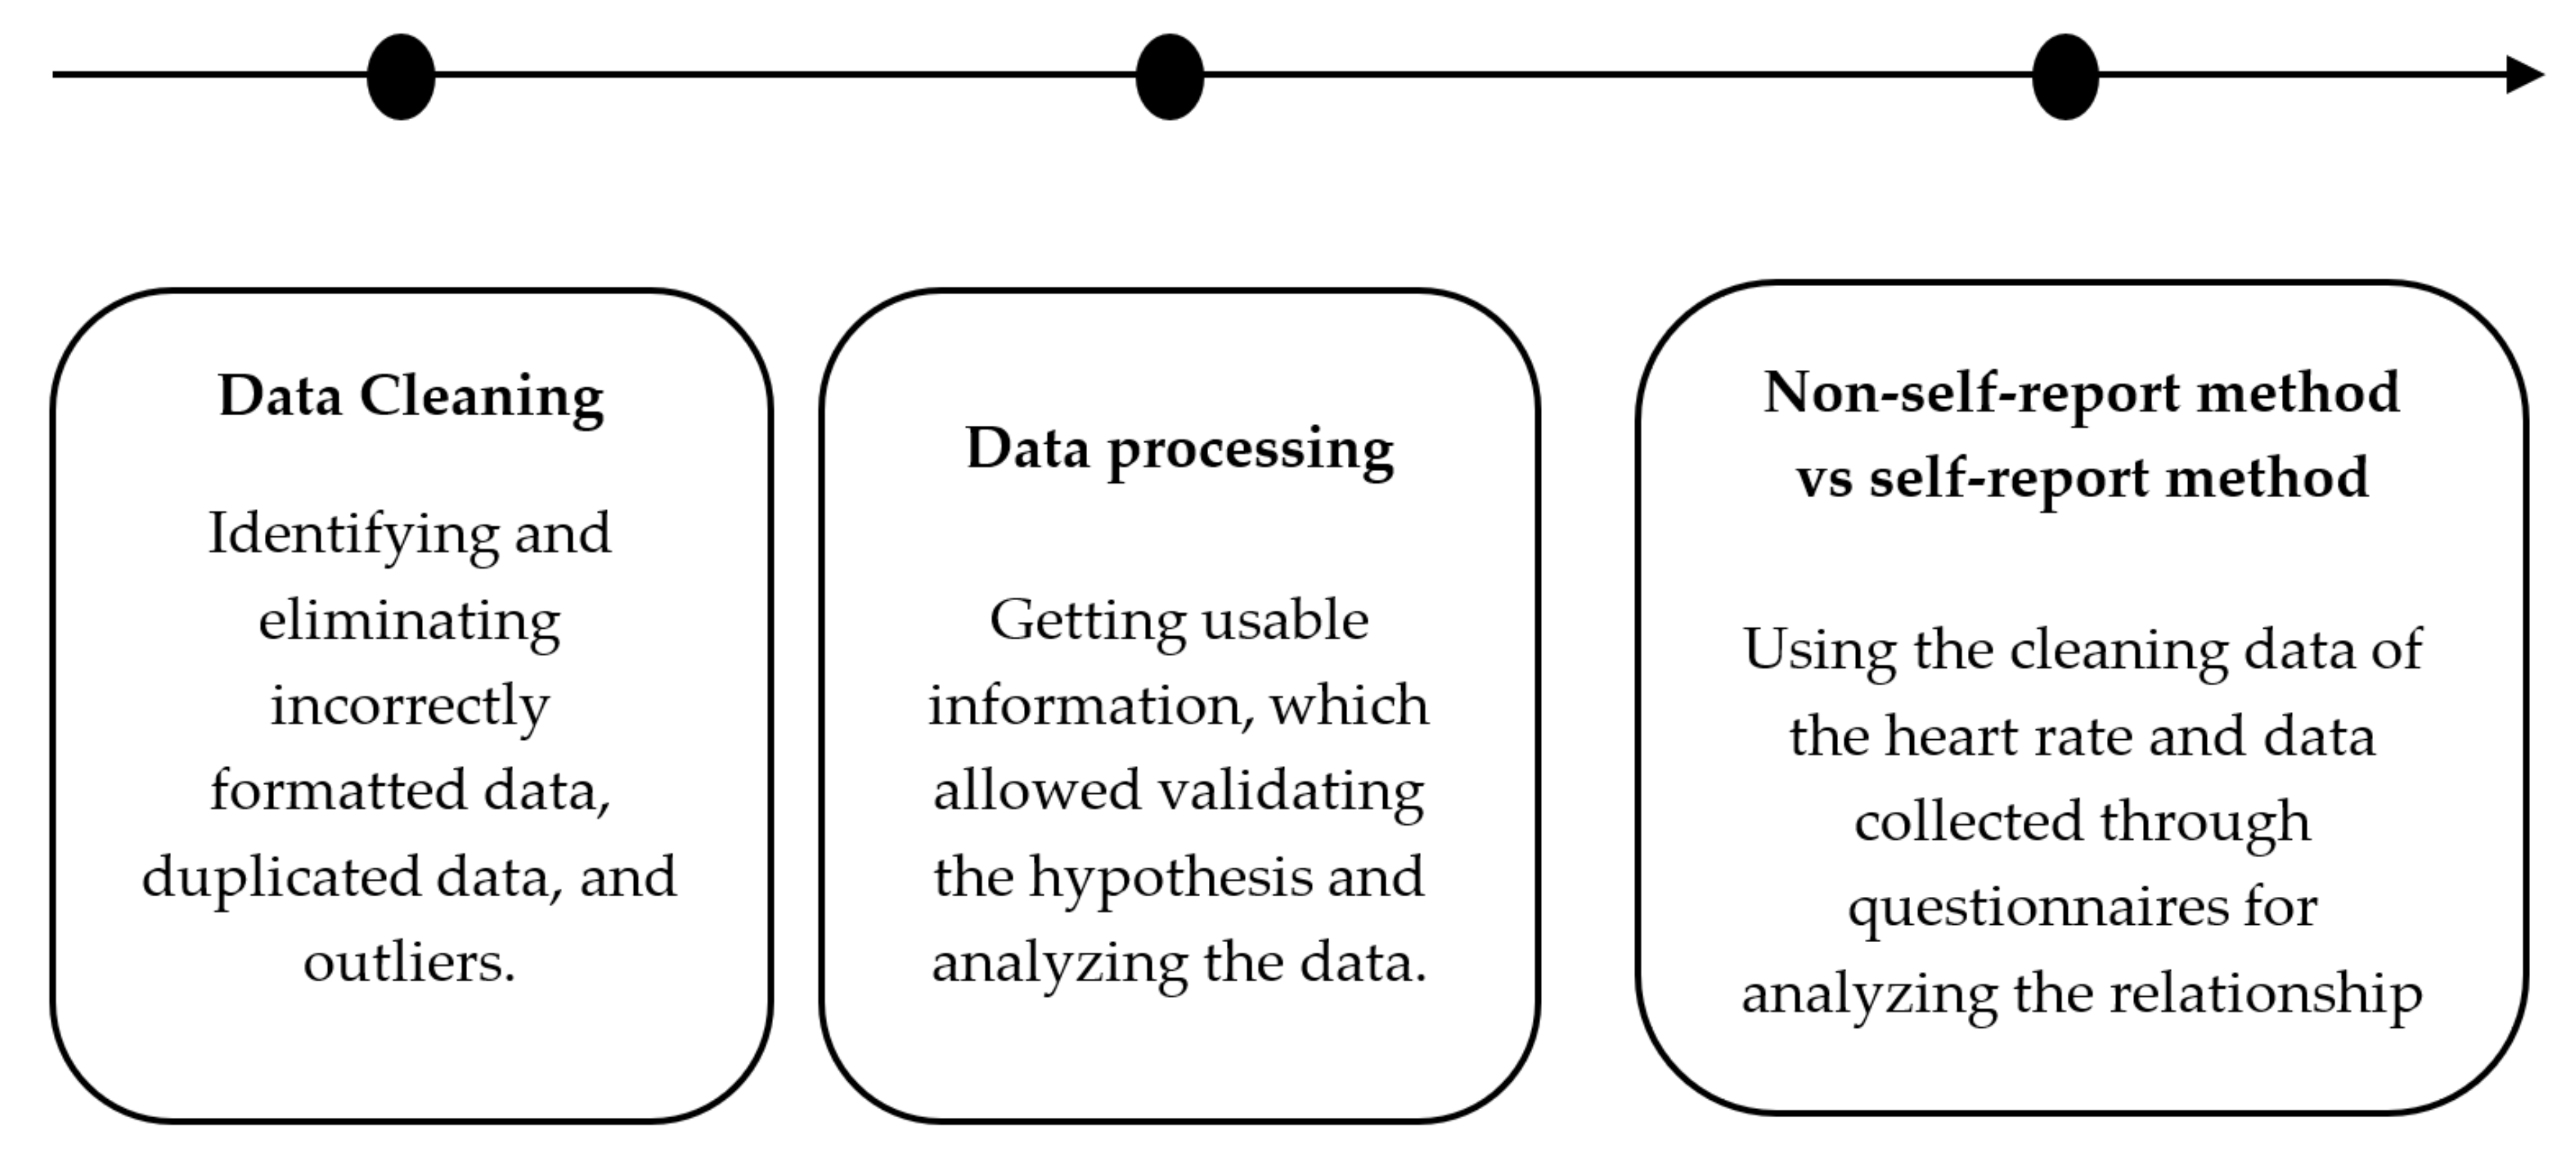
This phase included three activities that allowed us to perform the data treatment (Figure 3). The first consisted of cleaning data, the second entailed data processing, and the last compared the non-self-report method with the self-report method.
Below, we present the requirements considered in each activity.

3.3.1. Data Cleaning

First, we organized the data, classifying it into three categories: participants, lessons, and activities. The criteria used for cleaning the data were the following:
  • Transform the date and time data to a single format.
  • All participants must have data from at least three virtual lessons; otherwise, it is discarded.
  • We normalized the data and filtered those that were greater than three standard deviations (3SD). Then, we compared the total data with the resulting data after applying the criterion of 3SD and decided to delete data that removed less than 15% of the total data. We considered this criterion and percentage under the following categories: each participant in each lesson.
  • We cleaned the data that did not have modifications in numeral 3 (the normalization with 3SD). We analyzed each participant’s activity in each lesson and eliminated the atypical data.

3.3.2. Data Processing

Intending to have a general view of data, we applied a clustering of all data. After, we processed and organized the data to verify the following hypothesis:
Hypothesis 1.
The heart rate may increase during an active learning activity or rest and then return to the mean level.
Hypothesis 2.
The heart rate decreases from the beginning to the end of the lesson.
Hypothesis 3.
The drop in heart rate is biphasic, further decreasing during the early stages of the lesson.
Hypothesis 4.
The heart rate decreases at the beginning and increases at the end of the lesson.
Hypothesis 5.
The heart rate decreases in passive learning activities, such as watching a video.
For each hypothesis, we developed the following data processing:
For Hypothesis 1 we selected and labeled active learning activities in each lesson for each participant; we also labeled activities before and after each one, considering only those corresponding to theoretical explanation, beginning of a lesson, or end of a lesson. Subsequently, we plotted the mean heart rate before, after, and during each active learning activity using a data science platform.
For Hypothesis 2 for each participant in each lesson, we plotted the heart rate against time. We applied linear regression with the aim of identifying if the heart rate trend decreased or increased.
For Hypothesis 3 to analyze the biphasic behavior, we divided the data into two sections. We showed the first 20 min of each lesson against the next 70 min. We plotted the heart rate against time in each section; finally, we applied linear regression.
For Hypothesis 4 we selected the first and last minutes of each lesson, ranging between 2 to 10 min, to analyze the behavior at the beginning and end of each lesson. The time range is variable since each lesson started or finished the topic and activities at a different time. Then, we graphed each time range and applied linear regression to identify the behavior at the beginning and end of each lesson.
For Hypothesis 5 we performed the same processing of the first hypothesis, with the difference that at this phase, we selected and labeled the passive learning activities.

3.3.3. Non-Self-Report Method vs. Self-Report Method

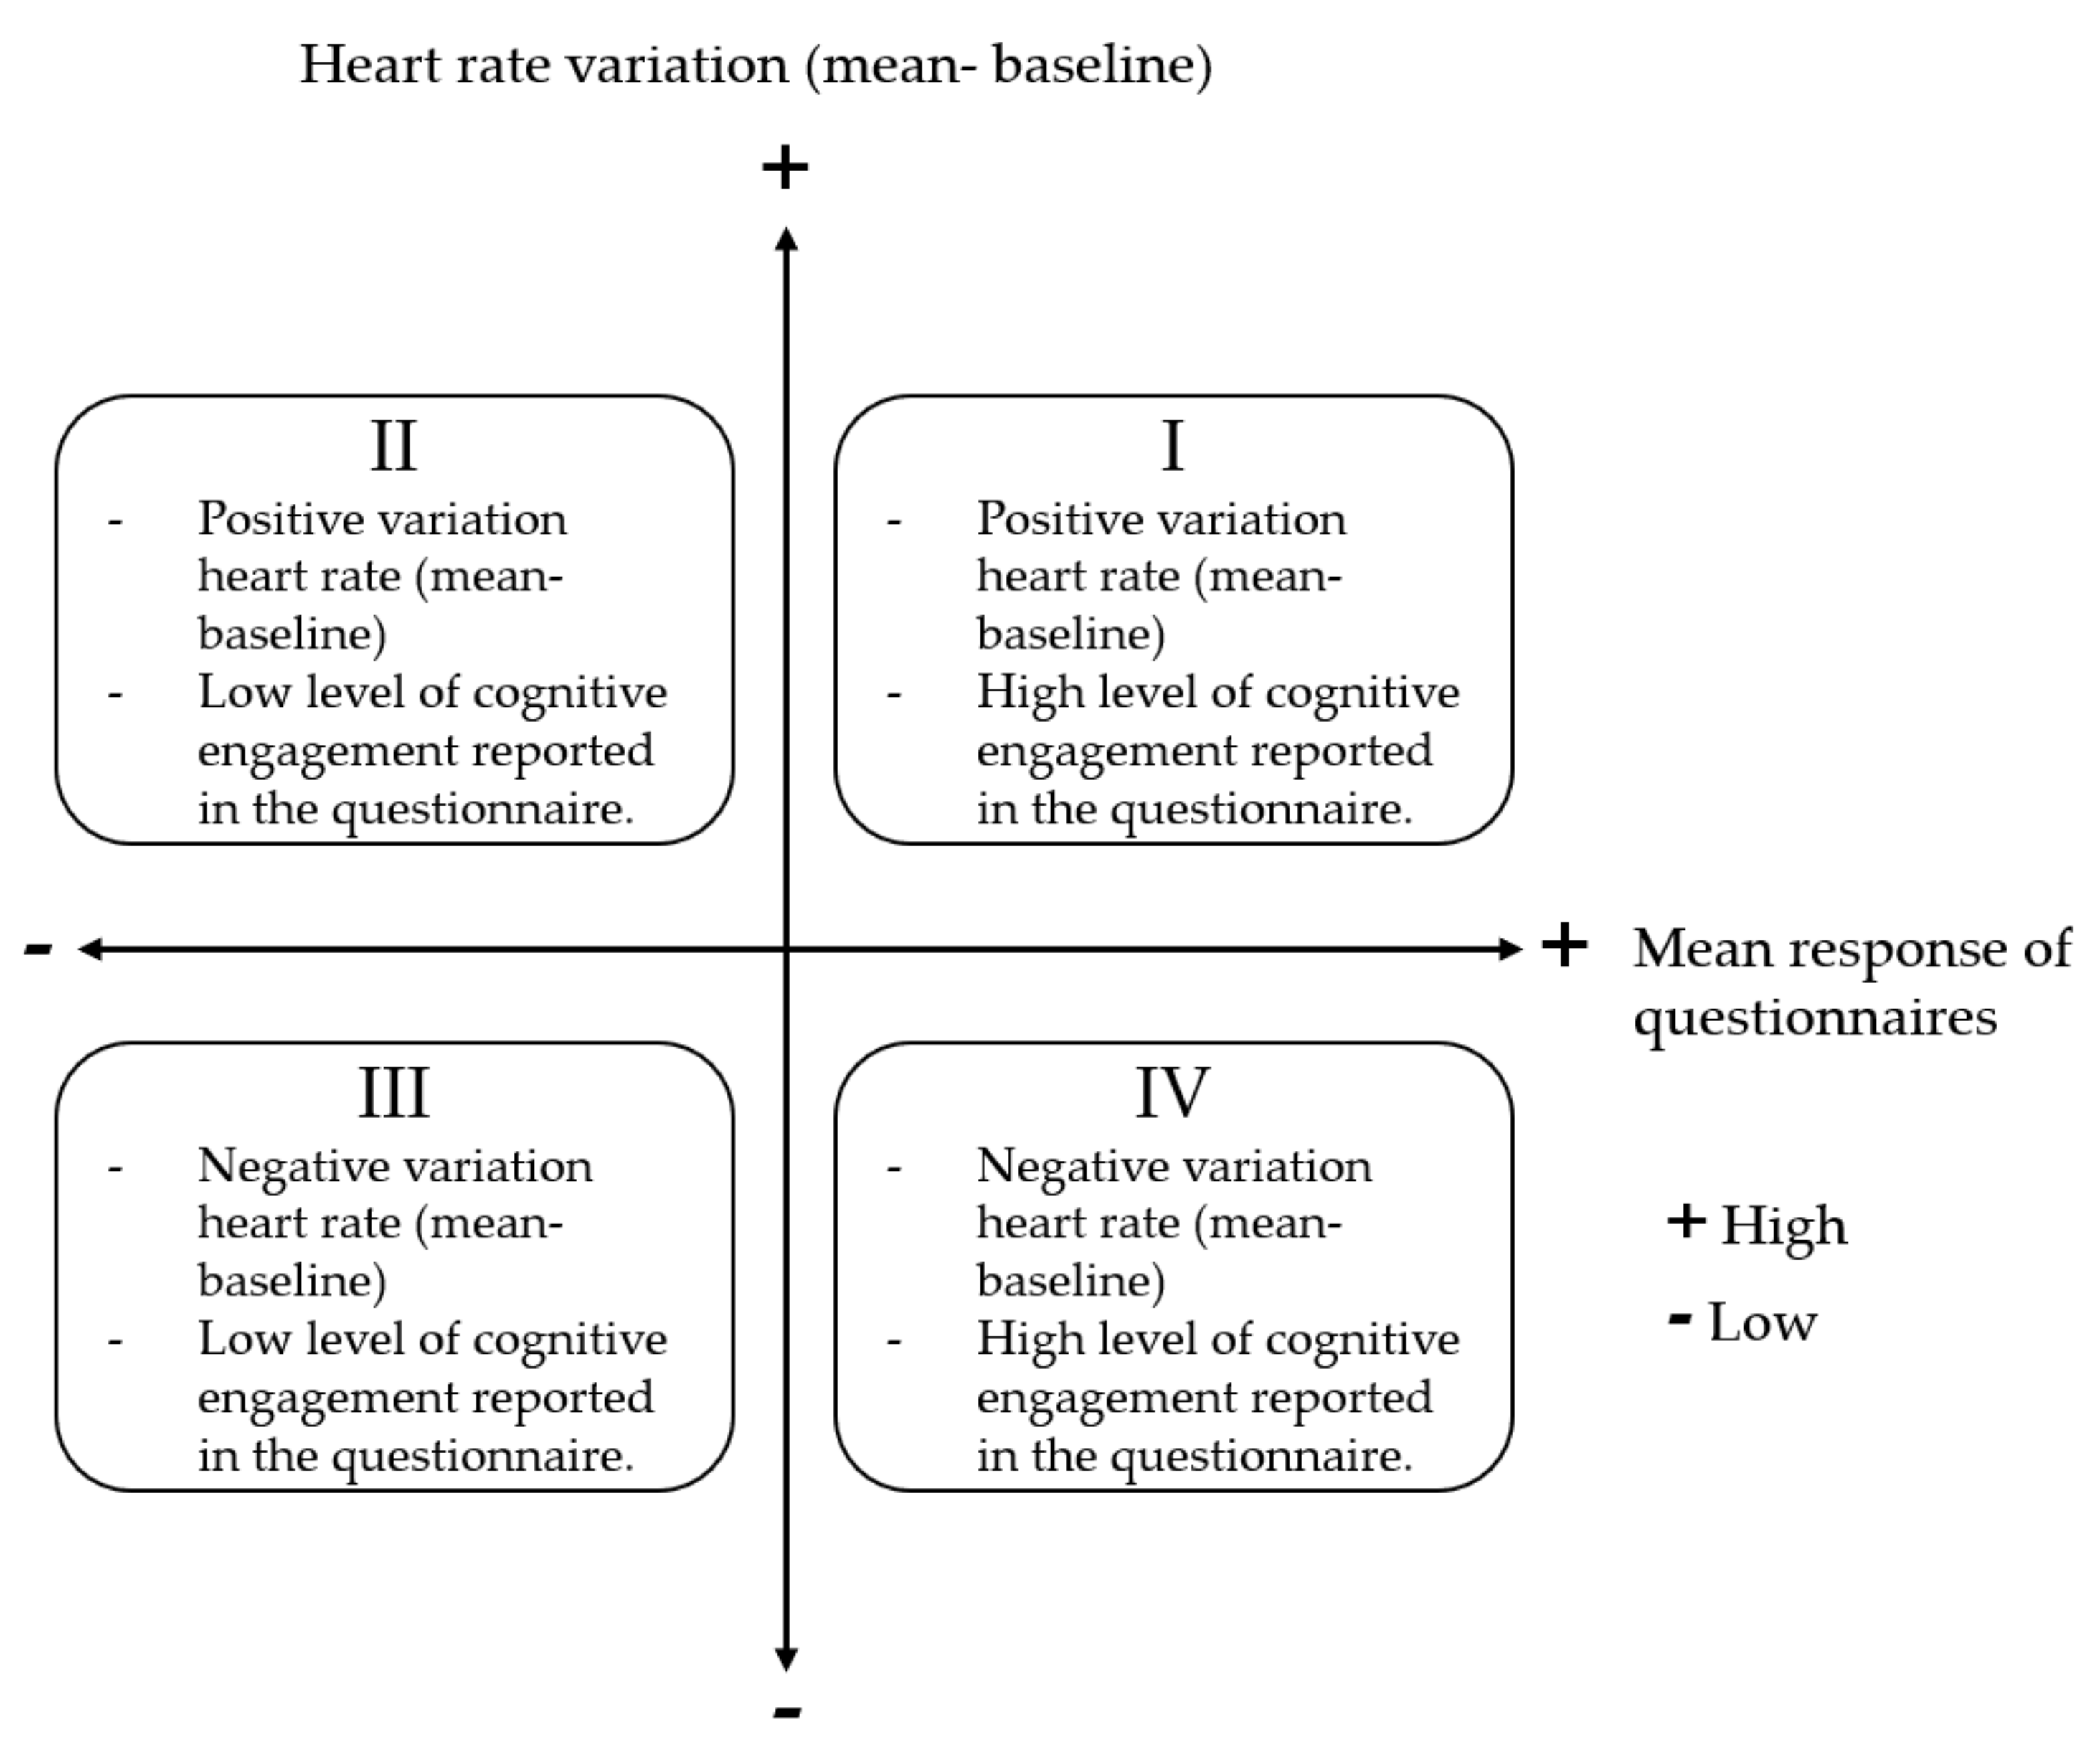
In the research developed by Nonis et al. the results suggested to combine two types of methods for measuring engagement, they proposed to combine the User Engagement Scale questionnaire with an additional physiological measurement (a facial expression recognition system) [56]. In this section, for analyzing the behavior of quantitative data of the heart rate (non-self-report method) against qualitative data of the questionnaire (self-report method), we performed a quadrant model to show the variation of these two data types (Figure 4).
For quantitative data, we calculated the mean heart rate for each participant and subtracted the heart rate baseline to identify whether there was a positive or negative variation. For the qualitative data of the questionnaire, we calculated the mean response to the questions of questionnaires filled out in each lesson; each question indicates a high or low level of student cognitive engagement, thus if the student’s mean response was below 3, it indicated a low engagement, and if it was above 3 it indicated a high cognitive engagement. Quadrant I represented a positive variation of the heart rate and a high level of cognitive engagement reported in the questionnaire by students, quadrant II indicated a positive variation of the heart rate and a low level of cognitive engagement reported in the questionnaire by students, quadrant III represented a negative variation of the heart rate and a low level of cognitive engagement reported in the questionnaire by students. Finally, quadrant IV indicated a negative variation of the heart rate and a high level of cognitive engagement reported in the questionnaire by students.

4. Analysis and Results

4.1. Phase 1. Research Preparation

Four groups of five students of the subject Human Talent Management participated in the research, led by two professors. The activities planned and developed in each lesson followed the method: Think Pair Share [54]. Also, other activities considered were online quizzes, group activities, activities in pairs and individual activities. The lessons were in remote teaching using a virtual platform for communication and online programs for the development of the activities.
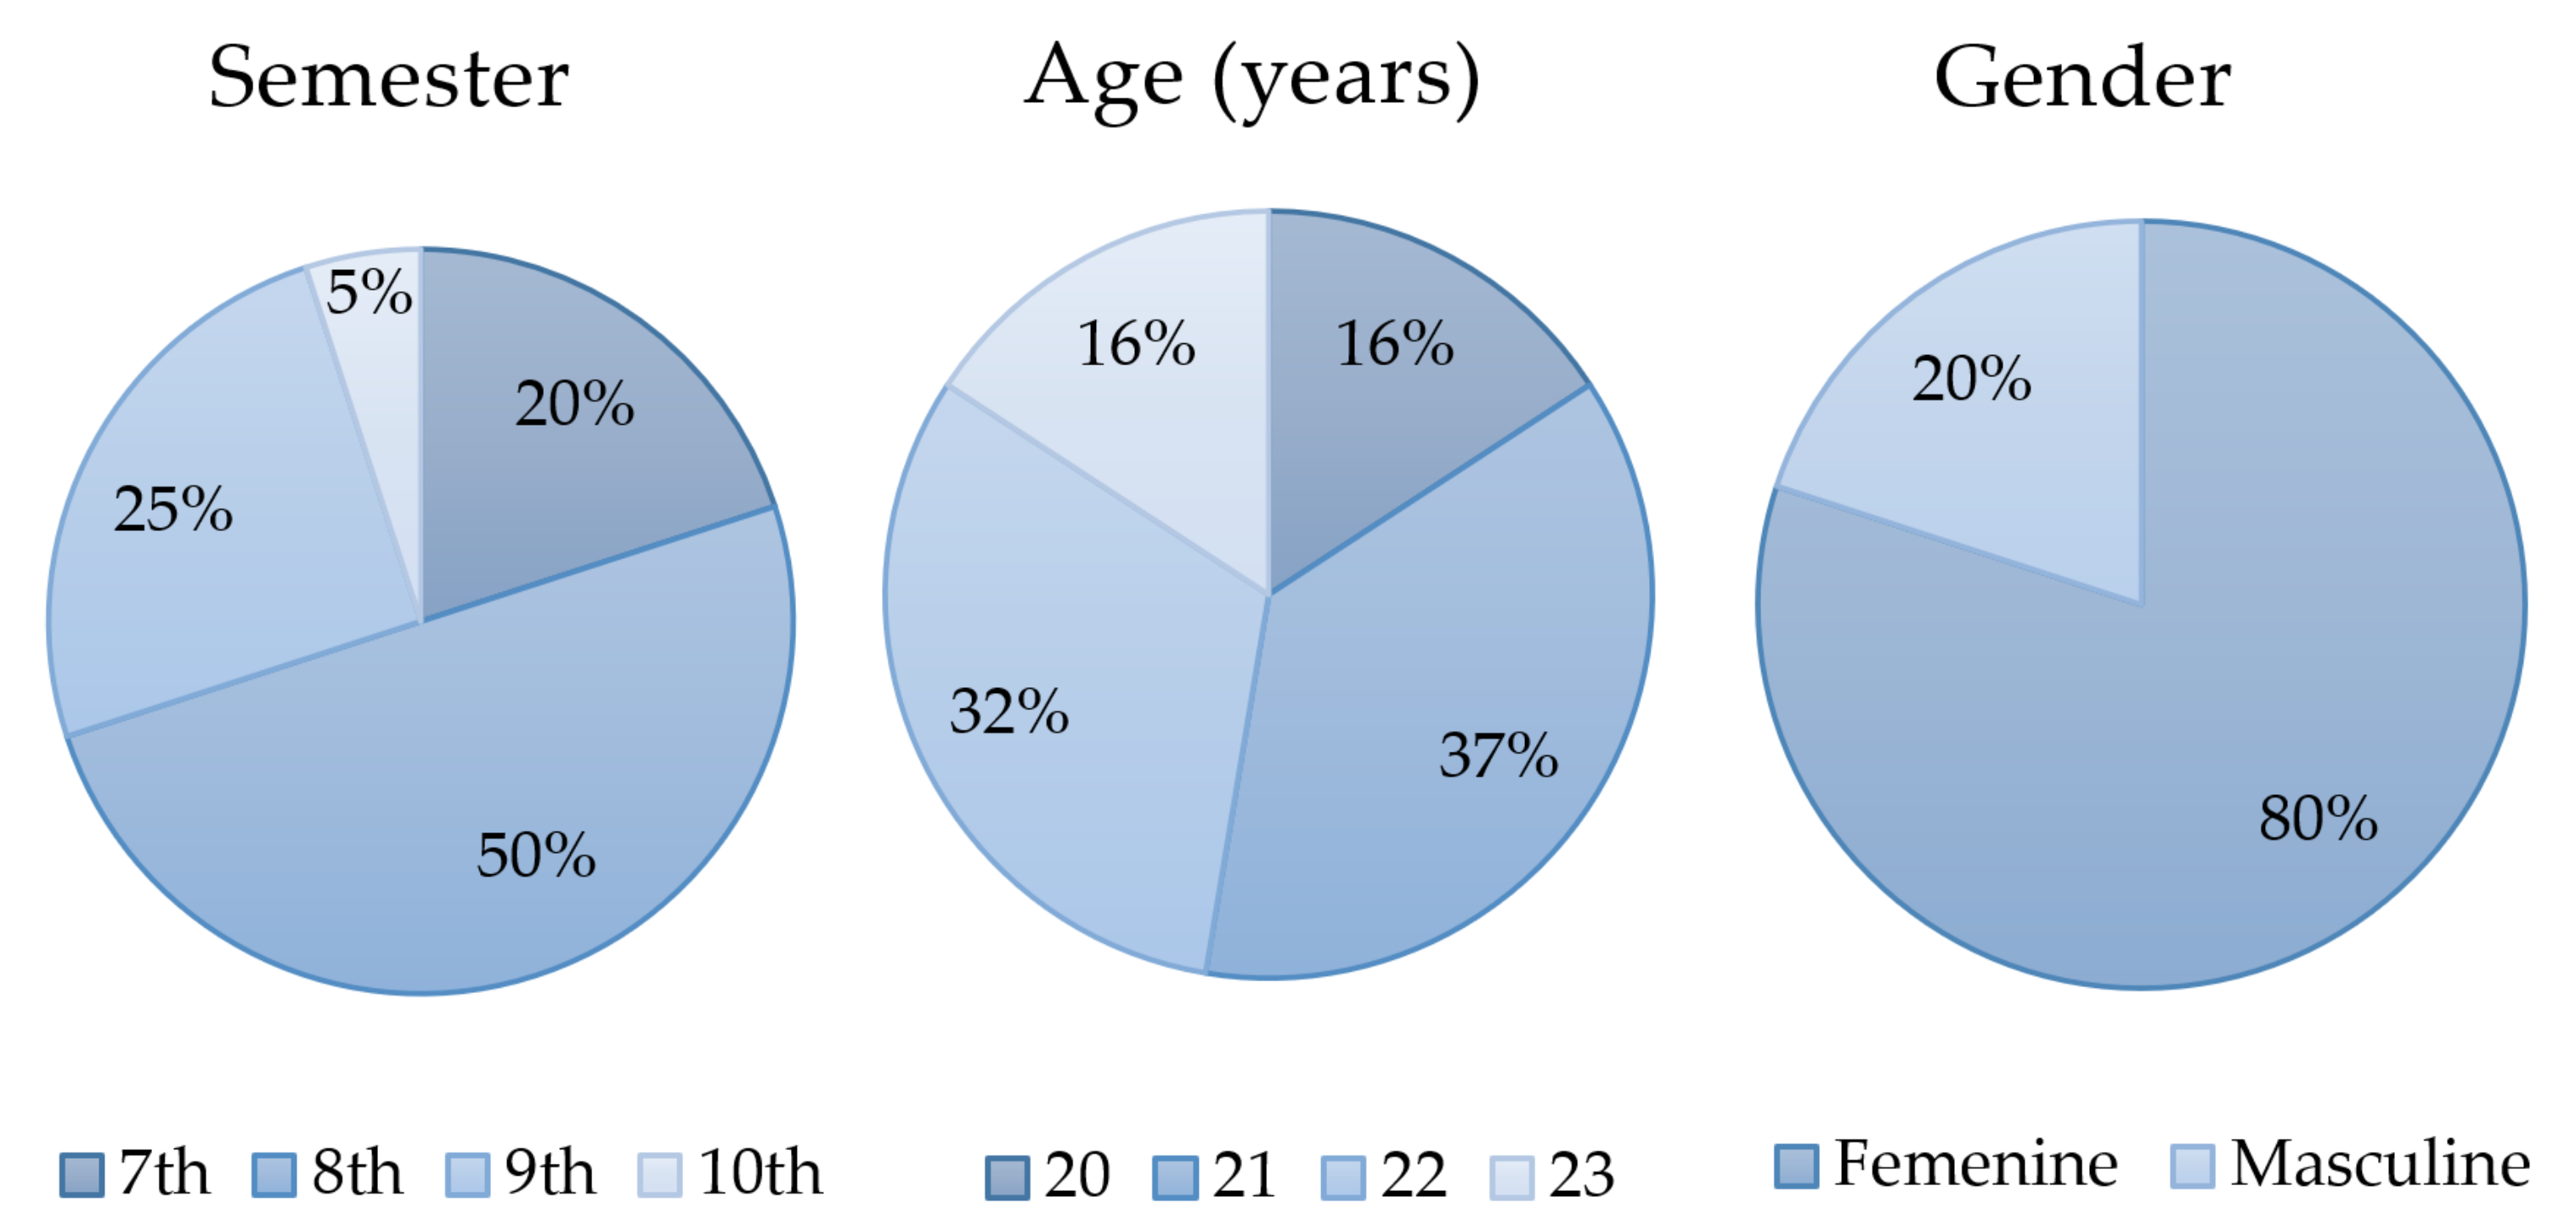
The 20 participants belong to the industrial engineering program; Figure 5 presents the characteristics associated with them:
The participants followed the instruction and conditions for the preparation of the heart rate band. Due to compatibility issues and connection issues, we discarded the data from participant 0 and 19.

4.2. Phase 2. Execution of the Research

Using the heart rate band, we measured the heart rate of each participant during the virtual lessons. We took note of different conditions that could alter the student’s heart rate and the moment in which the professor developed active learning activities. Also, we collected the baseline heart rate of each participant (Table 6). In this study, we used the baseline for identifying the heart rate response to activities developed in each lesson; the difference between the baseline and the heart rate could be negative or positive depending on the engagement of each participant. The behavior of the heart rate compared with the baseline is the response to a stimulus, according to the study of Siennicka et al. [33]. We do not show the baseline heart rate of four participants (participant 0, participant 9, participant 18, and participant 19) in Table 6, due to the reasons explained above. In the cleaning data section, we will explain the reason why participants 9 and 18 were also discarded.
On the other hand, we applied the questionnaire described in the methodology, we used a Likert scale to rate each item, as follows: (1) totally disagree, (2) in disagreement, (3) partially agree, (4) I agree, and (5) totally agree. In Table 6, also we show the mean according to the response given by participants in the questionnaire.

4.3. Phase 3. Data Treatment

4.3.1. Data Cleaning

Applying the criteria described in the methodology, we transformed the data into the same time format requested by the data science platform; we used this tool to perform some steps of data cleaning and data processing. We discarded two participants because they had data from fewer than three lessons (participant 9 and participant 18). Then, we applied the normalization criterion to the participants and lessons shown in Table 7. Finally, we analyzed the behavior of each participant in each activity and eliminated the outliers.

4.3.2. Data Processing

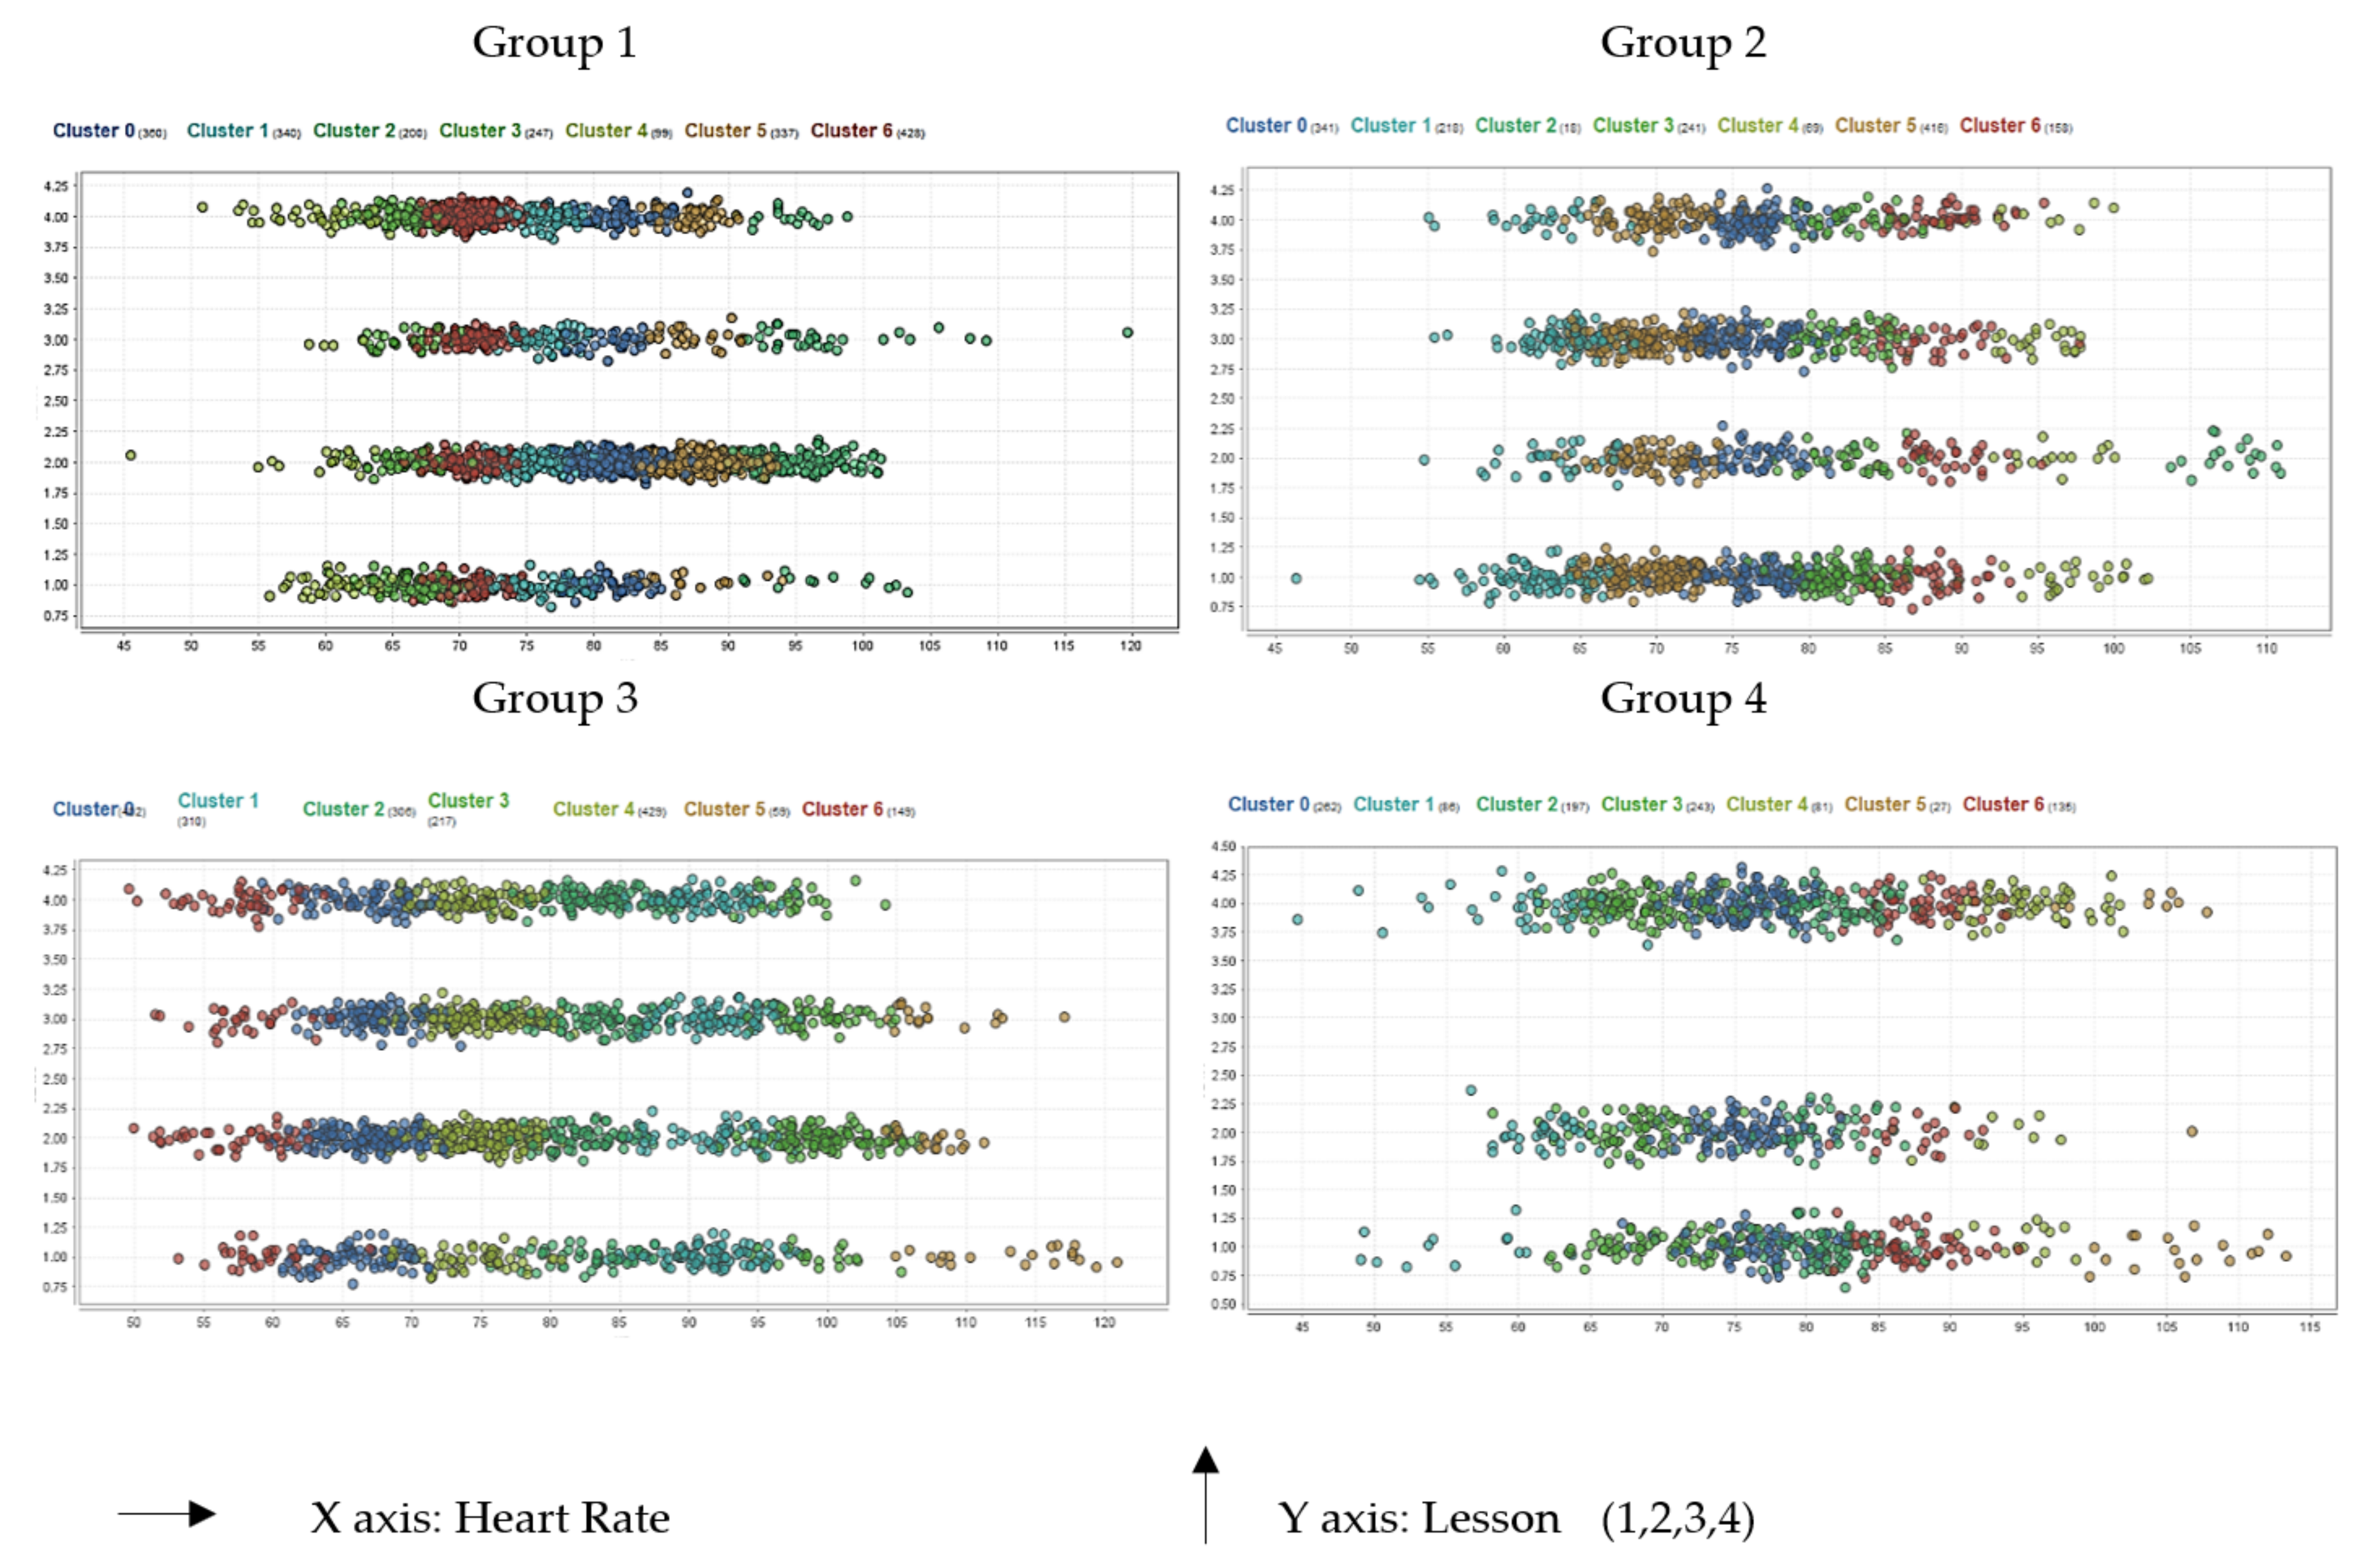
Before analyzing each hypothesis, we clustered all the data dividing each group to identify the general and predominant behavior of the heart rate. First, we applied the elbow method. We obtained that, in all groups, the best value of K was seven, and then we proceed to the data clustering.
Table 8 shows the cluster for each group, the number of items classified in each cluster, and the centroid based on the heart rate. We presented the table organized in descending order according to the centroid, and we highlight the two clusters with the most items.
The clusters highlighted indicate the predominant behavior of the heart rate in each group, varying from between 66 and 77, except for Group 1, which is between 70 and 82. This behavior shows that the predominant data was not in the extremes, which contained the minority of items.
Figure 6 presents the distribution of items in each cluster in the four groups graphically. In each graph, the behavior of each cluster is similar in each lesson. Although each participant had a different baseline, it did not alter the classification in the clustering. For this reason, we were able to perform a general analysis of data. We conducted an ANOVA test afterwards; for better data treatment, we conducted additional analysis by categorizing the heart rate according to participants, lessons, and activities.
For each hypothesis, after applying the data processing we obtained the following results:
  • Hypothesis 1.
After selecting and labeling the mean heart rate (MHR) of each active learning activity with its activities before and after, we obtained four behaviors, which described the mean heart rate before, during, and after an active learning activity. We show an example of each behavior in Figure 7.
  • Behavior one (low MHR-high MHR-low MHR): The behavior of the mean heart rate before and after the active learning activity is lower than the behavior during this activity. This behavior coincides with H1.
  • Behavior two (high MHR-low MHR-high MHR): The behavior of the mean heart rate before and after the active learning activity is higher than the behavior during this activity. This behavior is contrary to H1.
  • Behavior three (low MHR-high MHR-high MHR): The behavior of the mean heart rate before the active learning activity is lower than the behavior during this activity, while the behavior of the mean heart rate after this activity is higher than the active learning activity. This behavior presents an increase during an active learning activity as described by H1, but then, after the MHR, it continues to increase.
  • Behavior four (high MHR-low MHR-low MHR): The behavior of the mean heart rate before the active learning activity is higher in comparison with the behavior during this activity, while the behavior of the mean heart rate after this activity is lower than the active learning activity. This behavior does not correspond with H1.
For this analysis, we examined 58 active learning activities; Table 9 presents the results obtained in each behavior. It is important to note that the activities that we considered before an active learning activity were theoretical explanation, the beginning of a lesson, or instruction given by the professor. If the activity is theoretical explanation, the student could be in a rest state; thus, the heart rate may be lower than an active learning activity. On the other hand, if the activity is the beginning of a lesson, the heart rate may vary due to external factors depending on the activity that each student was doing before starting the lesson. Finally, if the previous activity is the instruction given by a professor, the student can be attentive without doing any activity that involves deep learning. These three activities have in common that they are not active or passive learning activities; for this reason, they can be grouped for the analysis of H1.
It is important to note that the activities that we considered before an active learning activity was either theoretical explanation, the beginning of a lesson, or an instruction given by the professor. If the activity is theoretical explanation, the student could be in a rest state; thus, the heart rate may be lower than an active learning activity. On the other hand, if the activity is the beginning of a lesson, the heart rate may vary due to external factors depending on the activity that each student was doing before starting the lesson. Finally, if the previous activity is an instruction given by a professor, the student can be attentive without doing any activity that involves deep learning. These three activities have in common that they are not active or passive learning activities; for this reason, they can be grouped for the analysis of H1.
Behavior one (low MHR - high MHR- low MHR) coincides with H1. As shown in Table 9, 41.4% of the activities presented this behavior, which has the highest percentage compared to the other behaviors. On the other hand, behavior two (High MHR-low MHR-high MHR) represents the contrary situation to H1. The main reason why this situation could happen was the activity: interaction between students and professor, which could generate an immersive state in the students, causing a decrease in the heart rate.
Behavior three (low MHR - high MHR - high MHR) is not common and it is consistent with the results of the study of Darnell D.K. and Krieg P.A., who stated that after an active learning activity the heart rate did not continue to increase but returned to the behavior it had before this activity [7]. Finally, behavior four (high MHR - low MHR - low MHR) represents a resting, due to the heart rate decreased during an active learning activity. This result indicates that the participant did not need to make a significant cognitive effort because of previous knowledge and clarity regarding the discussed topic.
Since MHR behavior during an active learning activity is the most relevant factor in this study, we applied an ANOVA (Table 10) with p < 0.05 between two variables: the baseline heart rate and the mean heart rate during active learning activities. If the value F is greater than the critical value for F, it implies that the means of the two variables are significantly different.
Except for the quiz, all active learning activities had statistically significant differences in heart rate when participants developed these activities compared to each participant’s baseline. The case of the quiz had a particularity, a set time was given to finish it, but some participants could finish earlier, so they could carry out other activities in the remaining time, such as taking a break; this condition could be the main reason why in the ANOVA this activity was not statistically significant.
Overall, we partially accept H1 adapting the initial approach to the following: the mean heart rate has a significant variation with an active learning activity, indicating cognitive engagement in the student experiment. This approach is also supported by the statement made by Mayson and Oleksy, “heart rate is useful in the detection of cognitive attention because it changes when cognitive attention is directed to a particular situation” [57].
  • Hypothesis 2.
For this hypothesis, we graphically represented the heart rate values of each virtual lesson and applied a linear regression. In each graph it was possible to identify if the heart rate trend (HRT) increased or decreased during each lesson (Figure 8). We were able to identify two behaviors:
  • Behaviour one (HRT decreased): The heart rate decreased from the beginning to the end of the lesson. It corresponds with H2.
  • Behaviour two (HRT increased): The heart rate increased from the beginning to the end of the lesson. It is contrary to H2.
In total, we evaluated 15 lessons; Table 11 shows the summary of each behavior.
The expected trend of the heart rate was not evident in all lessons; although in the study of Darnell D. K. and Krieg P. A., the authors found a decreasing trend among all the lecture lessons analyzed [7], the results we obtained in virtual lessons suggest that the trend in heart rate from the beginning to the end of the lesson may depend on external or internal factors. The external factors are related to connectivity problems or the environment in which the participant takes the lesson; the internal factors are related to the moment in which the students develop active learning activities and their duration, either at the beginning, in the middle or the end of the class. For these results, we partially accept H2 with the following adaptation: the trend of the heart rate from the beginning to the end of the lesson depends on external and internal factors, the internal factors are linked with the active learning activities, mainly the duration and the moment in the lesson that the professor develops them.
  • Hypothesis 3.
For this hypothesis, we selected the virtual lessons that presented a decrease in the heart rate trend according to H2; after that, we divided the data into two sections—the first 20 min of each lesson against the next 70 min. Figure 9 shows an example of a lesson divided into two sections with its linear regression.
A negative slope means a decrease in the heart rate trend, in the Table 12 we show the slope of each section of the lessons analyzed and its correspondence with H3; for the correspondence, we evaluated if the first and last section had a negative heart rate trend and if the slope in the first section was minor to the slope in the last section, which indicated a further decrease during the early stages of the lesson.
We show the summary of correspondence with H3 of the 15 lessons in Table 13, which displays the nine lessons analyzed in Table 12 and the six lessons that had an increase in H2 and which do not correspond with H3 (Table 11). H3 has a strong dependency on H2 since it requires a drop in heart rate throughout the lesson, a condition that was not met in all lessons; for this reason, we included the six lessons for the analysis in the correspondence with H3 (Table 11). Since 73% of the lesson did not show the behavior expected, we reject H3.
  • Hypothesis 4.
We present the behavior that occurred at the beginning and end of each virtual lesson in Table 14. We also show the correspondence with H4.
The heart rate decreased at the beginning and increased at the end in 20% of lessons; for that reason, we reject H4.
We analyzed each heart rate behavior presented at the beginning and the end of the lessons (Table 15). The percentage for each behavior is similar between them, so it is possible to conclude that there is no standard pattern. In another study, the researchers verified a standard heart rate behavior during various lessons. However, they evaluated it during lecture classes and the students were physically present [7]. In our study, the lessons were virtual, with different factors that could influence the heart rate of the participants, like connection problems, and the influence of external factors according to the place where they take the lessons that could affect their level of attention, etc.
  • Hypothesis 5.
In this hypothesis, we applied a process similar to H1, considering the activities before, during, and after passive learning activities, in this case, a video projection. We obtained four behaviors, which described the mean heart rate (MHR) before, during, and after a passive learning activity.
  • Behavior one (high MHR-low MHR-high MHR): the behavior of the mean heart rate before and after the passive learning activity is higher than the behavior during this activity. It corresponds with H5.
  • Behavior two (high MHR-low MHR-low MHR): the behavior of the mean heart rate before the passive learning activity is higher in comparison with the behavior during this activity, while the behavior of the mean heart rate after this activity is lower than the passive learning activity. It corresponds with H5.
  • Behavior three (low MHR-high MHR-high MHR): the behavior of the mean heart rate before the passive learning activity is lower compared to the behavior during this activity, while the behavior of the mean heart rate after this activity is higher than that of this the passive learning activity. It is contrary to H5.
  • Behavior four (low MHR-high MHR-low MHR): the behavior of the mean heart rate before and after the passive learning activity is lower compared to the behavior during this activity. It is contrary to H5.
However, this hypothesis focuses on the behavior before and during a passive learning activity since that the first two behaviors represent a decrease and the last two an increase in heart rate during a passive learning activity. Table 16 presents a summary of the combination of these behaviors and their percentage.
The increased in the heart rate could occur because, before each video, professors instructed their students to pay attention and to make an activity after the video projection, which could prevent students from entering a resting state during the video projection. These results allow us to rebuild H5 with this approach: if students are previously advised that they will have to develop an activity after a passive learning activity (such as a video projection), their heart rate could increase and, consequently, so could their cognitive engagement. Overall, we partially accept H5 with the exposed approach.
We present a summary of the results of each hypothesis in Table 17.

4.3.3. Non-Self-Report Method vs. Self-Report Method

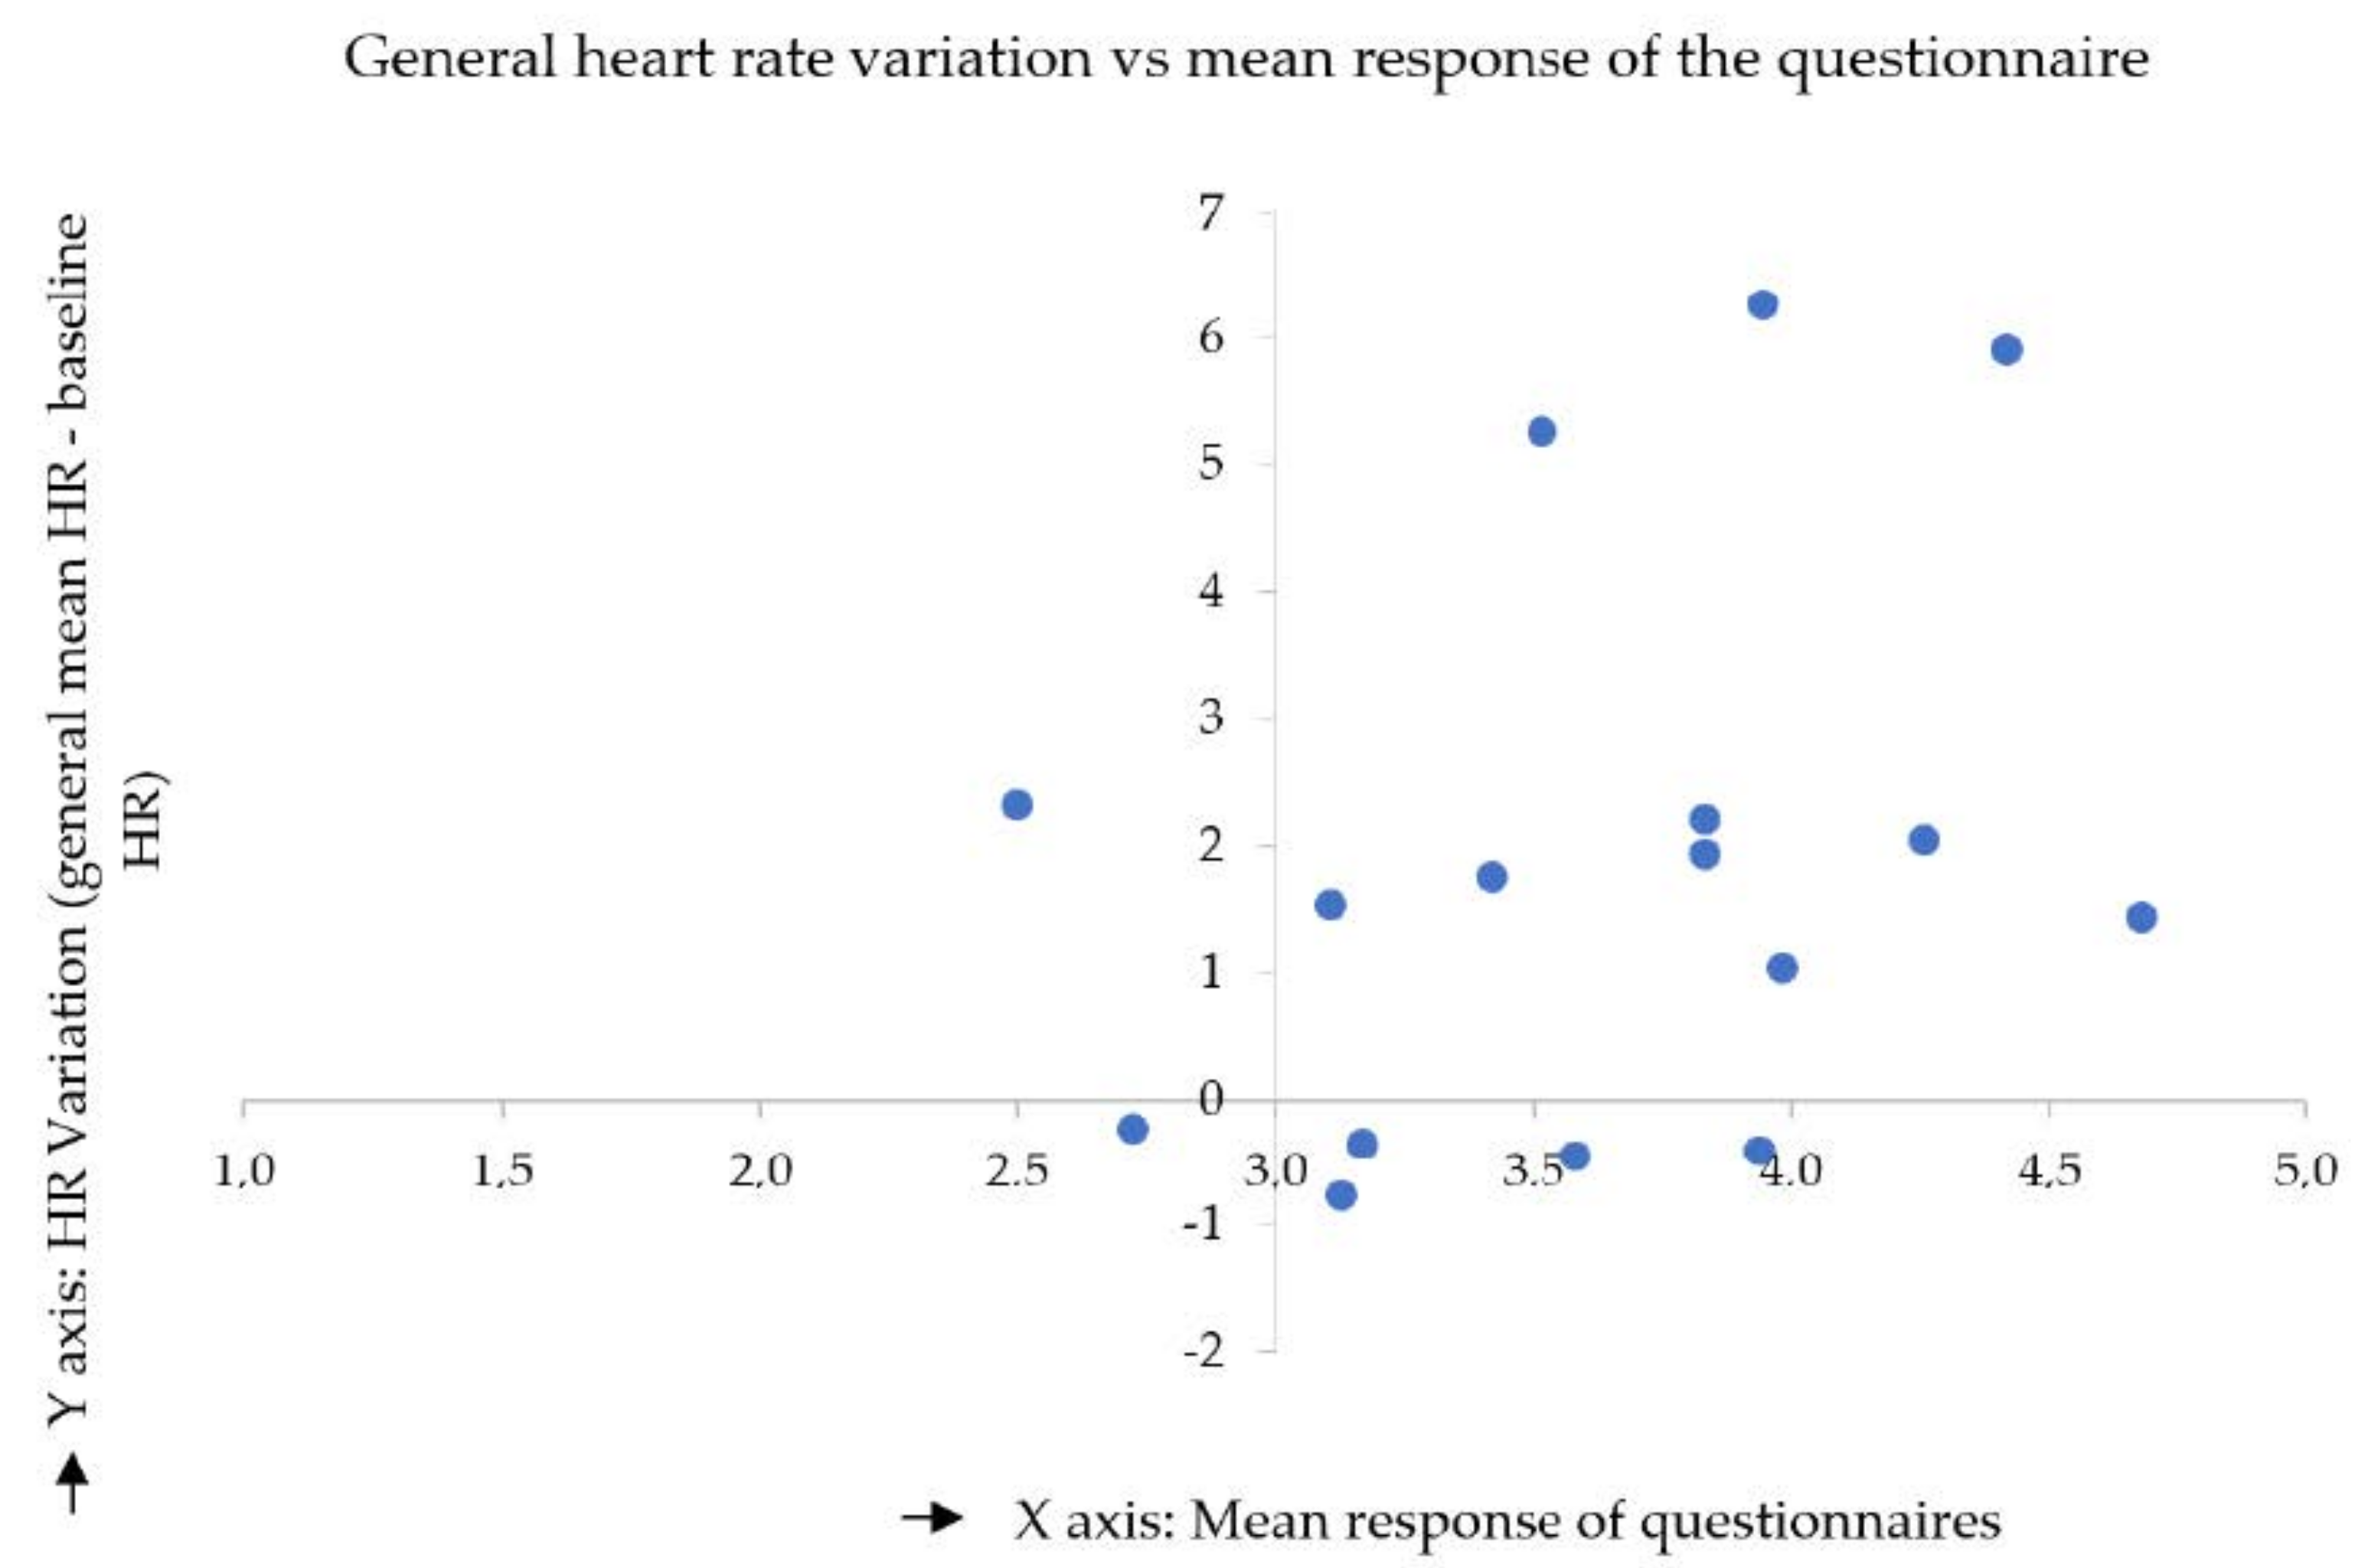
In this section, we constructed a quadrant model for relating the non-self-report method with the self-reported method. We analyzed two scenarios, the first related the mean responses of the questionnaire with the general heart rate variation (HRV). In this last variable, we took the data for the heart rate during whole lessons, that is, all activities. In the second scenario, we analyzed the same relationship of variables but in the second variable, we only considered the HRV of active learning activities (ALA).
  • First scenario: General heart rate variation vs. mean response of the questionnaire
In this analysis we evaluated the 16 participants classifying them in the four quadrants (Figure 10). Ten were in the quadrant I, one in the quadrant II, one in the quadrant III, and four in the quadrant IV.
The classification of the 10 participants in the quadrant I indicates that they had a positive HRV, that is, an increase in the general mean heart rate (MHR) concerning the baseline. These students also reported a high cognitive engagement in questionnaires. This quadrant is the best scenery in this study because it proved that a positive HRV is related to a high engagement.
One participant was in the quadrant II; she/he had a positive HRV but reported a low level of engagement in the questionnaire. This result indicates that the student did not feel a high cognitive engagement during the whole lesson, but he could have moments or activities that caught their attention, increasing their heart rate. If a participant was in quadrant III, she/he had a negative HRV, and in the same way, the student reported a low level of engagement in the questionnaire.
Finally, four participants were in the quadrant IV; they reported a high engagement in the questionnaire. However, the general MHR decreased with respect to the baseline, a circumstance that may indicate that students were in an immersive state and not necessarily a low level of attention or a low level of cognitive engagement; this affirmation coincides with the results of the study made by Ronney et al., who analyzed the behavior of the participant’s heart rate while watching a film; the results demonstrated that a drop in the heart rate might suggest an immersive environment followed by an increase in the attention paid to the film [58].
  • Second scenario: Heart rate variation of active learning activities vs. mean response of the questionnaire
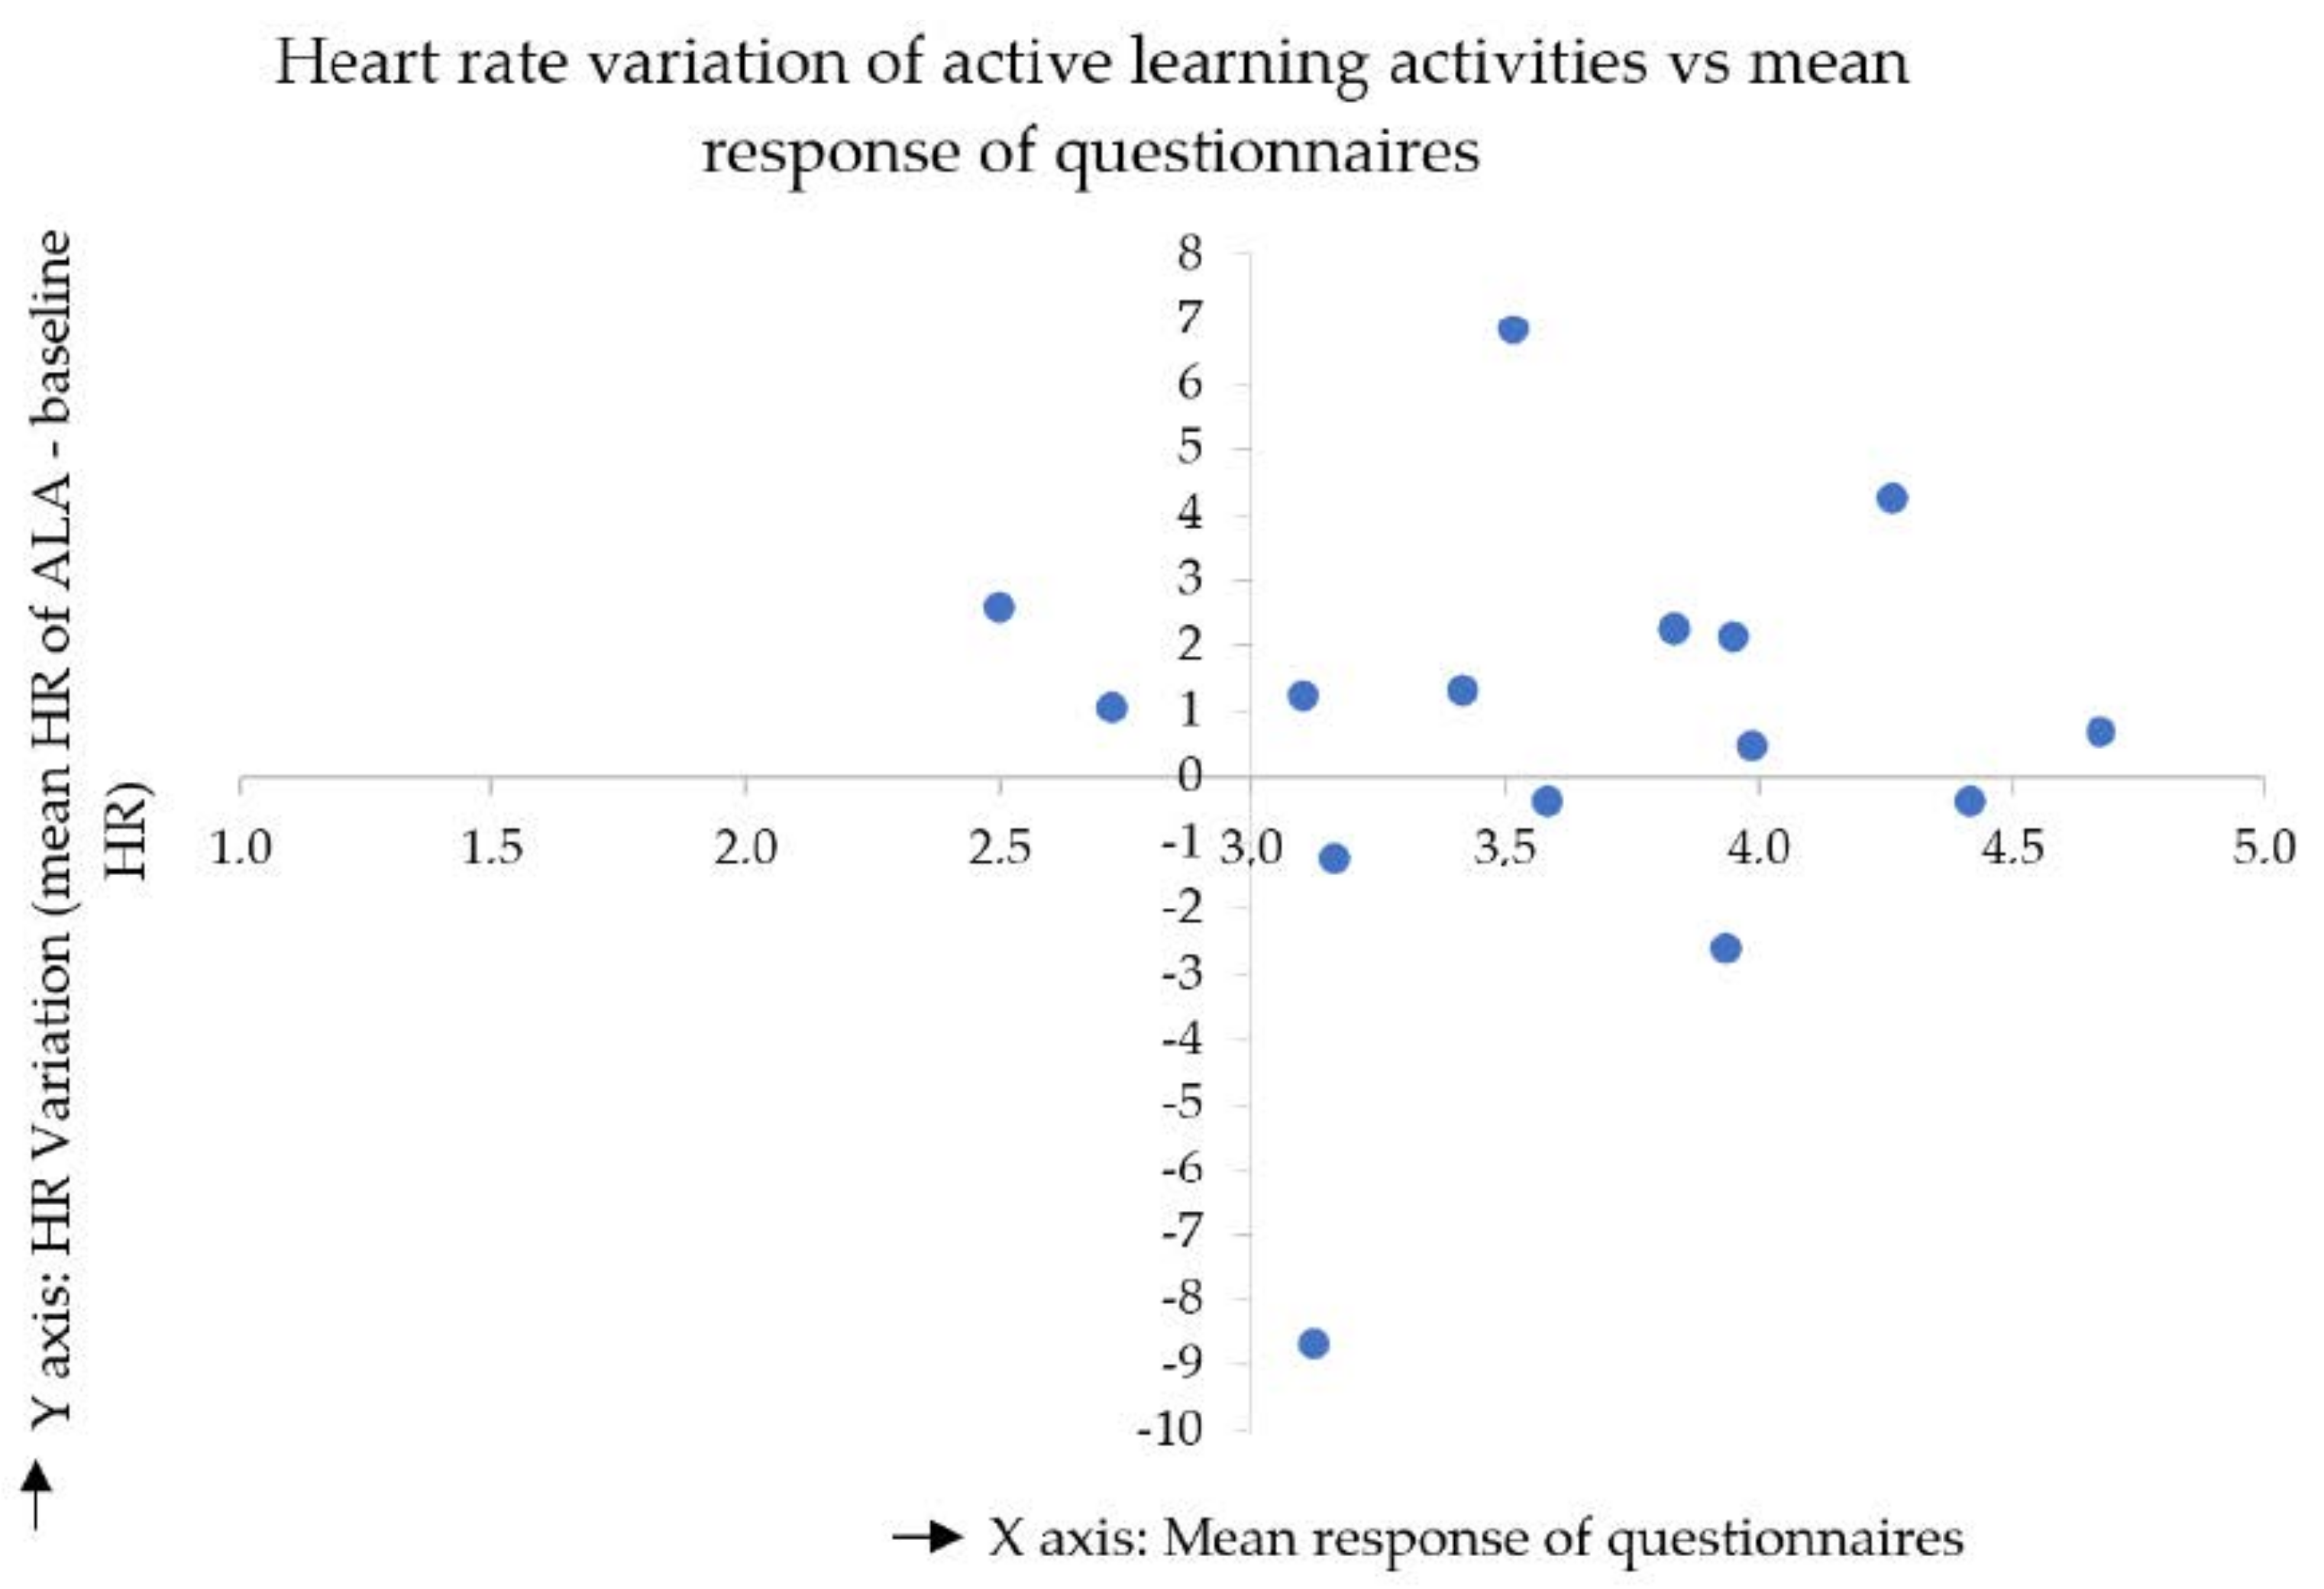
In the same way as in the first scenario, we evaluated the 16 participants with the difference that here we related the HRV during active learning activities (ALA) and the mean responses in the questionnaire (Figure 11).
Nine participants were in quadrant I, seven of them presented a positive HRV below three points when an ALA was developed. This behavior is similar to the first scenario, which indicates that ALA had a great influence on the behavior of a whole lesson. The quadrant I represents that participants were making a mental effort for acquiring a high level of attention, a circumstance that resulted in a positive variation of the heart rate. The other two participants had a positive HRV greater than three points. This quadrant represents the best scenario; with these results, we can affirm that a positive HRV is linked to a high cognitive engagement.
Two participants were in the quadrant II, unlike the first scenario where we found one participant in quadrant II and the other participant in quadrant III. This behavior indicates that, although the participant in quadrant III reported a low cognitive engagement in the questionnaire, the ALA developed by the professor caught her/his attention, which meant an increase in the HRV and caused her/him to be in the quadrant II in the second scenario.
Five participants were in the quadrant IV. As we explained, this quadrant represents an immersive state of the participants. The participant who was in the quadrant I in the first scenario is now in the quadrant IV in the second scenario. This change means that she/he was in an immersive state when the professor carried out ALA. On the other hand, one of the participants had a significant negative HRV, below eight points, which indicates that her/his concentration was higher during ALA.
Overall, with the analysis performed and illustrated in the first and second scenario, the study shows that although there were heart rate variations (causing location changes for some participants inside the quadrant), the number of subjects for each quadrant is similar. This condition allows us to suggest that ALA developed by professors determinea the behavior of the MHR throughout the whole lessons.
Using the quadrant analysis it was possible to ascertain that combining a non-self-report method (heart rate) with a self-report method (questionnaire) is advantageous for measuring cognitive student engagement, since the comparison of the heart rate against the report given by each participant provides more information about the influence of ALA on the heart rate.

5. Discussion

In this study, we conducted exploratory research implementing a non-self-report method to measure the cognitive student engagement, with a physiological characteristic, the heart rate. We have measured and analyzed this variable, using a heart rate band, in 16 participants from the Industrial Engineering program, in a Colombian University located in Bogota. With the collected data, we evaluated five hypotheses. Below, we will present and discuss the results of each hypothesis.
  • Hypothesis 1.
To analyze H1, we evaluated the behavior of the heart rate before, during, and after an active learning activity (ALA); we found that 41.4% of data correspond with H1. Since ALA was an important matter in this study, we applied an ANOVA test to evaluate the heart rate during an ALA against each participant’s baseline, an analysis that demonstrated a statistically significant difference between these variables. We partially accepted H1 adapting the approach to the following: the mean heart rate has a significant variation with an active learning activity, indicating students experiment with cognitive engagement.
In comparison with similar activities developed in a face-to-face environment, the heart rate had a variation if the student was exposed to active learning activities; however, in the study performed by Darnell et al. [7], the heart rate had a significant uptick, while in our study, in virtual lessons, the heart rate had a significant variation that could be positive or negative. With this perspective, we could deduce that one of the main factors that affect the student engagement is the environment and not the activity that is developed. For that reason, we conclude that it is valuable to design activities that consider the learning environment to capture the student’s attention and improve her/his knowledge.
  • Hypothesis 2.
We evaluated H2 with the heart rate trend; if it was negative indicated a decrease and if it was positive indicated an increase in the heart rate from the beginning to the end of the lesson. From a total of 15 lessons, 60% presented the behavior expected by H2. For these results we partially accept H2 with the following adaptation: the trend of the heart rate from the beginning to the end of the lesson depends on external and internal factors, the internal factors are linked with the active learning activities, especially the duration and the moment in the lesson that the professor develops them.
In the study of Darnell et al. [7], the heart rate had a decreasing trend in the morning lessons; they found that this behavior was caused mainly by external factors as mental fatigue, and the accumulation of multiple classes, among other reasons. We found that these aspects happened in virtual lessons, but internal factors also affected the trend. These factors are linked with the active learning activities that professors can plan and monitor during each lesson.
  • Hypothesis 3.
H3 had a strong dependence on H2, because H3 requires the trend during a lesson to decrease. After evaluating the 15 lessons, we found that only 27% of them had the behavior expected in H3, and for this result we rejected H3.
The biphasic shift with a faster decline in the first minutes and a slower decline in the remainder of the class was not confirmed in the study developed in the United States [7]; we did not find the biphasic behavior described in the development of virtual lessons.
  • Hypothesis 4.
After analyzing the behavior of the heart rate at the beginning and the end of each lesson, we found that only 20% of the lessons achieved H4. After the analysis we concluded that here is not a standard pattern related to this hypothesis, and for this reason we rejected H4.
The behavior at the beginning and the end of the lesson in the study of Darnell et al. [7] showed a drop at the first three minutes and an uptick in the last three minutes of the lesson; for this reason, they excluded these three minutes for the analysis of the others hypothesis. They determined that this behavior could happen for external factors related to a face-to-face environment, such as arriving in a classroom and speaking with other students or thinking about the next class or next activities after finishing each lesson. In our study, we did not find a notable change at the beginning and the end of each virtual lesson; we take into account the data of these moments for other analysis.
  • Hypothesis 5.
We analyzed 11 passive learning activities and found that 45% of them presented the behavior described in H5. All activities were a video projection; however, before students watched the video, the professor indicated to them that there would be an activity after the video, a factor that could influence the results. We partially accepted H5 with the following adaptation: if students are previously advised that they will have to develop an activity after a passive learning activity (such as a video projection), their heart rate could increase and, consequently, so could their cognitive engagement.
The study performed in student of medicine in the United States [7] found that during a short video projection, the heart rate appears to decrease greatly since it is categorized as a passive activity, the difference with our study consisted in the instruction that the professor gave to students, which was developed a task after a video projection, a condition that modified the behavior of the heart rate.
In addition to the analysis of the hypotheses, we made the relationship between the quantitative data vs. qualitative data from the questionnaire.

5.1. Non-Self-Report Method vs. Self-Report Method

We related the heart rate variation (HRV) of whole lessons and the HRV during the active learning activities (ALA) against the response that participants gave in the questionnaire; the VHR refers to the difference between mean heart rate and the baseline, we explored the behavior of the 16 participants.
We used a quadrant model (Figure 10 and Figure 11); two quadrants stood out over the others; Quadrant I reflected that the HRV was positive and the responses in the questionnaire indicated a high level of cognitive engagement, the majority of data was located in this quadrant; the first stage, HRV of whole lessons, had 10 participants, and the second stage, HRV during ALA, had nine participants. Quadrant IV was the second predominant one. It represented an HRV negative, but the questionnaire’s response indicated a high level of cognitive engagement; this situation reflected that participants could be in an immersive state during the ALA, and not necessarily a low level of engagement. Finally, the results suggest the behavior of the heart rate during a whole lesson might be determined for the ALA that professors developed in each lesson.

5.2. Limitations, Recommendations, and Future Research

We used the heart rate as a tool for measuring student engagement in virtual lessons during the COVID 19 pandemic, and we had limitations regarding the difficulty of eliminating environmental and external influences generated by the inconveniences of having access to resources and tools necessary for the development of the lessons, such as internet connection problems, unstable electricity, lack of an appropriate space without interruptions, a computer without the required capacity to run several programs and software at the same time (lesson connection software and programs to develop activities during class), and inconvenience with the phone that collected heart rate data (the reason for removing some data from the study). These limitations affected the level of attention of the participants and sometimes caused them to carry out other activities in parallel to the lessons. The difficulty of eliminating environmental and external influences is a known limitation in the use of heart rate as a tool for identifying engagement; for this reason, for future research, we recommend using the heart rate as a non-self-report method in combination with a self-report method such as a questionnaire that allows the identification of external factors that could affect the participant’s attention in addition to the perception that she/he had of the lesson and the activities developed.
Another alternative we recommend in order to reduce the influence of external factors is to use supplementary biometric measures that allow us to identify additional characteristics which affect the heart rate, like emotions, motivation or level of concentration, factors that have a strong influence on student engagement. The supplementary biometric measures we suggest are: detection of facial expression, breath rate, skin temperature, and conductance or brain signals.
In this study, we made an exploratory investigation limited to the number of participants, the quantity of heart rate bands, and to a specific subject (human talent management). The sample number of participants was between the ranges of other studies in the sector; however, we recommend that for future studies the researchers increase the sample and evaluate the student engagement in other engineering subjects. We hope that our study can serve as the basis and input for future research related to the analysis of cognitive student engagement using heart rate as a non-self-report method.
Using the heart rate for analyzing the student engagement has the advantage that data is collected in real-time. However, the data processing and the analysis require additional time. This limitation means that teachers do not receive feedback in real time to make the necessary decisions to modify or adapt the methodology of the course. For this reason, a future challenge could be the development of a model that processes and evaluates the data of the heart rate in a shorter time or even in real-time, which can be used by all students in a lesson and provide feedback to the professor.
The heart rate is a physiological parameter used mainly by enterprises to evaluate customer behavior. Carrying out this study, we aim to demonstrate that the heart rate is a prominent tool that can determine cognitive student engagement. We expect that this study could be a base for future research looking to deepen the evaluation of the variables that influence heart rate in an academic environment.

6. Conclusions

Student engagement allows educational institutions to improve their decisions regarding methodologies, evaluation of quality, and feedback. The methods to determine student engagement are divided into self-report methods, such as questionnaires, surveys and analysis of these, and non-self-report methods, which use physiological characteristics such as heart rate, brain signals, analysis of facial expressions, etc. In Colombia, the investigations only used self-report methods.
In this study, we develop an exploratory investigation to determine the level of student cognitive engagement through heart rate, during the development of active learning activities. We used heart rate bands and a mobile application to collect the data, in a sample of 16 students who were taking the Human Talent Management subject of the industrial engineering program of a higher education institution in Bogotá, Colombia.
The results confirm that heart rate can be used as a tool for measuring cognitive student engagement in distance learning, especially if the professor develops an active learning activity, since statistically, the heart rate has a significant variation with respect to the baseline heart rate during the development of these activities. At this point, it is important to clarify that this difference could be positive or negative. A positive variation implies an increase in the heart rate because the study subject is making a mental effort, and a negative variation means an immersive state, i.e., the active learning activity captured the student’s attention and immersed her/him in this environment, causing her/him to isolate herself/himself from any other activity. In the development of virtual lessons, one of the main concerns of the professors is to identify activities that encourage the participation of students, capture their attention, and allow the transmission of knowledge. In this study, we found that active learning activities achieve these objectives, because spaces are generated within the lessons that allow students to concentrate on the activities developed, resolve doubts and connect their past experiences with new knowledge.
Using a quadrant model, we confirmed that combining a non-self-report method and a self-report method allows us to analyze the engagement in a broader perspective. This association allows us to relate the engagement reported by the students with the results obtained from the physiological characteristic. In our study, one of the results suggested that, during an active learning activity, most participants reported a high level of cognitive engagement, and the heart rate variation had a significant difference with respect to the baseline, a result that was evident in the ANOVA. However, in this analysis it was possible to identify that this difference could be positive or negative.
In the development of this research we found that students feel more comfortable, feel less pressure, and are more willing to participate in a study if factors such as student engagement are measured using a non-self-report method, because they sent us the heart rate data immediately after the end of the lesson without having to remind them to send the data. However, the opposite happened with the self-report method, because we had to ask them to fill out each questionnaire at least twice and sometimes up to four times. The above shows that students are interested in participating in non-self-report methods and shows the importance of rethinking the way self-report methods are implemented.
We confirm that the heart trend from the beginning to the end of the lesson depends on external and internal factors. The external factors include instability in the internet connection and activities that students may be developing in parallel to lessons, and the internal factors, which professors can control, are linked with the active learning activities. The internal and external factors that are presented in a face-to-face lesson are very different from those that are presented in a virtual lesson. In a face-to-face lesson, the external factors that affect the concentration of students are reduced due to the learning environment that a classroom provides. However, in a remote environment, the external factors are greater and variable. For this reason, the active learning activities that professors develop become more relevant, especially in terms of the duration and time of the lesson in which they are performed. These activities provide a balance at the beginning, in the middle and at the end of the lesson.
Concerning passive learning activities, if students are previously advised that they will have to develop a task after a passive learning activity (such as a video projection), their heart rate could increase and, consequently, so could their cognitive engagement. The instructions of the activities to be carried out after the video projection were focused on the topic that the students were learning and generated a discussion between the work groups or between the students and the professor. This particularity should be considered if professors want to implement a passive learning activity to promote cognitive engagement.
We find that heart rate did not present a pattern in the biphasic analysis or a pattern behavior at the beginning and the end of the lesson. The four heart rate behaviors found at the beginning and at the end of the lesson allow us to deduce that the variation depends on external factors that may occur before and after the class, and that the professor cannot control; for example, other academic activities of other subjects or personal activities that can cause a variation in heart rate.
We expect that this study can provide input for future research assessing student cognitive engagement in higher education and motivate researchers to use physiological characteristics as a measurement tool.
Author Contributions

Conceptualization, A.C.L.N., J.P.C.G. and I.A.C.J.; methodology, A.C.L.N., J.P.C.G., I.A.C.J. and J.S.G.A.; validation, A.C.L.N., J.P.C.G., I.A.C.J., J.S.G.A., F.M. and E.V.; formal analysis, A.C.L.N., J.P.C.G., I.A.C.J., J.S.G.A., F.M. and E.V.; investigation, A.C.L.N., J.P.C.G., I.A.C.J., J.S.G.A., F.M. and E.V.; resources, A.C.L.N.; data curation, A.C.L.N., J.P.C.G., I.A.C.J., J.S.G.A., F.M. and E.V.; writing—original draft preparation, A.C.L.N. and J.S.G.A.; writing—review and editing, J.P.C.G., I.A.C.J., F.M. and E.V.; visualization, A.C.L.N., J.P.C.G., I.A.C.J., J.S.G.A., F.M. and E.V.; supervision, J.P.C.G., I.A.C.J., J.S.G.A., F.M. and E.V.; project administration, A.C.L.N., J.P.C.G., I.A.C.J., J.S.G.A., F.M. and E.V. All authors have read and agreed to the published version of the manuscript.

Funding

This research received no external funding.

Institutional Review Board Statement

The study was conducted according to the guidelines of the Escuela Colombiana de Ingeniería Julio Garavito of Autorización del tratamiento de datos participación investigación de Maestría.

Informed Consent Statement

Informed consent was obtained from all subjects involved in the study.

Acknowledgments

Thanks to Escuela Colombiana de Ingeniería Julio Garavito, professors and participants for their effort and support.

Conflicts of Interest

The authors declare no conflict of interest.

Abbreviations

The following abbreviations are used in this manuscript:
MUSLIS  Malaysian University Student Learning Involvement Scale
NSSE  National Survey of Student Engagement
MSLQ  Motivated Strategies for Learning Questionnaire
HESES  Higher Education Student Engagement Scale
ALA  Active learning activities
PPG  Photoplethysmography
3SD  Three standard deviations
MHR  Mean heart rate
H1  Hypothesis 1
H2  Hypothesis 2
H3  Hypothesis 3
H4  Hypothesis 4
H5  Hypothesis 5
HRT  Heart rate trend
HRV  Heart rate variation
bpm  Beats per minute

References

  1. Bertel-Narváez, M.P.; Viloria-Escobar, J.D.J.; Sánchez-Buitrago, J.O. Tendencias de investigación en los posgrados de gestión educativa en América Latina. Educación Educ. 2019, 22, 215–233. [Google Scholar] [CrossRef]
  2. Markopoulos, E.; Einolander, J.; Vanharanta, H.; Kantola, J.; Sivula, A. Measuring Student Engagement and Commitment on Private Academic Institutions Using Fuzzy Logic Expert System Metrics Applications. In Advances in Intelligent Systems and Computing; Springer Verlag: Berlin/Heidelberg, Germany, 2020; Volume 963, pp. 163–173. [Google Scholar] [CrossRef]
  3. Bedenlier, S.; Bond, M.; Buntins, K.; Zawacki-Richter, O.; Kerres, M. Facilitating student engagement through educational technology in higher education: A systematic review in the field of arts and humanities. Australas. J. Educ. Technol. 2020, 126–150. [Google Scholar] [CrossRef]
  4. Zhou, A.; Guan, X.; Ahmed, M.Z.; Ahmed, O.; Jobe, M.C.; Hiramoni, F.A. An Analysis of the Influencing Factors of Study Engagement and Its Enlightenment to Education: Role of Perceptions of School Climate and Self-Perception. Sustainability 2021, 13, 5475. [Google Scholar] [CrossRef]
  5. Whitehill, J.; Serpell, Z.; Lin, Y.C.; Foster, A.; Movellan, J.R. The faces of engagement: Automatic recognition of student engagement from facial expressions. IEEE Trans. Affect. Comput. 2014, 5, 86–98. [Google Scholar] [CrossRef]
  6. Zhang, H.; Xiao, X.; Huang, T.; Liu, S.; Xia, Y.; Li, J. An novel end-to-end network for automatic student engagement recognition. In Proceedings of the ICEIEC 2019—Proceedings of 2019 IEEE 9th International Conference on Electronics Information and Emergency Communication, Beijing, China, 12–14 July 2019; Institute of Electrical and Electronics Engineers Inc.: New York, NY, USA, 2019; pp. 342–345. [Google Scholar] [CrossRef]
  7. Darnell, D.K.; Krieg, P.A. Student engagement, assessed using heart rate, shows no reset following active learning sessions in lectures. PLoS ONE 2019, 14, e0225709. [Google Scholar] [CrossRef] [PubMed] [Green Version]
  8. García-Alberti, M.; Suárez, F.; Chiyón, I.; Feijoo, J.C.M. Challenges and experiences of online evaluation in courses of civil engineering during the lockdown learning due to the covid-19 pandemic. Educ. Sci. 2021, 11, 59. [Google Scholar] [CrossRef]
  9. Gelles, L.A.; Lord, S.M.; Hoople, G.D.; Chen, D.A.; Mejia, J.A. Compassionate flexibility and self-discipline: Student adaptation to emergency remote teaching in an integrated engineering energy course during covid-19. Educ. Sci. 2020, 10, 304. [Google Scholar] [CrossRef]
  10. Lassoued, Z.; Alhendawi, M.; Bashitialshaaer, R. An exploratory study of the obstacles for achieving quality in distance learning during the covid-19 pandemic. Educ. Sci. 2020, 10, 232. [Google Scholar] [CrossRef]
  11. Senthil, S.; Lin, W.M. Measuring students’ engagement using wireless heart rate sensors. In Proceedings of the 2017 International Conference On Smart Technology for Smart Nation, SmartTechCon 2017, Bengaluru, India, 17–19 August 2017; Institute of Electrical and Electronics Engineers Inc.: New York, NY, USA, 2018; pp. 699–704. [Google Scholar] [CrossRef]
  12. Xie, K.; Heddy, B.C.; Vongkulluksn, V.W. Examining engagement in context using experience-sampling method with mobile technology. Contemp. Educ. Psychol. 2019, 59, 101788. [Google Scholar] [CrossRef]
  13. Fredricks, J.A.; Blumenfeld, P.; Friedel, J.; Paris, A. What do children need to flourish? Conceptualizing and measuring indicators of positive development. Sch. Engagem. 2005, 5, 305–321. [Google Scholar]
  14. Fredricks, J.A.; Blumenfeld, P.C.; Paris, A.H. School Engagement: Potential of the Concept, State of the Evidence. Rev. Educ. Res. 2004, 74, 59–109. [Google Scholar] [CrossRef] [Green Version]
  15. Corno, L.; Mandinach, E.B. The Role of Cognitive Engagement in Classroom Learning and Motivation. Educ. Psychol. 1983, 18, 88–108. [Google Scholar] [CrossRef]
  16. Meece, J.; Blumenfeld, P.; Hoyle, R. Students’ goal orientations and cognitive engagement in classroom activities. J. Educ. Psychol. 1988, 80, 514. [Google Scholar] [CrossRef]
  17. Zeng, H.; Shu, X.; Wang, Y.; Wang, Y.; Zhang, L.; Pong, T.C.; Qu, H. EmotionCues: Emotion-Oriented Visual Summarization of Classroom Videos. IEEE Trans. Vis. Comput. Graph. 2020, 1. [Google Scholar] [CrossRef] [PubMed]
  18. Lei, M.; Clemente, I.M.; Hu, Y. Engagement data of robotic students in a synchronous-hybrid course. Data Brief 2019, 24, 103822. [Google Scholar] [CrossRef] [PubMed]
  19. Dekhane, S.; Xu, X.; Tsoi, M.Y. Mobile App Development to Increase Student Engagement and Problem Solving Skills. J. Inf. Syst. Educ. 2013, 24, 299–308. [Google Scholar]
  20. Mohd Jaafar, F.; Awang-Hashim, R.; Tengku Ariffin, T.F. Malaysian University Student Learning Involvement Scale (MUSLIS)- Validation of a Student Engagement Model. Malays. J. Learn. Instr. (MJLI) 2012, 9, 15–30. [Google Scholar] [CrossRef]
  21. Alioon, Y.; Delialioğlu, Ö. The effect of authentic m-learning activities on student engagement and motivation. Br. J. Educ. Technol. 2019, 50, 655–668. [Google Scholar] [CrossRef]
  22. Zhoc, K.C.H.; Webster, B.J.; King, R.B.; Li, J.C.H.; Chung, T.S.H. Higher Education Student Engagement Scale (HESES): Development and Psychometric Evidence. Res. High. Educ. 2019, 60, 219–244. [Google Scholar] [CrossRef]
  23. Ma, J.; Cheng, J.; Han, X. Initial development process of a student engagement scale in blended learning environment. In Proceedings of the 6th International Conference of Educational Innovation Through Technology, EITT 2017, Osaka, Japan, 7–9 December 2017; Institute of Electrical and Electronics Engineers Inc.: New York, NY, USA, 2018; pp. 234–237. [Google Scholar] [CrossRef]
  24. Balaam, M.; Fitzpatrick, G.; Good, J.; Luckin, R. Exploring affective technologies for the classroom with the subtle stone. In Proceedings of the Conference on Human Factors in Computing Systems, Atlanta, GA, USA, 10–15 April 2010; ACM Press: New York, NY, USA, 2010; Volume 3, pp. 1623–1632. [Google Scholar] [CrossRef]
  25. Alkabbany, I.; Ali, A.; Farag, A.; Bennett, I.; Ghanoum, M.; Farag, A. Measuring Student Engagement Level Using Facial Information. In Proceedings of the International Conference on Image Processing, ICIP, Taipei, Taiwan, 22–25 September 2019; IEEE Computer Society: New York, NY, USA, 2019; pp. 3337–3341. [Google Scholar] [CrossRef]
  26. Sakulchit, T.; Kuzeljevic, B.; Goldman, R.D. Evaluation of Digital Face Recognition Technology for Pain Assessment in Young Children. Clin. J. Pain 2019, 35, 18–22. [Google Scholar] [CrossRef]
  27. Farrell, C.C.; Markham, C.; Deegan, C. Real Time Detection and Analysis of Facial Features to Measure Student Engagement with Learning Objects. In IMVIP 2019: Irish Machine Vision & Image Processing; Technological University Dublin: Dublin, Ireland, 2019. [Google Scholar] [CrossRef]
  28. Herpich, F.; Guarese, R.; Cassola, A.; Rockenbach Tarouco, L. Mobile augmented reality impact in student engagement: An analysis of the focused attention dimension. In Proceedings of the 2018 International Conference on Computational Science and Computational Intelligence, CSCI 2018, Las Vegas, NV, USA, 12–14 December 2021; Institute of Electrical and Electronics Engineers Inc.: New York, NY, USA, 2018; pp. 562–567. [Google Scholar] [CrossRef]
  29. Hayashi, R.; Fujimoto, M.; Sato, T. A Quantitative Study on Learner Engagement Evaluation: Integrated Analysis of Biosignals Including Pulse Wave and Eye Movements. In E-Learn: World Conference on E-Learning in Corporate, Government, Healthcare, and Higher Education; Association for the Advancement of Computing in Education (AACE): New Orleans, LA, USA, 2019; Volume 2019, pp. 496–501. [Google Scholar]
  30. Chen, Y.C.; Hsiao, C.C.; Zheng, W.D.; Lee, R.G.; Lin, R.; Schaller, B. Artificial neural networks-based classification of emotions using wristband heart rate monitor data. Medicine 2019, 98. [Google Scholar] [CrossRef]
  31. Park, S.; Choi, S.J.; Mun, S.; Whang, M. Measurement of emotional contagion using synchronization of heart rhythm pattern between two persons: Application to sales managers and sales force synchronization. Physiol. Behav. 2019, 200, 148–158. [Google Scholar] [CrossRef]
  32. Ruiz-Padial, E.; Sollers, J.J.; Vila, J.; Thayer, J.F. The rhythm of the heart in the blink of an eye: Emotion-modulated startle magnitude covaries with heart rate variability. Psychophysiology 2003, 40, 306–313. [Google Scholar] [CrossRef] [PubMed]
  33. Siennicka, A.; Quintana, D.; Fedurek, P.; Wijata, A.; Paleczny, B.; Ponikowska, B.; Danel, D.P. Resting heart rate variability, attention and attention maintenance in young adults. Int. J. Psychophysiol. 2019, 143, 126–131. [Google Scholar] [CrossRef] [PubMed]
  34. Zhu, J.; Ji, L.; Liu, C. Heart Rate Variability Monitoring for Emotion and Disorders of Emotion. Physiol. Meas. 2019, 40, 064004. [Google Scholar] [CrossRef] [PubMed]
  35. Forte, G.; Favieri, F.; Casagrande, M. Heart rate variability and cognitive function: A systematic review. Front. Neurosci. 2019, 13, 710. [Google Scholar] [CrossRef]
  36. Lacey, B.C.; Lacey, J.I. Studies of Heart Rate and Other Bodily Processes in Sensorimotor Behavior. In Cardiovascular Psychophysiology: Current Issues in Response Mechanisms, Biofeedback and Methodology; Routledge: New York, NY, USA, 2017; pp. 538–564. [Google Scholar] [CrossRef]
  37. Scholey, A.B.; Moss, M.C.; Neave, N.; Wesnes, K. Cognitive Performance, Hyperoxia, and Heart Rate Following Oxygen Administration in Healthy Young Adults. Physiol. Behav. 1999, 67, 783–789. [Google Scholar] [CrossRef]
  38. Monkaresi, H.; Bosch, N.; Calvo, R.A.; D’Mello, S.K. Automated Detection of Engagement Using Video-Based Estimation of Facial Expressions and Heart Rate. IEEE Trans. Affect. Comput. 2017, 8, 15–28. [Google Scholar] [CrossRef]
  39. Yamuza, M.T.V.; Bolea, J.; Orini, M.; Laguna, P.; Orrite, C.; Vallverdu, M.; Bailon, R. Human Emotion Characterization by Heart Rate Variability Analysis Guided by Respiration. IEEE J. Biomed. Health Inform. 2019, 23, 2446–2454. [Google Scholar] [CrossRef] [PubMed]
  40. Valderas, M.T.; Bolea, J.; Laguna, P.; Bailón, R.; Vallverdú, M. Mutual information between heart rate variability and respiration for emotion characterization. Physiol. Meas. 2019, 40, 084001. [Google Scholar] [CrossRef]
  41. Wollmann, T.; Abtahi, F.; Eghdam, A.; Seoane, F.; Lindecrantz, K.; Haag, M.; Koch, S. User-Centred Design and Usability Evaluation of a Heart Rate Variability Biofeedback Game. IEEE Access 2016, 4, 5531–5539. [Google Scholar] [CrossRef]
  42. Nepal, R.; Rogerson, A.M. From theory to practice of promoting student engagement in business and law-related disciplines: The case of undergraduate economics education. Educ. Sci. 2020, 10, 205. [Google Scholar] [CrossRef]
  43. Ross, R.; de Souza-Daw, A. Educational Escape Rooms as an Active Learning Tool for Teaching Telecommunications Engineering. Telecom 2021, 2, 10. [Google Scholar] [CrossRef]
  44. Han, F. The Relations between Teaching Strategies, Students’ Engagement in Learning, and Teachers’ Self-Concept. Sustainability 2021, 13, 5020. [Google Scholar] [CrossRef]
  45. Romero, P.D.; Montes, N.; Barquero, S.; Aloy, P.; Ferrer, T.; Granell, M.; Millán, M. EXPLORIA, a New Way to Teach Maths at University Level as Part of Everything. Mathematics 2021, 9, 1082. [Google Scholar] [CrossRef]
  46. Sugino, C. Student Perceptions of a Synchronous Online Cooperative Learning Course in a Japanese Women’s University during the COVID-19 Pandemic. Educ. Sci. 2021, 11, 231. [Google Scholar] [CrossRef]
  47. Hernández-barco, M.; Sánchez-martín, J.; Corbacho-cuello, I.; Cañada-cañada, F. Emotional performance of a low-cost eco-friendly project based learning methodology for science education: An approach in prospective teachers. Sustainability 2021, 13, 3385. [Google Scholar] [CrossRef]
  48. Acevedo, D.; Torres, J.D.; Tirado, D.F. Análisis de los Hábitos de Estudio y Motivación para el Aprendizaje a Distancia en Alumnos de Ingeniería de Sistemas de la Universidad de Cartagena (Colombia). Form. Univ. 2015, 8, 59–66. [Google Scholar] [CrossRef]
  49. Hederich-Martínez, C.; Caballero-Domínguez, C.C. Validación del cuestionario Maslach Burnout Inventory-Student Survey (MBI-SS) en contexto académico colombiano. CES Psicología 2016, 9, 1–15. [Google Scholar] [CrossRef] [Green Version]
  50. Pineda Báez, C.; Bermúdez Aponte, J.J.; Rubiano Bello, Á.; Pava García, N.; Suárez García, R.; Cruz Becerra, F. Student engagement and academic performance in the colombian university context. RELIEVE—Rev. Electron. Investig. Eval. Educ. 2014, 20, 1–19. [Google Scholar] [CrossRef] [Green Version]
  51. Durón-Ramos, M.F.; Mojica-Gómez, P.A.; Villamizar-Gomez, K.; Chacón-Andrade, E.R. Impact of Positive Personal Traits on University Student Engagement in Mexico, Colombia, and El Salvador. Front. Educ. 2020, 5, 12. [Google Scholar] [CrossRef] [Green Version]
  52. Pineda-Báez, C.; Hennig Manzuoli, C.; Vargas Sánchez, A. Supporting student cognitive and agentic engagement: Students’ voices. Int. J. Educ. Res. 2019, 96, 81–90. [Google Scholar] [CrossRef]
  53. Viñán Villagrán, J.A.; Navarrete Chávez, F.F.; Puente Riofrio, M.I.; Pino Burgos, S.d.P.; Caicedo Benavides, F.U. Metodología de la investigación científica como instrumento en la producción y realización de una investigación. Atlante Cuad. Educ. Desarro. 2018. Available online: https://www.eumed.net/rev/atlante/2018/05/investigacion-cientifica.html (accessed on 1 September 2021).
  54. Kaddoura, M. Think Pair Share: A Teaching Learning Strategy to Enhance Students’ Critical Thinking, Educational Research Quarterly, 2013-Jun. Educ. Res. Q. 2013, 36, 3–24. [Google Scholar]
  55. Lee, J.; Song, H.D.; Hong, A. Exploring Factors, and Indicators for Measuring Students’ Sustainable Engagement in e-Learning. Sustainability 2019, 11, 985. [Google Scholar] [CrossRef] [Green Version]
  56. Nonis, F.; Olivetti, E.C.; Marcolin, F.; Violante, M.G.; Vezzetti, E.; Moos, S. Questionnaires or inner feelings: Who Measures The Engagement Better? Appl. Sci. 2020, 10, 609. [Google Scholar] [CrossRef] [Green Version]
  57. Maison, D.; Oleksy, T. Validation of EEG as an Advertising Research Method: Relation Between EEG Reaction Toward Advertising and Attitude Toward Advertised Issue (Related to Political and Ideological Beliefs). In Neuroeconomic and Behavioral Aspects of Decision Making; Springer: Cham, Switzerland, 2017; pp. 273–291. [Google Scholar] [CrossRef]
  58. Rooney, B.; Hennessy, E.; Bálint, K. Title Viewer versus Film: Exploring Interaction Effects of Immersion and Cognitive Stance on the Heart Rate and Self-Reported Engagement of Viewers of Short Films. In Proceedings of the Poster presentation at the Society for Cognitive Studies of the Moving Image, Franklin & Marshall College, Lancaster, PA, USA, 11–14 June 2014; University College Dublin (UCD): Dublin, Ireland, 2014. Available online: http://hdl.handle.net/10197/5710 (accessed on 1 September 2021).
Figure 1. Research preparation.
Education 11 00540 g001
Figure 2. Execution of the investigation.
Education 11 00540 g002
Figure 3. Data treatment.
Education 11 00540 g003
Figure 4. Quadrant model of heart rate variation vs. mean response of questionnaires.
Education 11 00540 g004
Figure 5. Information participants.
Education 11 00540 g005
Figure 6. Distribution of items in each cluster for the four groups.
Education 11 00540 g006
Figure 7. The behavior of the mean heart rate before, after, and during an active learning activity.
Education 11 00540 g007
Figure 8. Heart rate trend decreased or increased from the beginning to the end of the lesson.
Education 11 00540 g008
Figure 9. Behavior biphasic during a lesson.
Education 11 00540 g009
Figure 10. First scenario—Quadrant of general heart rate variation vs. mean response of questionnaire.
Education 11 00540 g010
Figure 11. Second scenario—Quadrant of heart rate variation of active learning activities vs. mean response of questionnaires.
Education 11 00540 g011
Table 1. Self-report measurement methods.
AuthorStudy TimeYear of PublicationMeasurement MethodResearch LocationLevel of Education
2010–20152015–20182018–2020Method DetailCountrySchoolCollege
Lei et al.Engagement data of robotic students in a synchronous-hybrid course xConducting a national survey of student engagement in a telepresence environment.USA x
Dekhane et al.Mobile App Development to Increase Student Engagement and Problem Solving Skills xThe students had to develop mobile games; with a questionnaire and a pre and post quiz, the researchers evaluated the variables.USA x
Awang-Hashim R. et al.Malaysian University Student Learning Involvement Scale (MUSLIS): Validation of a Student Engagement Model xMeasurement of student engagement through the MUSLIS questionnaire.Malaysia x
Alioon and DelialioğluThe effect of authentic m- learning activities on student engagement and motivation x Measurement of student engagement and motivation through the NSSE- National Survey of Student Engagement and MSLQ- Motivated Strategies for Learning Questionnaire.Turkey x
Zhoc et al.Higher Education Student Engagement Scale (HESES): Development and Psychometric Evidence xDevelopment of a case study using the HESES-Higher Education Student Engagement Scale survey.Hong Kong x
Ma et al.Initial Development Process of a Student Engagement Scale in Blended Learning Environment xDesign of a survey based on the NSSE.China x
Balaam et al.Exploring Affective Technologies for the Classroom with the Subtle Stonex By means of the “Subtle stone”, a handheld orb, students inform what they feel when they press it.United Kingdomx
Table 2. Non-self-report measurement methods.
AuthorArticle TitleYear of PublicationMethod of MeasurementResearch LocationStudent Level of the Study Subject
2010–20152015–20182018–2020Method DetailCountrySchoolCollegeOther
Zeng H. et al.EmotionCues: Emotion-Oriented Visual Summarization of Classroom Videos xRecognize emotions by analyzing facial videos.China-Hong Kongxx
Zhang H. et al.An Novel End-to-end Network for Automatic Student Engagement Recognition xFace recognition with I3D- processing of 3D images or videosChina x
Alkabbany et al.Measuring Student Engagement Level Using Facial Information xDetect facial actions (head posture, gaze).USA x
Farrell et al.Real Time Detection and Analysis of Facial Features to Measure Student Engagement with Learning Objects xAn application identified the emotional state and the position of the head.Ireland-Dublin x
Whitehill J. et al.The Faces of Engagement: Automatic Recognition of Student Engagement from Facial Expressionsx They collect facial expressions and analyze them with machine learning (ML), a program that detects high or low interaction.USA x
Sakulchit et al.Evaluation of Digital Face Recognition Technology for Pain Assessment in Young Children xA program, API (Application Programing interface), analyzed images taken of the face and identified emotions of the study subjects.Canada x
Herpich F. et al.Mobile Augmented Reality impact in Student Engagement: an Analysis of the Focused Attention dimension xThey measured student brain signals to see the impact of augmented reality on student engagement.Brazil x
Hayashi et al.A Quantitative Study on Learner Engagement Evaluation: Integrated Analysis of Biosignals Including Pulse Wave and Eye Movements xMeasuring eye movement with three electrodes built into glasses.Japanxx
Darnell and KriegStudent engagement, assessed using heart rate, shows no reset following active learning sessions in lectures xThey measured students’ heart rate for identifying cognitive students engagement.USA x
Table 3. Research methodology.
METHODOLOGY
Phase 1Phase 2Phase 3
Research PreparationExecution of the ResearchData Treatment
• Active learning activities.
• Participants.
• Heart rate band preparation.
• Quantitative data (non-self-report method).
• Qualitative data of annotations.
• Qualitative data of the questionnaire (non-self-report method).
• Data Cleaning.
• Data processing.
• Non-self-report method vs. self-report method
Table 4. Number of participants in studies of non-self-report methods.
StudyNumber of Participants
EmotionCues: Emotion-Oriented Visual Summarization of Classroom VideosCase 1: 15 children
Case 2: 13 students
Multimodal affect recognition in learning environments8 children
Measuring Student Engagement Level Using Facial Information14 students
Mobile Augmented Reality Impact in Student Engagement: an Analysis of the Focused Attention Dimension5 students
A Quantitative Study on Learner Engagement Evaluation: Integrated Analysis of Biosignals Including Pulse Wave and Eye MovementsCase 1: 6 students
Case 2: 10 students
Artificial neural networks-based classification of emotions using wristband heart rate monitor data12 individuals
Table 5. Self-report method the questionnaire format.
Self-Report Method: The Questionnaire
1I can deduce new interpretations and ideas from the knowledge I have learned in today’s lesson.
2I can deeply analyze thoughts, experiences, and theories about the knowledge I have learned in today’s lesson.
3I can judge the value of information related to the knowledge learned in today’s lesson.
4I tried to approach the topic of today’s lesson with a new perspective.
5In today’s lesson, I tried to learn new material by mentally associating new ideas with similar ideas that I already  knew.
6While learning new concepts in today’s lesson, I tried to think of practical applications.
7I made sure I understood the material I studied in today’s lesson. (I am aware of what material I understood or did not understand).
8In today’s lesson, I tried to memorize the answers to the questions in the study guides for the tests.
9To understand what the technical terms meant, I memorized the definitions provided in the texts or today’s lesson notes. (I’m trying to memorize the vocabulary for this lesson).
10I tried to write down exactly what my instructor said during the lectures in today’s lesson.
11I used what I have learned to solve practical problems in today’s lesson.
12I make connections between the things that I have learned in today’s lesson.
13I tend to apply the knowledge I have learned in lesson to real problems or new situations.
14When I learned new material, I summarized it in my own words.
15I mentally combined different pieces of information from the course materials in an order that made sense to me.
16In doing the readings for the lesson, I tried to figure out what part of the reading would be on the test. (I’m studying the course materials to get the information needed for the test).
17I study ideas exactly as they are expressed in lesson or in my readings.
18Establish a learning plan to be able to direct my activities in the lessons.
19I have clear learning objectives at each stage of the course.
20I make good use of my study time for this course.
21I connect what I have learned in this course with another subject.
22I ask myself questions and think about a topic when I read learning materials from the course.
23I use what I have learned from homework and tests to promote my next learning step.
24I think about what I have already learned to understand a new course topic.
Table 6. Mean response in the questionnaire and baseline heart rate for each participant.
Participant123456781011121314151617
Baseline Heart Rate (bpm)77.274.870.373.372.977.876.974.878.986.077.371.270.780.475.075.0
Mean Response in the Questionnaire3.952.722.504.683.833.173.583.424.263.134.423.513.103.943.833.99
Table 7. Data normalized and discarded under the criteria of 3SD.
Part 1Part 2Part 3Part 4Part 5Part 6Part 7Part 8Part 10Part 11Part 12Part 13Part 14Part 15Part 16Part 17
Lesson 1XX XX X
Lesson 2 X X X XXX
Lesson 3 X X
Lesson 4 XXX XXX X
Table 8. Number of items and centroid of each cluster.
GROUP 1GROUP 2GROUP 3GROUP 4
ClusterNumber of ItemsCentroid HR (bpm)ClusterNumber of ItemsCentroid HR (bpm)ClusterNumber of ItemsCentroid HR (bpm)ClusterNumber of ItemsCentroid HR (bpm)
49960.2121863.1614958.118660.7
324766.3541669.9040266.8324369
642870.9034176.4442974.9026275.8
134075.9324182.2230682.9219781.3
036081.6615888.5131091.7613587.5
533787.846996321799.248194.9
220095.5218107.9559109.4527105.6
Table 9. Number of active learning activities according to each behavior.
  BehaviorNumber of Active Learning ActivitiesPercentage
Behavior one (low MHR-high MHR-low MHR)2441.40%
Behavior two (high MHR-low MHR-high MHR)1322.40%
Behavior three (low MHR-high MHR-high MHR)712.10%
Behavior four (high MHR-low MHR-low MHR)1424.10%
58100%
Table 10. ANOVA-Active learning activities.
Active Learning ActivityFCritical Value for FHad Heart Rates Statistically Significant Differences?
Quiz0.1813.890No
Discussion of a topic in group or pair37.4923.865Yes
Share responses to an activity11.8343.910Yes
Individual activity24.3413.857Yes
Interaction between students and professor6.8013.860Yes
Table 11. Summary of heart rate trend.
Heart Rate TrendNumber of LessonsPercentage
Behavior one (HRT decreased)960%
Behavior two (HRT increased)640%
15100%
Table 12. The trend of first and last section in each lesson.
LessonSlopeCorrespondence with H3
GeneralFirst SectionLast Section
1−0.019−0.053−0.017Yes
2−0.00550.028−0.0098No
3−0.0027−0.05790.0132No
4−0.0047−0.0483−0.0086Yes
5−0.00460.01810.0112No
6−0.058−0.14590.0143No
7−0.0157−0.0563−0.0085Yes
8−0.0051−0.0666−0.0228Yes
9−0.0110.3008−0.0115No
Table 13. Correspondence with hypothesis 3.
Correspondence with Hypothesis 3Number of LessonsPercentage
Yes427%
No1173%
15100%
Table 14. Behavior of the heart rate at the beginning and end of each lesson.
Behavior of the Heart Rate in Each LessonSlopeCorrespondence
BeginningEndwith Hypothesis 4
Decreases at the beginning and decreases faster at the end−0.2088−0.5779No
Decreases at the beginning and increases at the end−0.20960.5495Yes
Decreases at the beginning and decreases faster at the end−0.1698−0.2714No
Increases at the beginning and increases slower at the end0.27570.1136No
Increases at the beginning and decreases at the end0.2085−0.6794No
Increases at the beginning and decreases at the end0.8469−0.8181No
Decreases at the beginning and increases at the end−0.16230.3963Yes
Increases at the beginning and decreases at the end0.1784−0.2863No
Decreases at the beginning and decreases faster at the end−0.1795−0.4427No
Decreases at the beginning and decreases faster at the end−0.1799−0.9221No
Increases at the beginning and decreases at the end0.0139−0.0167No
Increases at the beginning and decreases at the end0.0699−1.5297No
Decreases at the beginning and increases at the end−0.09140.9825Yes
Increases at the beginning and increases slower at the end1.41760.6167No
Increases at the beginning and increases slower at the end0.86030.1399No
Table 15. Summary of each behavior at the beginning and the end of lessons.
Behavior of the Heart RateNumber of LessonsPercentage
Decreases at the beginning and increases at the end320%
Decreases at the beginning and decreases faster at the end427%
Increases at the beginning and decreases at the end533%
Increases at the beginning and increases slower at the end320%
15100%
Table 16. Correspondence with hypothesis 5.
BehaviorNumber of ActivitiesLow/HighPercentageCorrespondence with Hypothesis 5
Behavior one (high MHR-low MHR-high MHR)2545%Yes
Behavior two (high MHR-low MHR-low MHR)3
Behavior three (low MHR-high MHR-high MHR)1655%No
Behavior four (low MHR-high MHR-low MHR)5
1111100%
Table 17. Hypotheses results.
Hypotheses Results
HypothesisResults
Hypothesis 1 (H1)We partially accepted H1 adapting the initial approach to the following: the mean heart rate has a significant variation with an active learning activity, indicating students experiment with cognitive engagement.
Hypothesis 2 (H2)We partially accepted H2 with the following adaptation: The trend of the heart rate from the beginning to the end of the lesson depends on external and internal factors. The internal factors are linked with the active learning activities, mainly the duration and the moment in the lesson that the professor develops them.
Hypothesis 3 (H3)The drop in heart rate was biphasic, with a further decrease during the early stages of the lesson in only 27% of cases. For that reason, we rejected H3.
Hypothesis 4 (H4)The heart rate decreased at the beginning and increased at the end in 20% of lessons; for that reason, we rejected H4.
Hypothesis 5 (H5)We partially accepted H5 with the following adaptaion: if students are previously advised that they will have to develop an activity after a passive learning activity (such as a video projection), their heart rate could increase and consequently, so could their cognitive engagement.
Publisher’s Note: MDPI stays neutral with regard to jurisdictional claims in published maps and institutional affiliations.