1. Introduction
The COVID-19 pandemic has greatly impacted our lives, and as a result, a digital format was (and is still) used by most universities. Due to the pandemic and this format transition, managing and research became more difficult at institutions, while exams were either reformatted or postponed [
1]. According to the previous survey, classroom teaching was replaced by online teaching and learning in African, American, Asia–Pacific, and European regions by 29%, 72%, 60%, and 85%, respectively. Clearly, the life of university staff and students became harder as many new challenges arose [
2,
3,
4,
5], mainly in medical education [
6,
7,
8,
9].
According to the results presented in [
10], the lack of interactions with teachers and classmates was a major hindrance during online learning. As presented in a survey [
11], students preferred face-to-face education because 88% of them considered it effective. Contrarily, online and hybrid types of education were only considered effective by 7% and 44%, respectively. Hybrid or blended types of education were preferred by educators [
12]. Aboagye et al. concluded that blended learning should have ushered learners to complete online learning [
13].
However, since students had diminished engagement due to the quick transition to digital education [
14], course materials could be opened fewer times. They even became more accessible, resulting in cheating which also became a serious problem on online exams due to distance education and negative feelings. The former is considered ineffective [
15]. Regarding the latter, it is concluded by the study of Abdelrahim that the pandemic causes depression, stress, and anxiety, which are the causes of cheating [
16]. This fact is also strengthened by the study of Vargus [
17].
According to the referenced study of [
15], screen sharing and/or a camera should be used to mitigate cheating. Without a camera or an honor code, students are more likely to cheat [
18]. Naturally, an honor code cannot avert students from cheating. It is a necessary but not sufficient condition. Screen sharing is also important, as students could use file-sharing websites without it [
19], or some students could even log in to their friend’s profiles to download their answer files [
20]. Other strategies, such as higher-order thinking multiple choice questions and higher-order thinking short answer questions, are detailed in the literature to reduce cheating [
21]. Even guidelines were created for online assessments to minimize cheating [
22,
23]. Moreover, the study of Balderas and Caballero-Hernández suggests that the students’ works should be recorded to minimize cheating [
24], while Sharma et al. and Jadi proposed convolutional neural network-based technologies to identify cheating [
25,
26]. Lee et al. also developed a system with multiple cameras to mitigate cheating [
27]. Kharbat and Daabes proposed e-proctoring tools, but ultimately, students were worried about their privacy [
28]. This may also raise the question: when is exam surveillance too much [
29]? Ultimately, cheating can be mitigated but cannot be stopped completely [
15].
As can be observed, several studies tackled the idea of cheating mitigation; therefore, the goal of this article is not to develop new methods to minimize or prevent it. In fact, the authors explore when course materials are accessed relative to exams: if the course materials are accessed during exams, that would mean cheating has occurred. Therefore, the online interaction with the course materials are investigated, and the authors set up five research questions (RQs):
RQ1: Do students learn before online exams?
RQ2: If they do, when do they access/learn the course materials?
RQ3: If they learn before the exam, would they cheat if they had the chance?
RQ4: Regarding cheating, does it matter whether a subject is theoretical or practical?
RQ5: Is cheating influenced by which semester the students are in?
2. Materials and Methods
After the RQs were formulated, four subjects were selected for the investigation. Then, prerecorded videos were uploaded privately to YouTube, while slides were uploaded in a PDF format to the university’s online Moodle system, both on a (mostly) weekly basis. Links to the videos were also placed in this system; therefore, only the students could access them. Sometimes a week was skipped due to other activities or breaks, but in those cases, two weeks’ worth of educational material (slides and videos) were uploaded the following week. All materials were only accessible to the students and teachers. Since both prerecorded videos and slides were uploaded beforehand, these four university subjects were structured as follows: the students could read/watch the educational materials any time before each occasion, while they could ask questions during the online class hours. This way, there was a form of contact between the teachers and students.
As was mentioned earlier, four subjects were chosen for the investigation: artificial intelligence, computer architectures, data automation, and the fundamentals of programming. These subjects are called first, second, third, and fourth subjects, respectively, in this article. These four subjects are also independent of each other, meaning no subject was a prerequisite for another one. Critical information about these selected subjects is shown in
Table 1.
Out of these four subjects, one was mostly theoretical. This means that the students learned definitions, methods, or ways to solve problems when attending them. Few practical examples and solutions were also taught in the last few weeks. These were contained in the uploaded slides and videos. The third subject was purely practical: no slides were uploaded. Exercises were uploaded instead of them. Videos that contained solutions to these exercises were also recorded and uploaded. The first and fourth subjects were both theoretical and practical. There were new definitions and exercises every week, and therefore, each slide contained many problems and solutions. These exercises were also explained and solved in the videos. Naturally, it was up to the students whether they practiced at home.
The advantage of both Moodle and YouTube is that the analytics are provided by them, which fits the General Data Protection Regulation (GDPR) that is used in Europe: they do not provide concise information about the students, respecting their anonymity. With Moodle, it is possible to see the number of clicks on the uploaded educational materials, while with YouTube, significantly more types of information can be accessed, although three were used in this investigation: the clicks on the videos, watch time, and average view duration.
The next step was to create groups of days. After examining both Moodle and YouTube analytics, five groups of them were made that were relative to the day of the exam: “at least 4 days before”, “3 days before”, “2 days before”, “1 day before”, and lastly, “Exam day”. The analytics were placed in these groups in the case of each subject. These groups were created simply due to student interaction: after the slides/videos were uploaded, interaction with them quickly dwindled over the days. However, it increased when the exams’ date became closer (usually 3 or 2 days before the exam).
The online exams were structured as follows: the virtual rooms were hosted by the teachers on the university’s online platform, then the students could log in. They had to be logged in throughout the exam. If they encountered a problem or had a question, they could mention it at any minute, and the teacher could answer them. Afterward, their identity was checked through their cameras, and then the password was provided so the PDF files of the questions could be downloaded from the Moodle system. Then, the students were given 90 min to solve the questions. After they solved them, they could upload the answer files to the Moodle system. Naturally, after they successfully uploaded them, they were allowed to log out. The exams were constructed as follows:
First subject: Students received random test questions in the Moodle system, and they had to select answers. They received 16 theoretical questions and 3 practical ones, all about artificial intelligence. Students could reach 50 points overall;
Second subject: There were eight questions regarding computer architectures, such as “Define and explain the Neumann-architecture”. After seeing the PDFs of questions, students had to write their answers on paper (by hand). In the end, they had to take photos of their answers and upload them to the Moodle system. Forty points could be reached overall;
Third subject: The first exam had to be solved using Microsoft Excel. Students had to use functions, macros, and forms to solve 19 small problems that were defined in the exam PDF. The second exam had to be solved with RStudio: there were 14 questions, which included creating matrices, data frames, distribution analyses, correlation tests, and searching for significant differences among data using the right tests. After each exam, the respective Excel/R files had to be uploaded. Overall, 59 points could be reached;
The fourth subject also contained small exams: these were online tests in Moodle, where the students had to select answers. They had 1 min for one question. The normal exam consisted of two parts: theoretical and practical parts. All were randomized by Moodle: each student received 20 theoretical questions and 1 practical question. In the former, program codes had to be extended by selecting correct functions from a dropdown list, while the former asked the students to code a certain problem (e.g., whether a number is even or odd) in C as well as write its pseudocode and draw its flowchart. Students had to upload their codes and drawings into the Moodle system. One hundred points could be reached overall.
One thing should be noted: the teachers told the students not to cheat or talk about the answers because they would instantly fail the exam. However, based on the results that are presented later, it is possible that they did not talk to each other about the answers because their solutions to the problems were clearly different from each other.
It should also be mentioned that since the grading systems are different around the world, the authors would like to present their version that was used during grading. This version is detailed in
Table 2 and is based on the Hungarian grading system. This means that “1” is the worst mark, while “5” is the best one. In
Table 2, the points of students are symbolized with x.
It should be noted that at the university, it is possible to hold a supplementary exam at the end of the semester for those who failed the normal exam. However, the mark received on the supplementary exam is considered final even if it is worse than what is received on the normal exam. It is not mandatory for the teacher to hold a supplementary exam.
Lastly, when all data were gathered after the exams were over, they were evaluated in the statistical program package R. In every case, the distributions of data were carefully analyzed with the Shapiro–Wilk normality test and quantile–quantile plots. Depending on the results of these mentioned normality analyses, either Welch Two Sample t-tests or Wilcoxon Rank Sum tests were used to compare the data. The former was used when the data was normal; otherwise, the latter was used. The results of the investigation are presented in the next section.
3. Results
This section is split into five subsections. The first four of them correspond to a subject at the university and have different evaluation methods. The last subsection examines the students’ results.
3.1. The First Subject
Eleven non-repeater 5th-semester business informatics students had a theoretical and practical subject. The requirement of this subject was to successfully (≥50%) complete an exam at the end of the semester. No supplementary exams were provided to the students to correct their mistakes. The slides and videos were not taken down prior to the exam. First, the clicks on the slides were investigated. They are detailed in
Table 3.
As can be seen in
Table 3, the slides were viewed throughout the semester. Almost every new slide is opened fewer times than before. This phenomenon happens until the exercises are uploaded a week before the exam. Afterward, the exercises’ slides became the most clicked ones during the semester, although the solutions are not as viewed as the problems themselves. It should be noted, however, that the solutions were presented in the last lesson before the exam. As was suspected, great significant differences exist in most cases, but no significant differences can be observed among “2 days before” and “1 day before” (
p = 0.4881) as well as “1 day before” and “Exam day” (
p = 0.1212).
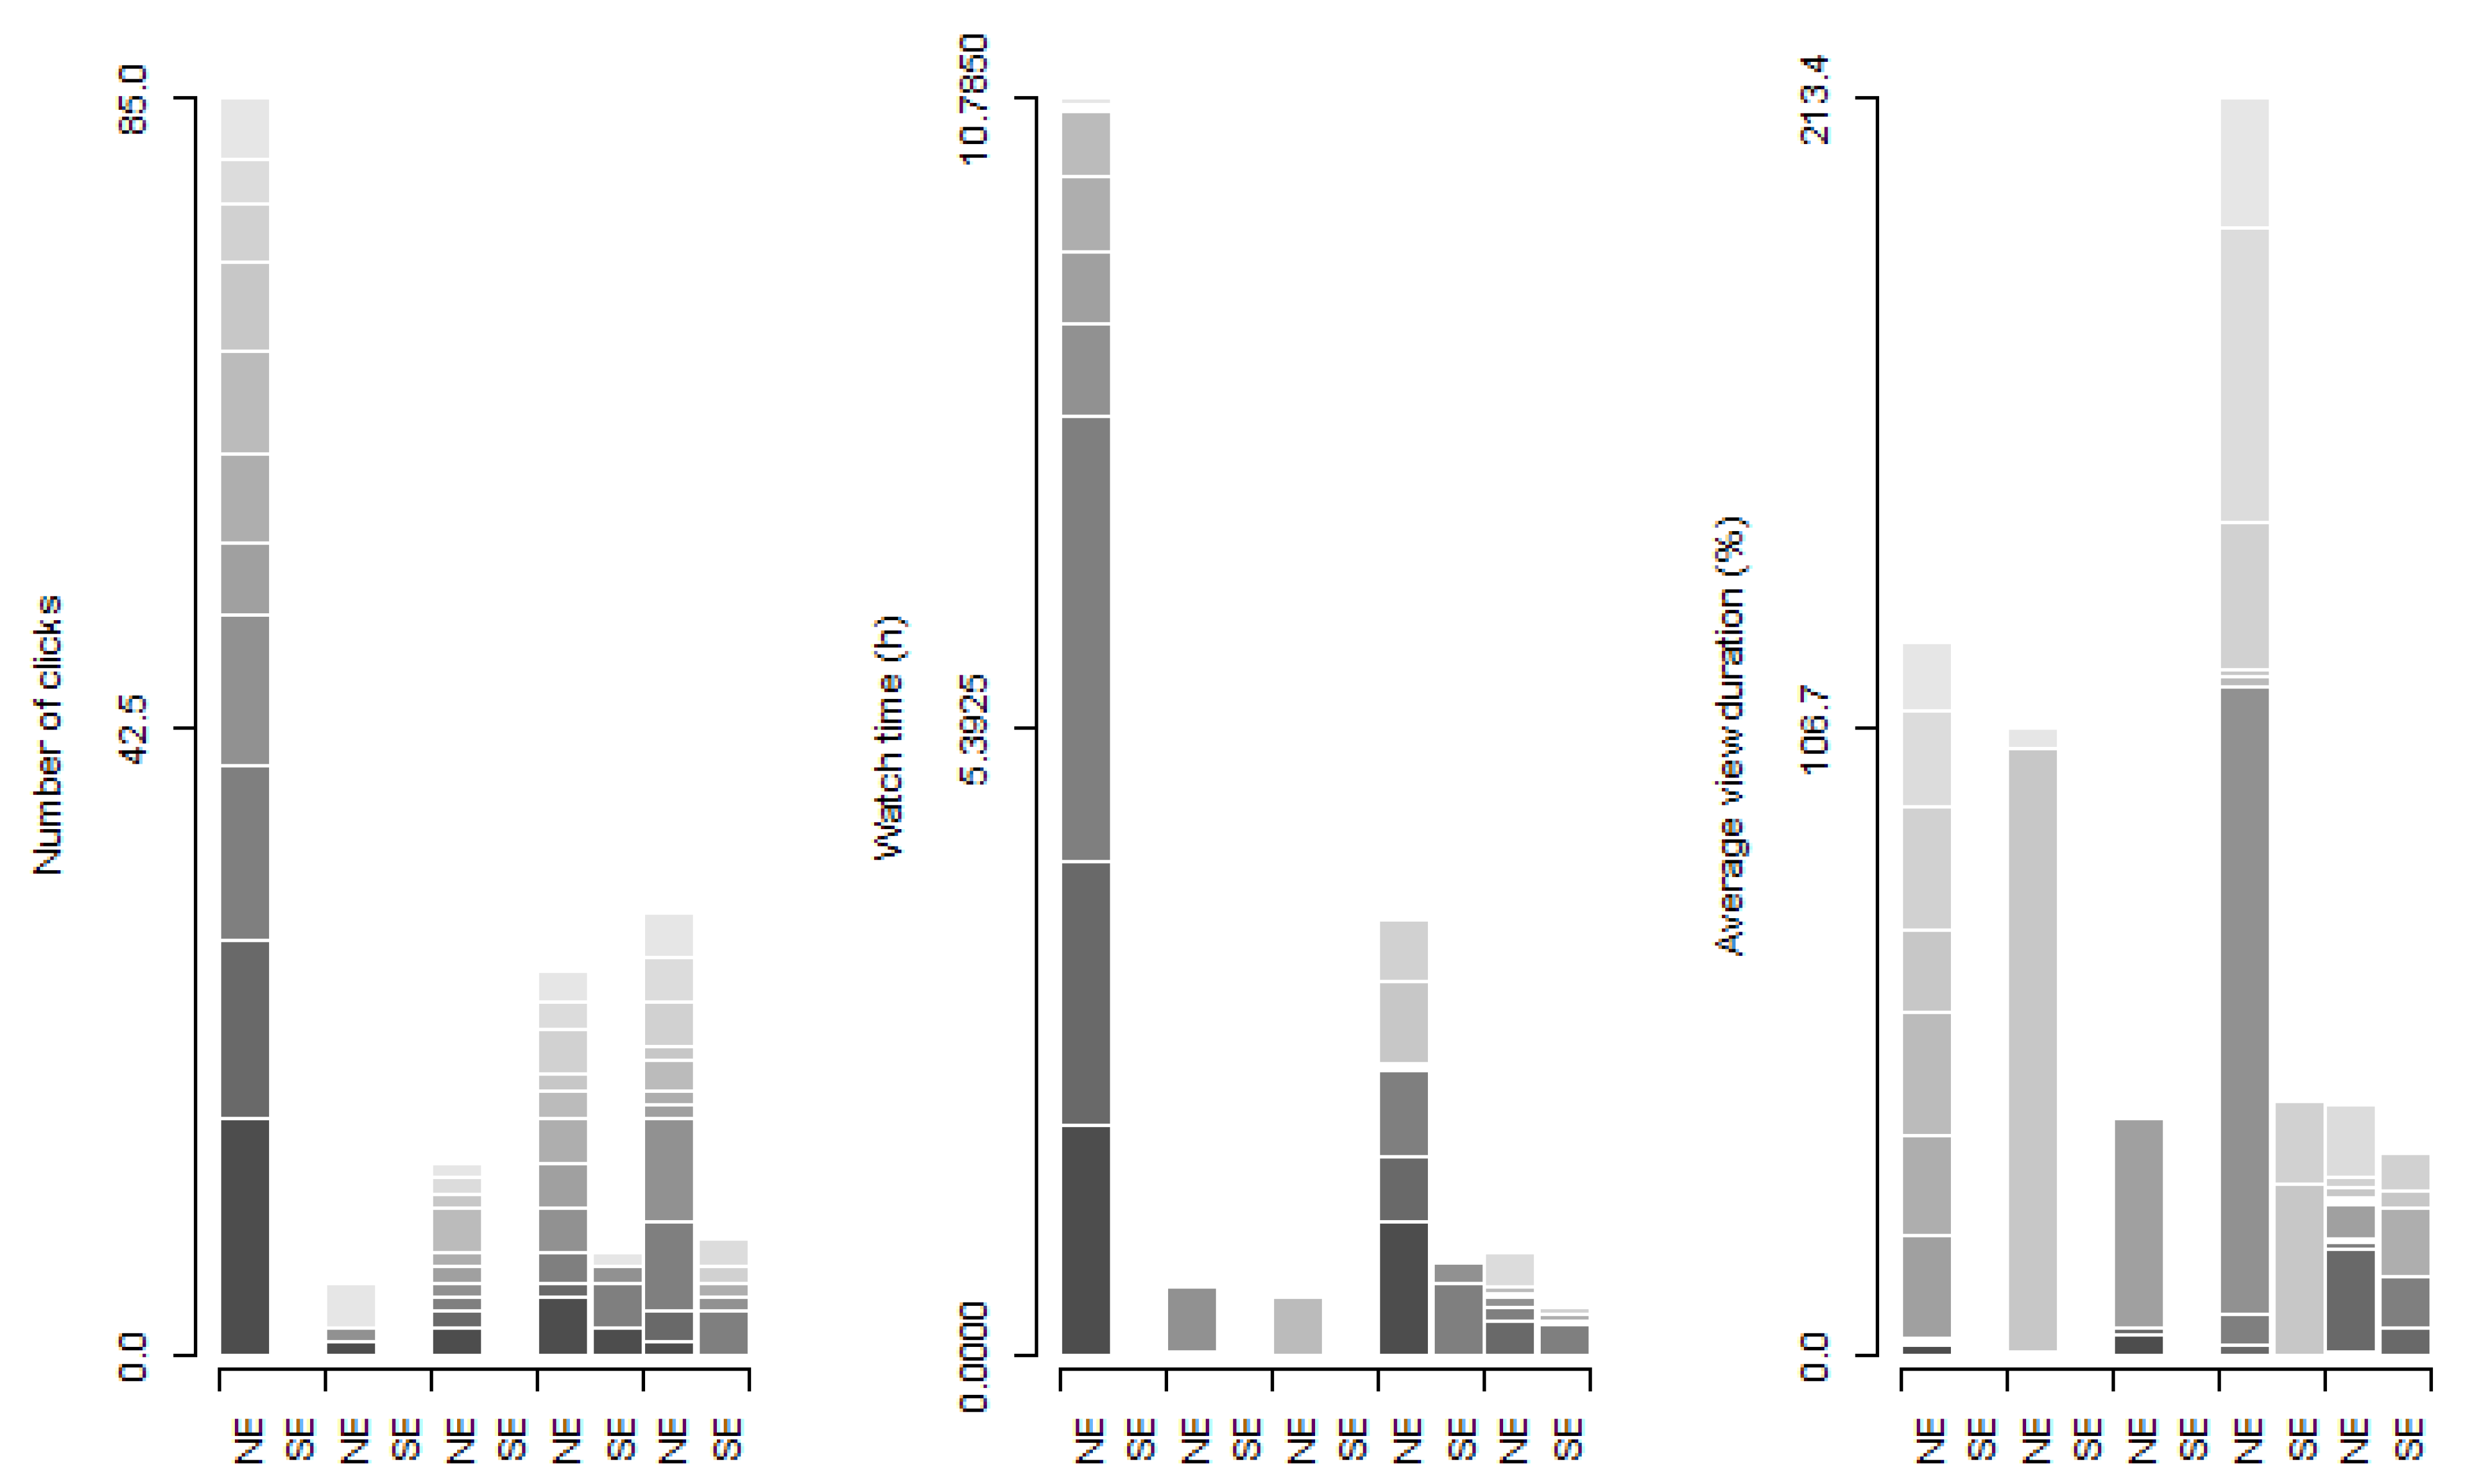
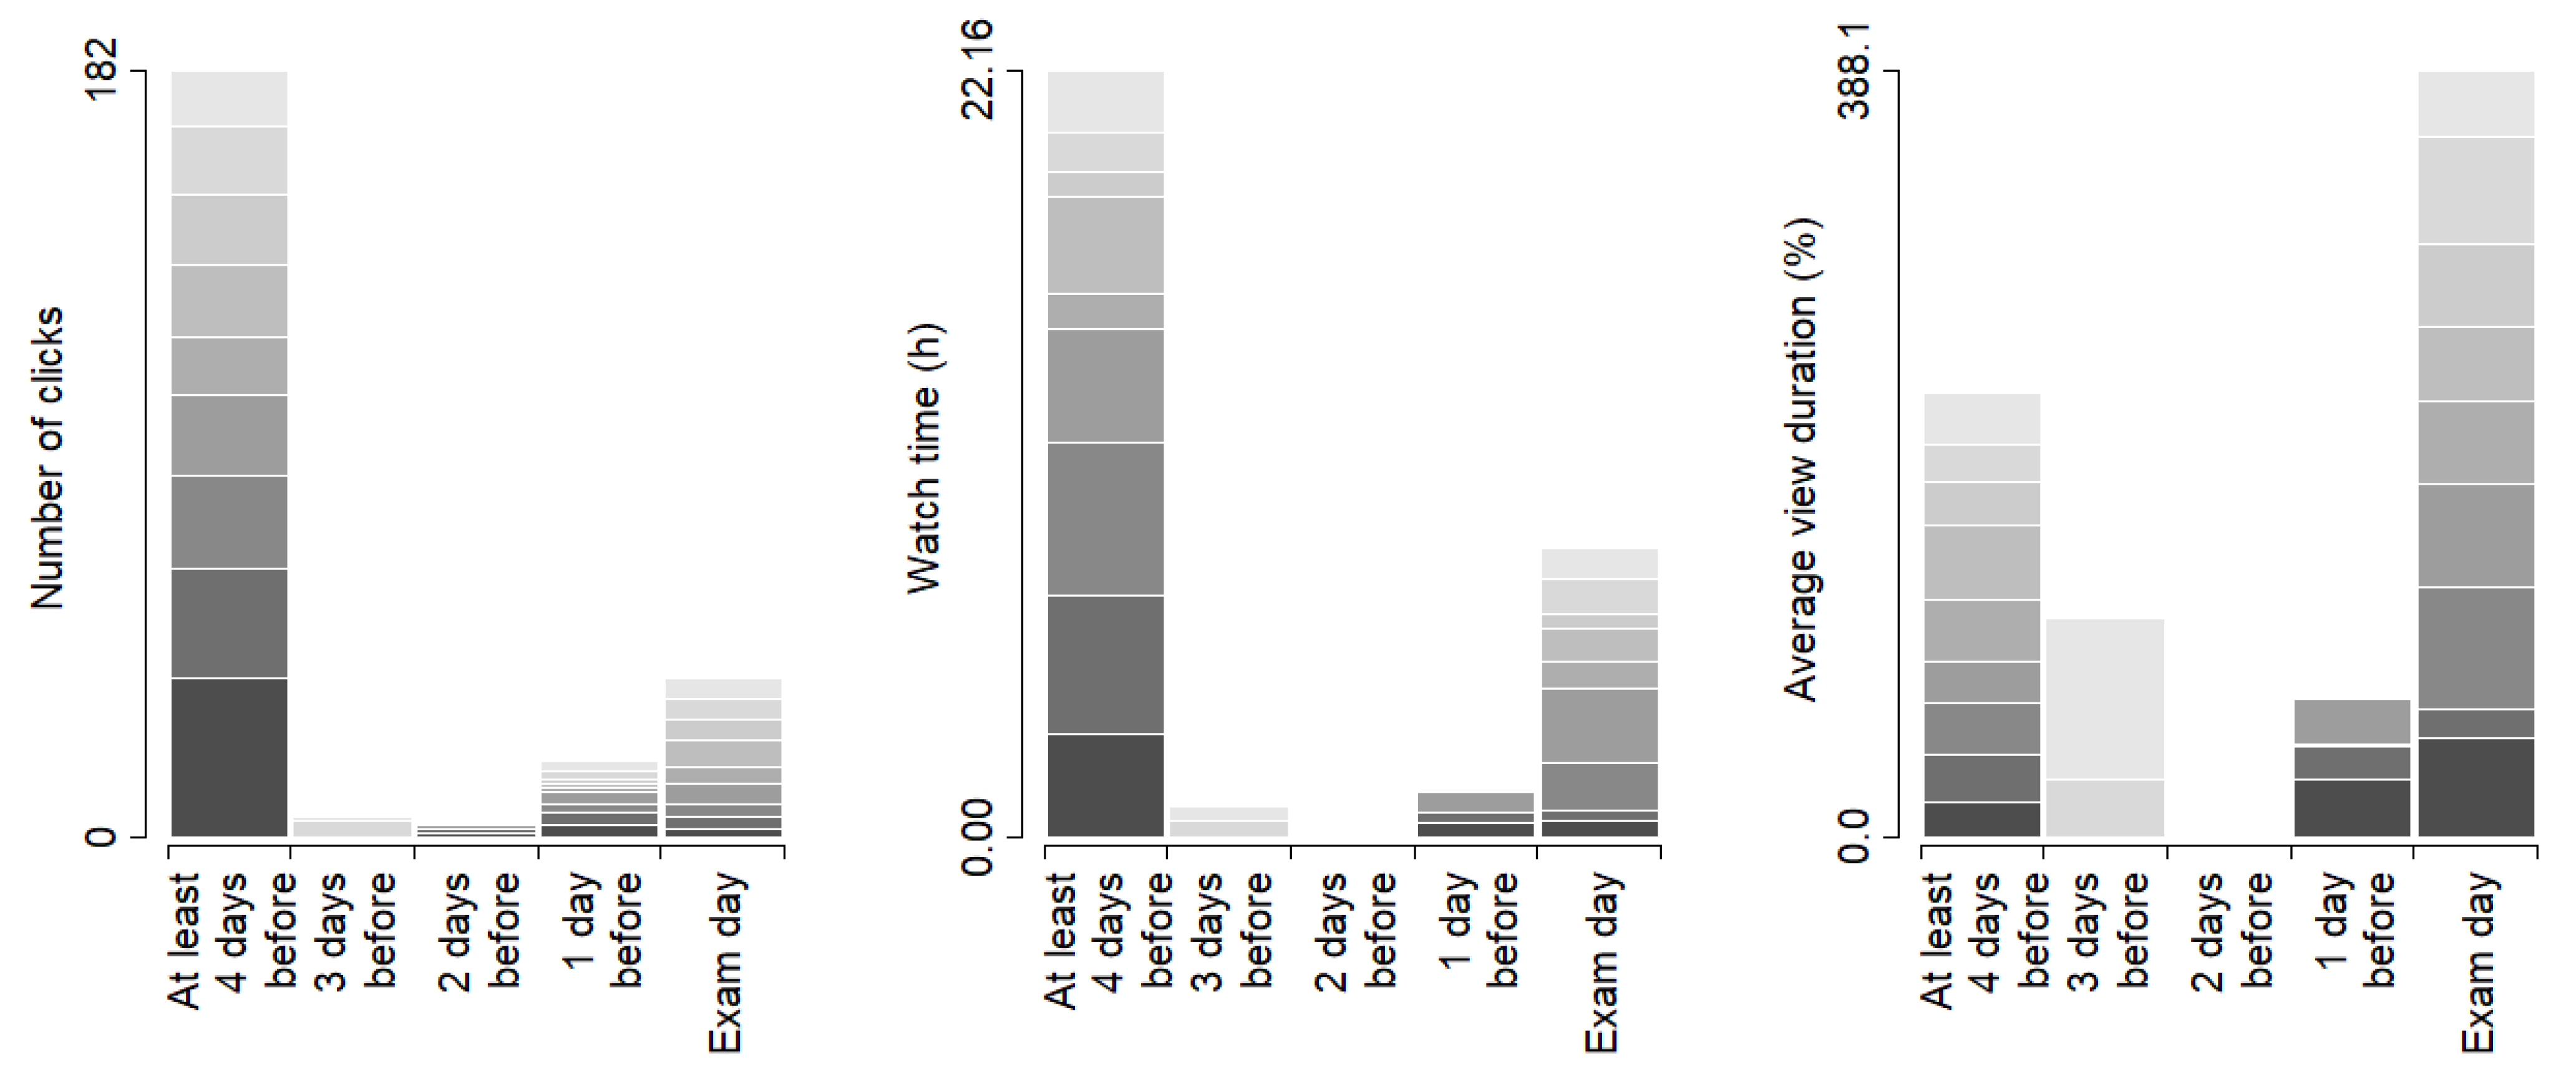
The next to investigate was the YouTube analytics regarding this university subject. Nine prerecorded videos were uploaded (one every week). These weekly videos are represented by various shades of grey in
Figure 1. The darkest one is the oldest video, while the brightest one is the newest.
It is shown in
Figure 1 that the clicks on the videos are quite similar to the clicks on the slides. The significant differences are between the same groups of days as in the case of the slides. However, are there significant differences among the clicks on videos and slides? According to the results, there is only one significant difference, which is between the clicks in “2 days before” (
p = 0.005627): the slides were more viewed by 200% than the videos. The remaining pairs are not significantly different.
Next, the view times were compared. The following significant differences were found:
“At least 4 days before” and “3 days before” (p = 0.0002739);
“At least 4 days before” and “2 days before” (p = 0.0002191);
“At least 4 days before” and “1 day before” (p = 0.0003582);
“At least 4 days before” and “Exam day” (p = 0.01061);
“3 days before” and “Exam day” (p = 0.001233);
“2 days before” and “Exam day” (p = 0.0002191);
“1 day before” and “Exam day” (p = 0.002415).
It is noticeable that the “At least 4 days before” group is always significantly different when paired with another one; however, a similar case can be observed with “Exam day”. This means that the videos were the second most-watched on the day of the exam.
Even though the watch time is longer in the first group, it can be observed in
Figure 1 that the average view duration is different. By analyzing the latter, it can also be concluded that it is the largest on the day of the exam: the increase in average view duration on the exam day is 72.03% compared to “at least 4 days before” the exam. This increase is also significant (
p = 0.004196). This means that the students were searching for the solutions inside the videos. It should be noted that every group is significantly different from each other, except the pair of “3 days before” and “2 days before” (
p = 0.9109).
3.2. The Second Subject
This mostly theoretical subject was attended by 14 non-repeater 2nd-semester business informatics students. Similarly, the requirement was to successfully (≥50%) complete an exam at the end of the semester. However, a supplementary exam was provided to the students to correct their mistakes. As with the first subject, the slides and videos were not taken down prior to the exams. First, the clicks on the slides were investigated both before the normal exam and supplementary exam. This can be seen in
Table 4.
According to the results of the investigation, great significant differences exist between almost all pairs, except among “3 days before” and “1 day before” (
p = 0.8604). The results also show that the slides were most clicked on the day of the exam: it is a 210% increase compared to “at least 4 days before” (which means almost the whole semester). Clearly, the students cheated on the exam. As can also be observed, the students rarely opened the slides between the two exams. Even the “at least 4 days before” groups are significantly different from each other (
p = 0.001133). “Exam day” groups are also significantly different (
p = 0.001804): the slides were averagely more viewed by 63.15% on the normal exam than on the supplementary one. Those who decided to take the supplementary exam either did not attend the normal one or received a “1” mark. Five people took the supplementary exam, as two did not attend. It is suggested by the bottom half of
Table 4 that they also cheated.
Next, the data regarding the videos were analyzed. Similarly to before, the number of clicks, watch time, and average view duration were investigated. These data can be observed in
Figure 2. NE stands for normal exam, while SE means supplementary exam.
When comparing the clicks on the slides and videos to each other, the following conclusions were made (
Table 5):
According to the data presented in
Table 5, significant differences exist between the clicks on the slides and videos in “2 days before”, “1 day before”, and “Exam day” groups regarding the normal exam, with
p = 5.73 × 10
−5,
p = 0.001685, and
p = 7.213 × 10
−5, respectively. Similarly, significant differences regarding the supplementary exam can be observed in “at least 4 days before”, “1 day before”, and “Exam day” groups, with
p = 5.695 × 10
−5,
p = 0.02232, and
p = 6.581 × 10
−5, respectively.
At least 4 days before the normal exam, the videos were more opened by 41.66% than the slides. However, at least 4 days before the supplementary exam, no videos were clicked on, while there were 12 clicks on the slides. Contrarily, on the day of the normal exam, the slides were more clicked on by 520% than the videos, while the number of clicks on slides was 1325% more than on videos during the supplementary exam day. This suggests that the slides are easier to cheat from than the videos in the case of (mostly) theoretical subjects.
When analyzing watch times, the following conclusions are made: the students watched significantly more of the videos before the normal exam. The group of “at least 4 days before” is significantly different than almost every other one, except “1 day before” (p = 0.1145). While the watch time in “1 day before” is greater by 313.73% than on the day of the exam, they are not significantly different from each other (p = 0.4489). Regarding the videos before the supplementary exam, they were only watched one day before and on the exam day. There is still no significant difference between them (p = 0.7126), but more time is watched by 72.82% on the day before the supplementary exam.
In the case of the average view duration, the “1 day before” group is the largest regarding both exams. Regarding the normal exam, there are significant differences in average view duration among the following categories:
“At least 4 days before” and “3 days before” (p = 0.004705);
“At least 4 days before” and “2 days before” (p = 0.01241);
“3 days before” and “1 day before” (p = 0.02287);
“3 days before” and “Exam day” (p = 0.01537);
“2 days before” and “Exam day” (p = 0.04465).
Regarding the supplementary exam, there are significant differences in average view duration among the following categories:
“At least 4 days before” and “1 day before” (p = 0.03591);
“At least 4 days before” and “Exam day” (p = 0.01576);
“3 days before” and “1 day before” (p = 0.03591);
“3 days before” and “Exam day” (p = 0.01576);
“2 days before” and “1 day before” (p = 0.03591);
“2 days before” and “Exam day” (p = 0.01576).
The average watch duration among the two exams was also compared, but only in the “1 day before” and “Exam day” groups. A significant difference exists in the former (p = 0.02953): the average view duration was 386.10% larger before the normal exam than before the supplementary one. While the average view duration was larger by 25.14% on the normal exam day than on the additional ones, it was not significant (p = 0.2593).
3.3. The Third Subject
This subject was purely practical. This means that no theoretical slides were uploaded. Instead, only exercises were uploaded. They were not solved by default, meaning that the students had to solve them based on the uploaded videos. Fifteen non-repeater 5th-semester business informatics students attended this subject. The requirement of this subject was to successfully complete two normal exams (≥50% on each). A supplementary exam was provided on the last week of the semester to correct mistakes. The practical problems and videos were not taken down prior to the exam. First, the clicks on the practical problems were investigated, and the results can be seen in
Table 6. It should be noted that practical examples were only uploaded before the first normal exam. Students had to follow the videos in the next half of the semester.
According to the results, significant differences exist among all pairs that contain “at least 4 days before”, and between the pair of “3 days before” and “2 days before”. The differences among all other pairs are insignificant. It should be pointed out that these files only contain exercises, meaning that their solutions are not included. Therefore, the fact that some students downloaded them on the day of the exam is quite interesting. Perhaps, they were those students who did not learn beforehand, wanted to cheat, but in the end, they failed the first normal exam. There were seven of those students.
At the end of the semester, a supplementary exam was held. As seen in
Table 6, the exercises were downloaded fewer times. The number of downloads between the normal exam “Exam day” and the supplementary exam “Exam day” groups is not significantly different (
p = 0.1231). The same case applies to the “1 day before” categories (
p = 0.3824).
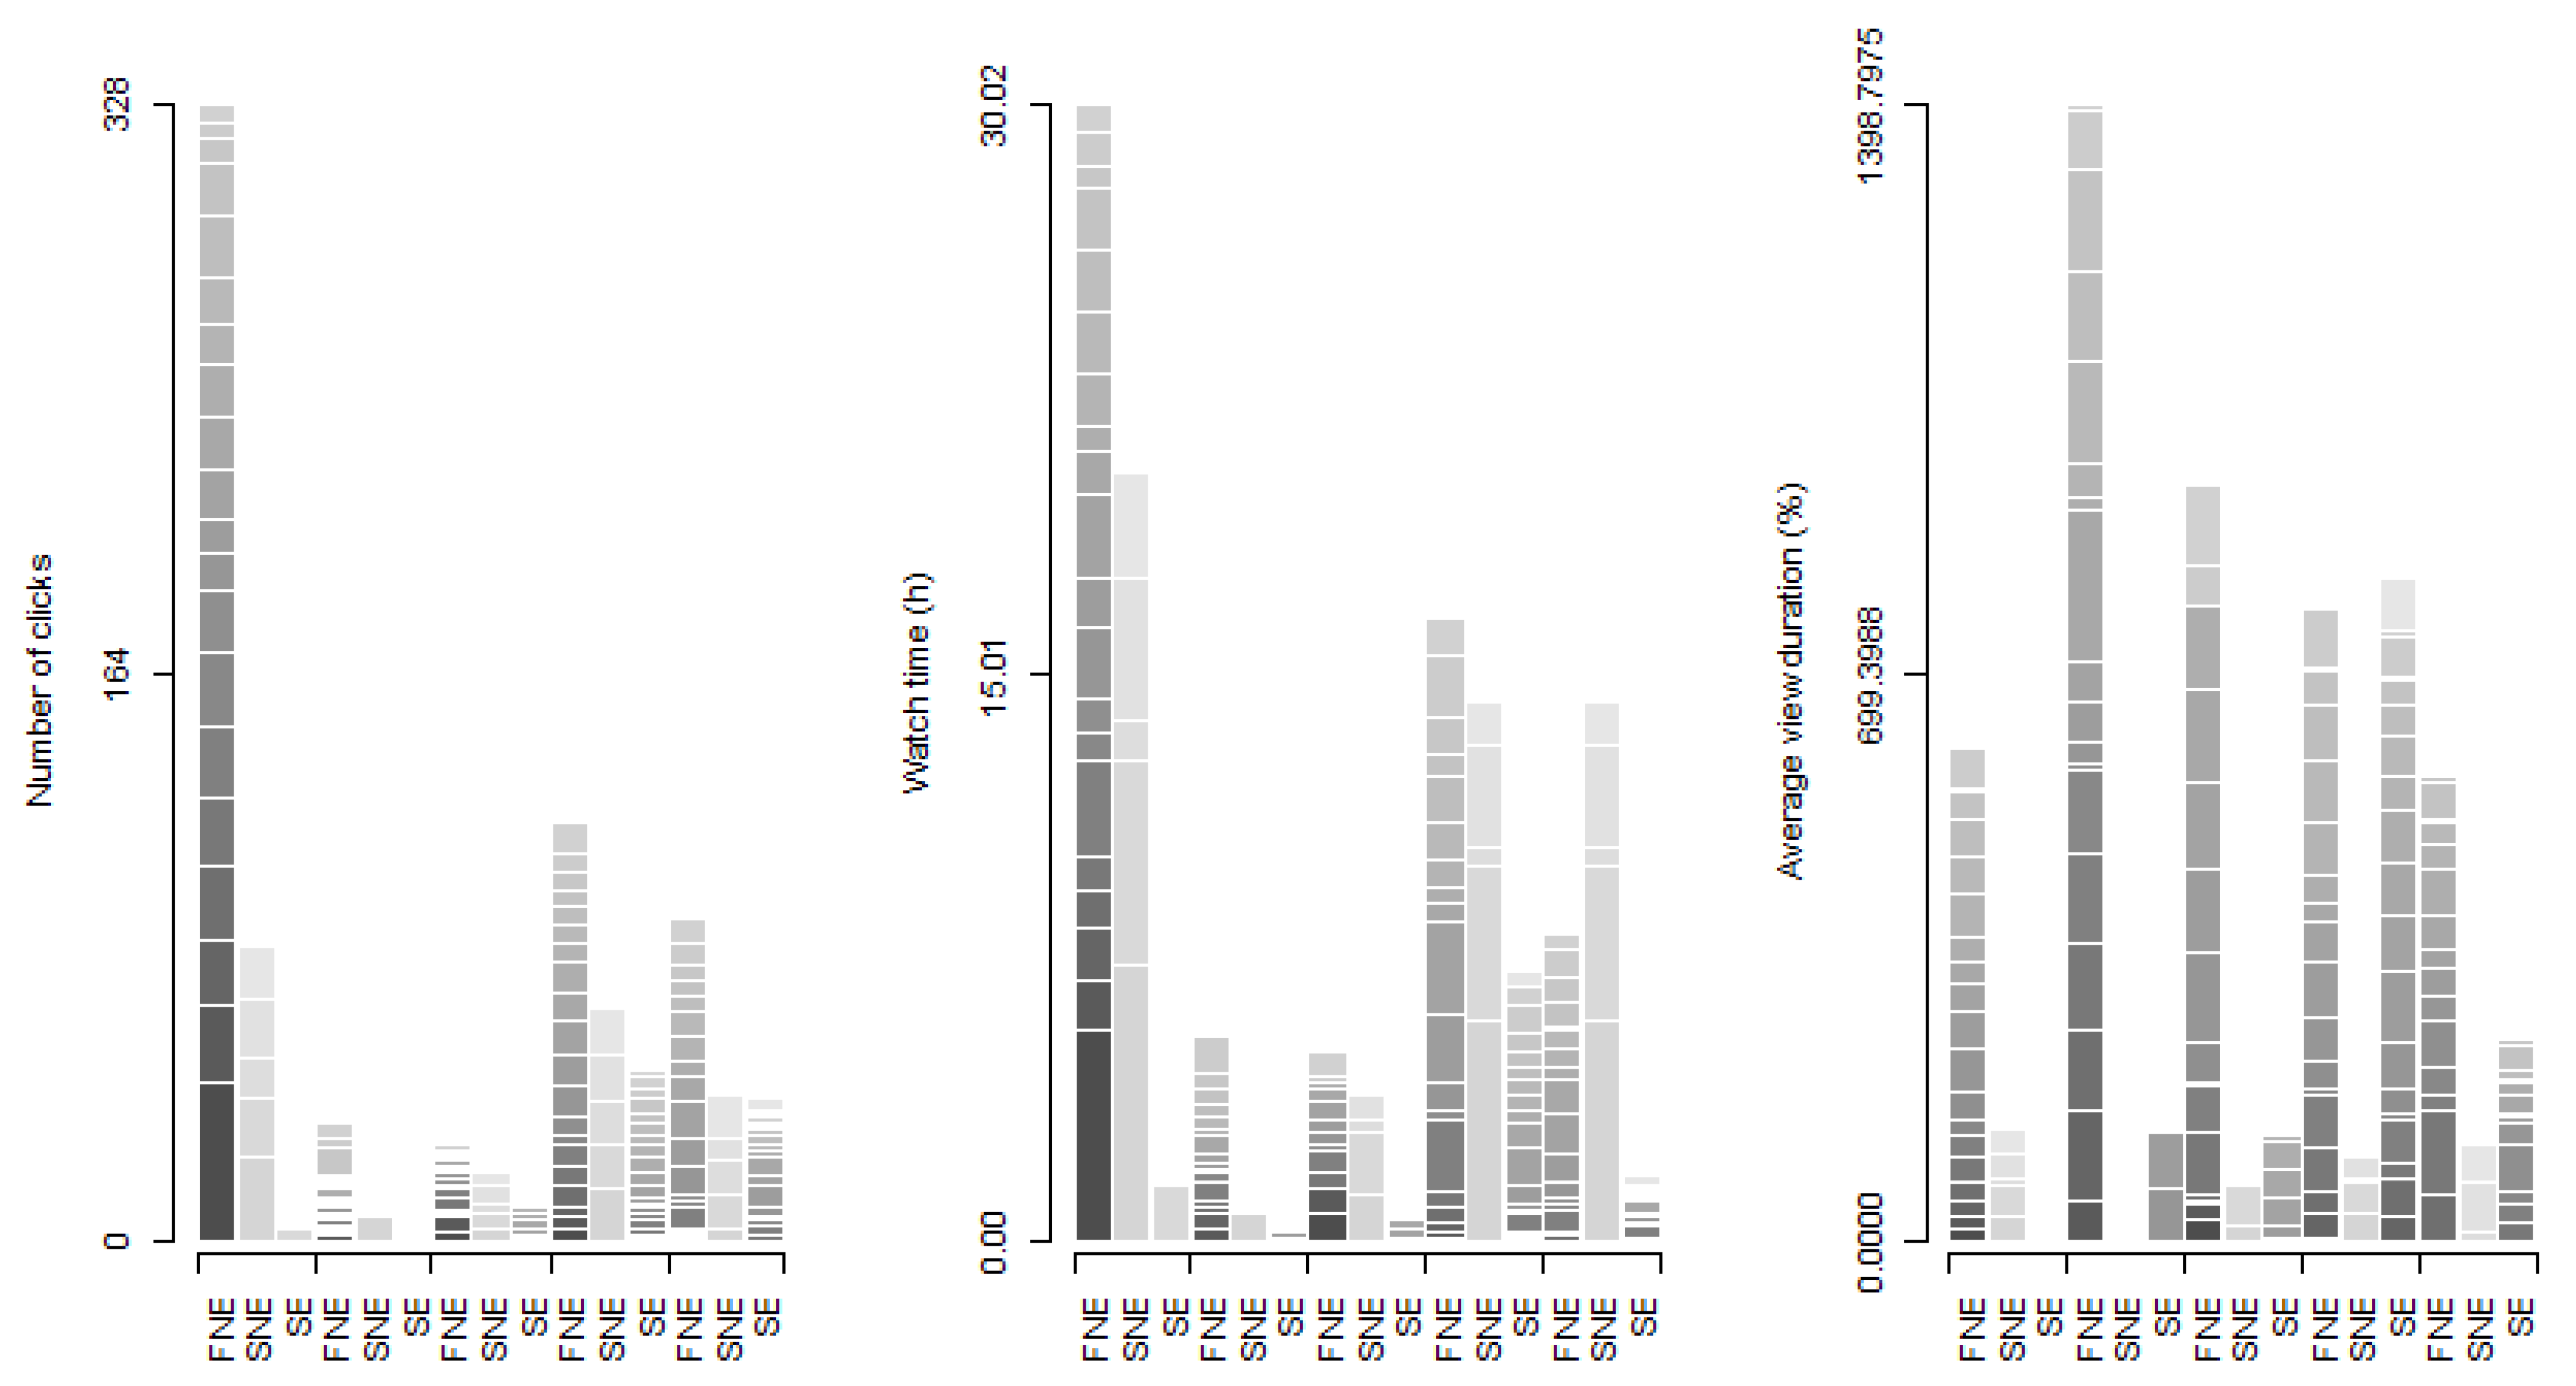
Since no slides existed in the case of this subject, the clicks between them and the videos were not compared. Therefore, this part of the investigation was omitted. Afterward, the data from YouTube was analyzed. Videos of weeks 1–6 were part of the first normal exam. Contrarily to before, these videos were uploaded in 20 smaller parts due to editing problems. Videos of weeks 7–10 were part of the second normal exam. These were also uploaded in five parts due to similar problems. The supplementary exam consisted of all uploaded videos. The video analytics are shown in
Figure 3. Three abbreviations are used in this case: first normal exam (FNE), second normal exam (SNE), and supplementary exam (SE).
First, the clicks on the videos were analyzed. Regarding the videos before the first normal exam: there are great significant differences among almost all possible pairs of groups, except among “3 days before” and “2 days before” as well as between “1 day before” and “Exam day” (
p = 0.6879 and
p = 0.1041, respectively). Regarding the videos before the second normal exam, almost every possible pairs are significantly different from each other, except between “at least 4 days before” and “1 day before” as well as among “3 days before” and “2 days before” (
p = 0.1439 and
p = 0.1264, respectively). Regarding the videos before the supplementary exam: significant differences exist among all possible pairs, except among “at least 4 days before” and “3 days before” as well as between “1 day before” and “Exam day” (
p = 0.3427 and
p = 0.2799, respectively). According to
Figure 3 and these facts, it can be concluded that the videos before the two normal exams were more viewed at least 4 days before them. This is not the case regarding the videos before the supplementary exam: they were most clicked on 1 day before it. Based on the clicks alone, students studied for the supplementary exam a day before. This fact is also strengthened by the watch time: it is also the largest on the day before the supplementary exam, and it is significantly different from the other groups. Moreover, it is the second largest on a day before the two normal exams. Regarding the first normal exam, the watch time on “1 day before” is significantly different from the other groups. Regarding the second normal exam, the only significant difference in watch times is among “3 days before” and “1 day before” groups.
When the average view duration is analyzed, it also suggests that the students significantly studied more one day before the supplementary exam (p = 0.008112). If the first normal exam is investigated, it can be concluded that the average view duration of videos is significantly larger in the category of “3 days before” than the category of “Exam day” (p = 0.01015). If the second normal exam is investigated, neither average view duration groups differ significantly from “Exam day”.
3.4. The Fourth Subject
This subject was both theoretical and practical: both the uploaded slides and videos contained practical examples. As in the subsection before, the problems were not solved by default; therefore, the students had to solve them based on the uploaded videos. This subject was attended by 21 non-repeater 2nd-semester business informatics students. The requirement of this subject was more complex than the others: the students had to complete three small assignments, two small exams, and a large exam. The large exam consisted of two parts: a practical and a theoretical one. Their points were summed, and they had to reach ≥50% of all the points. A supplementary exam was provided on the last week of the semester to correct mistakes; however, only the practical part of the large exam could be corrected. As before, the practical problems and videos were not taken down prior to the exams. First, the clicks on the slides were investigated, and the results can be observed in
Table 7.
According to the clicks presented in
Table 7, the students studied at least 4 days before the first small exam. However, many slides were opened on the first small exam day. These numbers changed regarding the second small exam. As can be seen, after experiencing the first small exam, the students (almost) only opened the slides on the second small exam day. Their behavior remained the same on the normal exam day: they mostly only opened the slides on the normal exam day. However, something changed after this exam: the students opened the slides before the supplementary exam day. Naturally, the number of clicks was not that many as in the case of previous exams because only five students participated in the supplementary exam.
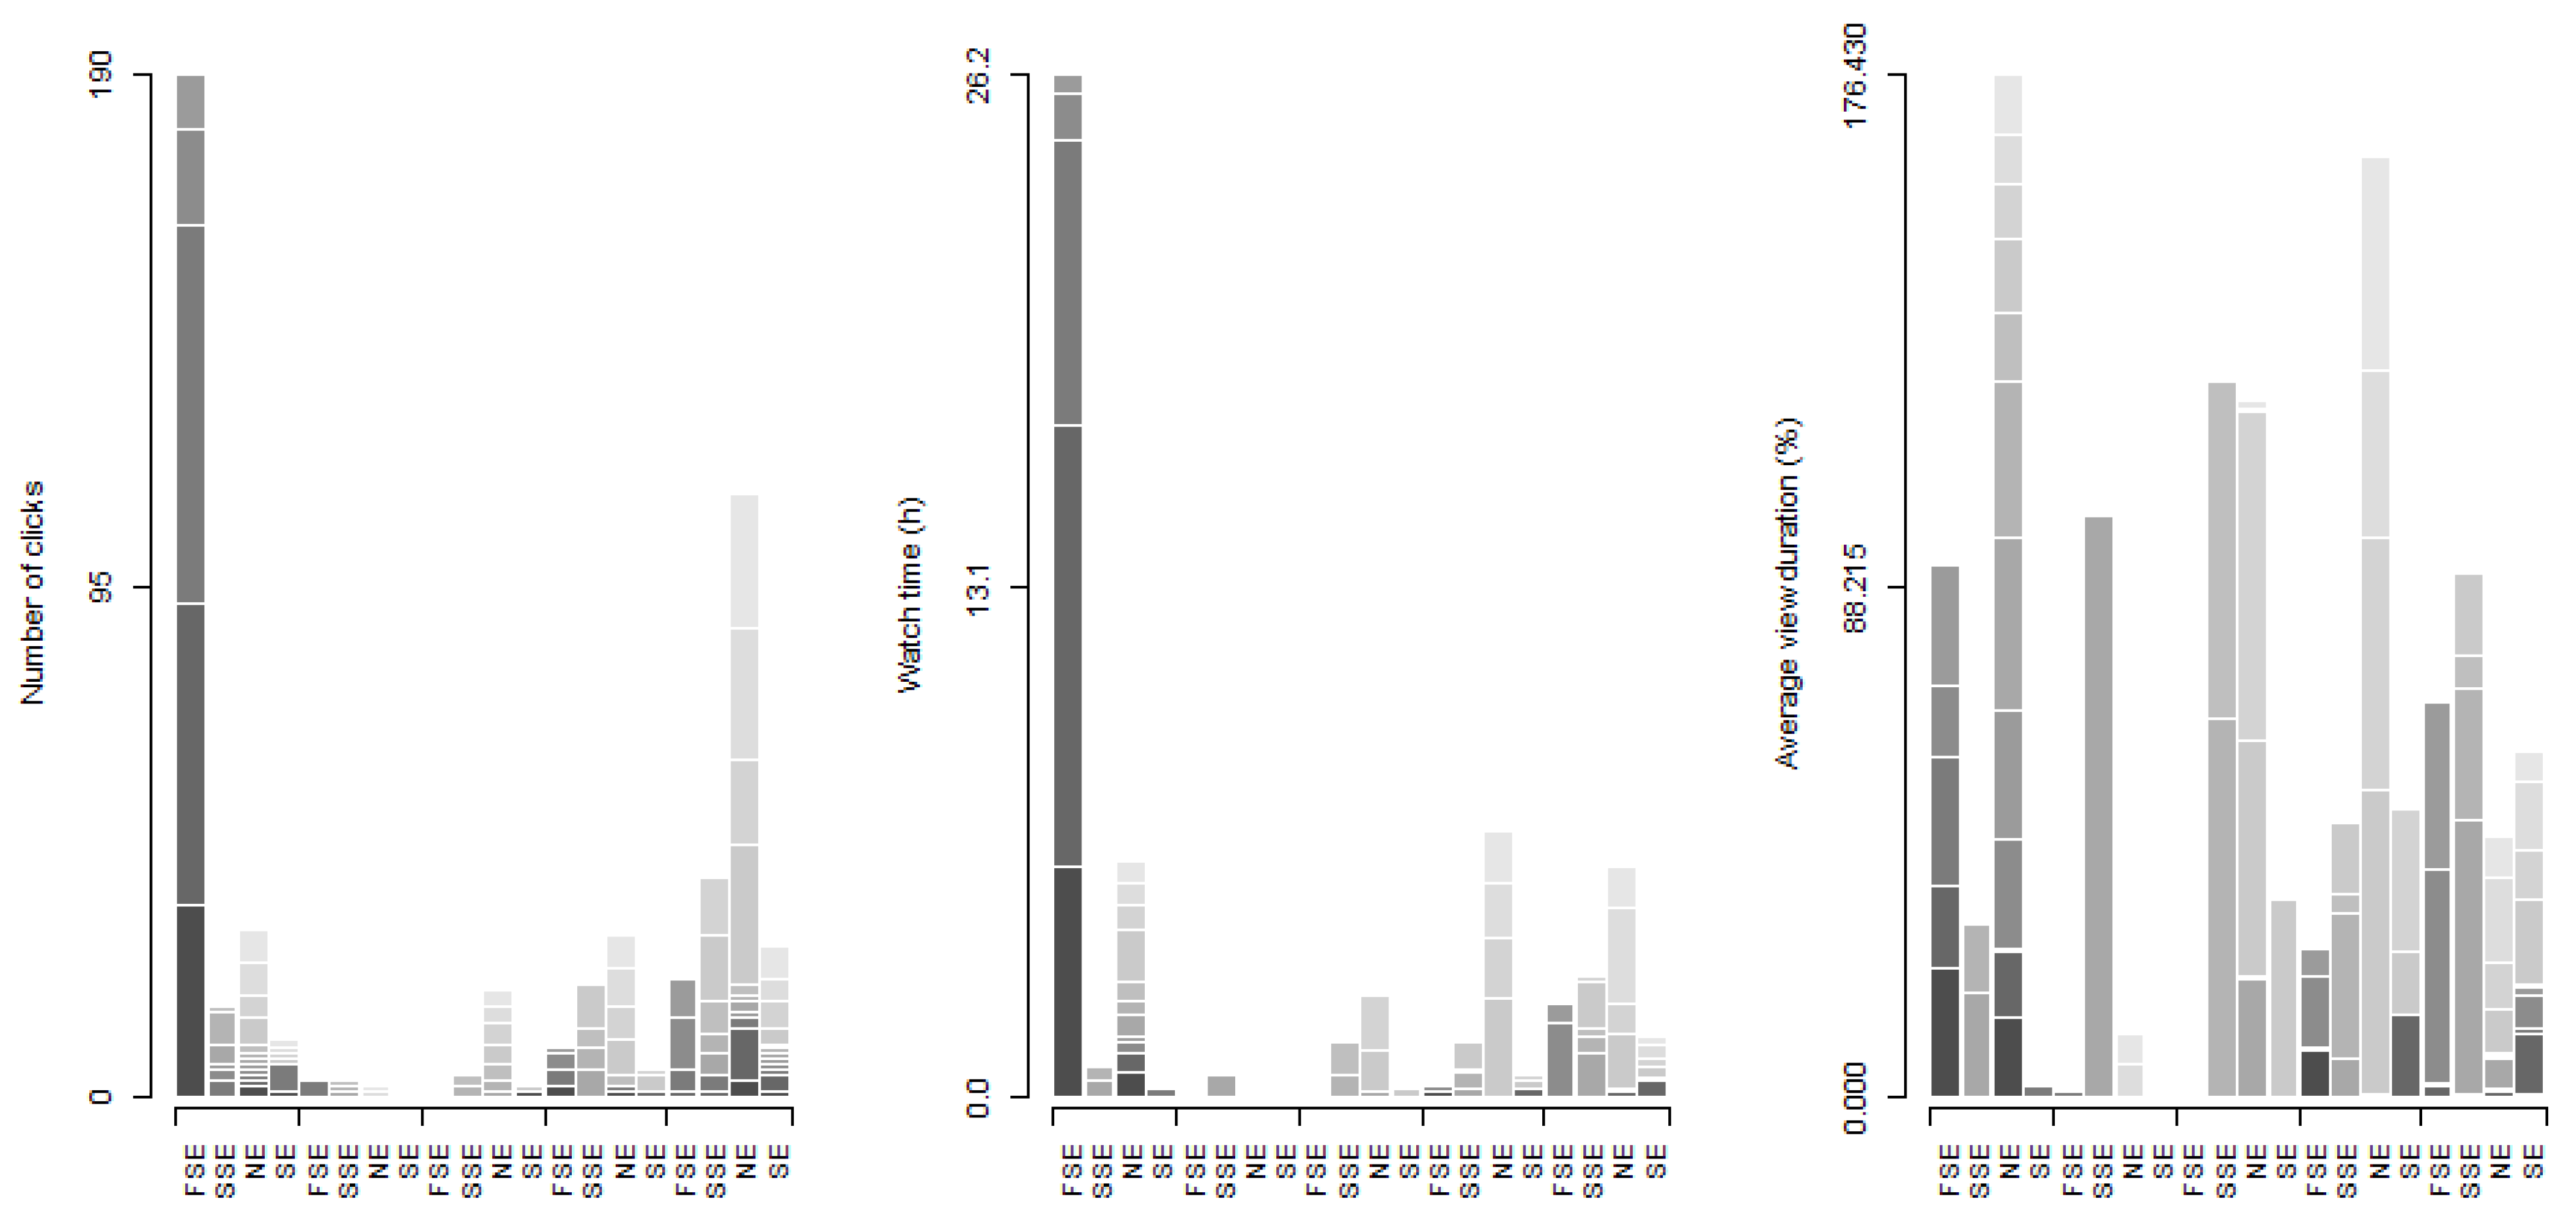
Next, the data regarding the videos were analyzed. Similarly to before, the number of clicks, watch time, and average view duration were investigated. These data can be seen in
Figure 4. Four abbreviations are used in this case: first small exam (FSE), second small exam (SSE), normal exam (NE), and supplementary exam (SE).
Next, the clicks on slides and videos were compared. The results of this investigation are presented in
Table 8.
As can be seen in
Table 8, no significant differences exist between the clicks on slides and videos in the case of the 2nd small and supplementary exams. In the case of the 1st small exam, significant differences exist in the groups of “2 days before”, “1 day before” and “Exam day” (
p = 0.009277,
p = 0.00432, and
p = 0.0001994, respectively). In the group of “2 days before”, 0 people clicked on the videos, while 16 clicks were found on the slides. One day before the 1st small exam, the numbers of clicks were 9 and 22, respectively (144.44% more clicks were found on the slides). Regarding the exam day, 22 and 84 clicks were found on the videos and slides, respectively. This means that 281.81% more clicks were found on the slides.
In the case of the normal exam, significant differences among clicks were only found in the “At least 4 days before” and “Exam day” groups (p = 0.001263, and p = 0.04389, respectively). In the group “At least 4 days before”, while 31 clicks were found on the videos, there were 0 on the slides. Regarding “Exam day”, these numbers were 112 and 106, respectively. This means that the students used every information available at their disposal.
According to
Figure 4, it can be stated that the videos before the first small exam were the most viewed at least 4 days before it. The case is almost the same before the normal exam. However, in that case, the videos were most watched one day before it. The videos were most watched on the exam days when the second small and the supplementary exam were examined. Clearly, the videos were largely watched on the day of the exams. A similar phenomenon can be observed when the average watch duration is examined. However, the average view duration is the largest on the supplementary exam day.
3.5. Results of the Students
On the first subject (which consisted of only a normal exam), two students received a “2” mark, two received a “3” mark, two received a “4” mark, and five received a “5” mark. This means that no students failed this subject. The average of received marks is 3.90, while their standard deviation is 1.22.
Regarding the normal exam on the second subject, six students did not participate in it, one failed (“1” mark), six received a “2” mark, and one received a “3” mark. Naturally, these statistics changed after the supplementary exam: out of those who took it, three people received a “2” mark, one person a “3” mark, and another one a “4” mark. The latter student is the one who corrected their “1” mark on the normal exam. Nobody failed the supplementary exam. This also means that nobody received worse marks on it. Only the two students who did not participate in the exams failed this subject. The average of received final marks is 2.33, while their standard deviation is 0.65.
On the third subject, students received the following on the first exam: seven “1” marks, three “2” marks, four “3” marks, and one “4” marks. The following were received on the second exam: one “1” mark, one “2” marks, two “3” marks, three “4” marks, and eight “5” marks. Seven students had to attend a supplementary exam because of “1” marks; however, all of them corrected it. Therefore, the final number of various marks were: no “1” marks, two “2” marks, three “3” marks, six “4” marks, and four “5” marks. This means that the average of received final marks is 3.80, while their standard deviation is 1.01.
The following marks were received on the fourth subject after the first normal exam: two students did not attend the exam, three received a “1” mark, three received a “2” mark, five received a “5” mark, four received a “4” mark, and five received a “5” mark. Five students attended the supplementary exam, and two students who received “2” marks on the normal exam received “3” marks on the supplementary exam. The other marks remained the same. This means that the average of received final marks is 3.04, while their standard deviation is 1.43.
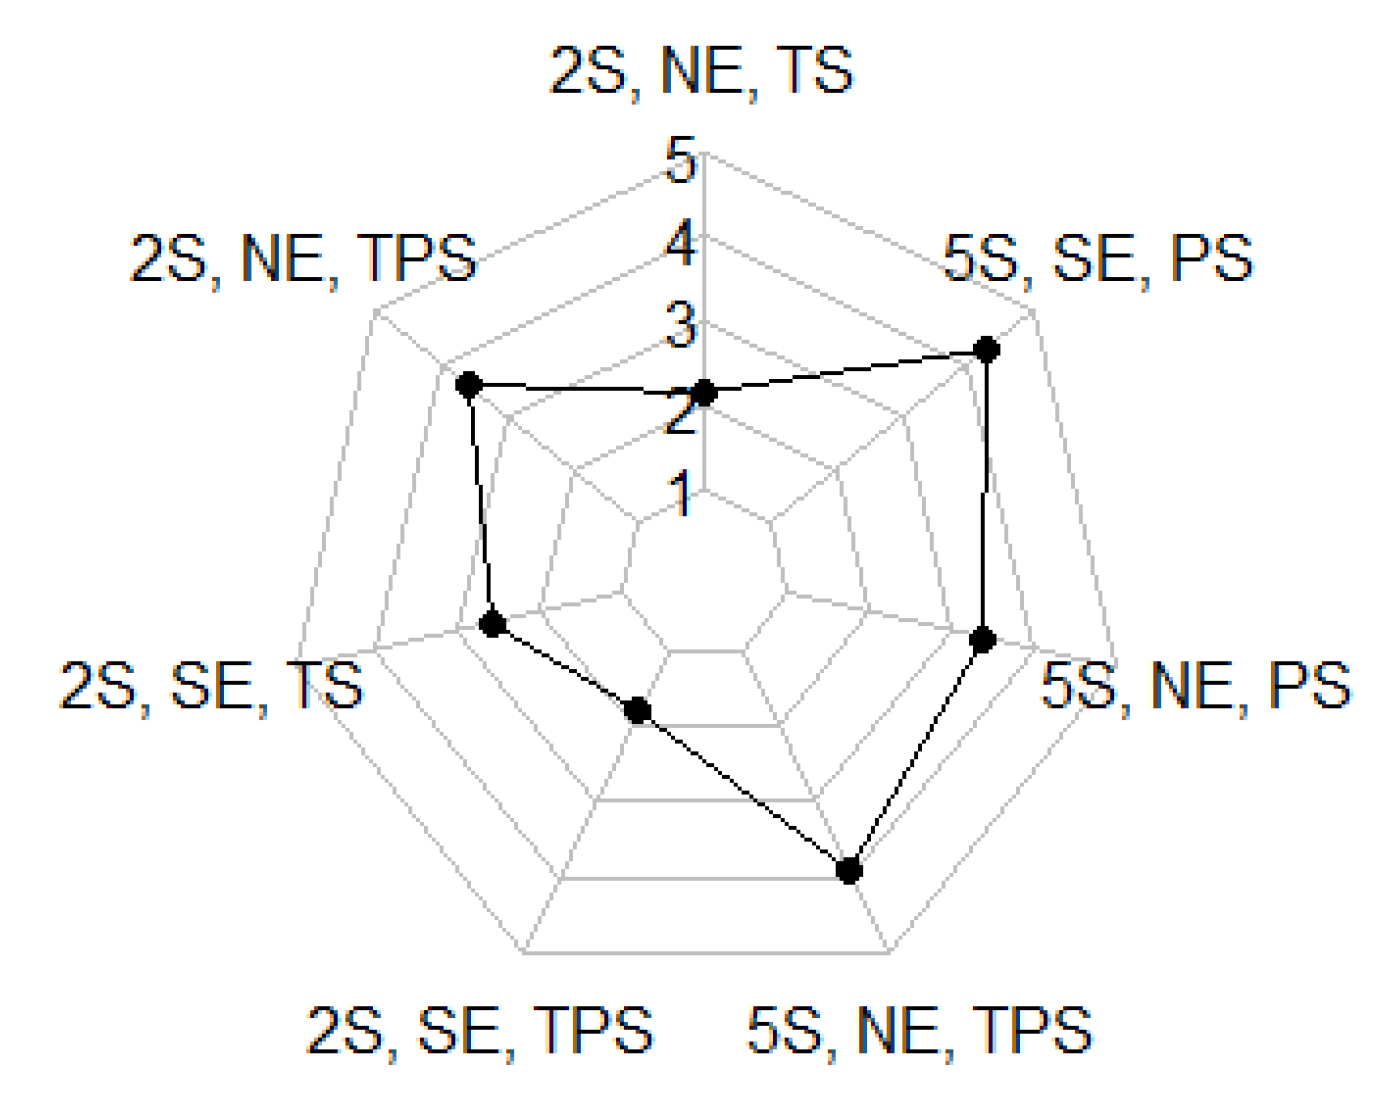
Lastly, the received marks of the students were assessed grouped by their semester number, exam type, and subject type. Their results are presented in
Figure 5. The abbreviations are the following: 2S (2nd semester), 5S (5th semester), NE (Normal Exam), SE (Supplementary Exam), TS (Theoretical Subject), PS (Practical Subject), and TPS (Theoretical and Practical Subject).
As can be observed in
Figure 5, all existing combinations are presented. According to the data, the best average of marks is received by 5S, SE, PS (students in their 5th semester, on the supplementary exam, on a practical subject), while the worst average marks are received by 2S, SE, TPS (students in their 2nd semester, on the supplementary exam, on a theoretical and practical subject).
Moreover, according to
Figure 5, students in their 2nd semester received significantly worse marks by 26.06% than those who are in their 5th semester (
p = 0.002838). Students also received worse marks on the supplementary exam by 9.77% than on the normal exam. This difference is not significant as
p = 0.42. The differences among subject types are the following:
p = 0.07213 between theoretical and practical;
p = 0.008938 between theoretical and both theoretical and practical; and
p = 0.4323 between practical and both theoretical and practical subjects. As can be seen, there is only one significant difference among subject types: it exists between theoretical and both theoretical and practical subjects. Students, however, reached an average mark of 3.8 on the practical subject, which is the largest average. The smallest average is in the case of theoretical subjects (3.08).
4. Discussion
When answering RQ1, it can be stated that students study before each exam as suggested by the clicks on slides and videos. According to the results, the course materials are accessed more times before each first exam. Before the second exam, however (be it a small or supplementary exam), the slides are not always accessed. The most critical case is the fourth subject, as the slides are basically only accessed before the first small exam.
Regarding RQ2, the watch times and view durations were assessed. According to
Figure 1,
Figure 2,
Figure 3 and
Figure 4, it can be stated that the students study before the exams. Before normal exams, students tend to study throughout the semester, but before supplementary exams, they tend to learn the day before. Naturally, we do not know whether they actually learn something during these periods, but it can be assumed that they at least try.
RQ1 and RQ2 should be looked at before answering RQ3. It is known from their answers that students study before the exams. However, according to the average view durations presented in
Figure 1,
Figure 2,
Figure 3 and
Figure 4, they are sometimes longer than before the exam day. In most cases, however, they are the second-largest per subjects. Moreover, a similar phenomenon can be observed in the cases of slides. In most cases, they are largely accessed on exam days. Clearly, the students cheated on the exams.
When answering RQ4, it can be stated that in the case of the theoretical subjects, mostly the slides were accessed on the exams’ day, while mostly the videos were accessed in the case of practical subjects. When the subject is both theoretical and practical, both the videos and slides were used. However, the slides were opened more times (possibly due to time constraints).
In order to answer RQ5, the clicks on videos and slides were compared. Significant differences exist among the clicks on slides on the normal exam and supplementary exam days (p = 4.686 × 10⁻¹⁰ and p = 0.02636, respectively): students who are in their 2nd semester of studies clicked more on the slides on the normal exam days while they also clicked more on them on the supplementary exam days. There are no significant differences among the clicks on videos on the normal exam and the supplementary exam days between semesters (p = 0.1453 and p = 0.7891, respectively). When their videos’ average view durations are analyzed, there is a significant difference among them on the normal exam days (p = 0.0001043): the average view duration of videos is longer by 341.33% when students watch them who are in their 5th semester. This fact means that 2nd-semester students used more slides, while 5th-semester students used more videos for cheating.
Limitations of the Study
Due to the nature of this research, no new method was conceived to mitigate or minimize online cheating. Moreover, the results of students cannot be compared due to different course structures. Even though their results are detailed and grouped by subjects in this article, the reason they are presented is to show what the students could achieve even with cheating in the case of these various courses. The conclusion is that their results are not good. Ultimately, they are only average even with cheating, and according to the literature, students are likely to cheat one way or another. This happens because of depression, stress, and anxiety, which are caused by the pandemic. Naturally, cheating could be minimized, although privacy issues could arise due to some chosen cheating mitigation methods.
Besides this, the results presented in this article open the possibility to know how and when course materials are accessed. In addition, it can also be ascertained that the motivation of students is dwindling throughout the semester since the course materials are accessed less each passing week. However, the numbers also tell that the students try to learn a few days before the exam, but this varies with exam types. This difference could change if the course materials are taken down before the exam on its day, although this was not investigated in this study.
Even if interaction with course materials is researched in the online space, a possibility exists that student learning periods are similar in the case of face-to-face education. Naturally, that is more difficult to research because their actions cannot be supervised as thoroughly. However, for the time being, it can be assumed that the students have similar learning periods in the case of face-to-face education, and therefore teachers can customize the deadline of assignments based on them.
5. Conclusions
Due to distance education, it was possible to investigate when course materials are accessed relative to exams using Moodle and YouTube analytics. Based on the results presented in this study, students studied throughout the semester for the normal exam in most cases, while they studied a day before the supplementary one. When cheating was assessed, it could be concluded that non-repeater 2nd-semester students used significantly more slides, while the videos’ average view duration was significantly longer for non-repeater 5th-semester students. Even with cheating, the students that were in their 2nd semester received significantly worse marks by 26.06% than those who were in their 5th semester. The reason for this is unknown: it is possible that they studied more, or cheated better, or simply just became more used to their university studies.
According to the results, another fact could be concluded: course materials are accessed more times before each first exam. The type of exam is not important in this case. Based on the numbers alone, students may be anxious before each first exam and try to study before it. However, after they see the type of the exam, they could know what to expect in the future. This is the reason why the weekly numbers of course material interactions are dwindling throughout the semester.
Hopefully, education will slowly transition back to face-to-face teaching. While we may have more understanding of online cheating habits, the learning periods of students will (possibly) not change when face-to-face education reappears. Due to the influence of these results, teachers around the world can prepare exams or customize the deadline of assignments based on student learning periods.


