Abstract
The purpose of this study was to analyze the effect of several macroeconomic variables consisting of gross domestic products (GDP) per capita, economic openness, government effectiveness index, inflation, and the level of education on the corruption index in G20 member countries. This study focused on the effect of education on the level of corruption in the G20 member countries by treating other macroeconomic variables as control variables that were not analyzed in depth. This research used mixed methods with multiple regression with two stage least square (2SLS) estimation method followed by phenomenological analysis. This study found that primary education enrolment and the lifelong learning index did not significantly influence the level of corruption for all G20 member countries, developed member countries, and developing member countries. Secondary education enrolment showed a negative and significant influence on the level of corruption in all categories of countries (all members, developing, and developed countries). Tertiary education enrolment had a negative and significant influence on the level of corruption in all members and developing countries, but had a positive influence in the developed countries. GDP per capita had a contrasting influence: negative and significant influence in the developed countries, but positive and significant influence in the developing countries. Similar to secondary education, the government effectiveness index had a negative and significant influence in all categories of countries (all members, developing, and developed countries). In contrast, inflation and economic openness had a positive and significant influence on the level of corruption, but only in developing countries. The policy implication of this study is the prioritization of secondary education to tackle corruption problems.
JEL Classification Code:
B22; D73; E02; E60
1. Introduction
At the national level, a high level of corruption correlates strongly with low per capita income, low average education, and low achievement of other economic development indicators (Mauro and Driscoll 1997; Getz and Volkema 2001; Beets 2005). The level of corruption is also related to law enforcement in a country (Dreher et al. 2009; Iwasaki and Suzuki 2012). Research conducted by Lambsdorff (2003, 2006) found that corruption impacts investment, gross domestic products (GDP), government spending, and the flow of capital, goods, and international aid. In addition, corruption is also closely related to the political system, public officials’ salaries, and the examination of colonialism, gender, and other cultural dimensions such as education (Lambsdorff 1999). Education is one of the important factors influencing the corruption level in a country because it is related to human resources development. Truex (2011) found that education is considered the key to social norm establishment. Social norms generated by good education will change people’s attitude from corruption-tolerant to corruption-resistant (Lederman et al. 2005; Cheung and Chan 2008).
Economic aspects show that anti-corruption measures promote fair business competition, support investment, and spur economic growth. (Cicek and Muftuler-Bac 2015). G20 member countries have massively opposed and proactively prevented corruption by forming the G20 Anti-Corruption Work Group (ACGW) in 2010. All G20 members have also ratified the United Nations Convention against Corruption (UNCAC) and the Organization for Economic Co-operation and Development (OECD) on eradicating the bribery of foreign public officials. Another step taken is the publication of the G20 Anti-Corruption Action Plan 2019–2021 (G20 2018).
The level of corruption, represented by the Corruption Perception Index (CPI), varies in each G20 country, as can be seen in Figure 1.
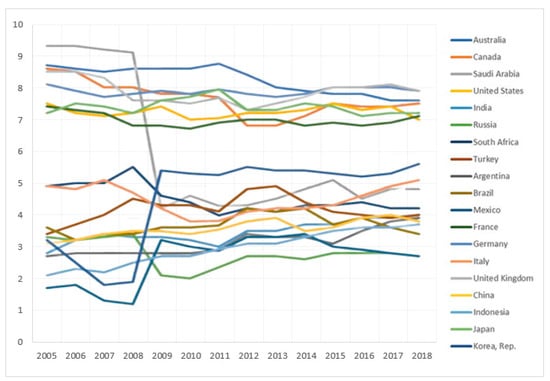
Figure 1.
Corruption Perception Index in G-20 countries in 2005–2018. Source: World Bank (2020), processed using Microsoft Excel 2016 version.
Figure 1 shows that, when viewed with a CPI threshold of 6, there are two main groups: very clean countries (Australia, Canada, the U.S., France, Germany, the UK, and Japan) and highly to moderately corrupt countries (Saudi Araba, India, Russia, South Africa, Turkey, Argentina, Brazil, Mexico, Italy, China, Indonesia, and South Korea).
This study aimed to analyze the factors affecting the corruption level in G20 countries by focusing on education and other macro-economic variables. The other macroeconomic variables that affect the level of corruption are gross domestic products (GDP) per capita, economic openness, government effectiveness index, and inflation. These macroeconomic variables were analyzed because they had a significant effect on the level of corruption in several previous studies.
The contribution of this study is to reconfirm the findings of Asongu and Nwachukwu (2015) on the effect of education on the level of corruption. As Asongu and Nwachukwu’s (2015) study was conducted in Africa, this study was conducted more broadly in the G20 member countries. As for the impact of macroeconomic variables on the level of corruption, this study combined several macroeconomic variables from previous studies and analyzed their impact on the level of corruption in the G20 member countries. However, due to the limitation of data availability, only 13 countries were investigated, namely Canada, the United States, India, Russia, Argentina, Brazil, Mexico, France, Italy, the United Kingdom (UK), Indonesia, Japan, and South Korea.
This paper consists of five parts. Section 1 describes the background of the study, which shows the importance of this study and the position of this study to previous studies. Section 2 describes the literature review and empirical evidence of the impact of education and other macroeconomic variables on corruption. Section 3 describes the model using two stage least squares (2sls) and the Educatex formulation using principal component analysis (PCA). Furthermore, Section 4 analyzes the model with data for the G20 countries for the period 2007–2017. Finally, Section 5 presents our conclusions.
2. Literature Review
2.1. Education on Corruption
Theoretically, education has a different effect on corruption. Education has been proven to increase legal awareness, social cohesion, and civic responsibility, all of which will lead to a negative relationship between education and participation in corruption. (Heyneman 2002; Merloni 2018; Heyneman et al. 2008; Oreopoulos and Salvanes 2009). In highly corrupt countries, corruption often occurs within the education system.
Orces (2008), on paying bribes to the police, revealed that greater wealth and higher education in city communities actually increased the likelihood of being involved in bribery. However, another study by Orces (2009) on public health and education services found the opposite: education variables had a negative relationship with the possibility of bribery. A similar result was found by Mocan (2008). Beets (2005) used the CPI as a proxy for the corruption variable to examine its relationship with education at the country level using seven education indicators: literacy level, student–teacher ratio for primary and secondary education, and school participation rates for all school-age children, namely children of primary school age, middle school age, and senior high school age. He found that lower levels of education, as measured by literacy levels, school participation rates, and student–teacher ratios, correlated with higher levels of corruption. Countries with “low corruption” had an average school participation rate of around 90 percent, while countries with “high corruption” had only 56 percent.
Truex (2011) conducted an individual survey in Kathmandu, Nepal, after first conducting a literature study and establishing that social norms influence tolerance to corruption. Then, he examined whether education influenced social norms and thus influenced tolerance or acceptance of corruption. He found that consistently, education was the strongest determinant of acceptance or tolerance toward corruption. Individuals who were better educated were consistently more critical toward corruption and denounce it.
Hunt and Laszlo (2012) conducted a study on bribery involving poor communities. They found that bribery among the poor is something that is done without purpose or awareness. Poor people often do not know the cost of a public service and they do not realize that bribery is prohibited in normal transactions. Based on these findings, Hunt and Laszlo (2012) suggested that increasing literacy combined with official publication of the costs of public services could reduce the vulnerability of poor people to corruption.
Hakhverdian and Mayne (2012) examined 21 democratic countries in Europe about the influence of education on trust in public institutions and the corruption level. Using the multilevel model, they found that education had a negative relationship with trust in public institutions in corrupt societies, but a positive relationship with that in clean societies. They also found that the negative effect of corruption on trust in public institutions would diminish as education level increases and that citizens with the lowest levels of education were not responsive to the negative influence of corruption.
Jetter and Parmeter (2018) used Bayesian model averaging (BMA) in researching corruption in non-OECD developed countries. In the education sector, they used a number of measures, namely primary, secondary, and tertiary education levels, and school participation. They concluded and emphasized the importance of the rule of law (PIP 1.00) and primary education (PIP 1.00) as the most important elements in fighting corruption.
Dong and Torgler (2013) and Uslaner and Rothstein (2016) found that education was associated with declining levels of corruption, both in the short- and long-terms. In countries with high corruption including those in Sub-Saharan Africa, the education system is also often corrupt. School children must pay bribes to get good grades and pass to the next grade level and they can also buy test questions and answers before the exam is administered. These examples make students perceive bribing as normal and acceptable behavior. Education can also increase bribery because more educated individuals tend to have more frequent interactions with officials, have higher income, and are reluctant to linger over bureaucratic matters so they try to accelerate the process through bribery (Kaffenberger 2012).
Dridi (2014) examined the factors that influenced active and passive corruption in government spending on education, social welfare, health, security, and debt repayment. The study included the proxied education variable with secondary school participation rate as the regressor. The results showed that secondary education had no significant influence on corruption.
Lalountas et al. (2011) examined the relationship between globalization and corruption using a cross-section of 127 countries. Their conclusion was that globalization is a powerful weapon against corruption only for middle and high income countries, whereas it was insignificant in low income countries.
2.2. Macroeconomics Variables on Corruption
Gross Domestic Products (GDP). There are two hypotheses on the influence of corruption on economic growth known as “Grease the Wheels” and “Sand the Wheels”. The Grease the Wheels hypothesis states that corruption increases economic growth because it bypasses inefficient regulation. When the regulations for starting a business are very strict, bribing politicians and bureaucrats is likely to lead to dynamic economic activities. In contrast, the Sand the Wheels hypothesis asserts that corruption reduces economic growth because corruption prevents efficient production and innovation.
A study by Méon and Weill (2010) found that in in developed countries where the institution and bureaucracy are effective, the efficient grease hypothesis is rejected. Meanwhile, in developing countries where the institutions and bureaucracy are ineffective, the efficient grease hypothesis is accepted.
Different results were found in a study by Corrado and Rossetti (2018), which revealed a negative relationship between income per capita (GDP) and corruption in all regions of Italy. This confirmed Lipset’s (1960) hypothesis that poorer regions experienced more corruption than the richer ones.
Goverment Effectiveness. Government effectiveness (GE) captures perceptions of the quality of public services, the quality of the civil service and the degree of its independence from political pressures, the quality of policy formulation and implementation, and the credibility of the government’s commitment to such policies (Kaufmann et al. 2010; Apaza 2009; Mark and Vatiero 2018). The higher the government index, the lower the level of corruption in a country. A study by Montes and Paschoal (2016) in 130 countries found that the higher the government index, the lower the level of corruption.
Inflation. Inflation affects corruption in two ways. First, inflation causes people’s purchasing power to decline. In order to maintain the level of consumption, someone commits corruption. Second, the populist policy of the government causes the government budget to rise quite high and cause inflation. The increase in budgets due to this populist policy has led to rent seeking behavior from the private sector, which is an act of corruption. A study by Akca et al. (2012) in the 2002–2010 period using a total of 97 countries’ data from three different income-level groups found that inflation had a statistically significant and positive effect on corruption in all 97 countries from three different income-level groups.
Economic Openness. Economic openness influences the corruption level as it is synonymous with globalization, which is a powerful tool in fighting corruption (Lalountas et al. 2011; Asongu 2014; Kaufmann et al. 2010; Noja et al. 2019). Lower economic openness is one of the factors causing increased corruption (Gurgur and Shah 2014). Other factors include poor economic structure, overly dominant role of government in the economy, low quantity and quality of oversight institutions, low social development, and low salaries of civil servants.
Herzfeld and Weiss (2003), who examined 72 countries, found that factors affecting corruption were economic openness, economic growth, religion, civil servants’ salaries, democracy level, political stability, natural wealth, social heterogeneity, and law enforcement.
Shabbir and Anwar (2007) found that economic freedom (measured by the Economic Freedom Index) and globalization (measured by the percentage of exports minus imports to the GDP) were the variables that influenced the corruption level. In addition, there were several other variables such as the level of economic development (measured by GDP), economic freedom (measured by the Economic Freedom Index), globalization (measured by the percentage of exports minus imports to the GDP), the education level (measured by the literacy level), and income distribution (measured by the Gini Ratio).
2.3. Hypotheses
Based on the previous studies, the following hypotheses will be tested in this paper:
Hypothesis 1 (H1).
Education has a negative effect on corruption in the G20.
Hypothesis 2 (H2).
GDP increases corruption in G20 developing countries and suppresses corruption in G20 developed countries.
Hypothesis 3 (H3).
Government effectiveness has a negative effect on the level of corruption in G20.
Hypothesis 4 (H4).
The inflation rate has a positive effect on the level of corruption in the G20.
Hypothesis 5 (H5).
Economic openness will be significant in G20 developed countries in reducing corruption, while it is not significant in G20 developing countries.
3. Method
3.1. Data
This study used the 2007–2017 data from 13 G20 member countries: Canada, the United States, India, Russia, Argentina, Brazil, Mexico, France, Italy, the UK, Indonesia, Japan, and South Korea. The dependent variable was the level of corruption proxied by the Corruption Perception Index (CPI) and the independent variables were GDP per capita, government effectiveness, inflation, economic openness, primary school enrolment, secondary school enrolment, tertiary school enrolment, and Educatex, an index for long-life learning resulting from principal component analysis (PCA) (Table 1).

Table 1.
Variable list.
The data used in this study were taken from Transparency International and the World Bank and are secondary data that can be accessed openly.
3.2. Two-Stage Least Squares (2SLS) Regression
This study used two-stage least squares (2SLS) regression because there was a suspicion of endogeneity in the GDP per capita variable, where there is probably a causal relationship with the corruption variable. The 2SLS regression itself was first developed by Henri Theil and Robert Basmann. As the name suggests, the method involves two sequential applications of ordinary least square (OLS) (Gujarati and Porter 2003). The 2SLS regression research equation is as follows:
As the equation is over identified, by applying 2SLS, the first stage regresses endogenous variables to predetermined variables, and then the second stage replaces and with their estimated value, and thus the final equation is as follows:
3.3. Principal Component Analysis (PCA)
Asongu and Nwachukwu (2015) created a variable called Educatex, which includes formal education at elementary, secondary, and tertiary school levels, using principal component analysis (PCA). PCA is a statistical technique to simplify the number of highly correlated variables into non-correlated variables with a smaller number representing the proportion of variability.
The selection of the number of variables generated by the PCA is based on an eigenvalue of higher than one (Jolliffe 2002). Table 2 shows that the first principal component (first PC) accounts for more than 61% of the combined information and has an eigenvalue of 1848. The index formed by the PCA is one and is called Educatex (Asongu and Nwachukwu 2015).
Table 2.
Principal component analysis (PCA) that formed the educational index (Educatex).
4. Results and Discussion
4.1. Descriptive Statistics
Table 3 shows that on average, the developed countries had lower levels of corruption (shown by the CPI values) and lower inflation rates, around 1/9, than the developing countries. Generally, for GDP per capita, economic openness, government effectiveness, and education, the developed countries had greater values than the developing countries. For example, the per capita income of the seven developed countries was five times higher than the six developing countries. Interestingly, in education, the average primary school enrolment in the developing countries was higher than in the developed ones. These findings are in line with several previous studies where there was a causal relationship between corruption and GDP per capita and economic growth, which means that both variables influence corruption and vice versa. The higher GDP per capita of a country, the lower the level of corruption in such country (Jetter et al. 2015; Iwasaki and Suzuki 2012; Fan et al. 2009; Serra 2006; Gatti 2004; Paldam 2002).
Table 3.
Descriptive statistics.
4.2. Two-Stage Least Square (2SLS) Analysis
This data analysis used four models, each of which was distinguished based on the educational variables (Educatex, primary school enrolment, secondary school enrolment, and tertiary school enrolment) (Table 4). Subsequently, the analysis was classified into three, namely the G20 member countries (13 countries), the developed member countries, (Canada, the United States, France, Italy, the UK, Japan, and South Korea), and the developing member countries (India, Russia, Argentina, Brazil, Mexico, and Indonesia).
Table 4.
Results of the two-stage least square (TSLS).
The first hypothesis to test was with regard to the negative effect of education on corruption in the G20. The results for the education sector showed that of the four indicators used, only secondary school enrolment significantly reduced the corruption level in both developing and developed member countries. Educatex, as a lifelong learning measure from the extraction of various indicators, did not significantly influence the corruption in the G20 countries. Primary school enrolment also did not significantly influence the level of corruption in the G20 countries, a contrasting result to the results of research by Jetter and Parmeter (2018), which examined 123 countries and instead found that primary school enrolment was an important factor in eradicating corruption. An interesting result was found in the developed member countries, where tertiary school enrolment actually increased the corruption level. This finding was the same as the results of a study by Kaffenberger (2012), where the higher the level of education, the higher the level of corruption. Populations with undergraduate/university education have the highest influence (13.7%), which means that they are more likely to participate in corruption than those without such formal education. These results indicate that corruption cases in developed countries are more common in the highly educated group.
The testing of the second hypothesis of the effect of GDP on corruption in G20 developing countries and its role to suppress corruption in G20 developed countries revealed that that all models and all data groups of GDPs per capita significantly influenced the corruption level. This is in line with previous studies demonstrating the relationship between GDP and the corruption level (Shah and Schacter 2004; Li et al. 2000). The results did not find a significant difference between developed and developing countries as revealed by Méon and Weill (2010). However, the results were not in accordance with Corrado and Rossetti (2018), who revealed a negative relationship between income per capita (GDP) and corruption in all regions of Italy.
Moreover, the 2SLS regression results of testing the third hypothesis about the negative effect of government effectiveness on the level of corruption in G20 showed that government effectiveness significantly influenced the corruption level. The higher the government effectiveness, in both the developed and developing member countries, the cleaner the country from corruption. This rejects the “Grease the Wheels” hypothesis, which states that corruption increases economic growth because it bypasses inefficient regulations. The finding is in line with Montes and Paschoal (2016) who found that in 130 countries, the higher the government index, the lower the level of corruption. This means that the higher the government index, the lower the level of corruption in a country.
Statistical testing of the fourth hypothesis about the positive effect of inflation rate on the level of corruption in the G20 showed that inflation only significantly influenced the corruption level in the developing countries’ model. This is in accordance with Akca et al. (2012), who examined the 2002–2010 period and used data from a total of 97 countries from three different income-level groups, and found that the inflation had a statistically significant and positive effect on corruption in all 97 countries from three different income-level groups.
The statistical output showed the results about the fifth hypothesis stating that economic openness will be significant in the G20 developed countries in reducing corruption, while it is not significant in the G20 developing countries. This is in line with Gurgur and Shah (2014), who stated that lower economic openness had a significant effect on the increased corruption. This may be supported by poor economic structure, the overly dominant role of government in the economy, low quantity and quality of oversight institutions, low social development, and the low salaries of civil servants. This result indicates that the more open the economy in these countries, the higher the level of corruption. Consequently, there are indications that import and export activities in these developing countries are vulnerable to corrupt practices. This result is different from the hypothesis of Lalountas et al. (2011), which states that economic openness is significant in developed countries, but is not significant in developing countries in combating corruption. On the other hand, this result is in line with the study of Gründler and Potrafke (2019), who used panel data for 2012–2018 from 175 countries. They found that higher corruption, indicated by a reversed CPI value that rises by one standard deviation, would reduce real GDP per capita by 17%. This occurs because corruption reduces foreign direct investment (FDI) and increases inflation.
Moreover, the processing results of mixed data and those of the developed member countries showed that GDP per capita was significant to reduce the corruption level. This means that the higher the GDP per capita of the countries, the lower the level of corruption. Meanwhile, in the developing member countries, increased GDP per capita actually caused an increase in the level of corruption. This was due to sharp inequality in the developing countries coupled with relatively low per capita income. Figure 2 shows that in the developing countries, the inequality of income distribution, shown by the Gini Index, is relatively higher than in the developed countries except for the United States, even though their per capita income is very high. This shows that the wealth in the developing countries is controlled by only a few people, resulting in the high inequality.
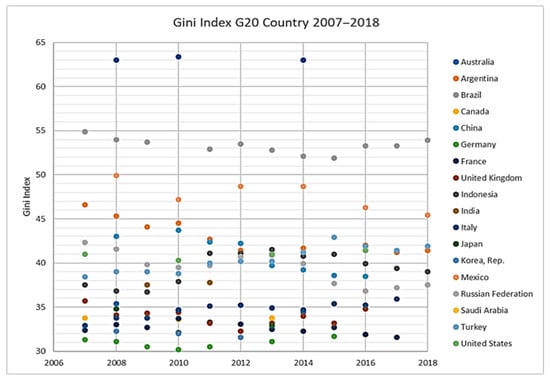
Figure 2.
Gini Index of G20 countries during 2007–2018. Source: World Bank (2020), processed using Microsoft Excel 2016 version.
Finally, the descriptive data showed that inflation in the developing member countries was more volatile compared to that in the developed countries, which was more stable. Inflation in the developing countries had a significant influence on increasing corruption, so the tendency to increase prices in these countries may increase the corruption level.
5. Conclusions
Secondary education can be a priority because it significantly reduces corruption in both developed and developing member countries. It complements primary education and aims to lay the foundation for lifelong learning and human resource development with more learning subjects complete with skills-oriented courses delivered by more specialized teachers (World Bank 2020). In addition, more available jobs require middle-level graduates with sufficient skills. If citizens are equipped with good skills in secondary education and obtain decent jobs, equity will be realized and people’s welfare will improve. Furthermore, welfare will reduce the potential for corruption and reduce the concentration of power in the hands of only a few people. In addition, norm education such as anti-corruption education is also very important to instill at every level of education. Basic education itself, shown by primary school enrolment, although not significant, can be a place for developing and implementing curriculum on anti-corruption education from an early age. Provision of universal basic education for all is one of the goals set out in the United Nations Millennium Development Goals.
Based on the hypothesis test, the following research results were obtained: Education has a negative effect on corruption in the G20 (proven); GDP increases corruption in G20 developing countries and suppresses corruption in G20 developed countries (proven); economic openness will be significant in G20 developed countries in reducing corruption, while it is not significant in G20 developing countries (not proven). High per capita income in the developed member countries can reduce the corruption level, but the opposite is true in developing countries. This may be due to a large imbalance in the developing countries where wealth is enjoyed by only a few people or power is concentrated in the hands of only a few people. Such situations can increase the potential for corruption.
Government effectiveness can consistently reduce the number of corruption cases in both developed and developing G20 member countries. This factor is indeed effective because it directly provides reward and punishment. The current task of the state is to increase its effectiveness. Inflation shows a tendency to increase prices and in developing countries, this significantly increases corruption. Economic openness and inflation significantly influences the level of corruption only in the developing member countries. Imports and exports, especially with the quota system, become a potential area for corruption because they are heavily regulated by government policies.
The limitation of this research is that it does not show specifically how the direct and indirect effects of the variables are thought to influence corruption. It is necessary to examine more broadly the dimensions that influence corruption and determine the endogeneity of the variables that are thought to influence corruption.
Author Contributions
Conceptualization, N.S.B.M. and I.S.; Methodology, N.S.B.M.; Software, N.S.B.M.; Validation, I.S., S.F., and I.M.; Formal analysis, N.S.B.M.; Investigation, I.S.; Resources, S.F. and I.M.; Data curation, I.M.; Writing original draft preparation, N.S.B.M.; Writing review and editing, N.S.B.M. and I.M.; Visualization, N.S.B.M.; Supervision, I.S.; Project administration, S.F. All authors have read and agreed to the published version of the manuscript.
Funding
This research received no external funding.
Institutional Review Board Statement
Not applicable.
Informed Consent Statement
Not applicable.
Data Availability Statement
The corresponding author [I.S] of the present work is available for any information about data availability.
Conflicts of Interest
The authors declare no conflict of interest.
References
- Akca, Hasim, Ahmet Yilmaz Ata, and Coskun Karaca. 2012. Inflation and corruption relationship: Evidence from panel data in developed and developing countries. International Journal of Economics and Financial Issues 2: 281–95. [Google Scholar]
- Apaza, Carmen R. 2009. Measuring Governance and Corruption through the Worldwide Governance Indicators: Critiques, Responses, and Ongoing Scholarly Discussion. PS: Political Science & Politics 42: 139–43. [Google Scholar]
- Asongu, Simplice. 2014. Globalization (fighting), corruption and development: How are these phenomena linearly and nonlinearly related in wealth effects? Journal of Economic Studies 41: 346–69. [Google Scholar] [CrossRef]
- Asongu, Simplice, and Jacinta Nwachukwu. 2015. The incremental effect of education on corruption: evidence of synergy from lifelong learning. Economics Bulletin 35: 2288–308. [Google Scholar] [CrossRef]
- Beets, S. Douglas. 2005. Understanding the demand-side issues of international corruption. Journal of Business Ethics 57: 65–81. [Google Scholar] [CrossRef]
- Cheung, Hoi Yan, and Alex WH Chan. 2008. Corruption across countries: Impacts from education and cultural dimensions. The Social Science Journal 45: 223–39. [Google Scholar] [CrossRef]
- Cicek, Aylin Ece, and Meltem Muftuler-Bac. 2015. Shifts and Trends in Global Governance: An Empirical Analysis of G20. Paper presented at International Studies Association Meeting, Singapore, January 8–11. [Google Scholar]
- Corrado, Germana, and Fiammetta Rossetti. 2018. Public corruption: A study across regions in Italy. Journal of Policy Modeling 40: 1126–139. [Google Scholar] [CrossRef]
- Dong, Bin, and Benno Torgler. 2013. Causes of corruption: Evidence from China. China Economic Review 26: 152–69. [Google Scholar] [CrossRef]
- Dreher, Axel, Christos Kotsogiannis, and Steve McCorriston. 2009. How do institutions affect corruption and the shadow economy? International Tax and Public Finance 16: 773–96. [Google Scholar] [CrossRef]
- Dridi, Mohamed. 2014. Corruption and education: Empirical evidence. International Journal of Economics and Financial Issues 4: 476. [Google Scholar]
- Fan, C. Simon, Chen Lin, and Daniel Treisman. 2009. Political decentralization and corruption: Evidence from around the world. Journal of Public Economics 93: 14–34. [Google Scholar] [CrossRef]
- G20. 2018. Directorate for Financial and Enterprise Affairs. In Working Group on Bribery in International Business Transactions. G20 Anti-Corruption Working Group Action Plan 2019–2021 and Extract from G20 Leaders Communiqué. Argentina: G20, December 11. [Google Scholar]
- Gatti, Roberta. 2004. Explaining corruption: are open countries less corrupt? Journal of International Development 16: 851–61. [Google Scholar] [CrossRef]
- Getz, Kathleen A., and Roger J. Volkema. 2001. Culture, perceived corruption, and economics: A model of predictors and outcomes. Business & Society 40: 7–30. [Google Scholar]
- Gründler, Klaus, and Niklas Potrafke. 2019. Corruption and economic growth: New empirical evidence. European Journal of Political Economy 60: 101810. [Google Scholar] [CrossRef]
- Gujarati, Damodar N., and Dawn C. Porter. 2003. Basic Econometrics. New York: McGraw Hill Companies. [Google Scholar]
- Gurgur, Tugrul, and Anwar Shah. 2014. Localization and corruption: Panacea or pandoras box. Annals of Economics and Finance 15: 109–36. [Google Scholar]
- Hakhverdian, Armen, and Quinton Mayne. 2012. Institutional trust, education, and corruption: A micro-macro interactive approach. The Journal of Politics 74: 739–50. [Google Scholar] [CrossRef]
- Herzfeld, Thomas, and Christoph Weiss. 2003. Corruption and legal (in) effectiveness: an empirical investigation. European Journal of Political Economy 19: 621–32. [Google Scholar] [CrossRef]
- Heyneman, Stephen P. 2002. Defining the influence of education on social cohesion. International Journal of Educational Policy, Research and Practice 3: 73–97. [Google Scholar]
- Heyneman, Stephen P., Kathryn H. Anderson, and Nazym Nuraliyeva. 2008. The cost of corruption in higher education. Comparative Education Review 52: 1–25. [Google Scholar] [CrossRef]
- Hunt, Jennifer, and Sonia Laszlo. 2012. Is bribery really regressive? Bribery’s costs, benefits, and mechanisms. World Development 40: 355–72. [Google Scholar] [CrossRef]
- Iwasaki, Ichiro, and Taku Suzuki. 2012. The determinants of corruption in transition economies. Economics Letters 114: 54–60. [Google Scholar] [CrossRef]
- Jetter, Michael, and Christopher F. Parmeter. 2018. Sorting through global corruption determinants: Institutions and education matter–Not culture. World Development 109: 279–94. [Google Scholar] [CrossRef]
- Jetter, Michael, Alejandra Montoya Agudelo, and Andrés Ramírez Hassan. 2015. The effect of democracy on corruption: Income is key. World Development 74: 286–304. [Google Scholar] [CrossRef]
- Jolliffe, Ian T. 2002. Principal Component Analysis, 2nd ed. New York: Springer. [Google Scholar]
- Kaffenberger, Michelle. 2012. The Effect of Educational Attainment on Corruption Participation in Sub-Saharan Africa. Ph.D. dissertation, Vanderbilt University, Nashville, TN, USA. [Google Scholar]
- Kaufmann, Daniel, Aart Kraay, and Massimo Mastruzz. 2010. The Worldwide Governance Indicators: A Summary of Methodology, Data and Analytical Issues. World Bank Policy Research Working Paper No. 5430. Available online: https://openknowledge.worldbank.org/bitstream/handle/10986/3913/WPS5430.pdf?sequence=1 (accessed on 30 June 2020).
- Lalountas, Dionisios A., George A. Manolas, and Ioannis S. Vavouras. 2011. Corruption, globalization and development: How are these three phenomena related? Journal of Policy Modeling 33: 636–48. [Google Scholar] [CrossRef]
- Lambsdorff, Johann Graf. 1999. Corruption in Empirical Research—A Review. Transparency International Working Paper. Berlin: Transparency International. [Google Scholar]
- Lambsdorff, Johann Graf. 2003. How corruption affects persistent capital flows. Economics of Governance 4: 229–43. [Google Scholar] [CrossRef]
- Lambsdorff, Johann Graf. 2006. Consequences and causes of corruption: What do we know from a cross-section of countries? In International Handbook on the Economics of Corruption. Edited by Susan Rose-Ackerman. Cheltenham: Edward-Elgar Publishing, pp. 3–52. [Google Scholar]
- Lederman, Daniel, Norman V. Loayza, and Rodrigo R. Soares. 2005. Accountability and corruption: Political institutions matter. Economics & Politics 17: 1–35. [Google Scholar]
- Li, Hongyi, Lixin Colin Xu, and Heng-fu Zou. 2000. Corruption, income distribution, and growth. Economics & Politics 12: 155–82. [Google Scholar]
- Lipset, Seymour Martin. 1960. Political Man: The Social Bases of Politics. Baltimore: The Johns Hopkins University Press. [Google Scholar]
- Mark, J. Roe, and Massimiliano Vatiero. 2018. Corporate governance and its political economy. In The Oxford Handbook of Corporate Law and Governance. Edited by Jeffrey N. Gordon and Wolf-Georg Ringe. Oxford: Oxford University Press, pp. 56–83. [Google Scholar]
- Mauro, Paolo, and David D. Driscoll. 1997. Why Worry about Corruption? Washington, DC: International Monetary Fund, vol. 6. [Google Scholar]
- Méon, Pierre-Guillaume, and Laurent Weill. 2010. Is corruption an efficient grease? World Development 38: 244–59. [Google Scholar] [CrossRef]
- Merloni, Francesco. 2018. Corruption and Public Administration: The Italian Case in a Comparative Perspective. New York: Routledge. [Google Scholar]
- Mocan, Naci. 2008. What determines corruption? International evidence from microdata. Economic Inquiry 46: 493–510. [Google Scholar] [CrossRef]
- Montes, Gabriel Caldas, and P. C. Paschoal. 2016. Corruption: what are the effects on government effectiveness? Empirical evidence considering developed and developing countries. Applied Economics Letters 23: 146–50. [Google Scholar] [CrossRef]
- Noja, Gratiela Georgiana, Mirela Cristea, Nicoleta Sirghi, Camelia-Daniela Hategan, and Paolo D′Anselmi. 2019. Promoting good public governance and environmental support for sustainable economic development. International Journal of Environmental Research and Public Health 16: 4940. [Google Scholar] [CrossRef]
- Orces, Diana. 2008. Corruption victimization by the police. Revista Deficiencia Política 28: 203–8. [Google Scholar]
- Orces, Diana. 2009. Corruption victimization by public employees. AmericasBarometer Insights 13. Available online: https://www.vanderbilt.edu/lapop/insights/I0813en.pdf (accessed on 30 June 2020).
- Oreopoulos, Philip, and Kjell G. Salvanes. 2009. How Large Are Returns to Schooling? Hint: Money Isn’t Everything. NBER Working Paper No. 15339. Cambridge: National Bureau of Economic Research. [Google Scholar]
- Paldam, Martin. 2002. The cross-country pattern of corruption: economics, culture and the seesaw dynamics. European Journal of Political Economy 18: 215–40. [Google Scholar] [CrossRef]
- Serra, Danila. 2006. Empirical determinants of corruption: A sensitivity analysis. Public Choice 126: 225–56. [Google Scholar] [CrossRef]
- Shabbir, Ghulam, and Mumtaz Anwar. 2007. Determinants of corruption in developing countries. The Pakistan Development Review 46: 751–64. [Google Scholar] [CrossRef]
- Shah, Anwar, and Mark Schacter. 2004. Combating corruption: Look before you leap. Finance and Development 41: 40–43. [Google Scholar]
- Truex, Rory. 2011. Corruption, attitudes, and education: Survey evidence from Nepal. World Development 39: 1133–42. [Google Scholar] [CrossRef]
- Uslaner, Eric M., and Bo Rothstein. 2016. The historical roots of corruption: State building, economic inequality, and mass education. Comparative Politics 48: 227–48. [Google Scholar] [CrossRef]
- World Bank. 2020. World Bank Data. Washington, DC: World Bank. [Google Scholar]
Publisher’s Note: MDPI stays neutral with regard to jurisdictional claims in published maps and institutional affiliations. |
© 2021 by the authors. Licensee MDPI, Basel, Switzerland. This article is an open access article distributed under the terms and conditions of the Creative Commons Attribution (CC BY) license (http://creativecommons.org/licenses/by/4.0/).