Article

Economic Growth, Service Sector, and Urbanization Effects on Environmental Degradation in Uzbekistan: Evidence from ARDL Analysis

1
Department of Information Systems and Technologies, Faculty of Digital Technologies and Artificial Intelligence, Karshi State Technical University, Xonobod Street 19, Karshi 180100, Uzbekistan
2
Department of Banking and Accounting, Faculty of Financial, Banking and Accounting, Kimyo International University in Tashkent (KIUT), Shota Rustaveli Street 156, Tashkent 100121, Uzbekistan
3
Department of Economics, Faculty of Economics, Mamun University, Qibla Tozabog, Khiva 220900, Uzbekistan
4
Department of Economics, Faculty of Economics and Information Technologies, Termez University of Economics and Service, Farovon Street 4-b, Termez 190111, Uzbekistan
5
Department of Economics and Management, Tashkent State University of Oriental Studies, Amir Temur Street 20, Mirabad District, Tashkent 100060, Uzbekistan
6
Institute of Foreign Policy and International Economic Relations, Tashkent State University of Oriental Studies, Amir Temur Street 20, Mirabad District, Tashkent 100060, Uzbekistan
7
Department of Tourism, Faculty of Socio-Economic Sciences, Urgench State University Named After Abu Rayhan Beruni, Khamid Alimjan Street 14, Urgench 220100, Uzbekistan
*
Author to whom correspondence should be addressed.
Economies 2026, 14(8), 303; https://doi.org/10.3390/economies14080303
Submission received: 30 March 2026 / Revised: 14 July 2026 / Accepted: 14 July 2026 / Published: 2 August 2026

Abstract

Balancing economic growth with environmental sustainability remains a serious challenge for many transition economies. This study analyzes the relationship between economic growth, service sector expansion, urbanization, and environmental degradation in Uzbekistan. Employing yearly temporal series data from 1991 to 2024, the research implements an autoregressive distributed lag (ARDL) bounds testing methodology to investigate the short-run and long-run relationships among the variables. Carbon dioxide (CO2) emissions are used as proxies for environmental degradation, while GDP per capita, service sector value added, and urban population growth represent key economic and structural factors. The empirical results show that there is a stable long-run cointegration relationship between the variables. The findings show that economic growth significantly reduces CO2 emissions in the long run, which supports the Environmental Kuznets Curve (EKC) hypothesis for Uzbekistan. Conversely, the expansion of the service sector and rapid urbanization are found to increase CO2 emissions and contribute to environmental degradation. The error correction model shows a rapid adjustment rate of approximately 66.5% to the long-run equilibrium after short-term shocks. Through these results, we attempted to reveal the importance of sustainable urban development, green economic policies, and the development of an environmentally friendly service sector in Uzbekistan.

1. Introduction

Global climate change and the continuous increase in greenhouse gas emissions, especially carbon dioxide (CO2), have become one of the most serious challenges of the twenty-first century, with atmospheric CO2 concentrations reaching record levels (IEA, 2023).
As per the EKC framework, ecological decline is usually observed to heighten in the early stages of economic progress. Subsequently, after a nation attains a certain income threshold, technological innovation transpires, and consequently, pollution levels commence to diminish owing to efficient environmental governance strategies (Grossman & Krueger, 1995; Stern, 2004).
Alongside economic advancement, systemic modifications within the economy, hastened urbanization, and the proliferation of the service sector constitute significant determinants that directly influence environmental quality. The service sector is frequently perceived as a “more sustainable” substitute for industry (Zaman et al., 2016). In regions in the process of development, the expansion of services that depend on energy, involving transport, logistics, and conventional trade, could magnify environmental concerns (Halmuratov et al., 2025b; Sadorsky, 2014).
City growth acts as a key force behind rising energy needs, infrastructure development, and the surge in carbon outputs linked to the widening of transport systems (Ali et al., 2019; Halmuratov et al., 2025a; Martínez-Zarzoso & Maruotti, 2011). Analyzing the combined impact of these factors on ecological systems is important for transition economies undergoing rapid structural change. Uzbekistan, as the most populous country in Central Asia with a rapidly growing economy, is a unique and relevant country for empirical research (World Bank, 2022).
Since independence, Uzbekistan has experienced significant economic growth, with large-scale urbanization and a growing share of the services sector in Gross Domestic Product (GDP) as a result of comprehensive economic reforms (World Bank, 2022). The country is located in a region that is highly vulnerable to the impacts of climate change, such as water scarcity and desertification, and the government is actively promoting a “Transition to a Green Economy” strategy (President of the Republic of Uzbekistan, 2019).
Uzbekistan offers a particularly suitable empirical setting for examining the joint effects of economic growth, structural transformation, and urbanization on environmental quality, for four interrelated reasons. First, it is the most populous economy in Central Asia and has experienced one of the fastest income transitions in the region since 1991, providing sufficient temporal variation to identify long-run relationships. Second, unlike many resource-exporting economies whose emission trajectories are driven primarily by extractive industries, Uzbekistan’s emission profile reflects a broader interaction between industrial restructuring, service sector expansion, and rapid urbanization—precisely the channels examined in the present study. Third, the country’s doubly landlocked geography and arid climate make it especially vulnerable to climate change, increasing the policy relevance of robust country-specific evidence. Fourth, despite this relevance, country-specific empirical evidence on Uzbekistan remains scarce: most existing analyses on Central Asia either treat the region as a single panel or focus on neighboring Kazakhstan (Sarkodie & Strezov, 2019; Xolmurotov & Xolmuratov, 2025; Zhakiyev et al., 2025). The present study therefore provides empirical evidence directly aligned with the four gaps identified in Section 2.4, namely (i) a geographic gap, (ii) a sectoral gap, (iii) a methodological gap, and (iv) a temporal gap.
The long-term dynamic relationship between macroeconomic indicators and CO2 emissions has not been sufficiently studied in the national scientific literature using rigorous econometric models (Nurjanov et al., 2025; Zhakiyev et al., 2025). The main objective of this study was to empirically analyze the impact of economic growth, the service sector, and urbanization on environmental degradation (measured by CO2 emissions) for the case of Uzbekistan over the period 1991–2024.
The study employs the ARDL (Autoregressive Distributed Lag) framework, which allows the simultaneous estimation of short-run and long-run relationships. This study contributes to the existing literature in three distinct ways. First, to the best of our knowledge, this is among the first studies to jointly examine the long-run effects of economic growth, service sector expansion, and urbanization on CO2 emissions in Uzbekistan-a doubly landlocked Central Asian transition economy that has received limited attention in the Environmental Kuznets Curve (EKC) literature compared with East Asian or Eastern European transition cases. Despite the rich body of evidence for BRICS, OECD, and ASEAN economies (Pata & Caglar, 2021; Sarkodie & Strezov, 2019; Xolmurotov et al., 2025a), Uzbekistan-specific empirical analyses remain scarce. Second, in contrast to existing multi-country panel studies on Central Asia, which may obscure country-specific dynamics, we apply the ARDL bounds testing procedure to a single-country time series covering the most recent period (1991–2024). This country-specific approach captures the structural shifts associated with Uzbekistan’s post-2017 economic liberalization and currency reforms—a period not covered by earlier analyses. Third, by decomposing the structural change effect into two distinct channels—service sector value added and urban population growth—we generate disaggregated, sector-specific policy implications that directly inform Uzbekistan’s ongoing “Strategy for the Transition to a Green Economy 2019–2030”, thereby extending the more aggregated regional analyses (Danish et al., 2020).

2. Literature Review

2.1. The Relationship Between Economic Growth and the Environment (The EKC Hypothesis)

In recent years, much attention has been paid to the study of the relationship between environmental degradation and economic growth. Most of the scientific research in this area is based on the Environmental Kuznets Curve (EKC) hypothesis, first put forward by Grossman and Krueger (1991, 1995). According to the EKC concept, the early stages of economic development show environmental degradation, but after reaching a certain threshold of income, environmental quality begins to improve (Stern, 2004; Xolmurotov et al., 2025b).
Empirical studies conducted in developing countries have yielded mixed results. For example, Shahbaz et al. (2013) and Ozturk and Acaravci (2010) used the ARDL model in their analyses and showed that the EKC hypothesis was confirmed in many developing economies. However, other researchers, including Apergis and Ozturk (2015), found that the effectiveness of this hypothesis depends largely on the institutional quality in the country.
More recent empirical work continues to produce mixed results while extending the EKC framework to new contexts and methods. Koirala et al. (2025), using panel data for the G7 economies, confirm the existence of an EKC relationship and estimate an income turning point beyond which CO2 emissions decouple from GDP per capita. Nica et al. (2025), applying a panel ARDL approach to the BRICS economies over 1991–2023, report an N-shaped relationship between GDP and emissions, in which the initial rise in emissions reverses at a critical threshold before increasing again at higher income levels. In contrast, Alwaked et al. (2025), employing the ARDL bounds testing procedure for Jordan, find an inverse link between FDI and emissions but a positive association between GDP and CO2 emissions, and their results do not support the EKC hypothesis for Jordan. Likewise, Nawaz et al. (2025) examine South Korea and show that inward FDI and economic growth jointly shape the emission trajectory rather than producing an automatic decline. Taken together, these recent studies reinforce the view that the income–emissions relationship is country-specific and conditioned by the stage of development, energy mix, and institutional quality—an interpretation directly relevant to the case of Uzbekistan examined in this study.

2.2. Urbanization and Environmental Quality

Two opposing views have been put forward in scientific studies on the impact of urbanization on carbon emissions. According to the ecological modernization theory, the development of urban infrastructure increases energy efficiency and reduces negative environmental impacts through technological innovation (Poumanyvong & Kaneko, 2010).
On the other hand, proponents of the concept of urban sprawl argue that rapid urbanization dramatically increases energy consumption in the transport, logistics and construction sectors, leading to increased CO2 emissions (Ali et al., 2019; Martínez-Zarzoso & Maruotti, 2011). Studies in transition economies, such as Central Asian countries, show that urbanization is often seen as a factor that increases environmental pressures due to insufficiently planned and regulated urban growth.
Recent empirical evidence largely supports this second view, particularly for developing and transition economies. Adela et al. (2025), applying a dynamic ARDL model to the United Arab Emirates over 1975–2022, find that a 1% increase in urbanization raises CO2 emissions, alongside comparable positive effects of energy use and trade openness. In a broad cross-country setting, Q. Wang et al. (2025) show that urbanization increases carbon emissions in countries of all income groups except high-income economies, indicating that the emission-reducing potential of urbanization materializes only at advanced stages of development. Belgacem (2025) reaches a comparable conclusion for Saudi Arabia, linking rising urban population shares to higher transport-related CO2 emissions. Most directly relevant to the present study, Zhakiyev et al. (2025), in a comprehensive review of Kazakhstan, Uzbekistan, and Kyrgyzstan, identify urbanization—together with industrialization and population growth—as a key driver of rising energy consumption and greenhouse gas emissions across Central Asia. This recent regional evidence reinforces the expectation that, in the Uzbek context, rapid and insufficiently regulated urban expansion exerts upward pressure on CO2 emissions.

2.3. Service Sector and Structural Transformation

The transition of an economy from an agrarian or industrial-based structure to a service-oriented structure has important environmental consequences. Traditional approaches consider the service sector (LNSERV) as a “cleaner” alternative to industry, and consequently, we can expect that an increase in the share of services in GDP will lead to a decrease in CO2 emissions (Zaman et al., 2016).
Recent studies have shown that the environmental impact of the services sector depends on its composition. For example, the intersection of financial and technological services has a unique impact on environmental outcomes. In the context of the modern digital economy, the rapid development of FinTech (financial technology) and e-commerce has been empirically shown through studies to reduce carbon footprints by increasing paperless transactions, reducing physical movement, and expanding green financing mechanisms (Deng et al., 2020; Zhao et al., 2021).
Despite the above, the growth of the service sector in developing countries is still often driven by traditional transport and trade activities, which can lead to environmental pollution.
More recent evidence confirms that the net environmental effect of the service sector hinges on the balance between traditional and digitalized activities. Chen and Wang (2025), using method-of-moments quantile regression for the world’s largest emitters, find that the digital economy directly raises CO2 emissions at higher quantiles, even though financial expansion and the interaction of digitalization with economic growth reduce emissions. Y. Wang et al. (2025) similarly show that in China, total CO2 emissions continued to rise cumulatively over 2007–2022 despite rapid digital economy development, underscoring that structural modernization does not by itself guarantee lower emissions. On the other side, Li et al. (2025), analyzing 286 Chinese cities, find that fintech development reduces urban carbon emissions, while Ahmad et al. (2025) argue that FinTech, blockchain, AI, and the Internet of Things can improve transparency and resource allocation in green finance, thereby supporting the net-zero transition. Read together, these studies imply that the positive service sector elasticity found for Uzbekistan reflects the continued dominance of traditional, energy-intensive services, and that the emission-reducing potential of digital and financial services has yet to be realized.

2.4. Literature Gap

Building on the literature reviewed above, four specific gaps motivate the present study. First, a geographic gap: while the EKC hypothesis has been extensively examined for East Asian, European, MENA, and Sub-Saharan African economies, empirical evidence on Central Asian transition economies—and particularly on Uzbekistan—remains scarce and methodologically heterogeneous (Sarkodie & Strezov, 2019). Second, a sectoral gap: the majority of existing studies treat the service sector as a homogeneous, environmentally benign sector, overlooking the possibility that in early-stage transition economies the sector may be dominated by carbon-intensive sub-activities such as transport, logistics, and traditional commerce (Sadorsky, 2014). Third, a methodological gap: to the best of our knowledge, no prior study has jointly modeled urban population growth, services value added, and per capita income within a single ARDL framework for Uzbekistan. Fourth, a temporal gap: most earlier analyses for Uzbekistan rely on samples ending before 2018 and therefore do not capture the post-2017 economic liberalization, currency reforms, and accelerated urban expansion. The present study aims to address these four gaps by applying the ARDL bounds testing procedure to recent annual data (1991–2024) within an integrated empirical framework.

3. Methodology

Data and Variables

This study uses annual time series data for Uzbekistan covering the period 1991–2024, with a total of 34 observations. The choice of the 1991–2024 sample period is motivated by both substantive and data availability considerations. 1991 marks the year of Uzbekistan’s independence and the beginning of the country’s transition from a centrally planned to a market-oriented economy, representing a coherent structural starting point for analyzing the long-run interaction between economic transformation and environmental outcomes. 2024 is the most recent year for which fully consistent annual data are available across all variables in the World Bank WDI and Climate Watch databases at the time of writing. This 34-year window provides sufficient temporal variation to identify long-run cointegrating relationships using the ARDL bounds testing procedure (Narayan, 2005; Pesaran et al., 2001), while avoiding pre-independence data whose comparability with the post-1991 period is limited. The data are from the World Bank’s World Development Indicators (WDI) database and the Climate Watch historical greenhouse gas emissions platform. The dependent variable is carbon dioxide (CO2) emissions, measured in million tonnes of CO2 equivalent (Mt CO2e) excluding land use, land use change and forestry (LULUCF), and serves as an indicator of environmental degradation. The explanatory variables include GDP per capita (current US$), which represents economic growth, value added of services (as a percentage of GDP), which reflects the expansion of the services sector, and urban population growth (annual %), which measures urbanization dynamics.
The selection of variables is grounded in the theoretical and empirical EKC literature. CO2 emissions are employed as the dependent variable because they represent the most widely used and policy-relevant indicator of environmental degradation in time-series EKC studies (Sarkodie & Strezov, 2019; Stern, 2004), and because Uzbekistan, as a Party to the Paris Agreement, reports its emissions through internationally harmonized Climate Watch protocols. GDP per capita (current US$) is chosen as the income proxy following the standard EKC specification of Grossman and Krueger (1995), capturing both the scale of economic activity and the income level at which environmental preferences typically shift. Services value added (% of GDP) captures the structural transformation channel; we focus on the services share rather than on industry because Uzbekistan’s recent transformation has been service-led, and because the environmental implications of service sector expansion in transition economies remain empirically contested (Mahmood et al., 2019; Sadorsky, 2014). Urban population growth (annual %) is used in preference to the urbanization level (% urban) because the growth rate captures the dynamic pressure that rapid urban expansion exerts on energy demand, transport, and construction—an interpretation aligned with Martínez-Zarzoso and Maruotti (2011) and Ali et al. (2019). This combination of variables therefore reflects the three principal channels emphasized in the contemporary EKC literature: income, structural transformation, and urbanization.
All variables were transformed to natural logarithms (designated as LNCO2, LNGDP, LNSERV, and LNURBAN_GR) to reduce data variability, mitigate potential heteroscedasticity, and allow the coefficients to be interpreted as elasticities (Shahbaz et al., 2013). The effectiveness of this transformation in mitigating heteroscedasticity was subsequently verified through the Breusch–Pagan–Godfrey test on the residuals of the estimated ARDL model, the results of which are reported in Section 4.5 and confirm the absence of significant heteroscedasticity in the final specification. Table 1 provides definitions and data sources of the variables used in the study.
Descriptive statistics of the variables are presented in Table 2. The Jarque–Bera test shows that the variables LNCO2, LNGDP, and LNURBAN_GR have a normal distribution at the 5 percent significance level, while LNSERV exhibits a deviation from a normal distribution due to structural changes that occurred during Uzbekistan’s economic transition.
Table 2 reveals several patterns worth noting. LNGDP has the highest standard deviation (0.721), reflecting the substantial income transformation Uzbekistan has undergone since 1991—GDP per capita rose from approximately USD 380 to over USD 3000 in nominal terms. In contrast, LNCO2 exhibits very low variation (Std. Dev. = 0.085), suggesting that absolute CO2 emissions have remained relatively stable despite this income growth, providing initial evidence consistent with the decoupling implied by the EKC hypothesis. LNSERV shows the strongest deviation from normality (Jarque–Bera = 27.186, p < 0.001), reflecting structural breaks associated with the 1990s transition shock and the post-2017 reform period. The non-normality of LNSERV does not invalidate the ARDL procedure, which does not require normally distributed regressors.
Based on the Environmental Kuznets Curve (EKC) hypothesis (Grossman & Krueger, 1995) and subsequent empirical studies (Ozturk & Acaravci, 2010; Ali et al., 2019), the basic long-run model is defined as follows:
L N C O 2 t = β 0 + β 1 L N G D P t + β 2 L N S E R V t + β 3 L N U R B A N _ G R t + ε t
where t denotes the time period (1991–2024), β 0 is the constant term, β 1 , β 2 , and β 3 are the long-run elasticities, and ε t is the stochastic error term.
Given the relatively small sample size (n = 34) and the mixed integration procedures among the variables, the ARDL bounds test approach developed by Pesaran et al. (2001) was used. The ARDL model has several advantages: (i) it provides reliable results in small samples; (ii) it can be used regardless of whether the regressors are I(0), I(1) or cointegrated, as long as none of the variables is I(2); (iii) it allows for the simultaneous estimation of short- and long-run coefficients; (iv) it provides correct t-statistics even in the presence of endogenous regressors (Nkoro & Uko, 2016).
Before estimating the ARDL model, an Augmented Dickey–Fuller (ADF) test (Dickey & Fuller, 1981) was performed to ensure that there were no variables with second-order integration, i.e., I(2), which would invalidate the bounds testing methodology. Optimal lag lengths were automatically selected based on the Schwarz Information Criterion (SIC), with a maximum lag of 8.
To test for long-run cointegration, the following unconstrained error correction model (UECM) is formulated:
Δ L N C O 2 t = α 0 + ∑ i = 1 p γ i Δ L N C O 2 t − i + ∑ j = 0 q 1 δ j Δ L N G D P t − j + ∑ k = 0 q 2 θ k Δ L N S E R V t − k + ∑ l = 0 q 3 λ l Δ L N U R B A N _ G R t − l + ρ 1 L N C O 2 t − 1 + ρ 2 L N G D P t − 1 + ρ 3 L N S E R V t − 1 + ρ 4 L N U R B A N _ G R t − 1 + μ t
where Δ is the first difference operator, γ , δ , θ , and λ are short-run dynamic coefficients, and ρ 1 through ρ 4 are long-run multipliers.
The null hypothesis of no cointegration ( H 0 : ρ 1 = ρ 2 = ρ 3 = ρ 4 = 0 ) is tested against the alternative using the F-statistic. The computed F-statistic is compared with critical value bounds from Pesaran et al. (2001) and finite sample critical values from Narayan (2005). If the F-statistic exceeds the upper bound, cointegration is confirmed.
After confirming cointegration, the short-run dynamics were identified by estimating an Error Correction Model (ECM). The chosen ARDL specification is ARDL(2, 4, 2, 0), which is specified based on the Akaike Information Criterion (AIC) under the condition of an unrestricted constant and a restricted trend. The ECM is defined as:
Δ L N C O 2 t = α 0 + ∑ i = 1 p γ i Δ L N C O 2 t − i + ∑ j = 0 q 1 δ j Δ L N G D P t − j + ∑ k = 0 q 2 θ k Δ L N S E R V t − k + ∑ l = 0 q 3 λ l Δ L N U R B A N _ G R t − l + φ E C T t − 1 + ω t
where E C T t − 1 is the lagged error correction term and φ represents the speed of adjustment toward long-run equilibrium. A negative and statistically significant φ confirms the existence of a stable long-run relationship and indicates the proportion of disequilibrium corrected each period.
Several diagnostic tests were conducted to verify the adequacy of the model. Through the Breusch–Godfrey Lagrange multiplier examination, we assess the existence of serial correlation in residuals for two lags, and the Breusch–Pagan–Godfrey test evaluates heteroscedasticity occurrence. The Cumulative Sum (CUSUM) and Cumulative Sum Square (CUSUMSQ) tests developed by Brown et al. (1975) were used to assess structural stability. If the CUSUM and CUSUMSQ plots remain within the 5 percent critical limits, the stability of the parameters is confirmed.
All econometric analyses were performed using EViews 12 software.

4. Results

Table 3 reports the descriptive statistics of the variables in their original (untransformed) units. Over the 1991–2024 period, CO2 emissions averaged 124.5 Mt CO2e, ranging from a minimum of 104.9 Mt CO2e to a maximum of 148.5 Mt CO2e. The relatively low standard deviation (10.5 Mt CO2e) indicates that absolute emissions remained fairly stable throughout the sample period. In contrast, GDP per capita exhibits substantial variation, rising from a minimum of USD 381 to a maximum of USD 3162, with a standard deviation (USD 933.8) that reflects the profound income transformation Uzbekistan has undergone since independence. The combination of stable emissions and rapidly rising income provides preliminary descriptive evidence of a decoupling between economic growth and environmental degradation, consistent with the descending phase of the EKC examined in this study. The share of services in GDP averaged 37.9 percent, fluctuating between 26.5 and 45.2 percent, while urban population growth averaged 2.35 percent per annum. The Jarque–Bera statistics indicate that CO2 emissions, GDP per capita, and urban population growth are normally distributed at the 5 percent significance level, whereas the services share deviates from normality (JB = 12.605, p = 0.002), reflecting the structural shifts associated with the 1990s transition shock and the post-2017 reform period. This non-normality does not affect the validity of the ARDL procedure, which imposes no normality requirement on the regressors.
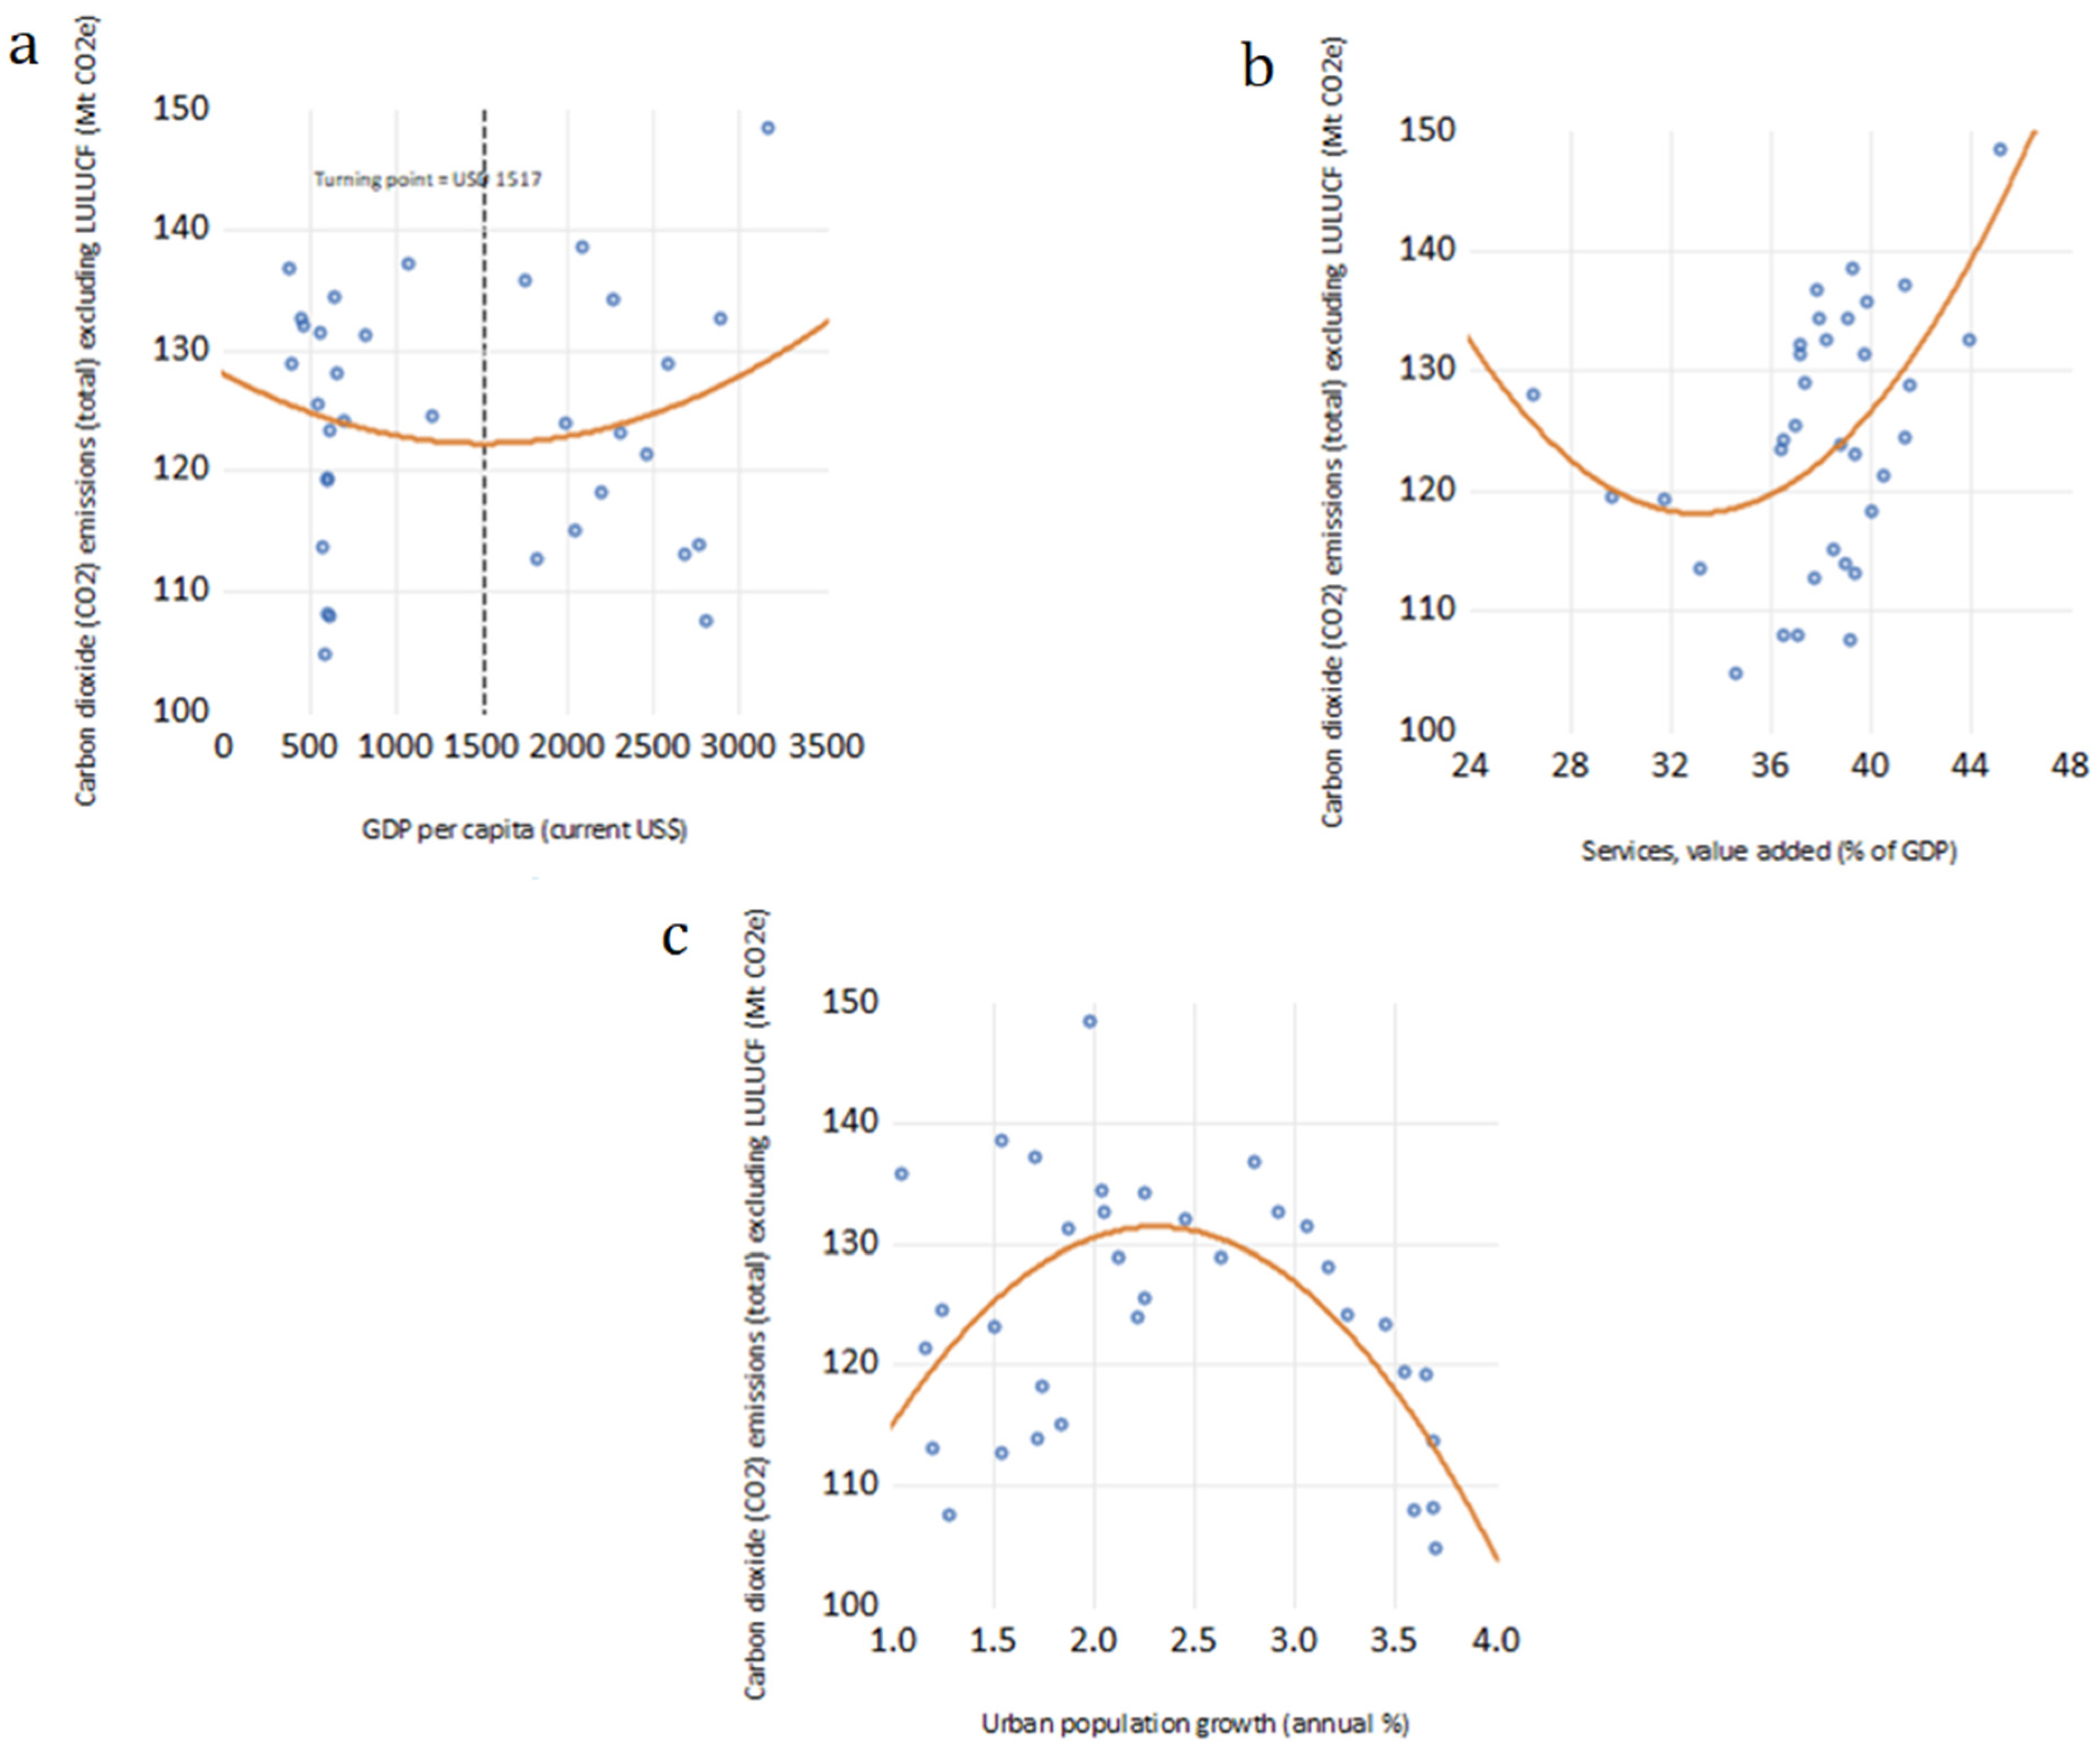
Figure 1 presents the bivariate relationships between CO2 emissions and each explanatory variable using untransformed data. Panel (a) shows that despite the roughly eight-fold expansion of GDP per capita over the sample period, CO2 emissions remained confined within a narrow band of 105–149 Mt CO2e, providing preliminary visual evidence of a decoupling between income growth and emissions. The vertex of the fitted quadratic in panel (a) corresponds to a per capita income level of approximately USD 1517 (computed as −b/2c from the estimated bivariate quadratic), indicating the income level at which the bivariate emissions–income relationship changes direction. The upturn observed in the raw data beyond this income level largely reflects the post-2017 acceleration of urbanization and service sector expansion; once these covariates and the time trend are controlled for within the ARDL framework, the conditional income elasticity is negative (Section 4.3), consistent with Uzbekistan operating on the descending phase of the EKC. Panel (b) indicates that emissions tend to rise at higher levels of service sector development, foreshadowing the positive long-run elasticity estimated later in this section. Panel (c) displays an inverted U-shaped pattern between urban population growth and emissions, with the highest emission levels observed during periods of moderate-to-rapid urban expansion. It should be emphasized that these bivariate plots are descriptive in nature and do not control for the time trend or the remaining covariates; the conditional long-run elasticities, which isolate the effect of each variable, are estimated within the ARDL framework in Section 4.3 and Section 4.4.

4.1. Unit Root Test Results

As a foundational measure to investigate the Autoregressive Distributed Lag (ARDL) system, we undertook Augmented Dickey–Fuller (ADF) tests to analyze the stationarity properties of the variables present. The results presented in Table 4 show that all variables are nonstationary at the levels, but become stationary after first-order differencing. This confirms that all variables have first-order integration, i.e., I(1), and since none of them has I(2), the necessary condition for applying the ARDL bounds test approach is fulfilled.

4.2. Cointegration Test Results

The ARDL bounds test was employed to ascertain the presence of a long-term association between the variables. As shown in Table 5, the calculated F-statistic value (8.326) exceeds the upper critical threshold value (6.988) at the 1% significance level for the limited sample size (n = 30). This result clearly rejects the null hypothesis of no cointegration and confirms the existence of a robust long-run equilibrium relationship between CO2 emissions, economic growth, service sector expansion, and urbanization in Uzbekistan.

4.3. Long-Run Estimates

After confirming cointegration, long-run coefficients were estimated using the ARDL(2, 4, 2, 0) specification. The results presented in Table 6 reveal several important conclusions regarding the determinants of CO2 emissions in Uzbekistan.
The coefficient of economic growth (LNGDP) is negative (−0.243) and statistically significant at the 1 percent level, indicating that a 1 percent increase in GDP per capita leads to a 0.24 percent reduction in CO2 emissions in the long run. This result empirically substantiates the Environmental Kuznets Curve (EKC) hypothesis in Uzbekistan and indicates that the country has passed the tipping point where economic growth begins to contribute to environmental improvements.
It should be noted that the EKC literature distinguishes between two empirically observable phases: the ascending phase (in which the income coefficient is positive and significant) and the descending phase (in which the income coefficient is negative and significant). The standard quadratic EKC specification with both linear and squared GDP terms is most informative when the sample contains both phases, allowing identification of the turning point. For countries such as Uzbekistan, where the observed sample period falls predominantly within the descending portion of the curve—as evidenced by the consistently negative income elasticity and the prolonged decoupling of emissions from growth visible in the underlying time series—a linear specification provides a parsimonious and interpretable representation. This approach is consistent with recent EKC studies that adopt a linear specification when the descending phase dominates the sample (Adebayo & Kirikkaleli, 2021; Pata & Caglar, 2021), and it avoids the multicollinearity concerns that can arise when including both GDP and GDP2 in a small-sample ARDL framework (Narayan, 2005).
In contrast, the expansion of the services sector (LNSERV) has a positive and statistically significant coefficient at the 10 percent level (1.373), indicating that a 1 percent increase in the share of the services sector in GDP leads to a 1.37 percent increase in CO2 emissions. This is contrary to expectations and may be due to the dominance of traditional energy-intensive services such as transport, logistics, and traditional retail in the structure of Uzbekistan’s services sector.
Similarly, urbanization growth (LNURBAN_GR) also has a positive and statistically significant effect at the 5 percent level (0.374), indicating that a 1 percent increase in urban population growth leads to a 0.37 percent increase in CO2 emissions. This result is consistent with the “urban sprawl” hypothesis, which states that rapid urbanization in transition economies increases energy demand for housing, transport, and infrastructure development.

4.4. Short-Run Dynamics and Error Correction Model

The short-term dynamics and the rate of adjustment to the long-term equilibrium are determined by the Error Correction Model (ECM). The results presented in Table 7 show that the error correction coefficient (CointEq(−1)) is negative (−0.665) and has high statistical significance at the 1 percent level, which confirms the reliability of the long-term equilibrium relationship.
The magnitude of the error correction coefficient (−0.665) indicates a relatively fast correction rate, i.e., almost 66.5 percent of any deviation from the long-run equilibrium is eliminated within a year. From this, we can understand that after any short-run change, it takes about 1.5 years (1/0.665 ≈ 1.50) for the system to fully return to the long-run equilibrium. Such a high correction rate indicates that the Uzbek economy is significantly sensitive to policy measures aimed at environmental management.
The R-squared value is 0.722, indicating that the model explains approximately 72.2% of the variation in CO2 emission changes, indicating a good fit of the model. The F-statistic (6.810) is highly significant (p < 0.001), confirming the overall validity of the model. The Durbin-Watson statistic (2.123) is close to 2, indicating that there is no first-order autocorrelation in the residuals.

4.5. Diagnostic Test Results

The reliability and validity of the estimated ARDL model require validation through extensive diagnostic tests. The results presented in Table 8 show that the model satisfies all the classical conditions necessary for valid statistical inference.
The results of the Breusch–Godfrey LM test (F-statistic = 3.356, p = 0.163) obtained in the study indicate that the null hypothesis of no serial correlation is not rejected, while the results of the Breusch–Pagan–Godfrey test (F-statistic = 0.929, p = 0.542) confirm the absence of heteroscedasticity. These results indicate the effectiveness of the estimated coefficients and the reliability of the results of the hypothesis tests.

4.6. Stability Test Results

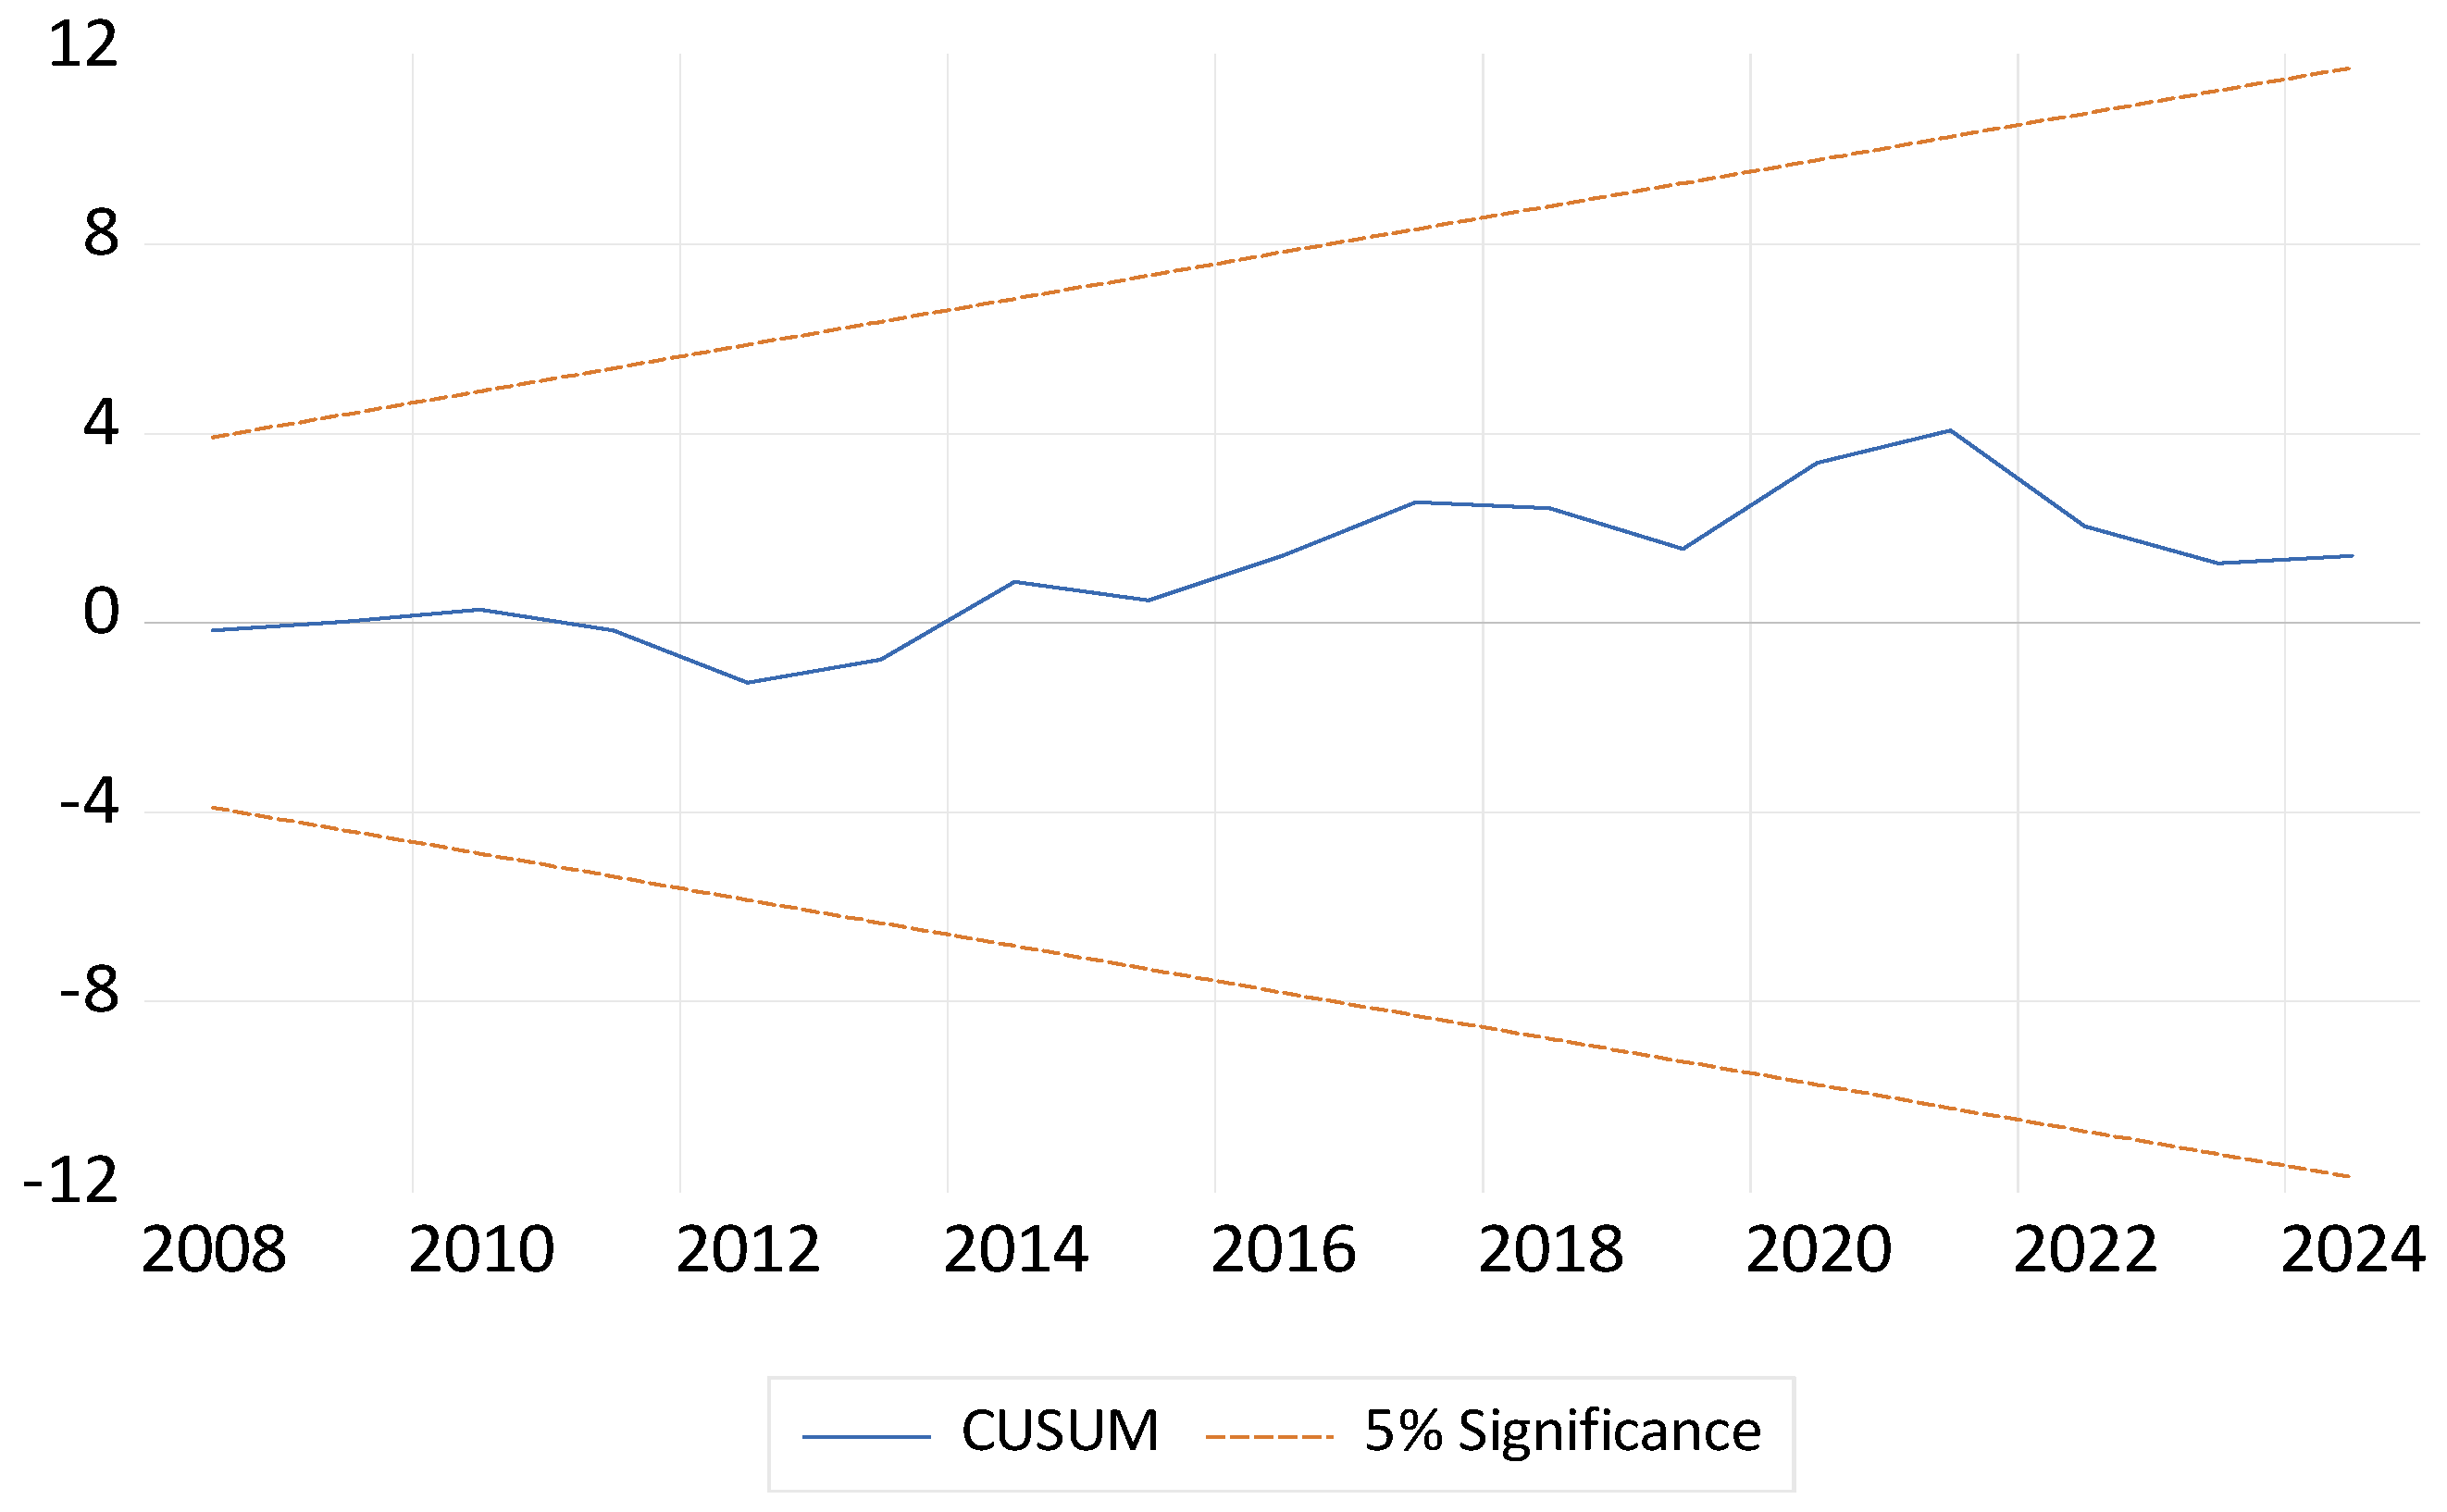
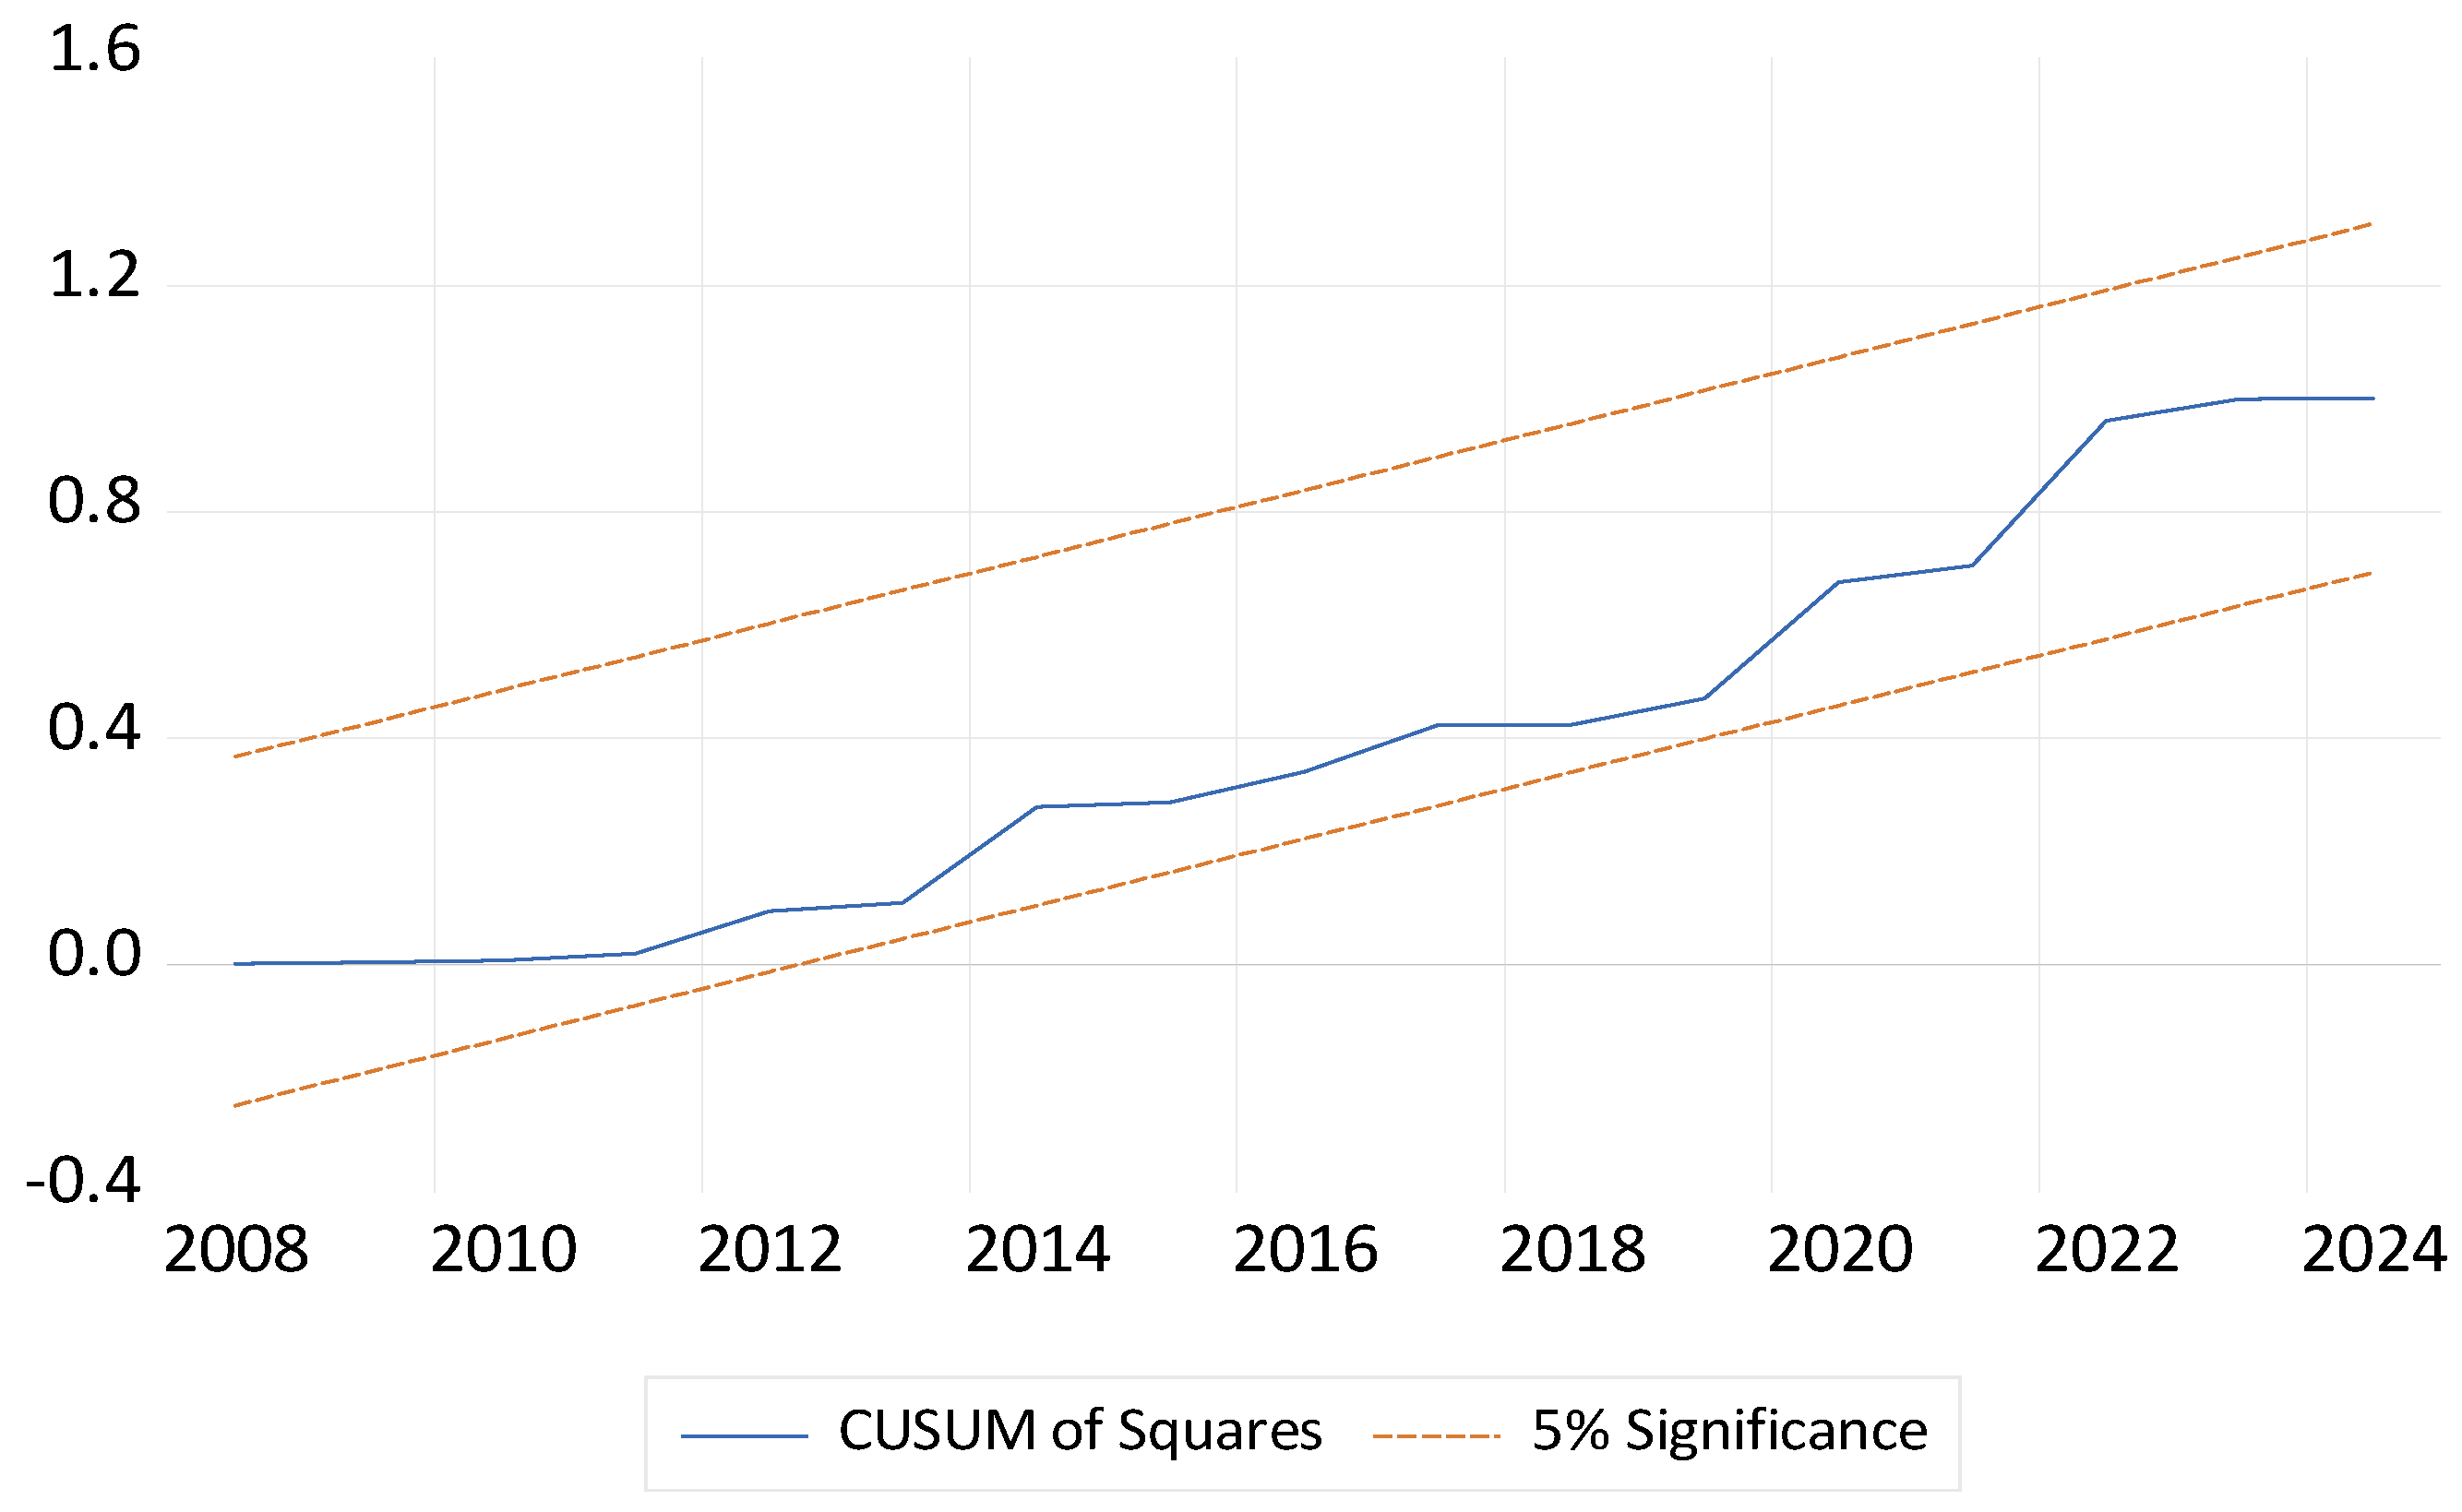
The structural stability of the estimated long-run coefficients was assessed using the Cumulative Sum (CUSUM) and Cumulative Sum of Squares (CUSUMSQ) tests proposed by Brown et al. (1975). As shown in Figure 2 and Figure 3, the plots of the CUSUM and CUSUMSQ statistics, respectively, remain within the 5 percent critical bounds throughout the sample period. While the CUSUM test assesses the stability of the estimated regression coefficients, the CUSUMSQ test additionally evaluates the stability of the residual variance. Since neither statistic crosses its respective critical bounds, the null hypothesis of parameter constancy cannot be rejected. This confirms that the estimated parameters are structurally stable over time and indicates that the model is suitable for policy analysis and forecasting.

5. Discussion

The empirical results of this study provide important insights into the complex dynamics between economic development and environmental quality in Uzbekistan. This section discusses the main results within the framework of existing theoretical frameworks and empirical studies, while also focusing on the specific characteristics of Uzbekistan as a transition economy in Central Asia.
The negative and statistically significant relationship between economic growth (LNGDP) and CO2 emissions is one of the most striking findings of this study. The negative and statistically significant long-run elasticity reported in Section 4.3 carries substantive interpretive weight: it indicates that Uzbekistan has passed the tipping point in the EKC, the threshold beyond which further income growth is associated with environmental improvement rather than deterioration. This result provides strong empirical support for the Environmental Kuznets Curve (EKC) hypothesis and suggests that Uzbekistan has passed the tipping point where economic growth shifts from having a negative to a positive impact on the environment.
This result is consistent with the study of Grossman and Krueger (1995) and with recent empirical evidence from transition economies. Shahbaz et al. (2013) reported similar results for several developing countries using ARDL methodology, while Ozturk and Acaravci (2010) confirmed the EKC hypothesis in Turkey. However, our results differ from studies such as Apergis and Ozturk (2015), who found that the validity of the EKC hypothesis depends largely on the institutional quality and governance system in the country.
The confirmation of the EKC hypothesis in Uzbekistan can be explained by several main mechanisms. The country has undergone significant economic restructuring since independence, gradually moving away from heavy industry to more diversified economic activities. The government’s focus on the “Green Economy Strategy” has encouraged investment in clean technologies and renewable energy sources. Third, rising income levels have increased the population’s awareness and demand for environmental quality, which is consistent with the theoretical predictions of the EKC (Stern, 2004).
Despite the above results, it is important to interpret this result with caution. The negative coefficient does not mean that economic growth automatically improves environmental quality, but rather it indicates that the current trajectory of Uzbekistan’s development, combined with policy measures, has reached a stage where growth and environmental improvement can coexist. Continuing active environmental policies will be necessary to maintain this positive relationship.
Our finding of a negative long-run elasticity between GDP per capita and CO2 emissions is consistent with several recent empirical studies. Sarkodie and Strezov (2019), in a comprehensive meta-analysis of the EKC literature, and Pata and Caglar (2021), using augmented ARDL with structural breaks for China, both report long-run emission reductions associated with rising income. Adebayo and Kirikkaleli (2021) document a similar pattern for Japan. However, our result diverges from Akadiri et al. (2020), who report a monotonically increasing income–emissions relationship for several African economies, and from Apergis and Ozturk (2015), who emphasize that EKC validity depends critically on institutional quality. This divergence underscores that the income–emissions relationship is not universal but is conditioned by the country’s stage of structural transformation, energy mix, and governance quality—factors that have all evolved favorably in Uzbekistan since the 2017 reforms.
The results of the analysis show that, contrary to conventional expectations, the expansion of the services sector (LNSERV) has a positive and statistically significant effect on CO2 emissions, with a long-run elasticity of 1.373. This result indicates that a 1% increase in the share of the services sector in GDP leads to an increase in carbon emissions of approximately 1.37%, making it the strongest factor influencing environmental degradation among the variables studied.
This empirical result contradicts the conventional wisdom that service-oriented economies are inherently cleaner than manufacturing-oriented economies (Zaman et al., 2016). In the context of Uzbekistan, this unexpected result can be explained by several factors. The composition of Uzbekistan’s services sector means that it is not dominated by knowledge-based or digital services, but still by energy-intensive activities such as transport, logistics, wholesale and retail trade, and traditional commerce. These subsectors require large amounts of energy for fleets, warehouses, refrigeration systems, and physical infrastructure.
The underdevelopment of financial technology (FinTech) and digital services in Uzbekistan means that the potential benefits of modernizing the services sector in terms of reducing emissions have not yet been realized. Recent studies by Zhao et al. (2021) and Deng et al. (2020) show that digitizing services, expanding e-commerce, and introducing green financing mechanisms can significantly reduce the carbon footprint of the third sector.
In transition economies, the rapid expansion of the services sector often occurs without sufficient attention to energy efficiency standards and environmental regulations. Martínez-Zarzoso and Maruotti (2011) have noted similar developments in other developing countries, where the growth of the services sector has been accompanied by an increase in motor transport and commercial energy consumption.
These results have important implications for Uzbekistan’s development strategy. Simply expanding the services sector without considering its structure and energy efficiency will not bring environmental benefits. Policymakers should prioritize the development of green and digital services, introduce energy efficiency standards for commercial buildings and transport, and encourage the use of clean technologies in traditional service subsectors.
The positive sign on the service sector coefficient aligns with the findings of Lin and Zhu (2019) for China and the broader evidence summarized by Sadorsky (2014), which show that transport- and trade-intensive service activities can raise rather than lower national emissions. In contrast, our result diverges from Zaman et al. (2016) and from studies in mature service-based economies, where digitalized, knowledge-intensive services dominate and produce a net emissions-reducing effect. This contrast supports the view that the environmental impact of the service sector is not determined by its overall size but by its internal composition—specifically, the relative weight of traditional energy-intensive services versus digital, financial, and knowledge-based services. Uzbekistan’s current service sector profile leans heavily toward the former, which explains the unexpected positive coefficient.
The positive and statistically significant coefficient of urbanization growth (0.374) indicates that rapid urban population growth contributes to the increase in CO2 emissions in Uzbekistan. This result is consistent with the “urban sprawl” hypothesis and contradicts the ecological modernization theory, which states that urbanization can improve environmental quality through economies of scale and technological innovation (Poumanyvong & Kaneko, 2010).
The construction sector associated with urban development is inherently carbon-intensive, as it requires large volumes of cement, steel, and other high-carbon-intensive materials. Ali et al. (2019) reported similar results in other Central Asian countries and attributed the positive relationship between urbanization and emissions to inadequate urban planning and lack of sustainable construction practices.
Our results are consistent with those of Martínez-Zarzoso and Maruotti (2011), who found that urbanization in developing countries increases CO2 emissions due to unsustainable urban development patterns. However, these results differ from studies in developed countries, where mature urban systems with efficient public transport and strict building codes have been able to decouple urban growth from emissions growth.
This finding is consistent with Martínez-Zarzoso and Maruotti (2011) and Ali et al. (2019), who both report positive urbanization–emission elasticities in developing-country settings. Conversely, Poumanyvong and Kaneko (2010) and Liddle (2014) document that urbanization in high-income economies can produce per capita emission reductions through agglomeration efficiencies, denser public transport networks, and stricter building regulations. The contrast between these two sets of findings indicates that Uzbekistan is currently positioned in the early “carbon-intensive” phase of urban development, where infrastructure expansion outpaces efficiency gains. This positioning, however, also implies a policy window: targeted urban planning interventions can shift the country onto the lower-emission urban development pathway observed in more mature urban systems.
The outcome of the EKC hypothesis in Uzbekistan is a noteworthy result, given the country’s status as a landlocked country with unique geographical and economic constraints. Unlike coastal economies that can benefit from the efficiency of maritime trade, Uzbekistan’s transport sector faces inherent constraints that can hinder environmental improvements. Despite the above results, the fact that economic growth is negatively associated with emissions suggests that other factors, including policy measures and structural changes, have been effective in decoupling growth from environmental degradation.
The significant positive impact of the expansion of the services sector and urbanization on emissions distinguishes Uzbekistan from advanced transition economies in Eastern Europe, where such structural changes have typically been associated with emissions reductions. This difference suggests that it is not just the direction of economic change that matters, but also its composition and quality.
Limitations and alternative interpretations. Several caveats should accompany the interpretation of our findings. First, the analysis relies on aggregate national-level data and cannot capture sub-national heterogeneity—an important consideration in a country where economic structure and urban density vary substantially across provinces. Second, the model does not explicitly include several potentially relevant variables, notably renewable energy consumption, foreign direct investment, and trade openness; their omission may bias the estimated elasticities, and future studies with longer or higher-frequency data could incorporate them. Third, the negative income elasticity we report should not be interpreted as evidence that economic growth automatically improves environmental quality; rather, it reflects the joint outcome of growth, structural change, and the policy environment in place during the sample period. Fourth, although the ARDL framework is robust in small samples, the relatively short series (n = 34) limits the power of structural break and nonlinearity tests; future work using longer panels for Central Asian economies could employ nonlinear ARDL (NARDL) or quantile cointegration techniques to test for asymmetric responses. Recognizing these limitations strengthens, rather than weakens, the policy relevance of our findings: the observed long-run patterns indicate the direction of structural pressures on Uzbekistan’s emission trajectory, while acknowledging that the magnitude of those pressures will depend on policy choices yet to be made.

6. Conclusions

The investigation employed an Autoregressive Distributed Lag (ARDL) model predicated on annual data spanning from 1991 to 2024. The findings indicated that there exists a long-term equilibrium among CO2 emissions, Gross Domestic Product (GDP), the services sector, and urbanization.
Three central findings emerge from the empirical analysis. First, economic growth is associated with a long-run reduction in CO2 emissions, providing evidence consistent with Uzbekistan operating on the descending phase of the EKC. Second, service sector expansion exerts a positive and statistically significant long-run effect on emissions, reflecting the dominance of traditional, energy-intensive sub-sectors such as transport, logistics, and commerce. Third, urban population growth amplifies emissions, consistent with the urban sprawl pattern observed in early-stage urbanization.
The error-correction model demonstrated a reversion to equilibrium at a rate of 66.5% per annum, suggesting that the efficacy of the policy interventions will become evident in approximately 1.5 years.
Based on the empirical findings, we propose four interrelated policy recommendations for Uzbekistan.
First, deepening the green economic growth strategy. The negative long-run association between GDP per capita and CO2 emissions indicates that Uzbekistan has crossed the EKC turning point, but sustaining this trajectory requires continued active policy. The government should reinforce its “Strategy for the Transition to a Green Economy 2019–2030” by: (a) piloting a carbon pricing mechanism or limited emissions trading scheme in the highest-emitting sectors; (b) accelerating renewable energy deployment, exploiting Uzbekistan’s substantial solar irradiation potential; and (c) phasing out fossil-fuel subsidies that distort relative prices and weaken low-carbon investment incentives.
Second, modernization and digitalization of the service sector. Because the positive service sector elasticity is driven by traditional carbon-intensive sub-activities, policy should target structural upgrading within services: (a) accelerated adoption of FinTech, e-commerce, and digital government services to reduce physical movement and paper-based transactions; (b) mandatory energy-efficiency standards for commercial buildings (cooling, lighting, ventilation); (c) low-carbon logistics measures such as fleet electrification, last-mile optimization, and warehouse efficiency standards; and (d) green tax incentives for service firms adopting verified low-carbon practices.
Third, sustainable urban planning and smart city adoption. To moderate the urbanization–emissions link: (a) implement smart city master plans in Tashkent, Samarkand, Bukhara, and other major centers; (b) prioritize the electrification and expansion of public transport (BRT corridors, metro extensions, electric bus fleets); (c) enforce green building codes (insulation, passive design, certified low-carbon materials) for new residential and commercial construction; and (d) safeguard and expand urban green spaces, which provide both carbon sink and urban cooling co-benefits.
Fourth, human capital and institutional reforms. (a) Large-scale reskilling and upskilling programs to prepare the workforce for green and digital occupations; (b) systematic integration of environmental impact assessments into all major public investment projects; (c) strengthening environmental monitoring agencies, statistical capacity, and public data transparency; and (d) regional cooperation with neighboring Central Asian states on transboundary environmental issues such as the Aral Sea basin and sand and dust storm mitigation.
The error-correction coefficient of −0.665 indicates that approximately two-thirds of any deviation from the long-run equilibrium is eliminated within one year, implying that the effects of well-designed policy interventions should become measurable within roughly 18 months. This relatively rapid adjustment provides a credible time horizon for sequencing the reforms above within a single political cycle and supports the case for early implementation.
There are also limitations inherent in the study: the analysis is contingent upon aggregated data at the national level, and variations within the cross-section of the provinces are not considered. Furthermore, the model did not encompass variables such as foreign direct investment, renewable energy consumption, and trade openness. Future investigations would benefit from conducting a comparative panel analysis across Central Asian nations and employing nonlinear ARDL and quantile regression methodologies.
In conclusion, while economic expansion in Uzbekistan has begun to have a beneficial effect on the environment, traditional services and accelerated urbanization continue to impose significant environmental pressures. To attain sustainable development, it is imperative to alter the composition of economic growth, modernize the services sector, and ensure ecological advancement in urban areas.


Author Contributions

Conceptualization, F.A. and F.X.; methodology, F.X. and N.R.; software, F.A.; validation, N.R., E.I. and D.S.; formal analysis, F.X. and F.A.; investigation, E.I. and X.R.; resources, D.S. and D.H.; data curation, X.R. and E.I.; writing—original draft preparation, F.A. and F.X.; writing—review and editing, N.R., D.S. and D.H.; visualization, F.A. and X.R.; supervision, N.R.; project administration, F.X. All authors have read and agreed to the published version of the manuscript.

Funding

This research received no external funding.

Institutional Review Board Statement

Not applicable.

Informed Consent Statement

Not applicable.

Data Availability Statement

The data used in this study are openly available from the World Bank World Development Indicators (WDI) data-base at https://databank.worldbank.org/source/world-development-indicators (accessed on 9 June 2026) and from Climate Watch at https://www.climatewatchdata.org (accessed on 9 June 2026). The processed dataset is available from the corresponding author upon rea-sonable request.

Conflicts of Interest

The authors declare no conflicts of interest.

References

  1. Adebayo, T. S., & Kirikkaleli, D. (2021). Impact of renewable energy consumption, globalization, and technological innovation on environmental degradation in Japan: Application of wavelet tools. Environment, Development and Sustainability: A Multidisciplinary Approach to the Theory and Practice of Sustainable Development, 23(11), 16057–16082. [Google Scholar] [CrossRef] [Scilit]
  2. Adela, H. A., Aldhaheri, W. B. H., & Ali, A. H. (2025). Dynamic impacts of economic growth, energy use, urbanization, and trade openness on carbon emissions in the United Arab Emirates. Sustainability, 17(13), 5823. [Google Scholar] [CrossRef] [Scilit]
  3. Ahmad, F., Boumaiza, A., Sanfilippo, A., & Al-Fagih, L. (2025). A detailed comprehensive role of digital technologies in green finance initiative for net-zero energy transition. Advanced Energy and Sustainability Research, 6(10), 2500066. [Google Scholar] [CrossRef] [Scilit]
  4. Akadiri, S. S., Lasisi, T. T., Uzuner, G., & Akadiri, A. C. (2020). Examining the causal impacts of tourism, globalization, economic growth and carbon emissions in tourism island territories: Bootstrap panel Granger causality analysis. Current Issues in Tourism, 23(4), 470–484. [Google Scholar] [CrossRef] [Scilit]
  5. Ali, R., Bakhsh, K., & Yasin, M. A. (2019). Impact of urbanization on CO2 emissions in emerging economy: Evidence from Pakistan. Sustainable Cities and Society, 48, 101553. [Google Scholar] [CrossRef] [Scilit]
  6. Alwaked, A. A., Al-qalawi, U. R., & Nawasreh, A. (2025). Carbon-conscious development: Examining FDI, economic growth, and CO2 emissions in Jordan. International Journal of Innovative Research and Scientific Studies, 8(2), 2334–2344. [Google Scholar] [CrossRef] [Scilit]
  7. Apergis, N., & Ozturk, I. (2015). Testing environmental Kuznets curve hypothesis in Asian countries. Ecological Indicators, 52, 16–22. [Google Scholar] [CrossRef] [Scilit]
  8. Belgacem, I. (2025). Toward a low-carbon transport strategy in Saudi Arabia: Empirical insights from climate-emissions dynamics. Journal of Environment and Development, 34(4), 1049–1072. [Google Scholar] [CrossRef] [Scilit]
  9. Brown, R. L., Durbin, J., & Evans, J. M. (1975). Techniques for testing the constancy of regression relationships over time. Journal of the Royal Statistical Society Series B: Statistical Methodology, 37(2), 149–163. [Google Scholar] [CrossRef] [Scilit]
  10. Chen, Q., & Wang, J. (2025). The impact of digital economic growth and financial expansion on CO2 mitigation strategies in leading emitting countries. Scientific Reports, 15(1), 10515. [Google Scholar] [CrossRef] [Scilit] [PubMed]
  11. Danish, Ulucak, R., & Khan, S. U. D. (2020). Determinants of the ecological footprint: Role of renewable energy, natural resources, and urbanization. Sustainable Cities and Society, 54, 101996. [Google Scholar] [CrossRef] [Scilit]
  12. Deng, Q., Alvarado, R., Toledo, E., & Caraguay, L. (2020). Greenhouse gas emissions, non-renewable energy consumption, and output in South America: The role of the productive structure. Environmental Science and Pollution Research International, 27(13), 14477–14491. [Google Scholar] [CrossRef] [Scilit] [PubMed]
  13. Dickey, D. A., & Fuller, W. A. (1981). Likelihood ratio statistics for autoregressive time series with a unit root. Econometrica, 49(4), 1057. [Google Scholar] [CrossRef] [Scilit]
  14. Grossman, G. M., & Krueger, A. B. (1991). Environmental impacts of a North American free trade agreement. National Bureau of Economic Research. [Google Scholar] [CrossRef] [Scilit]
  15. Grossman, G. M., & Krueger, A. B. (1995). Economic growth and the environment. The Quarterly Journal of Economics, 110(2), 353–377. [Google Scholar] [CrossRef] [Scilit]
  16. Halmuratov, G., Madraximov, Q., Zakirova, G., Xolmuratov, X., Djumabayeva, S., Yaqubova, Y., & Xolmurotov, F. (2025a). The impact of energy consumption and trade openness on economic growth in Uzbekistan: A vecm approach. International Journal of Energy Economics and Policy, 15(2), 23–31. [Google Scholar] [CrossRef] [Scilit]
  17. Halmuratov, G., Rustamov, K., Khankelov, T., Xolmuratov, X., Khudainazarov, S., Sabirjanov, T., & Xolmurotov, F. (2025b). The relationship between renewable energy production and economic growth: A short-term and long-term analysis in the case of Uzbekistan. International Journal of Energy Economics and Policy, 15(3), 567–575. [Google Scholar] [CrossRef] [Scilit]
  18. IEA. (2023). Executive summary. In CO2 emissions in 2023—Analysis. IEA. Available online: https://www.iea.org/reports/co2-emissions-in-2023/executive-summary (accessed on 9 June 2026).
  19. Koirala, B., Pradhan, G., & Mensah, E. C. (2025). The environmental Kuznets curve and CO2 emissions under policy uncertainty in G7 countries. Economies, 13(12), 363. [Google Scholar] [CrossRef] [Scilit]
  20. Li, R., Zhang, S., Wang, Q., & Hu, S. (2025). Fintech and urban environmental sustainability: Exploring the impact of financial technology on urban carbon emissions. Sustainable Development, 33(2), 2118–2136. [Google Scholar] [CrossRef] [Scilit]
  21. Liddle, B. (2014). Impact of population, age structure, and urbanization on carbon emissions/energy consumption: Evidence from macro-level, cross-country analyses. Population and Environment, 35(3), 286–304. [Google Scholar] [CrossRef] [Scilit]
  22. Lin, B., & Zhu, J. (2019). Impact of energy saving and emission reduction policy on urban sustainable development: Empirical evidence from China. Applied Energy, 239, 12–22. [Google Scholar] [CrossRef] [Scilit]
  23. Mahmood, H., Maalel, N., & Zarrad, O. (2019). Trade openness and CO2 emissions: Evidence from Tunisia. Sustainability, 11(12), 3295. [Google Scholar] [CrossRef] [Scilit]
  24. Martínez-Zarzoso, I., & Maruotti, A. (2011). The impact of urbanization on CO2 emissions: Evidence from developing countries. Ecological Economics, 70(7), 1344–1353. [Google Scholar] [CrossRef] [Scilit]
  25. Narayan, P. K. (2005). The saving and investment nexus for China: Evidence from cointegration tests. Applied Economics, 37(17), 1979–1990. [Google Scholar] [CrossRef] [Scilit]
  26. Nawaz, F., Kayani, U., Fahlevi, M., Aziz, A. L., & Jung, T. (2025). Evaluating the impact of inward FDI & economic growth upon the carbon emissions of South Korea. Foresight and STI Governance, 19(3), 6–15. [Google Scholar] [CrossRef] [Scilit]
  27. Nica, I., Georgescu, I., & Kinnunen, J. (2025). Economic growth, innovation, and CO2 emissions: Analyzing the environmental Kuznets curve and the innovation Claudia curve in BRICS countries. Sustainability, 17(8), 3507. [Google Scholar] [CrossRef] [Scilit]
  28. Nkoro, E., & Uko, A. K. (2016). Autoregressive Distributed Lag (ARDL) cointegration technique: Application and interpretation. Journal of Statistical and Econometric Methods, 5(4), 1–3. [Google Scholar]
  29. Nurjanov, A., Xolmurotov, F., Ibadullaev, E., Ataniyazov, J., Masharipova, M., Yusupova, F., & Xolmuratov, X. (2025). The impact of renewable energy consumption on export performance in Uzbekistan: A vector autoregression approach. Environmental Economics, 16(2), 186–198. [Google Scholar] [CrossRef] [Scilit]
  30. Ozturk, I., & Acaravci, A. (2010). CO2 emissions, energy consumption and economic growth in Turkey. Renewable and Sustainable Energy Reviews, 14(9), 3220–3225. [Google Scholar] [CrossRef] [Scilit]
  31. Pata, U. K., & Caglar, A. E. (2021). Investigating the EKC hypothesis with renewable energy consumption, human capital, globalization and trade openness for China: Evidence from augmented ARDL approach with a structural break. Energy, 216, 119220. [Google Scholar] [CrossRef] [Scilit]
  32. Pesaran, M. H., Shin, Y., & Smith, R. J. (2001). Bounds testing approaches to the analysis of level relationships. Journal of Applied Econometrics, 16(3), 289–326. [Google Scholar] [CrossRef] [Scilit]
  33. Poumanyvong, P., & Kaneko, S. (2010). Does urbanization lead to less energy use and lower CO2 emissions? A cross-country analysis. Ecological Economics, 70(2), 434–444. [Google Scholar] [CrossRef] [Scilit]
  34. President of the Republic of Uzbekistan. (2019). Resolution of the president no. PP-4477 of 2019 on the strategy for the transition to a green economy for 2019–2030|ESCAP policy documents managment. President of the Republic of Uzbekistan. Available online: https://policy.asiapacificenergy.org/node/4379 (accessed on 9 June 2026).
  35. Sadorsky, P. (2014). The effect of urbanization on CO2 emissions in emerging economies. Energy Economics, 41, 147–153. [Google Scholar] [CrossRef] [Scilit]
  36. Sarkodie, S. A., & Strezov, V. (2019). A review on environmental Kuznets curve hypothesis using bibliometric and meta-analysis. Science of the Total Environment, 649, 128–145. [Google Scholar] [CrossRef] [Scilit] [PubMed]
  37. Shahbaz, M., Solarin, S. A., Mahmood, H., & Arouri, M. (2013). Does financial development reduce CO2 emissions in Malaysian economy? A time series analysis. Economic Modelling, 35, 145–152. [Google Scholar] [CrossRef] [Scilit]
  38. Stern, D. I. (2004). The rise and fall of the environmental Kuznets curve. World Development, 32(8), 1419–1439. [Google Scholar] [CrossRef] [Scilit]
  39. Wang, Q., Li, C., & Li, R. (2025). How does renewable energy consumption and trade openness affect economic growth and carbon emissions? International evidence of 122 countries. Energy and Environment, 36(1), 187–211. [Google Scholar] [CrossRef] [Scilit]
  40. Wang, Y., Li, N., & Zhao, Z. (2025). Mechanisms of digital economy development driving CO2 emission evolution: Empirical evidence from China. Clean Energy, 9(3), 35–45. [Google Scholar] [CrossRef] [Scilit]
  41. World Bank. (2022). Green growth and climate change in Uzbekistan policy dialogue series: A compendium of proceedings. World Bank. [Google Scholar] [CrossRef] [Scilit]
  42. Xolmurotov, F., Gadoeva, M., Uraeva, D., Eshmuratova, D., Ishmuratov, X., Xolmuratov, X., & Matnazarov, A. (2025a). Mapping the evolution and intellectual structure of innovation marketing research: A comprehensive bibliometric analysis (1972–2025). Innovative Marketing, 21(4), 1–15. [Google Scholar] [CrossRef] [Scilit]
  43. Xolmurotov, F., Khamidov, O., Davlatov, S., Ibadullaev, E., Xolmuratov, X., Sherov, A., & Arabova, G. (2025b). The impact of renewable energy consumption on unemployment rates in Uzbekistan: An ARDL approach. Environmental Economics, 16(1), 78–88. [Google Scholar] [CrossRef] [Scilit]
  44. Xolmurotov, F., & Xolmuratov, X. (2025). The impact of information and communication technology (ICT) and bank credit on agricultural performance in Uzbekistan: An econometric analysis. Agris On-Line Papers in Economics and Informatics, 2, 125–134. [Google Scholar] [CrossRef] [Scilit]
  45. Zaman, K., Shahbaz, M., Loganathan, N., & Raza, S. A. (2016). Tourism development, energy consumption and environmental Kuznets curve: Trivariate analysis in the panel of developed and developing countries. Tourism Management, 54, 275–283. [Google Scholar] [CrossRef] [Scilit]
  46. Zhakiyev, N., Khamzina, A., Toimbek, D., Omirgaliyev, R., Shakib Kotamjani, S., Alhuyi Nazari, M., & Salem, M. (2025). Energy systems, CO2 emissions, and mitigation policies in three Central Asian countries: A comprehensive review. Energy Strategy Reviews, 62, 101883. [Google Scholar] [CrossRef] [Scilit]
  47. Zhao, J., Shahbaz, M., Dong, X., & Dong, K. (2021). How does financial risk affect global CO2 emissions? The role of technological innovation. Technological Forecasting and Social Change, 168, 120751. [Google Scholar] [CrossRef] [Scilit]
Figure 1. Scatter plots of CO2 emissions (Mt CO2e) against (a) GDP per capita (current US$), (b) services value added (% of GDP), and (c) urban population growth (annual %), based on untransformed annual data for Uzbekistan, 1991–2024. The solid lines represent fitted quadratic trends. The vertical dashed line in panel (a) marks the vertex of the fitted quadratic, at approximately USD 1517 of per capita income; since this bivariate fit does not control for the time trend or other covariates, the value is indicative rather than a structural EKC estimate. Source: World Bank WDI and Climate Watch.
Economies 14 00303 g001
Figure 2. Plot of the CUSUM stability test.
Economies 14 00303 g002
Figure 3. Plot of the CUSUM of Squares stability test. Note: The statistic remains within the 5% significance bounds, confirming the stability of the residual variance.
Economies 14 00303 g003
Table 1. Variable Definitions and Data Sources.
VariableSymbolDefinitionUnitSource
CO2 EmissionsLNCO2Total CO2 emissions excluding LULUCFMt CO2e (log)Climate Watch
Economic GrowthLNGDPGDP per capitaCurrent US$ (log)World Bank WDI
Service SectorLNSERVServices, value added% of GDP (log)World Bank WDI
UrbanizationLNURBAN_GRUrban population growthAnnual % (log)World Bank WDI
Table 2. Descriptive Statistics of Variables.
StatisticLNCO2LNGDPLNSERVLNURBAN_GR
Mean4.8217.0083.6310.784
Median4.8236.8473.6480.774
Maximum5.0018.0593.8111.309
Minimum4.6535.9443.2790.043
Std. Dev.0.0850.7210.1030.386
Skewness−0.2030.082−1.504−0.178
Kurtosis2.2891.3416.1851.908
Jarque–Bera0.9493.93627.1861.869
Probability0.6220.1400.0000.393
Observations34343434
Table 3. Descriptive Statistics of Variables (untransformed data).
StatisticCO2 (Mt CO2e)GDP per Capita (US$)Services
(% of GDP)
Urban Pop. Growth (%)
Mean124.4981406.98537.9222.349
Median124.369949.37938.3812.168
Maximum148.5393161.70045.1923.703
Minimum104.912381.40926.5391.044
Std. Dev.10.526933.8203.6270.867
Skewness−0.0410.417−1.0590.264
Kurtosis2.3531.5575.1001.738
Jarque–Bera0.6023.93212.6052.651
Probability0.7400.1400.0020.266
Observations34343434
Table 4. Augmented Dickey–Fuller (ADF) Unit Root Test Results.
VariableLevel First Difference Integration
t-StatisticProb.t-StatisticProb.Order
LNCO2−1.6650.439−5.926 ***0.000I(1)
LNGDP1.0640.921−2.679 ***0.009I(1)
LNSERV2.5700.997−4.107 ***0.000I(1)
LNURBAN_GR−1.0830.247−5.216 ***0.000I(1)
Note: *** denotes significance at the 1% level. Optimal lag lengths were selected automatically based on the Schwarz Information Criterion (SIC) with a maximum lag of 8.
Table 5. ARDL Bounds Test Results.
Test StatisticValueSignificance LevelI(0) BoundI(1) Bound
F-statistic8.32610%3.3784.274
k35%4.0485.090
Sample size (n)301%5.6666.988
Note: Critical values are based on Narayan (2005) for finite samples. k represents the number of explanatory variables.
Table 6. Estimated Long-Run Coefficients (Dependent Variable: LNCO2).
VariableCoefficientStd. Errort-StatisticProb.
LNGDP−0.243 ***0.063−3.8220.001
LNSERV1.373 *0.6572.0910.052
LNURBAN_GR0.374 **0.1632.2990.034
@TREND0.020 **0.0082.5470.021
Note: ***, **, and * denote significance at the 1%, 5%, and 10% levels, respectively.
Table 7. Error Correction Model (ECM) Results.
VariableCoefficientStd. Errort-StatisticProb.
C0.588 ***0.0817.2550.000
D(LNCO2(−1))−0.278 **0.127−2.1960.042
D(LNGDP)−0.0870.064−1.3440.197
D(LNGDP(−1))0.127 *0.0721.7780.093
D(LNGDP(−2))0.188 **0.0792.3910.029
D(LNGDP(−3))0.269 ***0.0743.6550.002
D(LNSERV)−0.3500.275−1.2750.219
D(LNSERV(−1))−0.933 ***0.291−3.2060.005
CointEq(−1)−0.665 ***0.093−7.1710.000
Note: ***, **, and * denote significance at the 1%, 5%, and 10% levels, respectively. D denotes the first difference operator.
Table 8. Residual Diagnostic Test Results for the Estimated ARDL Model.
TestNull HypothesisF-StatisticProb.Decision
Breusch–Godfrey LMNo serial correlation3.3560.163Fail to reject H0
Breusch–Pagan–GodfreyHomoskedasticity0.9290.542Fail to reject H0
Note: The null hypotheses cannot be rejected at the 5% significance level.
Disclaimer/Publisher’s Note: The statements, opinions and data contained in all publications are solely those of the individual author(s) and contributor(s) and not of MDPI and/or the editor(s). MDPI and/or the editor(s) disclaim responsibility for any injury to people or property resulting from any ideas, methods, instructions or products referred to in the content.