Article

Structural Spillovers Among Bitcoin, Ethereum, Gold, and U.S. Equities: Evidence from the 2024 Spot ETF Institutionalization Regime


by
Wisam Bukaita
* and
Xinrui Li
Department of Math and Computer Science, Lawrence Technological University, Southfield, MI 48075, USA
*
Author to whom correspondence should be addressed.
Economies 2026, 14(4), 143; https://doi.org/10.3390/economies14040143
Submission received: 7 March 2026 / Revised: 9 April 2026 / Accepted: 13 April 2026 / Published: 19 April 2026

Abstract

This study examines dynamic interdependencies and risk transmission among major cryptocurrencies and traditional financial assets, including Bitcoin, Ethereum, U.S. equities, and gold, over the period 2017–2024. Particular attention is given to the structural shift associated with the 2024 U.S. spot Bitcoin exchange-traded fund (ETF) approval, which marked a significant milestone in the institutionalization of cryptocurrency markets. Using daily data, the analysis distinguishes volatility-driven co-movement from structural spillover effects across markets. Dependence structures are modeled using tail-sensitive Student-t copulas applied to GARCH-filtered returns to capture nonlinear and extreme co-movements, while a vector autoregressive framework combined with generalized impulse response functions and Diebold–Yilmaz connectedness measures is employed to evaluate order-invariant shock transmission dynamics across pre- and post-ETF regimes. The results reveal three main findings. First, cryptocurrencies display strong internal dependence and short-horizon contagion, with Bitcoin consistently acting as the dominant transmitter of shocks to Ethereum over an approximately three-day transmission window. Second, linkages between cryptocurrencies and equity markets remain moderate and largely regime-dependent rather than indicative of persistent structural spillovers. Third, gold remains weakly connected throughout the sample, maintaining its role as a diversification asset. Portfolio analysis further indicates that including Bitcoin can reduce portfolio variance by 4–7% and Value-at-Risk by up to 5%, although economic gains are sensitive to transaction costs. Overall, the findings suggest that cryptocurrencies function as a partially segmented asset class, offering conditional diversification benefits despite increasing institutional adoption.

1. Introduction

The rapid institutionalization of cryptocurrencies has transformed them from speculative digital instruments into assets increasingly held by institutional and retail investors. This development has intensified debate regarding their integration with traditional financial markets. Early theoretical foundations demonstrate that multivariate relationships can be decomposed into marginal distributions and dependence structures (Sklar, 1959), enabling copula-based modeling of nonlinear dependence. Later advances show that financial dependence is often asymmetric and time-varying (Patton, 2006), motivating the use of tail-sensitive models in empirical finance.
Cryptocurrency markets display strong volatility clustering and heavy-tailed return distributions comparable to traditional assets (Katsiampa, 2017). However, their dependence on equities and commodities remains unstable across time. During episodes such as the COVID-19 crisis and the global monetary tightening cycle, crypto–equity correlations increased significantly (Corbet et al., 2020). Yet correlation alone cannot distinguish between contagion and synchronized responses to common macroeconomic shocks. Rising correlations may reflect shared exposure to liquidity conditions and investor risk sentiment rather than structural transmission mechanisms (Bauri et al., 2020).
The diversification and safe-haven properties of cryptocurrencies, therefore, remain debated. Gold exhibits relatively stable defensive characteristics, whereas Bitcoin’s hedging effectiveness varies across regimes (Bauri et al., 2020). Crisis periods tend to increase co-movement between cryptocurrencies and traditional assets, but these effects are often temporary (Corbet et al., 2020). More recent research using dynamic and quantile-based frameworks documents tail spillovers and regime-dependent connectedness (Mensi et al., 2023). Similarly, connectedness studies across cryptocurrencies, commodities, and equities show that spillovers intensify during turbulent periods but weaken in stable regimes (Mezghani et al., 2024). These findings support a partially segmented market structure where cross-market transmission is episodic rather than persistent (Adelopo & Luo, 2025).
Despite these advances, an important empirical challenge remains: distinguishing volatility-driven co-movement from structural spillovers. To account for institutionalization effects, the empirical analysis incorporates regime-dependent dynamics and subsample comparisons surrounding major market events, including the 2024 spot Bitcoin ETF approval. Many studies rely on static correlations or linear models that fail to capture tail dependence and order-invariant shock transmission. Although quantile and connectedness approaches address some of these limitations (Mensi et al., 2023; Mezghani et al., 2024), results often remain sensitive to model specification and extreme events. Furthermore, increased correlations during crises may reflect shared macroeconomic exposure rather than direct contagion (W. P. Chen et al., 2025). Evidence also suggests that interconnectedness within the cryptocurrency ecosystem is stronger than cross-market spillovers, indicating partial segmentation (Aliu & Nuhiu, 2025). Iyer and Popescu (2023) provide additional evidence that cryptocurrencies can transmit shocks to traditional financial markets.
Recent studies further emphasize the importance of global spillover frameworks and multi-market transmission channels. Vuković et al. (2025) and Umar et al. (2025) demonstrate that spillover intensity varies across markets and time horizons, while emerging research highlights the role of additional asset classes and macro-financial linkages in shaping these dynamics (Atik et al., 2025). These findings reinforce the need for comprehensive modeling frameworks that capture both intra-market and cross-market dependencies.
This study addresses these limitations by integrating tail-sensitive copula modeling with dynamic spillover analysis. Student-t copulas applied to GARCH-filtered returns capture extreme dependence, while generalized impulse response functions and Diebold–Yilmaz connectedness measures identify order-invariant transmission dynamics. Using daily data for Bitcoin, Ethereum, equity indices, and gold from 2017–2024, the analysis evaluates internal cryptocurrency contagion, cross-market spillovers, and regime-dependent connectedness. The study further contributes by incorporating quantile-based and frequency-domain approaches to capture nonlinear and time-varying interactions across markets (Khan et al., 2025; Wang et al., 2024; Caporale et al., 2021).

1.1. Interconnectedness and Spillover in Cryptocurrency Markets

The interconnectedness of cryptocurrencies with other financial assets has emerged as a central theme in financial economics. Adelopo and Luo (2025) and Aliu and Nuhiu (2025) show that cryptocurrency markets exhibit increasing integration and co-movement, particularly during periods of financial stress. Aslanidis et al. (2020) further demonstrate that interdependence among cryptocurrencies has intensified over time, suggesting growing systemic relevance. Iyer and Popescu (2023) provide evidence of cross-asset spillovers, emphasizing how shocks originating in cryptocurrency markets can propagate to traditional financial systems.
Empirical research also highlights the linkages between cryptocurrencies and traditional assets such as gold and equities. Bauri et al. (2020) and Baur and Hoang (2024) document that cryptocurrencies may exhibit safe-haven characteristics under specific conditions, though such properties are not stable. W. P. Chen et al. (2025) and Corbet et al. (2020) show that contagion effects intensify during crisis periods, including the COVID-19 pandemic. Milunovich (2018) and Aslanidis et al. (2020) confirm that these relationships are dynamic and influenced by macroeconomic and liquidity conditions. Caporale et al. (2024) further identify long-run dependencies between stock markets and cryptocurrencies, indicating persistent interconnectedness.

1.2. Volatility Modeling and Tail Risk

Modeling volatility and tail behavior is essential for understanding cryptocurrency risk dynamics. Katsiampa (2017) provides foundational evidence of volatility clustering in Bitcoin returns, while Kim et al. (2020) apply copula methods to capture dependence structures between cryptocurrencies and traditional assets.
Subsequent studies emphasize the importance of extreme events and tail risk. Mensi et al. (2023), Atik et al. (2025) and Mensi et al. (2023) demonstrate that market stress significantly amplifies spillover effects and dependence structures. Mezghani et al. (2024) extend this analysis to broader financial systems, showing that volatility transmission varies across asset classes. Wu (2021) highlights asymmetric volatility responses between Bitcoin and traditional assets, reinforcing the need for nonlinear modeling approaches.

1.3. Dynamic and Nonlinear Connectedness

Recent literature emphasizes that financial connectedness is inherently dynamic, nonlinear, and state-dependent. Hanif et al. (2022) introduce higher-moment connectedness frameworks, revealing complex relationships across cryptocurrencies, equities, and commodities. Liu et al. (2024) provide a decomposition of global financial interconnectedness, while Vuković et al. (2025) develop a global spillover framework capturing cross-market transmission intensity. Rehman et al. (2024) further highlight the importance of tail dependence using eGARCH-EVT copula approaches.
Quantile-based and frequency-domain methods have significantly advanced the analysis of these dynamics. Khan et al. (2025), D. Lee et al. (2025) and Zeng et al. (2025) demonstrate that quantile approaches capture asymmetric spillovers across market conditions. Caporale et al. (2021) and Wang et al. (2024) show that frequency-domain methods reveal heterogeneous spillover patterns across different investment horizons. These approaches extend beyond traditional frameworks (Patton, 2006) by capturing both nonlinearities and time variation in dependence structures.

1.4. Cross-Asset Spillovers and Policy Implications

The transmission of shocks between cryptocurrencies and other asset classes has important implications for portfolio management and financial stability. Narayan and Kumar (2024), Song et al. (2025) and Zhang et al. (2025) provide evidence of spillovers across equities, commodities, and alternative financial instruments. Alamaren et al. (2025) and X. Chen et al. (2025) show that quantile connectedness frameworks can effectively capture these transmission mechanisms under different market conditions.
Caporale et al. (2021) and M. Lee et al. (2023) highlight the importance of time-varying connectedness for hedging and diversification strategies. Collectively, these studies emphasize that cryptocurrency markets are neither fully integrated nor completely segmented but exhibit regime-dependent interactions with traditional financial systems.

1.5. Research Gap and Contribution

While existing studies provide valuable insights into cryptocurrency volatility, dependence, and spillovers, no single framework fully integrates tail dependence, nonlinear dynamics, quantile effects, and cross-market connectedness in a unified setting. Much of the literature remains limited by static models, single-market focus, or insufficient treatment of extreme events.
This study contributes to the literature by developing a comprehensive framework that combines copula-based tail dependence modeling with dynamic spillover analysis, capturing both extreme risk transmission and time-varying interconnectedness across cryptocurrency and traditional financial markets. By incorporating regime-dependent dynamics and multiple methodological perspectives, the study addresses key limitations in prior research and provides a more complete understanding of market integration and systemic risk.

2. Materials and Methods

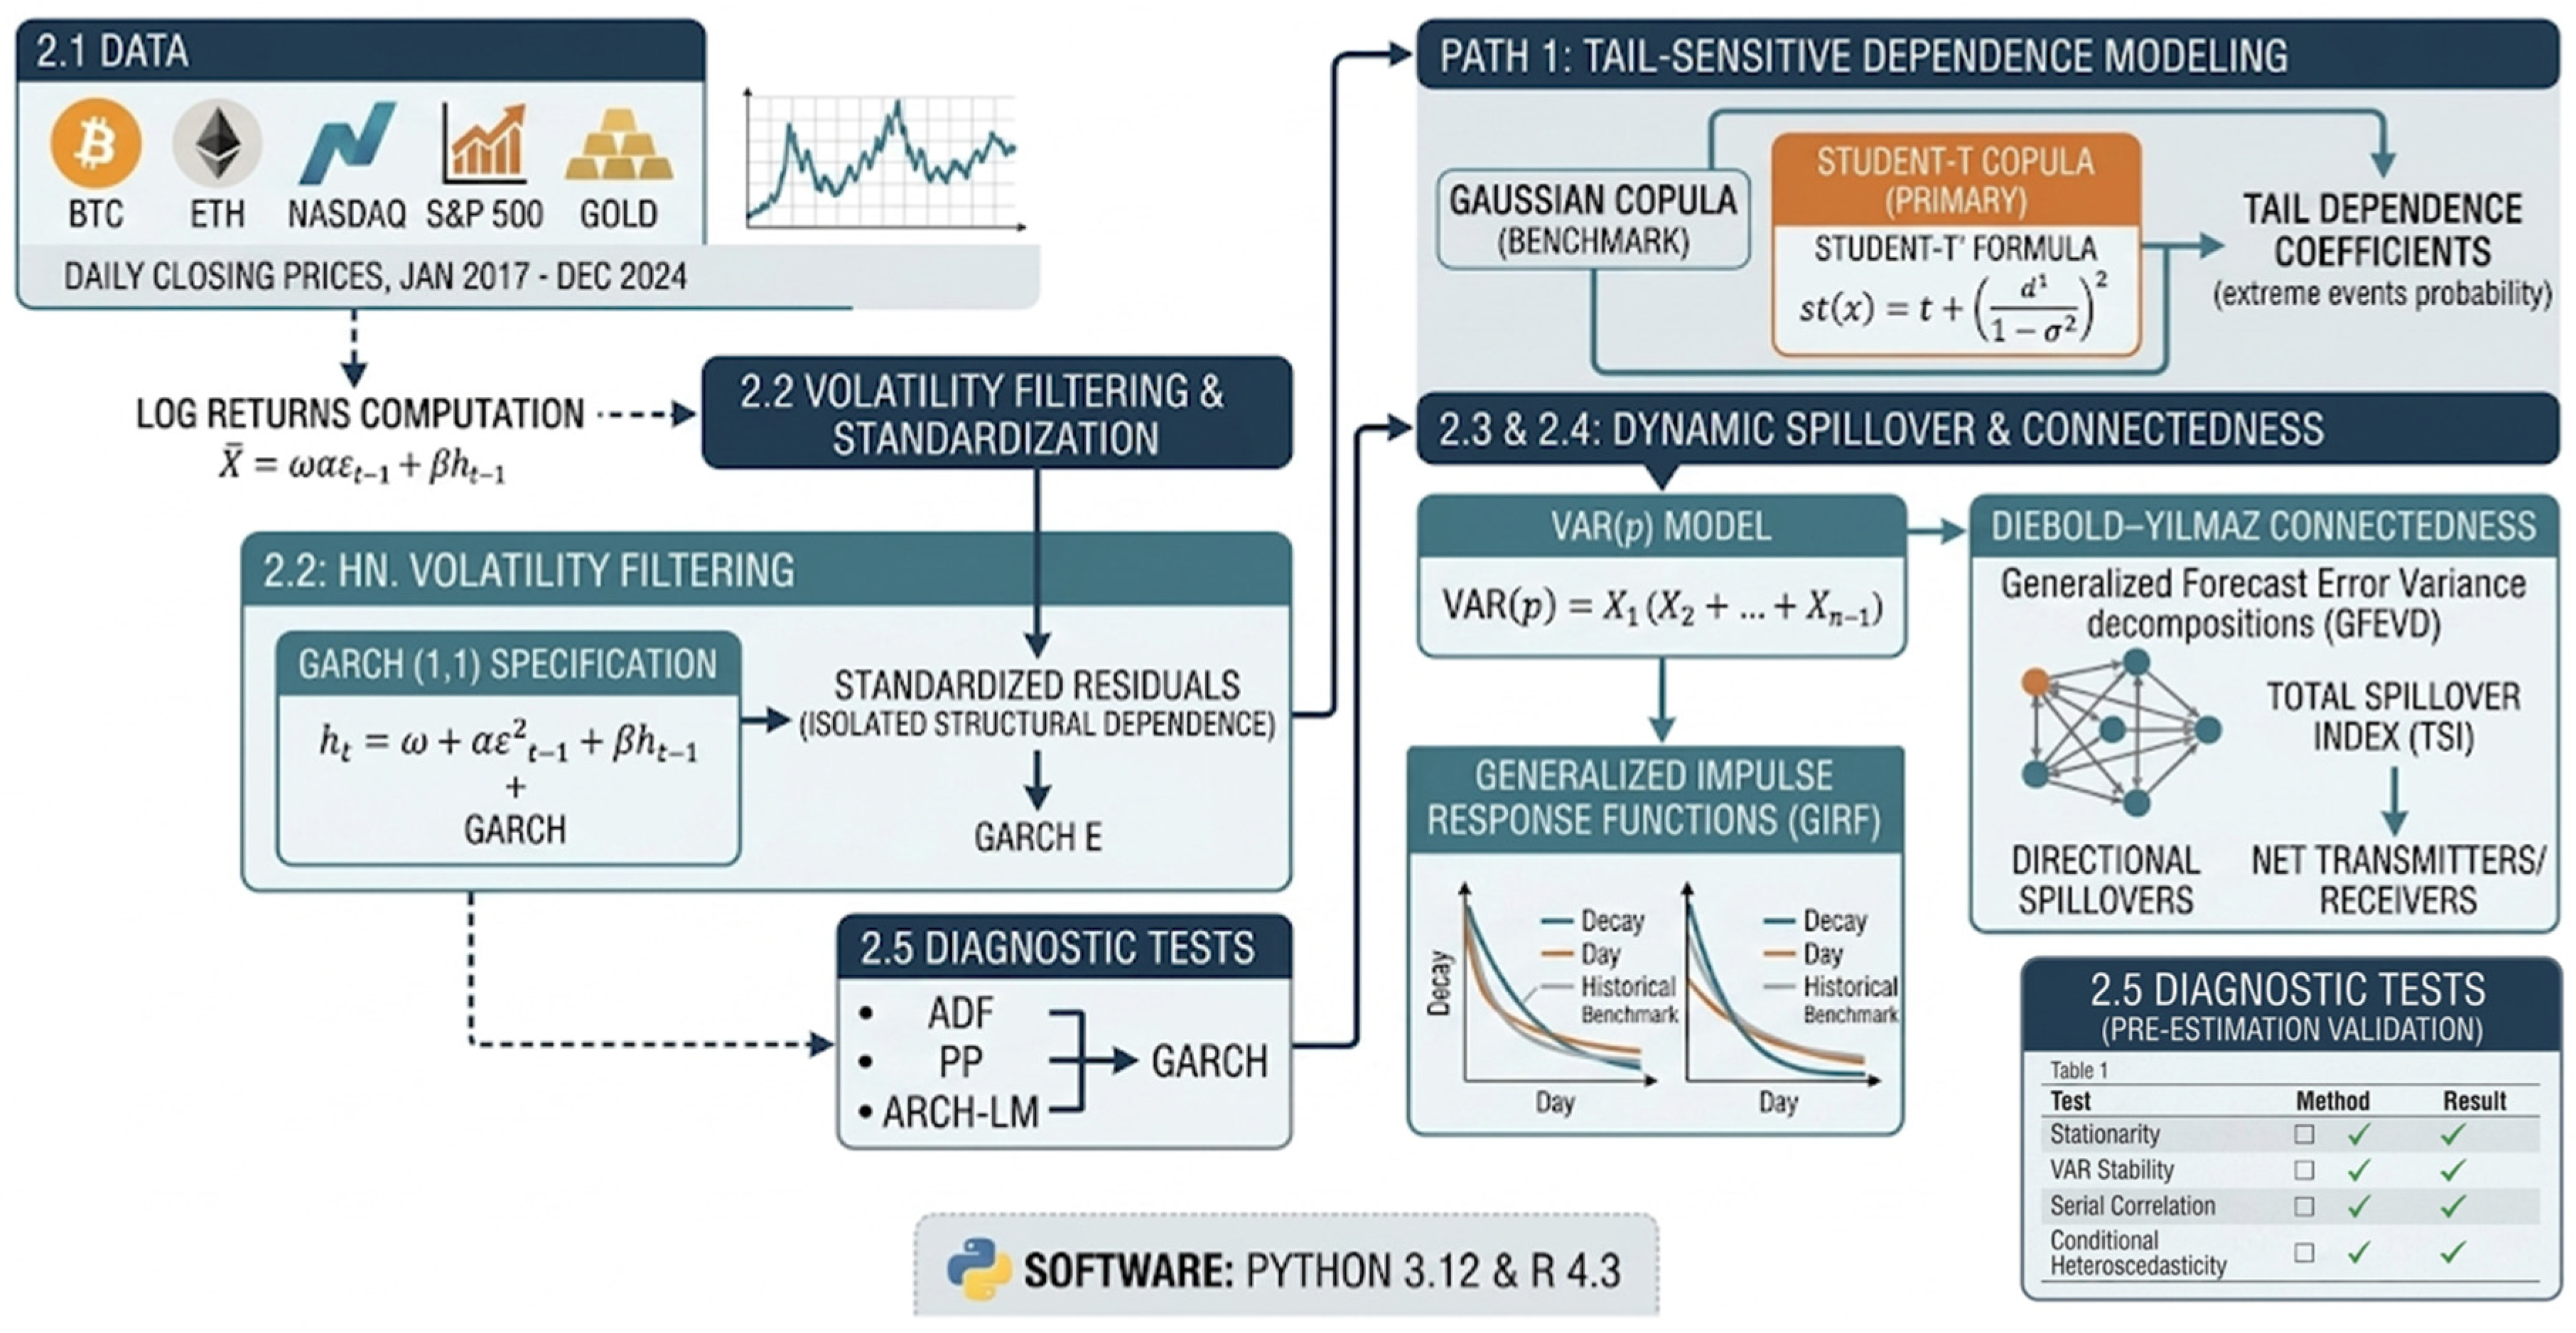
This study employs an integrated empirical framework to investigate dynamic dependence structures and spillover mechanisms among cryptocurrencies, equity markets, and gold. The methodological design combines tail-sensitive dependence modeling with order-invariant transmission analysis to distinguish volatility-driven co-movement from structural spillovers. The overall analytical workflow is illustrated in Figure 1.

2.1. Data and Preprocessing

This study utilizes daily closing price data for five major financial assets: Bitcoin (BTC), Ethereum (ETH), the NASDAQ Composite Index, the S&P 500 Index, and gold, covering the period from January 2017 to December 2024. These assets are selected to represent distinct segments of the global financial system, enabling a comprehensive analysis of cross-market dependence and spillover dynamics. Specifically, cryptocurrencies (Bitcoin and Ethereum) capture the behavior of decentralized and highly speculative digital assets, equity indices (NASDAQ and S&P 500) reflect broader macroeconomic and technological market conditions, and gold serves as a traditional safe-haven asset widely used for risk hedging and portfolio diversification.
The selected sample period is particularly relevant as it encompasses multiple structural market regimes and episodes of financial stress. These include the rapid expansion of cryptocurrency markets during 2017–2018, the market-wide disruption caused by the COVID-19 pandemic in 2020, the subsequent recovery and speculative surges in digital assets, and the global monetary tightening cycle beginning in 2022. Incorporating these distinct regimes allows for a more robust assessment of time-varying dependence structures and spillover effects under both normal and extreme market conditions.
To ensure consistency and comparability across assets with different price scales, returns are computed as logarithmic differences in daily prices:
r t = ln ( P t ) ln ( P t 1 )
This transformation stabilizes variance, mitigates heterogeneity in price levels, and facilitates econometric modeling by promoting stationarity in the return series.
A critical challenge in multi-asset analysis is the synchronization of trading days across markets with different operating schedules. Cryptocurrency markets trade continuously, whereas equity and gold markets are subject to weekends and holidays. To address this issue, the dataset is aligned by matching observations to common trading days. Non-overlapping dates are handled through systematic alignment procedures, ensuring that all return series correspond to the same time index. Additional robustness checks are performed using alternative synchronization approaches (e.g., forward-filling and exclusion of non-overlapping observations), confirming that the empirical results are not sensitive to the chosen alignment method.
Descriptive statistics and preliminary diagnostics are conducted to assess the distributional properties of the return series. Consistent with prior literature, cryptocurrency returns exhibit higher volatility, excess kurtosis, and stronger deviations from normality compared to traditional assets, reinforcing the need for tail-sensitive modeling approaches. Equity and gold returns display relatively lower volatility but still exhibit time-varying variance and non-normal features, justifying the application of volatility filtering and copula-based dependence modeling in subsequent sections.
Overall, this data construction framework ensures a consistent, robust, and economically meaningful basis for analyzing dependence structures and spillover transmission across heterogeneous financial markets.

2.2. Dependence Modeling Using Copulas

To model the dependence structure among asset returns, both Gaussian and Student-t copulas are estimated. The Gaussian copula provides a baseline specification for capturing linear dependence but does not account for tail dependence. Given the importance of extreme co-movements in financial contagion analysis, the Student-t copula is adopted as the primary model because it captures symmetric tail dependence and accommodates heavy-tailed distributions observed in financial returns. The multivariate Student-t copula is defined as
C ( u 1 , u 2 , , u n ; ν , Σ ) = t v , Σ ( t 1 ( u 1 ) , t 1 ( u 2 ) , , t 1 ( u n ) ) ,
where t−1(.) denotes the inverse Student-t marginal distribution, ν controls tail thickness, and Σ represents the dependence matrix.
Model parameters are estimated using maximum likelihood estimation (MLE), and model selection is based on Akaike Information Criterion (AIC) and Bayesian Information Criterion (BIC). Tail dependence coefficients derived from the Student-t copula are used to quantify the probability of joint extreme events across markets. For robustness, Gaussian copula specifications are also estimated, although interpretation focuses on the Student-t results due to the heavy-tailed nature of financial returns.

2.3. Volatility Filtering and Standardization

Financial return series typically exhibit conditional heteroskedasticity and volatility clustering. To ensure that dependence estimates reflect structural relationships rather than shared volatility effects, returns are filtered using a GARCH(1,1) model:
σ t 2 = ω + α r t 1 2 + β σ t 1 2
where σ t 2 denotes conditional variance, α captures short-run volatility persistence, and β measures long-run clustering. Standardized residuals from the GARCH model are used in subsequent copula estimation. This filtering process removes time-varying volatility effects and isolates the underlying dependence structure. Diagnostic tests, including ARCH–LM and residual autocorrelation tests, confirm that the GARCH specification adequately captures heteroskedasticity in the data.

2.4. Dynamic Shock Transmission Analysis

To evaluate dynamic spillover effects, generalized impulse response functions (GIRFs) are employed. Unlike traditional impulse response methods, GIRFs are invariant to variable ordering and do not require restrictive identification assumptions, making them suitable for systems where causal ordering is ambiguous.
GIRFs trace the response of asset returns to a one-standard-deviation shock originating in a specific market, while accounting for contemporaneous correlations across variables. Responses are estimated over a multi-day horizon to capture both short-term and persistent effects. Statistical inference is conducted using bootstrap confidence intervals with 1000 replications, providing robust, distribution-free estimates of significance.

2.5. System-Wide Connectedness Measurement

Cross-market spillovers are quantified using the Diebold–Yilmaz connectedness framework, which decomposes forecast error variance into own-market and cross-market components within a vector autoregressive (VAR) model. The VAR(p) model is specified as
Y t = i = 1 p A i Y t i + ϵ t
Generalized forecast error variance decomposition (GFEVD) is employed to ensure order invariance and consistency with the GIRF methodology. Variance decompositions are computed over a 10-day forecast horizon. The total spillover index (TSI) is defined as
T S I = i j θ i j i j θ i j × 100
where θij represents the contribution of shocks from market j to the forecast error variance of market i. Higher TSI values indicate stronger system-wide interconnectedness. Directional spillover measures are also computed to identify net transmitters and receivers of shocks.

2.6. Diagnostic Tests

Prior to model estimation, a series of diagnostic tests is conducted to validate the econometric framework as shown in Table 1. Stationarity of return series is confirmed using Augmented Dickey–Fuller (ADF) and Phillips–Perron tests at the 1% significance level. VAR stability is verified through characteristic root analysis, ensuring that all roots lie within the unit circle. Serial correlation is assessed using Lagrange Multiplier (LM) tests, which indicate no residual autocorrelation. ARCH–LM tests confirm the presence of conditional heteroskedasticity in cryptocurrency and equity returns, supporting the use of GARCH filtering and tail-sensitive modeling techniques.

3. Empirical Results

The empirical analysis evaluates the nature of cross-asset relationships through three distinct lenses: static tail dependence, dynamic response mechanisms, and system-wide connectedness. By filtering returns through a GARCH framework prior to analysis, the results isolate structural transmission from simple volatility clustering. This approach provides a granular view of how risk propagates within the cryptocurrency ecosystem versus its transmission to traditional financial markets.

3.1. Descriptive Statistics

The statistical properties of the daily log returns are presented in Table 2. Cryptocurrencies demonstrate substantially higher volatility than traditional assets, with Bitcoin and Ethereum recording standard deviations significantly larger than those of equity indices and gold. All series exhibit negative skewness and pronounced excess kurtosis, confirming the presence of heavy-tailed distributions. The Jarque–Bera statistics strongly reject the null hypothesis of normality for all assets (p < 0.01), validating the use of flexible, tail-sensitive dependence models such as copulas.

3.2. Rolling Correlations

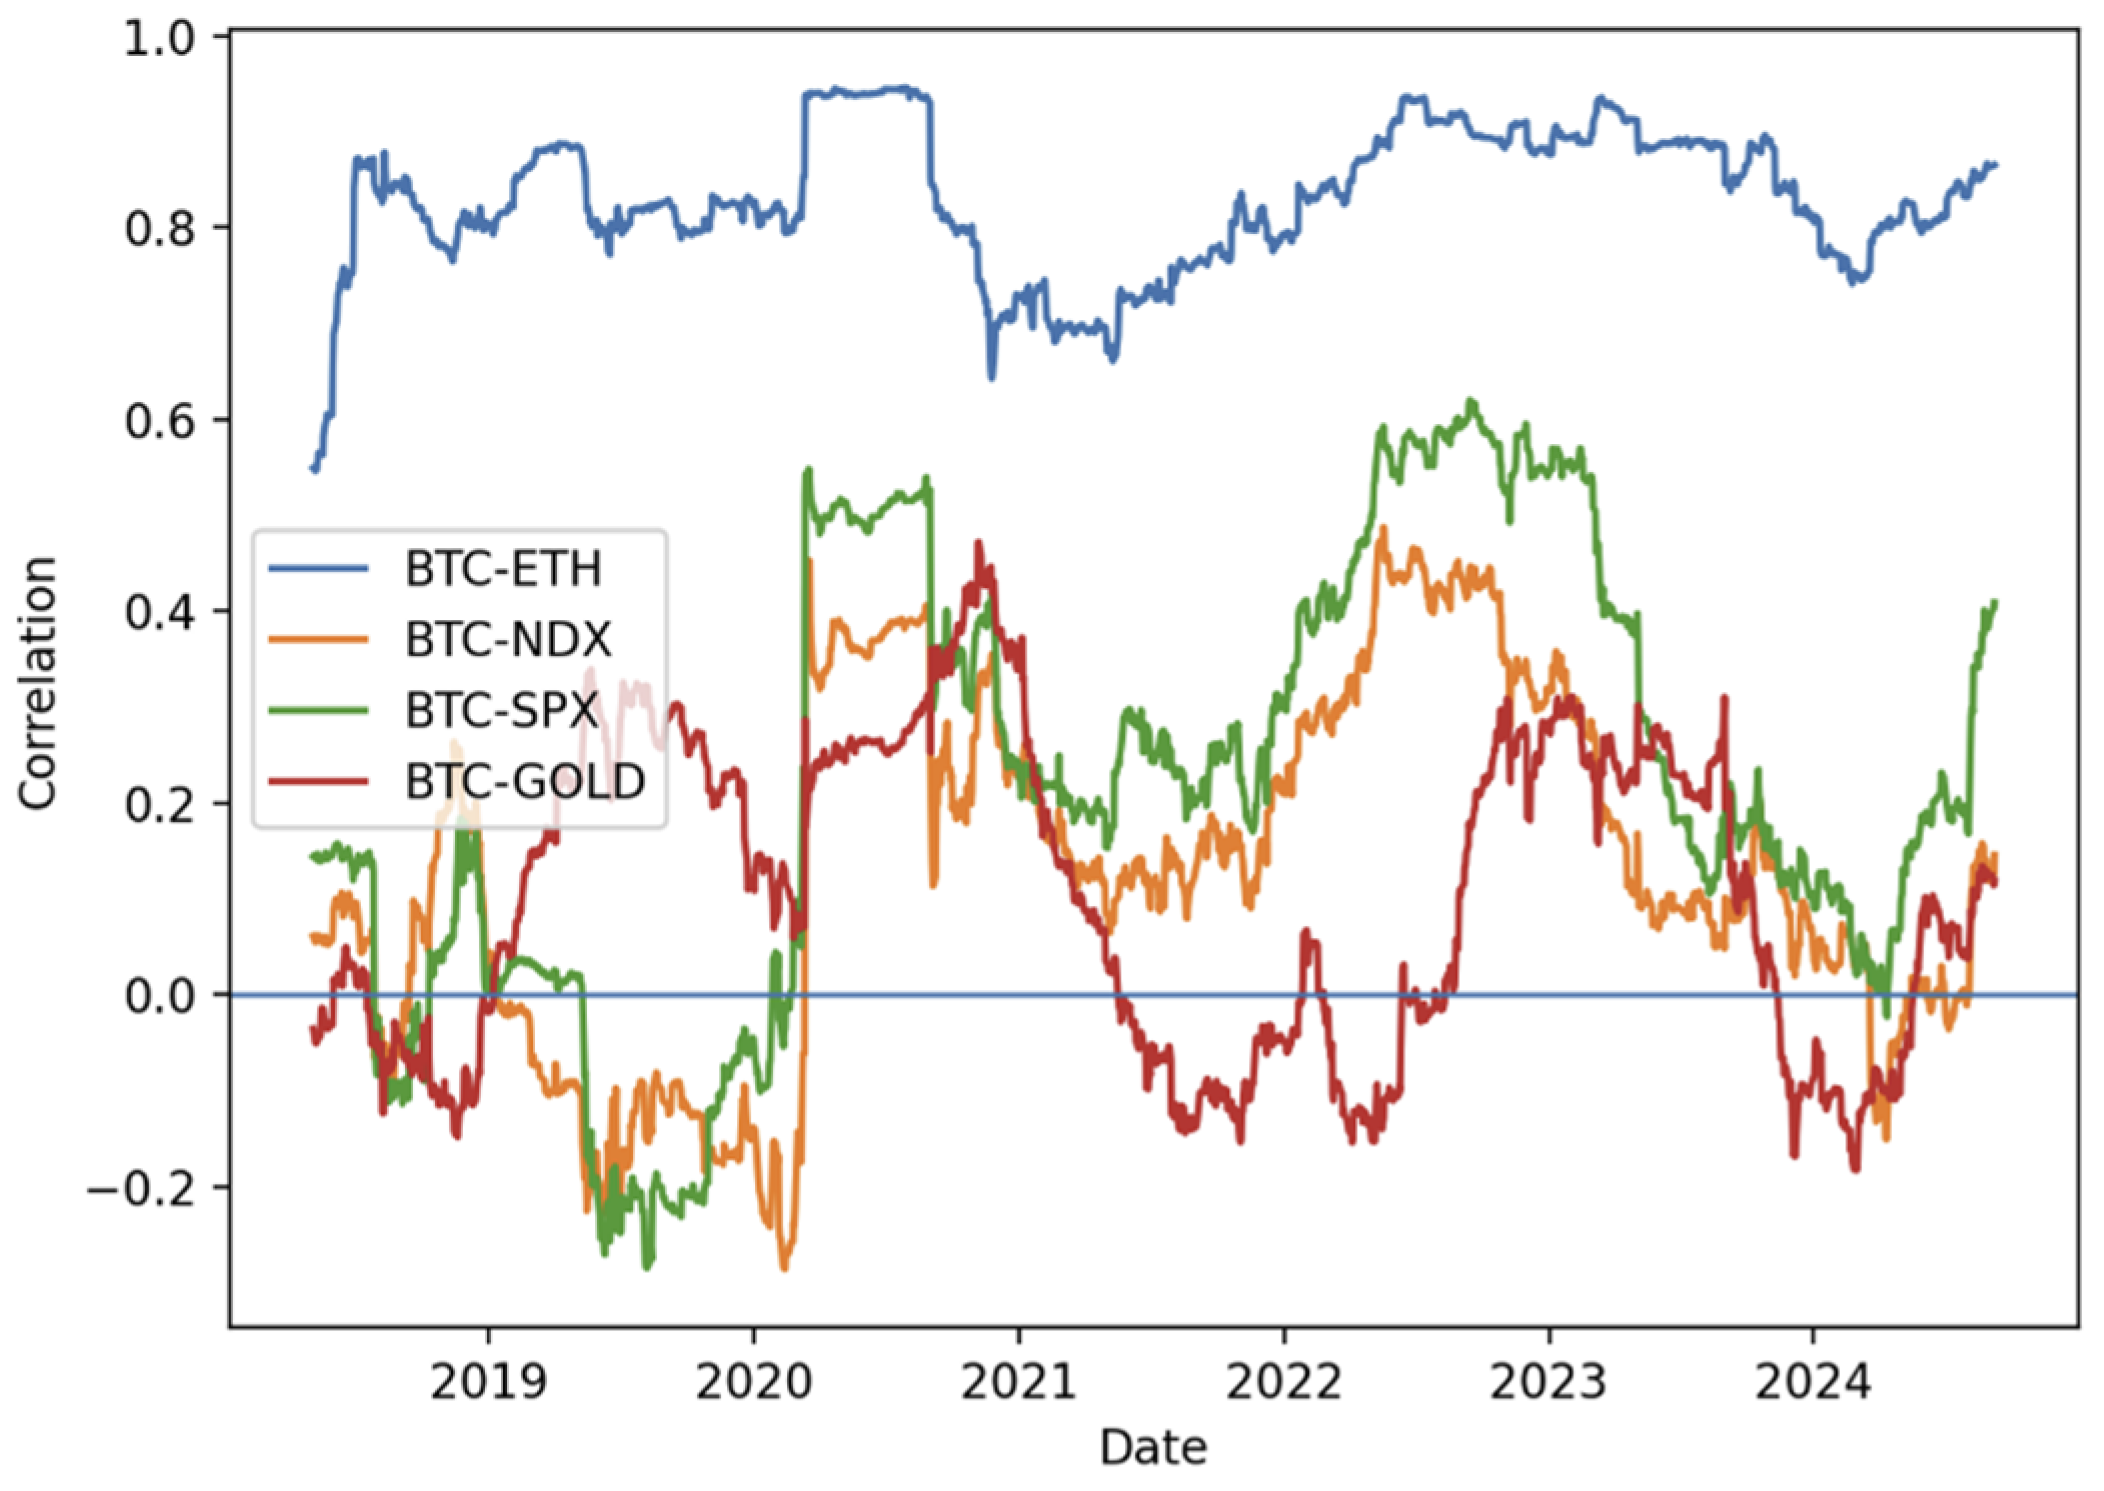
Figure 2 presents 120-day rolling correlations of log returns, capturing the time-varying linear relationships among assets. The results reveal pronounced regime dependence in cross-market integration. Correlations between Bitcoin and Ethereum consistently remain the highest among all asset pairs, frequently exceeding 0.8 across the sample period. This indicates strong and persistent internal dependence within the cryptocurrency market.
In contrast, correlations between cryptocurrencies and equity indices exhibit substantial time variation. Equity correlations spiked during periods of systemic stress, most notably in 2020 and 2022, when macroeconomic uncertainty and liquidity shocks synchronized risk sentiment across markets. However, these correlations decline toward lower levels in stable regimes, often approaching 0.2 or less. Such dynamics support the interpretation of episodic rather than structural integration between cryptocurrencies and traditional financial assets.
The Bitcoin–gold correlation remains comparatively weak and occasionally negative throughout the sample. This pattern suggests that gold retains its segmentation from cryptocurrency dynamics and continues to exhibit diversification properties. Although short-term fluctuations occur during crisis episodes, there is no evidence of persistent or systematic co-movement.
The rolling correlation evidence demonstrates that market relationships are regime dependent. Internal cryptocurrency linkages are strong and stable, while cross-market correlations with equities vary with macroeconomic conditions and diminish in tranquil periods. These findings align with the broader hypothesis of partial market segmentation and volatility-driven integration.

3.3. Dependence Modeling (GARCH and Copulas)

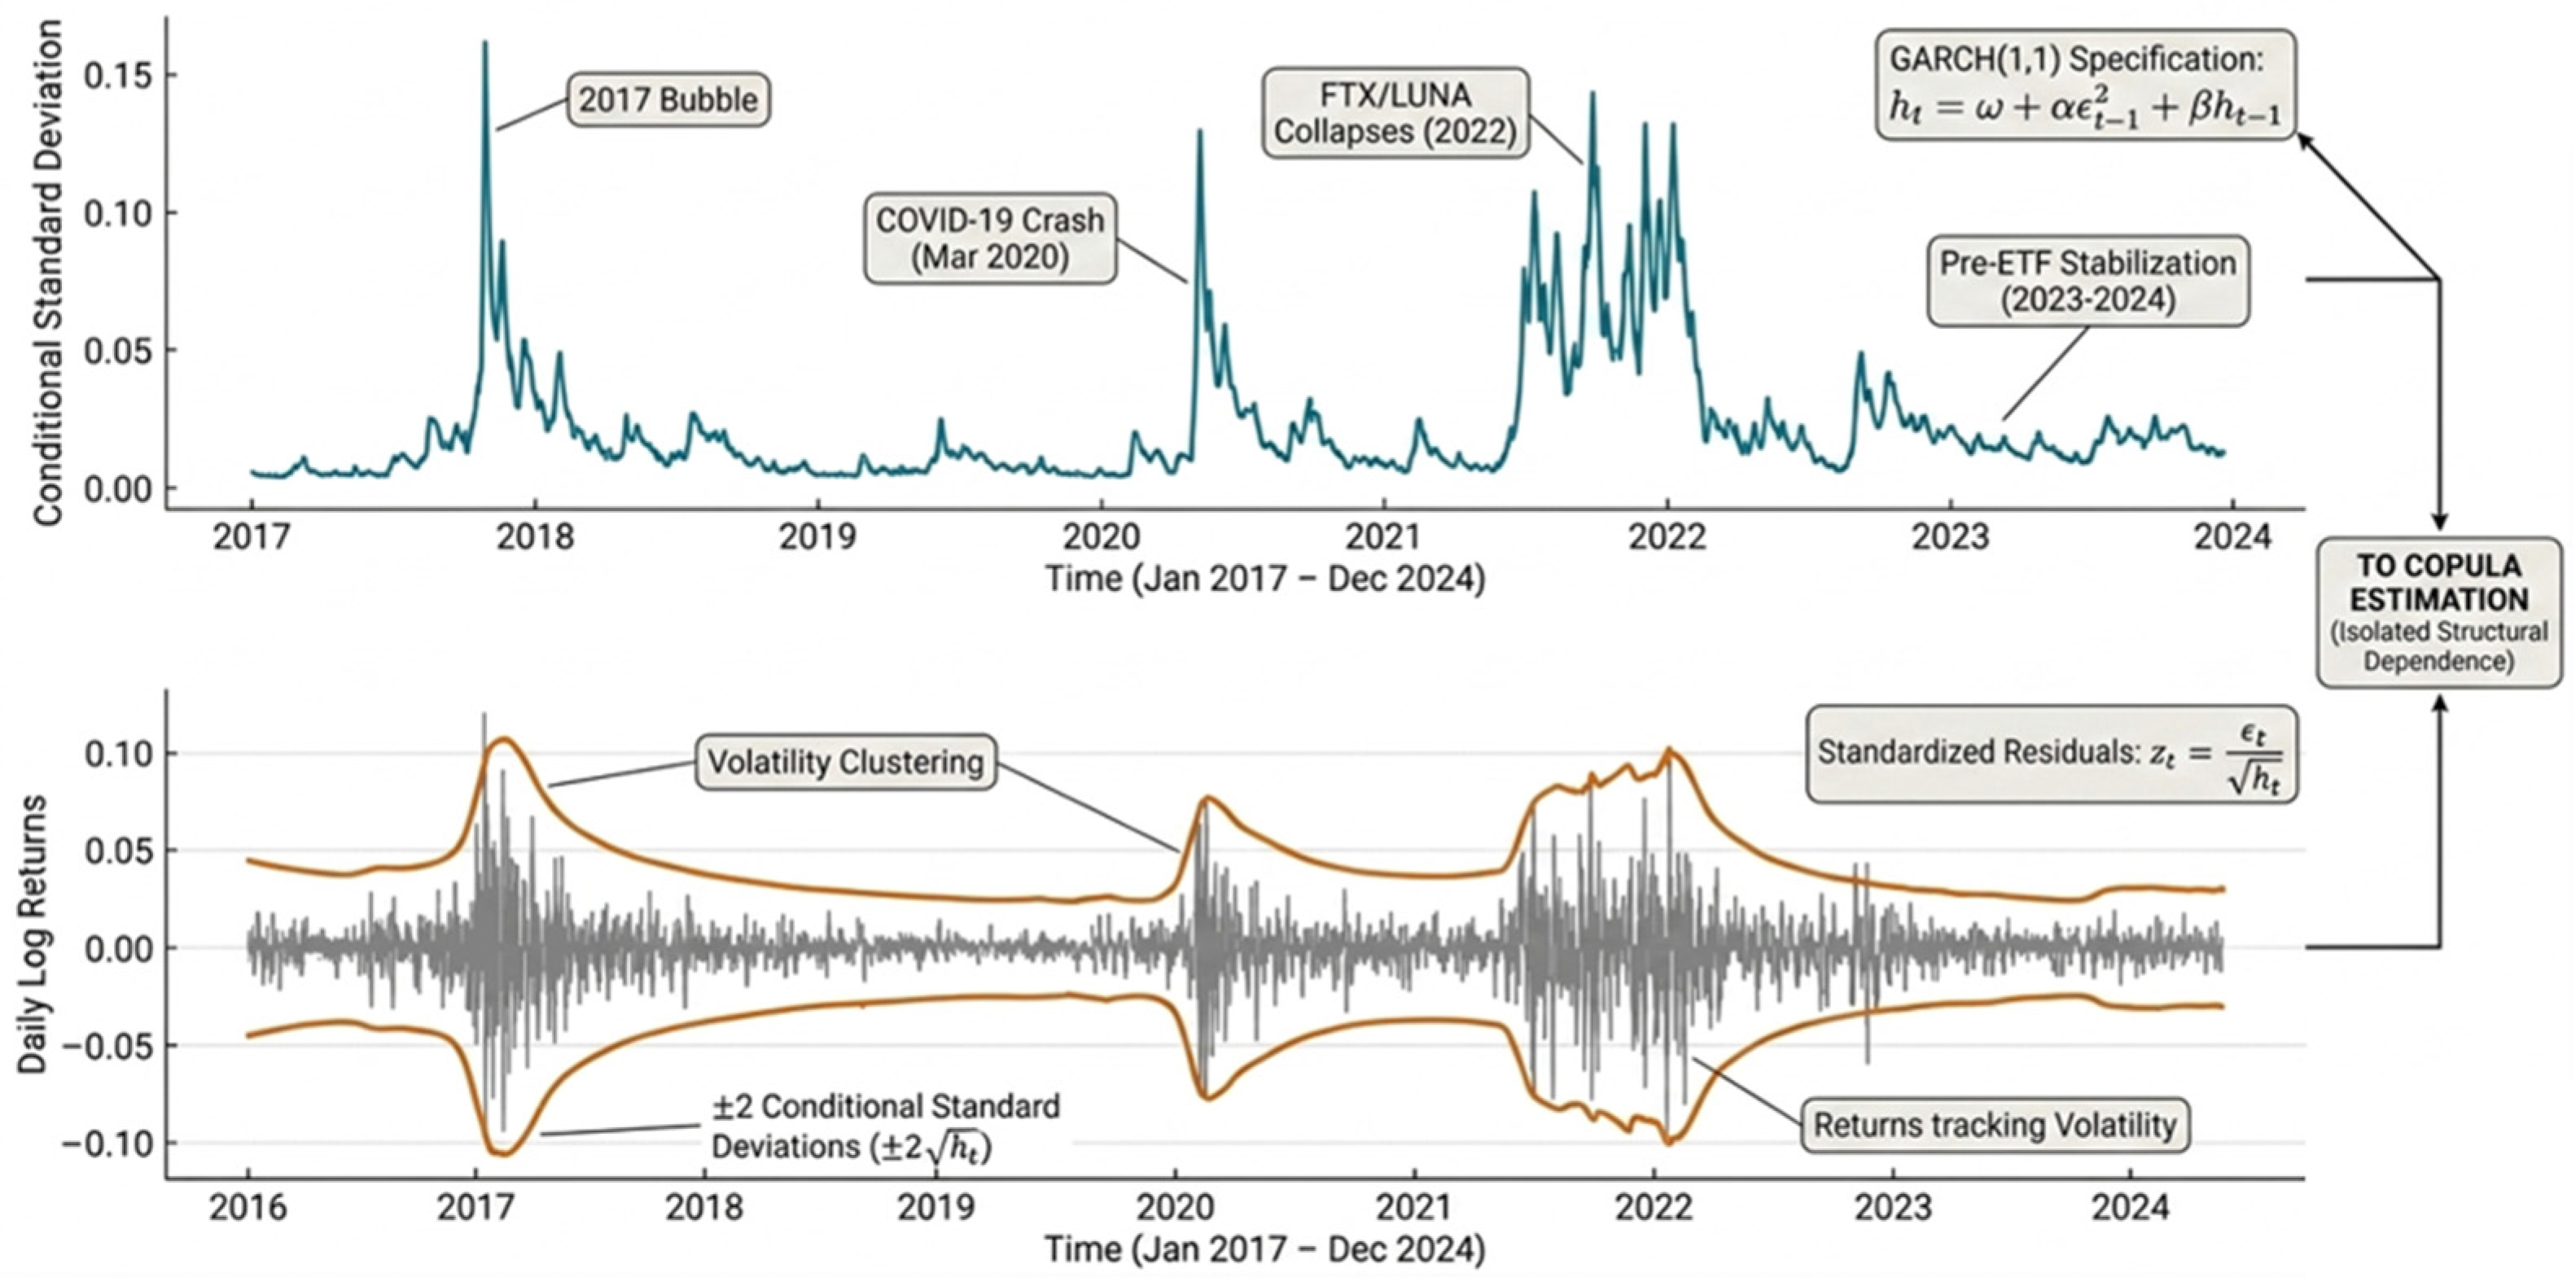
Before proceeding to the copula-based analysis, the effectiveness of the GARCH(1,1) filtering process should be validated. Figure 3 visually confirms the existence of significant volatility clustering in the Bitcoin return series across the entire 2017–2024 sample. The orange confidence bands ( ± 2 h t ) automatically widen during known turbulent regimes such as the 2020 COVID-19 crash and the 2022 FTX/LUNA collapses and narrow during stable periods, thereby capturing the conditional heteroskedasticity documented in Katsiampa (2017). This filtering is crucial; it establishes that the following copula estimations are based on standardized residuals that isolate structural dependence rather than simple shared volatility dynamics.
To isolate structural dependence, standardized residuals from GARCH(1,1) filtering are used in copula estimation. This removes time-varying volatility clustering and focuses on the underlying dependence structure. Both Gaussian and Student-t copulas are estimated via maximum likelihood, with model selection based on Akaike Information Criterion (AIC). Model comparison indicates that the Student-t copula provides a superior fit across all asset pairs, as evidenced by lower AIC values. This result suggests that symmetric tail dependence persists even after volatility filtering. The magnitude of tail dependence varies across asset classes, with strong dependence within the cryptocurrency ecosystem and negligible tail dependence between cryptocurrencies and traditional assets.
Tail dependence coefficients from the Student-t specification capture extreme co-movements, which are central to contagion analysis. Results indicate strong tail dependence within the cryptocurrency ecosystem (particularly BTC–ETH) but negligible tail dependence between cryptocurrencies and traditional assets. This confirms that extreme joint downturns are concentrated within the crypto market rather than transmitted systematically to equities or gold.

3.3.1. Internal Cryptocurrency Dependence

Within the cryptocurrency ecosystem, structural dependence is both strong and persistent. Table 3 shows that the Student-t copula correlation between Bitcoin (BTC) and Ethereum (ETH) is 0.8377, substantially higher than the Gaussian correlation of 0.8127, indicating that extreme co-movements are more pronounced than average correlations suggest. The corresponding tail dependence coefficient (λ ≈ 0.5920) highlights the probability of joint extreme returns, confirming that BTC and ETH frequently experience synchronous spikes or crashes.
These findings demonstrate that even after filtering for conditional volatility via GARCH(1,1), internal cryptocurrency linkages remain robust. The high degree of tail dependence underscores the potential for contagion within the cryptocurrency market during periods of extreme stress, which has important implications for risk management and portfolio diversification strategies among digital assets.

3.3.2. Cryptocurrency–Equity Dependence

Dependence between cryptocurrencies and equity indices is moderate and asymmetric. As shown in Table 3, the BTC–NASDAQ and BTC–S&P 500 Student-t correlations are 0.1537 and 0.2310, respectively, with negligible tail dependence (λ = 0.0040 for BTC–NASDAQ and λ = 0.0066 for BTC–S&P 500). These results indicate that while short-term co-movements may exist, extreme joint movements between cryptocurrencies and equities are rare once conditional volatility is accounted for.
This pattern suggests that observed correlations in raw returns largely reflect transient market conditions, such as liquidity shocks or macroeconomic announcements, rather than structural contagion. Therefore, cryptocurrencies and equities generally retain some degree of diversification potential, though brief episodes of synchronized movements may occur during market stress periods, consistent with the rolling correlation patterns documented in Section 3.2.

3.3.3. Cryptocurrency–Gold Dependence

Dependence between cryptocurrencies and gold is weak and largely independent of extreme market events. As reported in Table 3, the Student-t correlation for BTC–Gold is 0.1019, with an associated tail dependence coefficient of 0.0003, indicating that joint extreme returns between Bitcoin and gold are virtually nonexistent. This low correlation persists even after GARCH-based volatility filtering, confirming that gold remains insulated from cryptocurrency shocks.
These results suggest that gold maintains its traditional role as a diversification asset. While short-term co-movements may occasionally arise during market turbulence, extreme synchronous movements between digital assets and gold are negligible. This structural independence aligns with the dynamic spillover and impulse response analyses presented in Section 3.4 and Section 3.5, which show minimal transmission from cryptocurrency shocks to gold returns. Consequently, gold continues to offer protective properties in mixed portfolios that include cryptocurrencies, reinforcing its status as a stable, segmented asset class.

3.3.4. Synthesis with Dynamic Results

The combined evidence from volatility-filtered copula estimates and dynamic transmission models provides a cohesive view of market integration. Internal cryptocurrency dependence remains strong: the BTC–ETH correlation consistently exceeds 0.8 and tail dependence is substantial, indicating structural interdependence rather than shared volatility shocks. This conclusion aligns with generalized impulse response results showing significant short-horizon transmission from Bitcoin to Ethereum.
Cryptocurrency–equity relationships are moderate and episodic. Correlations with equity indices spike during crisis periods but decline in stable regimes, and tail dependence is negligible. These patterns suggest that observed co-movement reflects common macroeconomic conditions rather than persistent contagion. Diebold–Yilmaz results further support this interpretation, indicating moderate system connectedness without dominant cross-market transmission.
Dependence between cryptocurrencies and gold remains weak. Correlations hover near zero and tail dependence is minimal, confirming that gold is largely segmented from cryptocurrency dynamics. Dynamic impulse responses show only transient effects on gold following crypto shocks, reinforcing its diversification properties.

3.4. Impulse Response Analysis

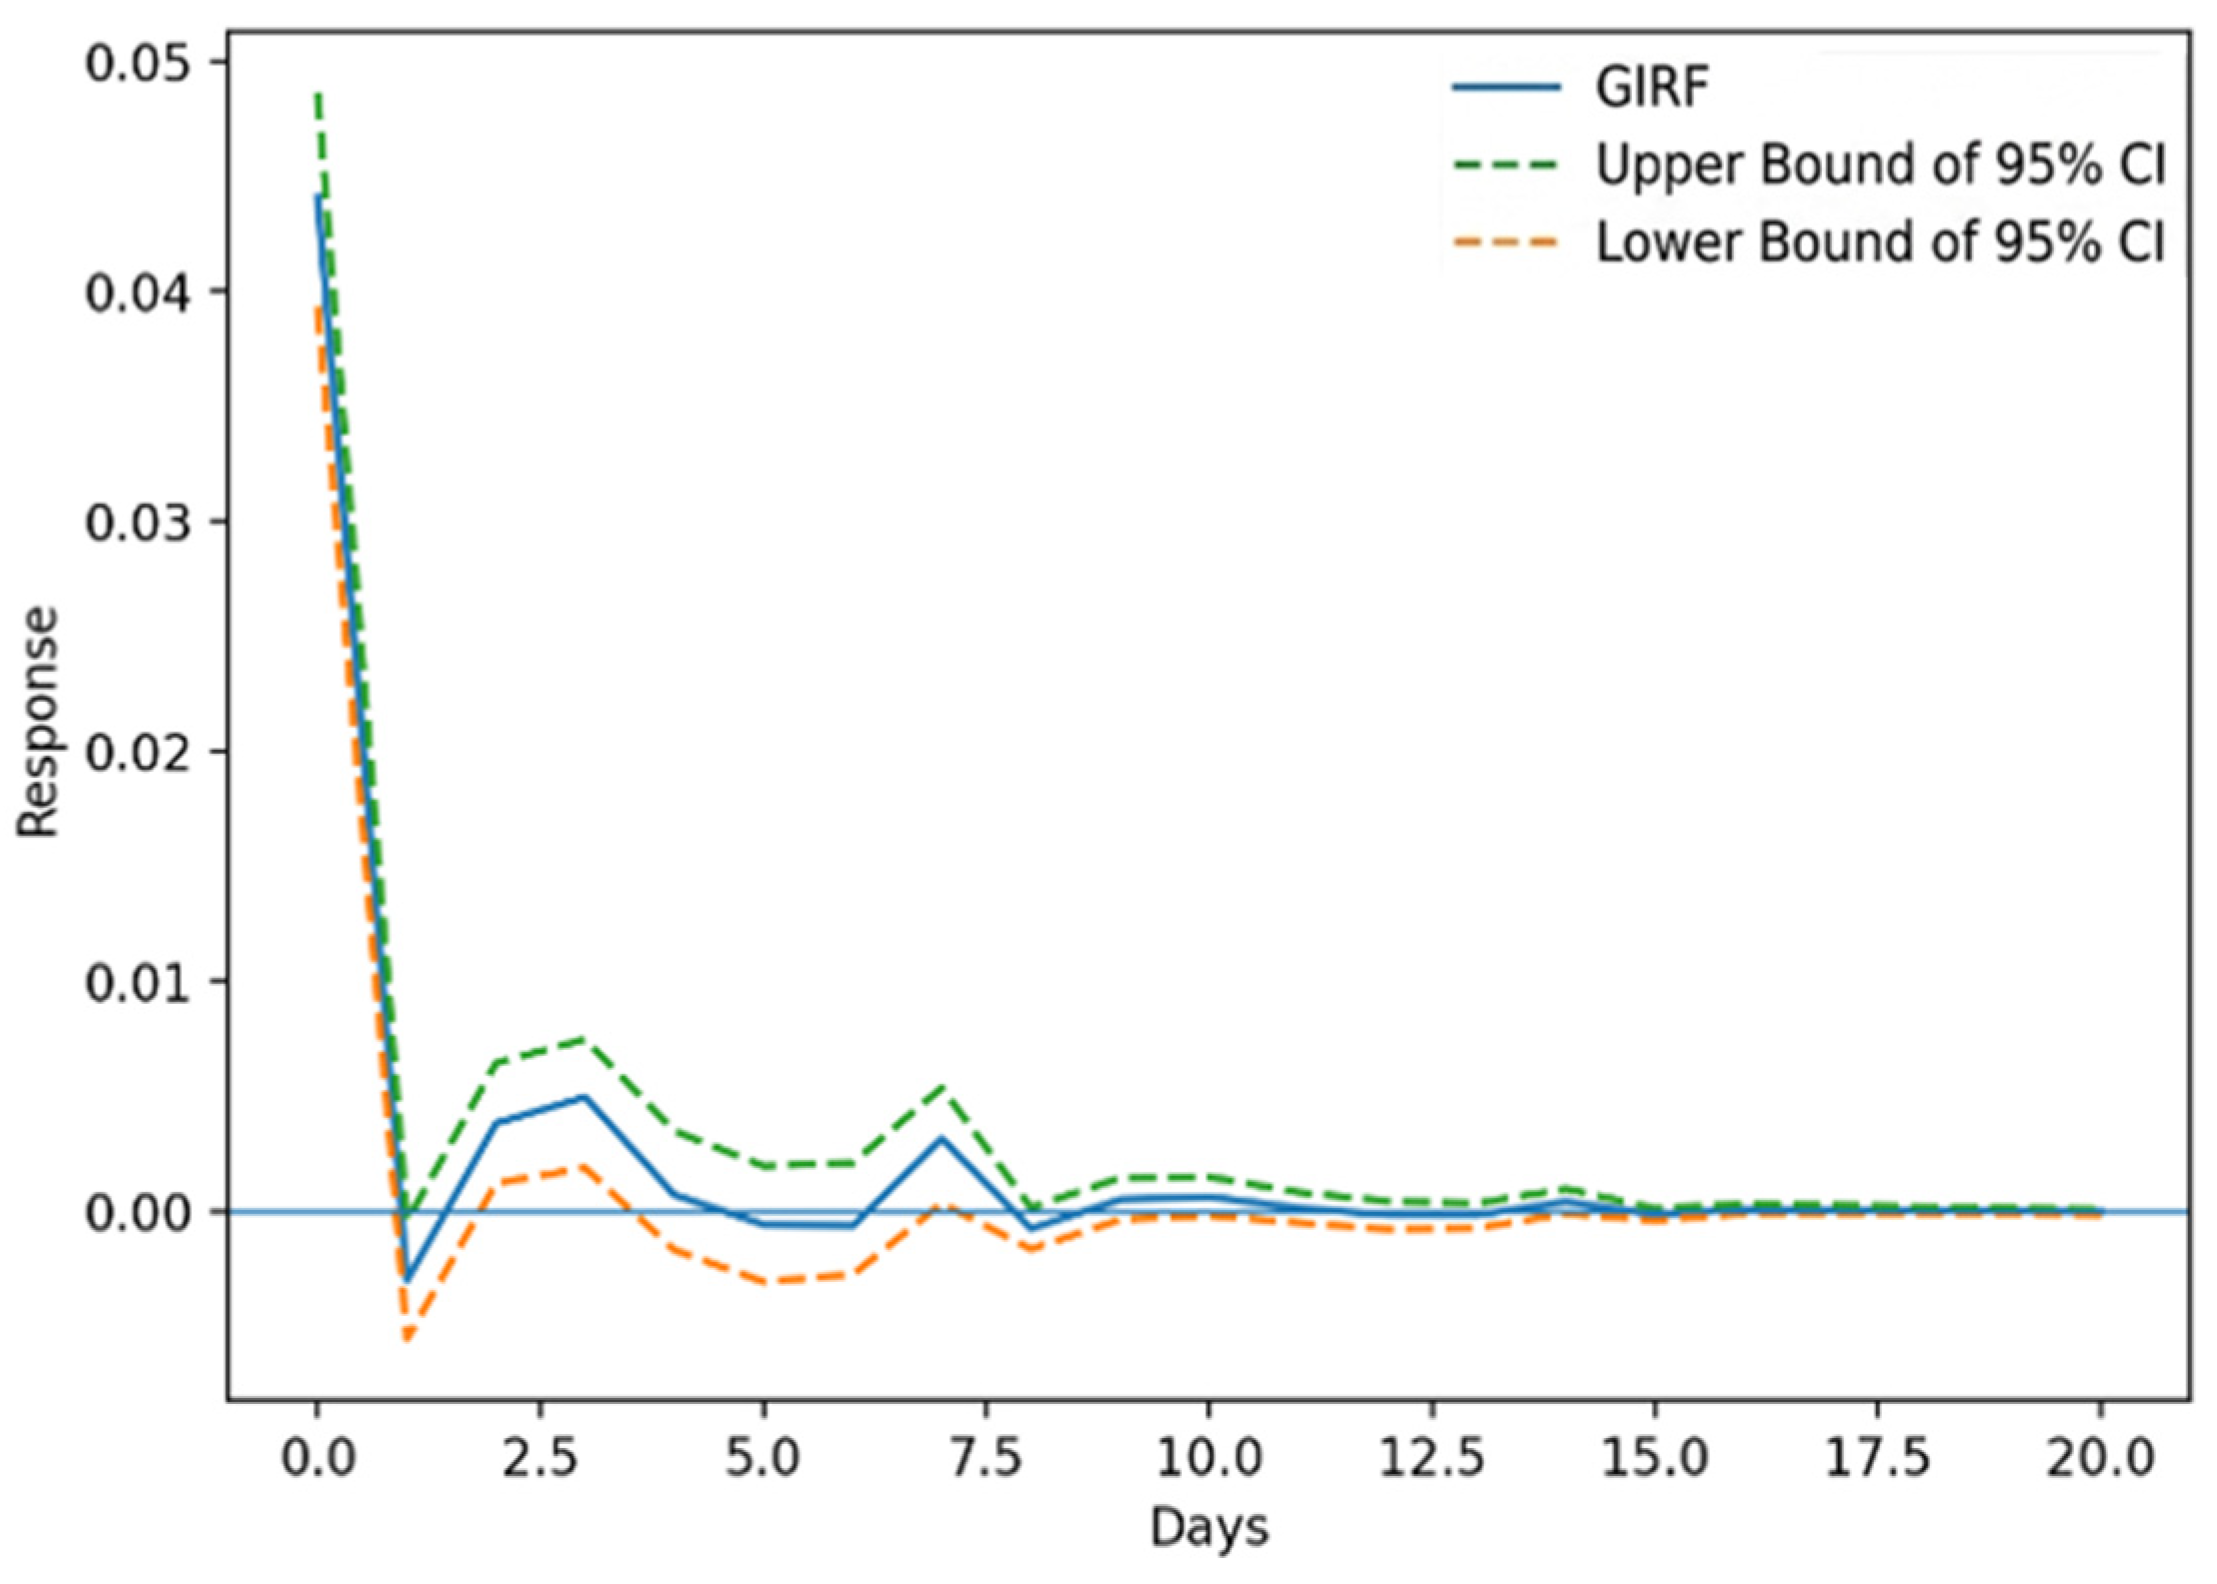
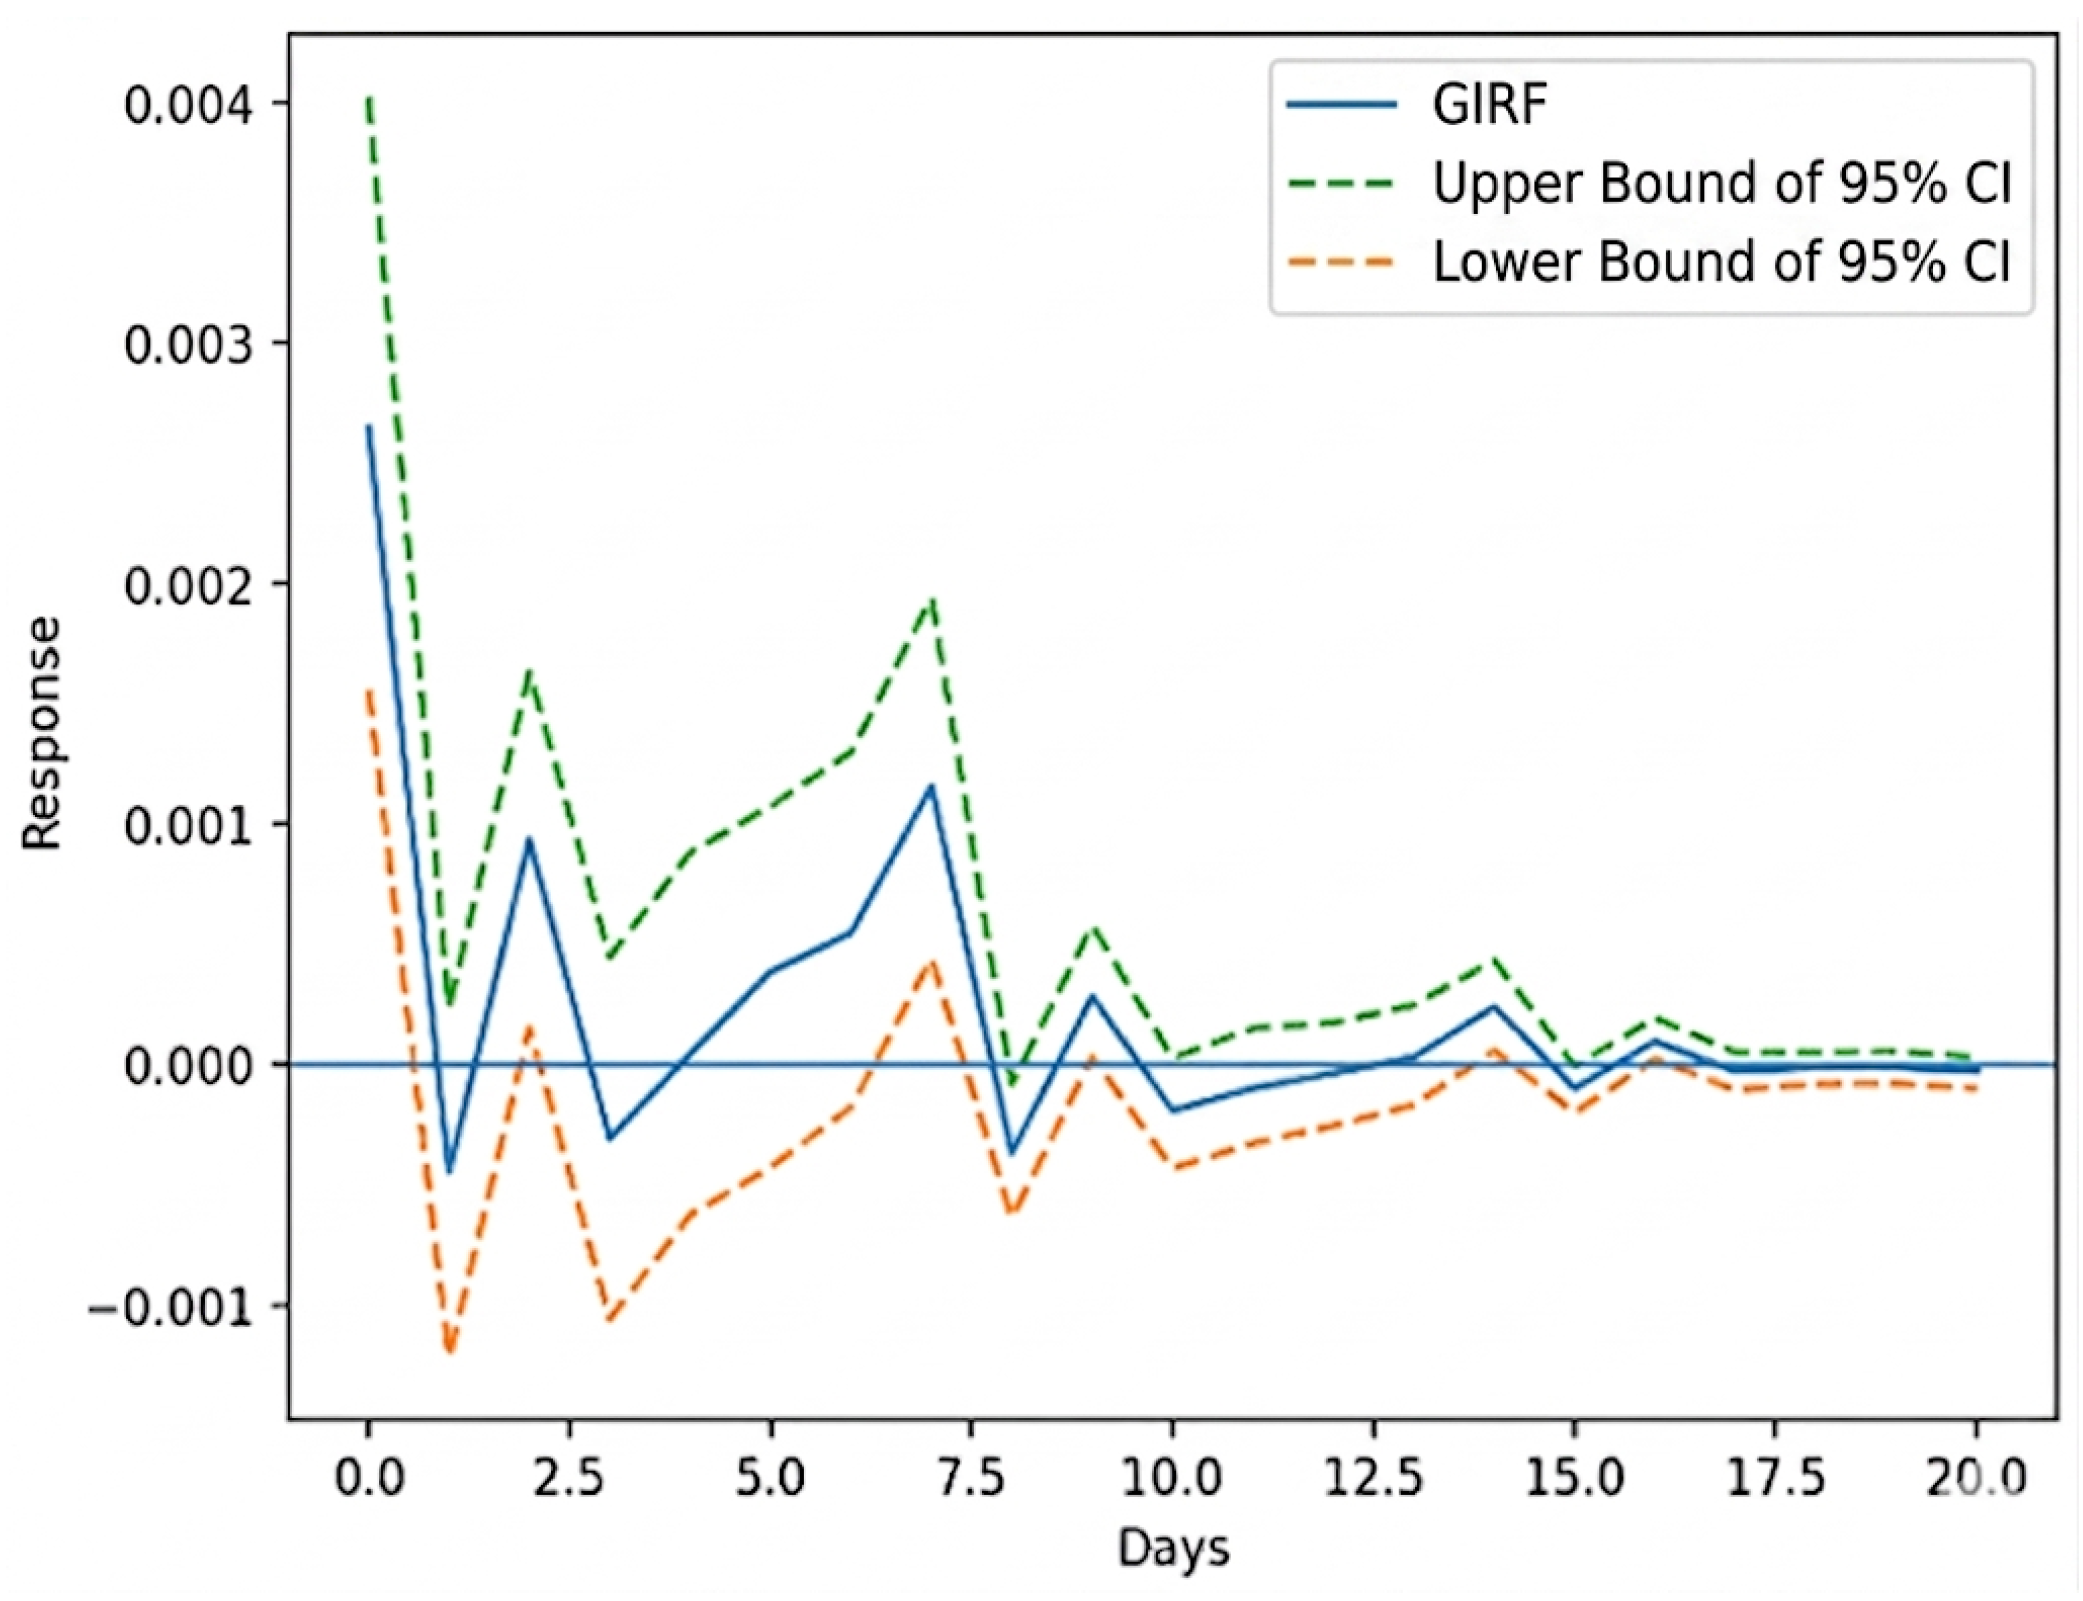
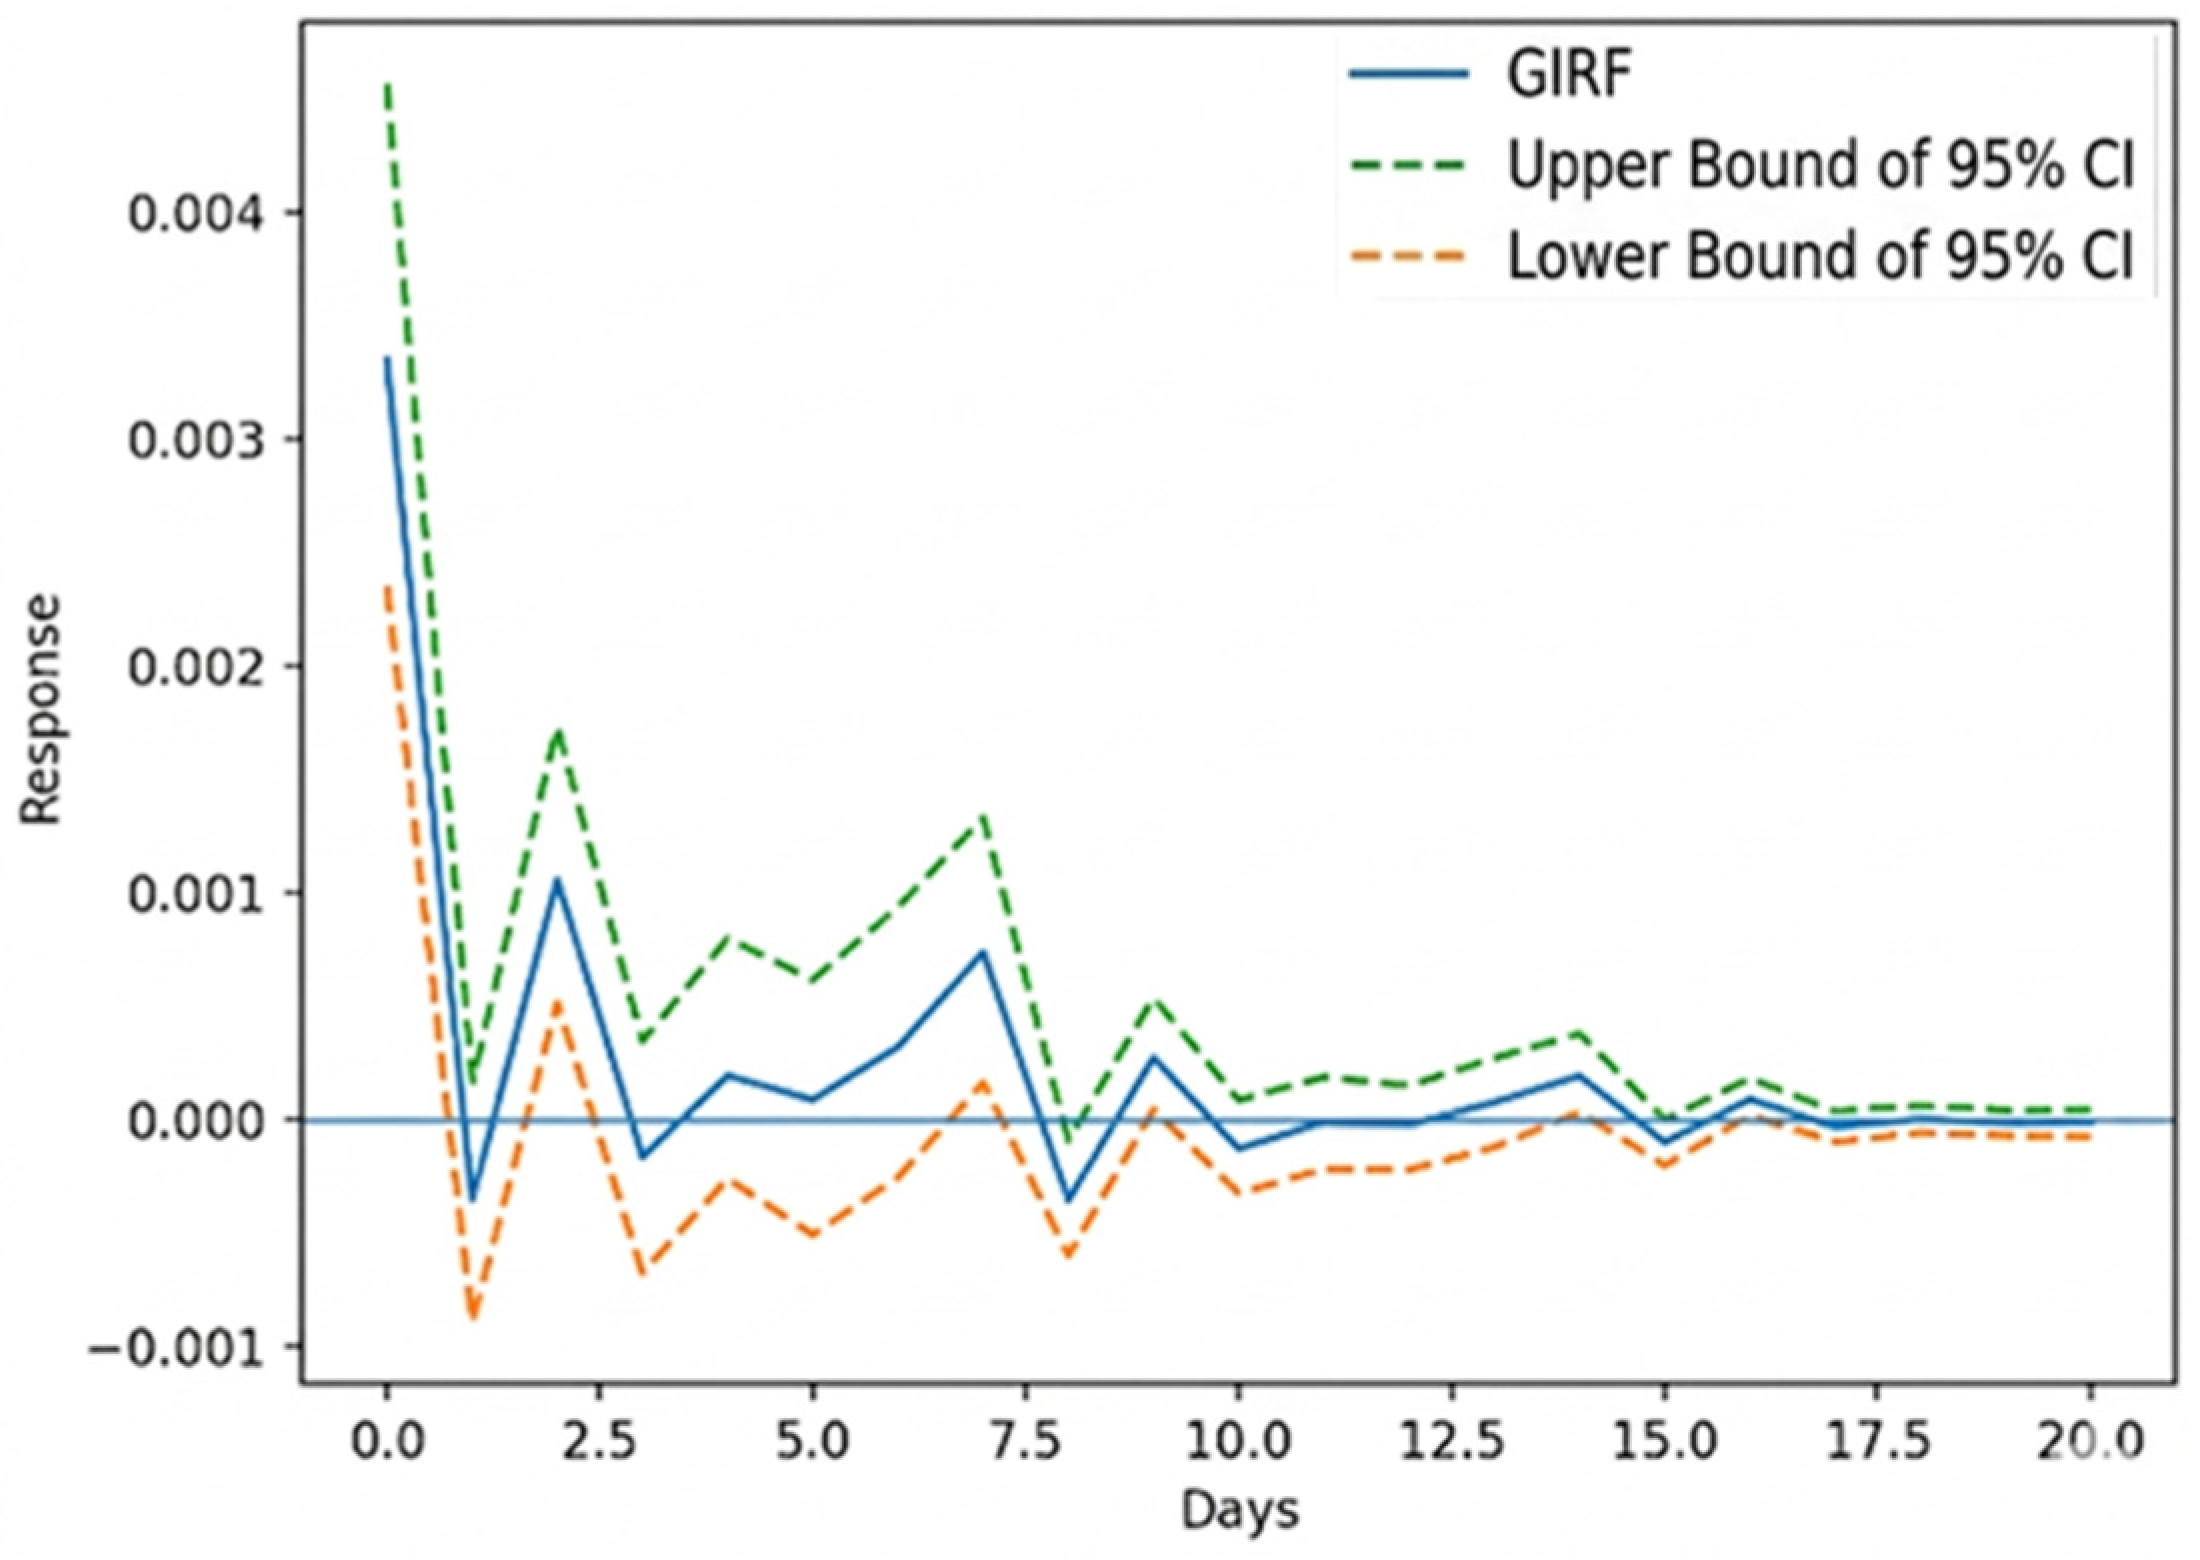
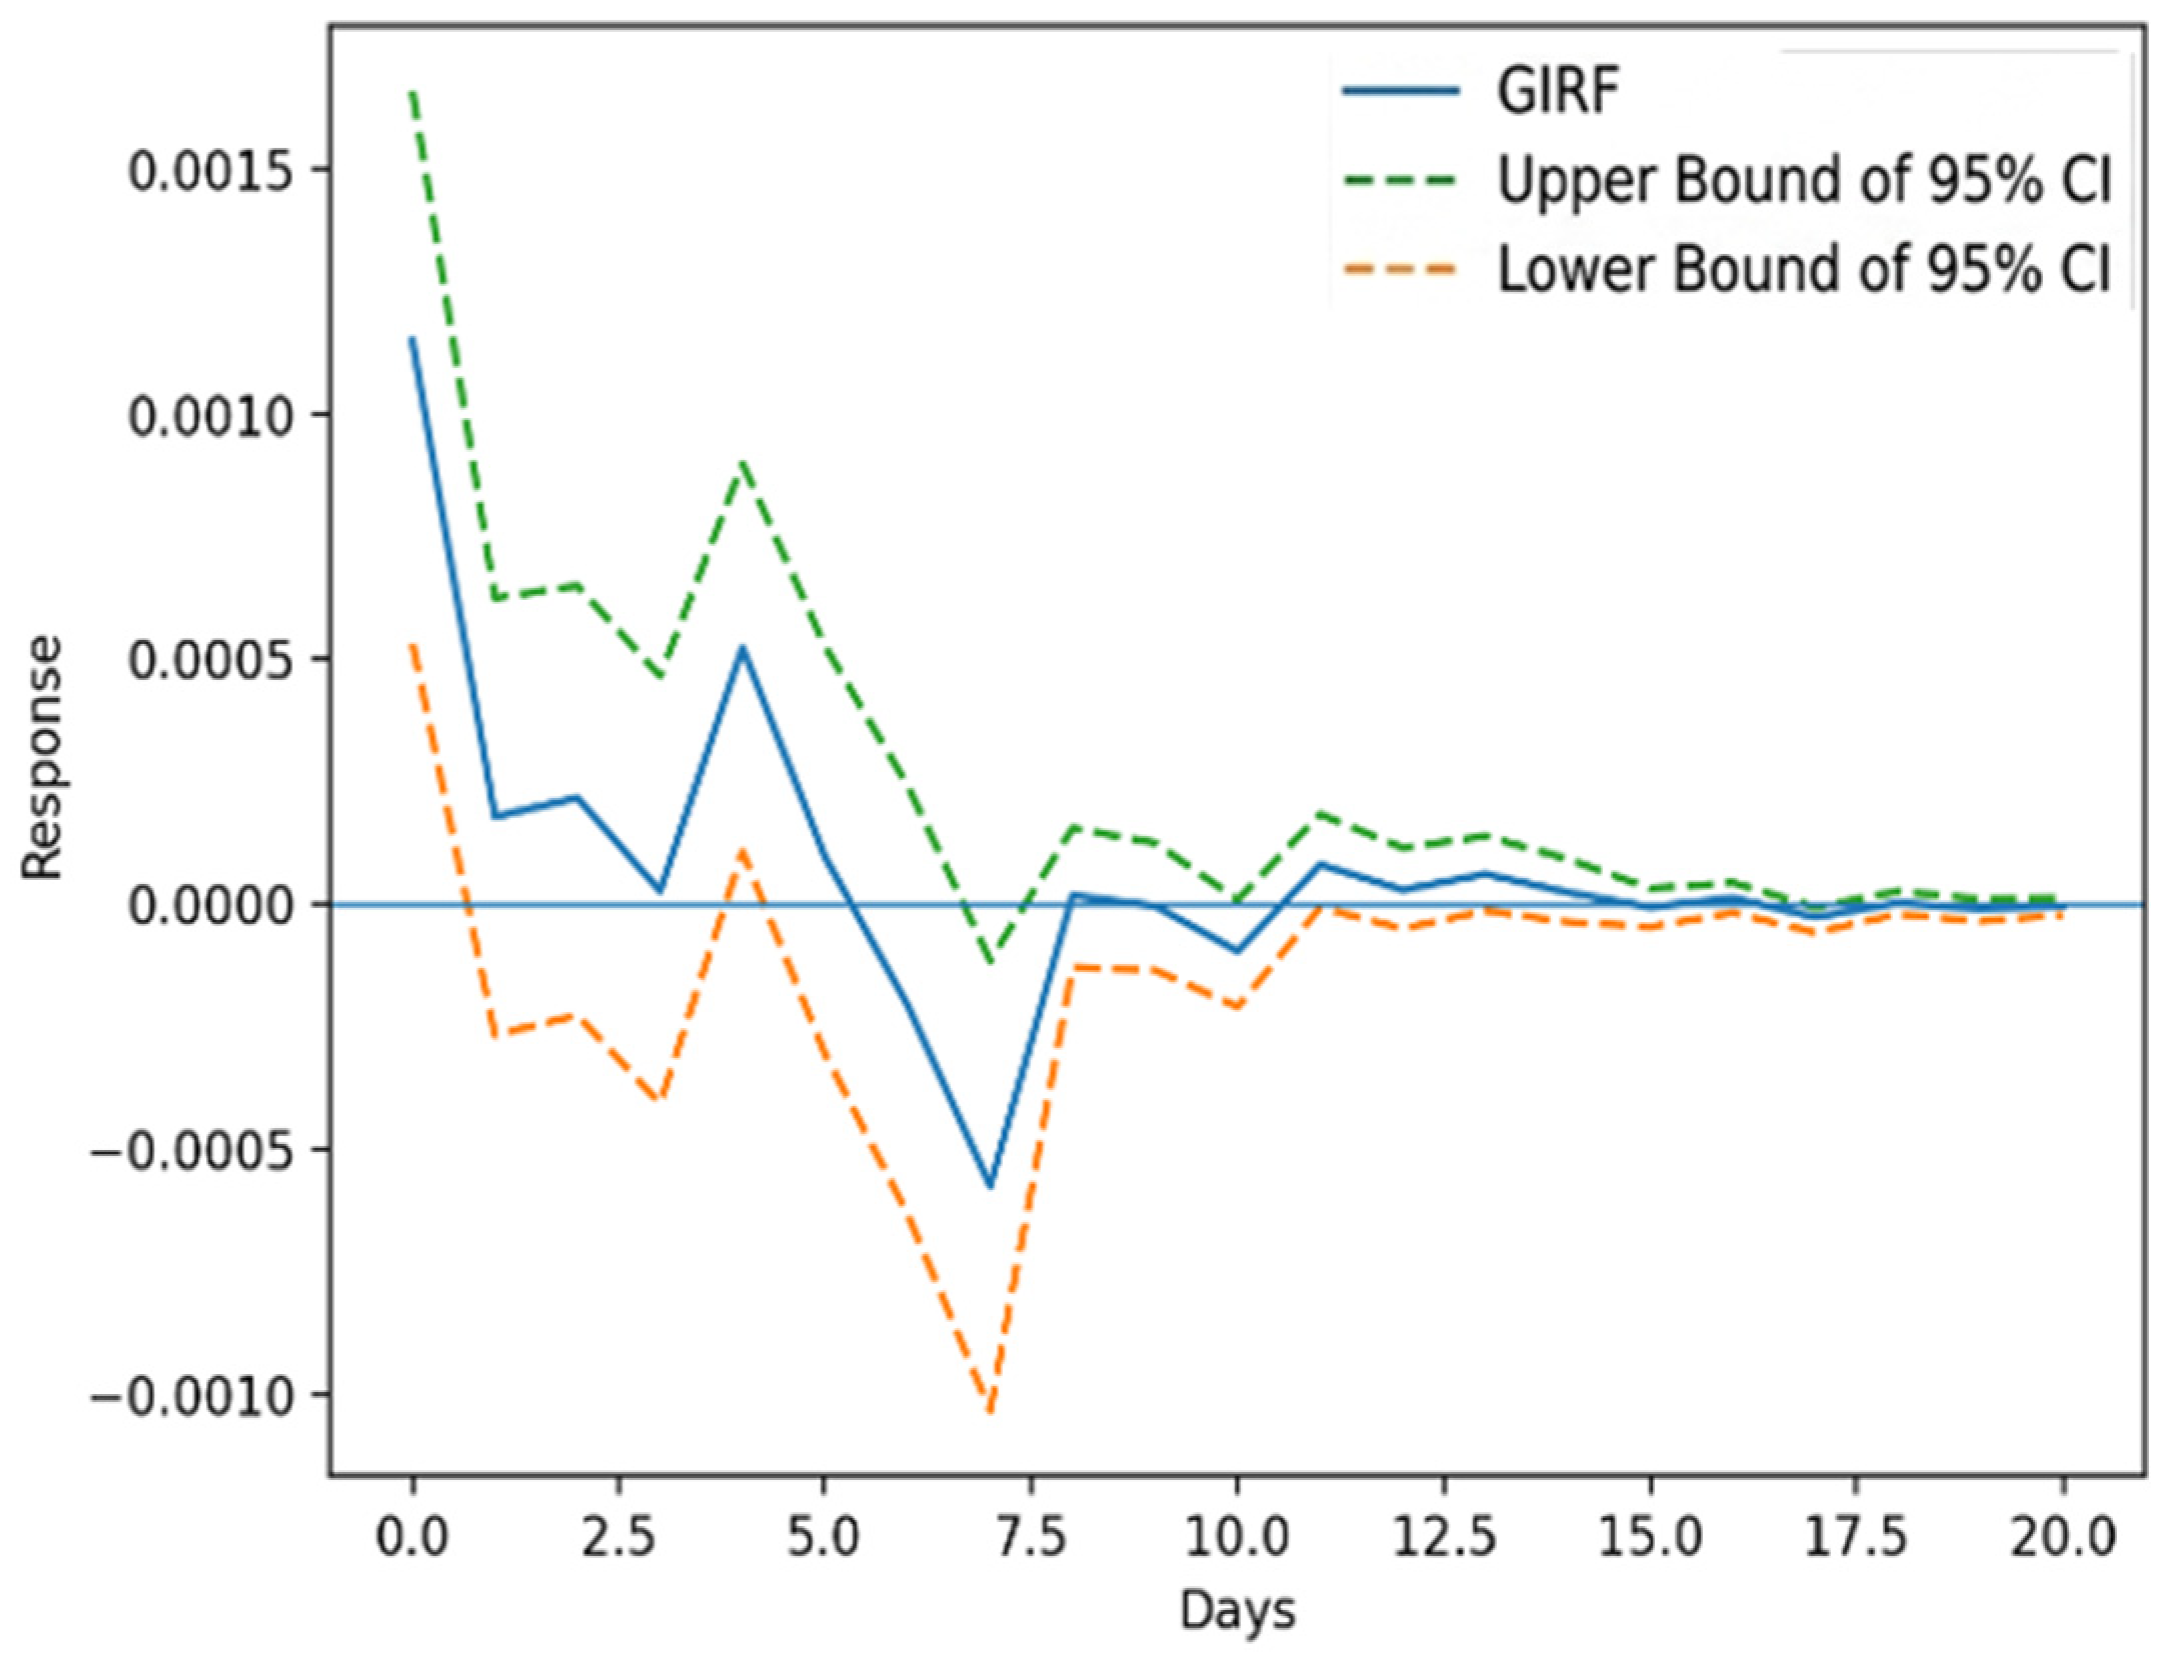
In each of these GIRF plots (Figure 4, Figure 5, Figure 6 and Figure 7), the green dashed line represents the Upper Bound of the 95% Confidence Interval. This line, together with the orange dashed line (lower bound), defines the range within which the true response is expected to fall with 95% certainty. When both dashed lines are above or below the zero-axis, the response is considered statistically significant.
Generalized impulse response functions show that shocks originating in Bitcoin produce statistically significant responses in Ethereum over short horizons, with effects dissipating after several days. In contrast, responses in equity indices and gold are smaller in magnitude and decay rapidly, indicating limited cross-market spillovers.
To distinguish contemporaneous co-movement from dynamic transmission, spillover measures excluding the impact period (h = 0) are summarized in Table 4.
These findings indicate that internal cryptocurrency contagion dominates cross-market transmission dynamics.

3.5. Diebold–Yilmaz Connectedness

To quantify aggregate cross-market spillovers, we apply the connectedness framework of Diebold and Yilmaz based on generalized forecast error variance decompositions (GFEVD). The generalized decomposition is invariant to variable ordering and consistent with the generalized impulse response methodology. Spillovers are computed from a VAR(7) model estimated on daily log-returns with a 10-day forecast horizon (H = 10). The variance decomposition matrix is row-normalized so each row sums to 100%, enabling interpretation as the share of forecast error variance in asset i attributable to shocks originating in asset j. Table 5 presents the full-sample spillover matrix.

3.5.1. Static Connectedness Results

Table 5 shows moderate system-wide connectedness. The Total Spillover Index equals 34.06%, implying that roughly one-third of forecast error variance is explained by cross-market shocks and the remainder by own-market innovations. Directional spillovers reveal strong bidirectional transmission within the cryptocurrency sector: Bitcoin shocks explain 35.31% of Ethereum variance and Ethereum shocks explain 35.09% of Bitcoin variance. In contrast, gold remains largely segmented, with 93.17% of its variance driven by its own shocks and only 6.83% attributable to external spillovers. Equity markets exhibit meaningful internal linkages, consistent with traditional market integration.
These patterns indicate that connectedness is concentrated within asset classes rather than across the entire system, supporting the interpretation of partial market segmentation.

3.5.2. Time-Varying Connectedness

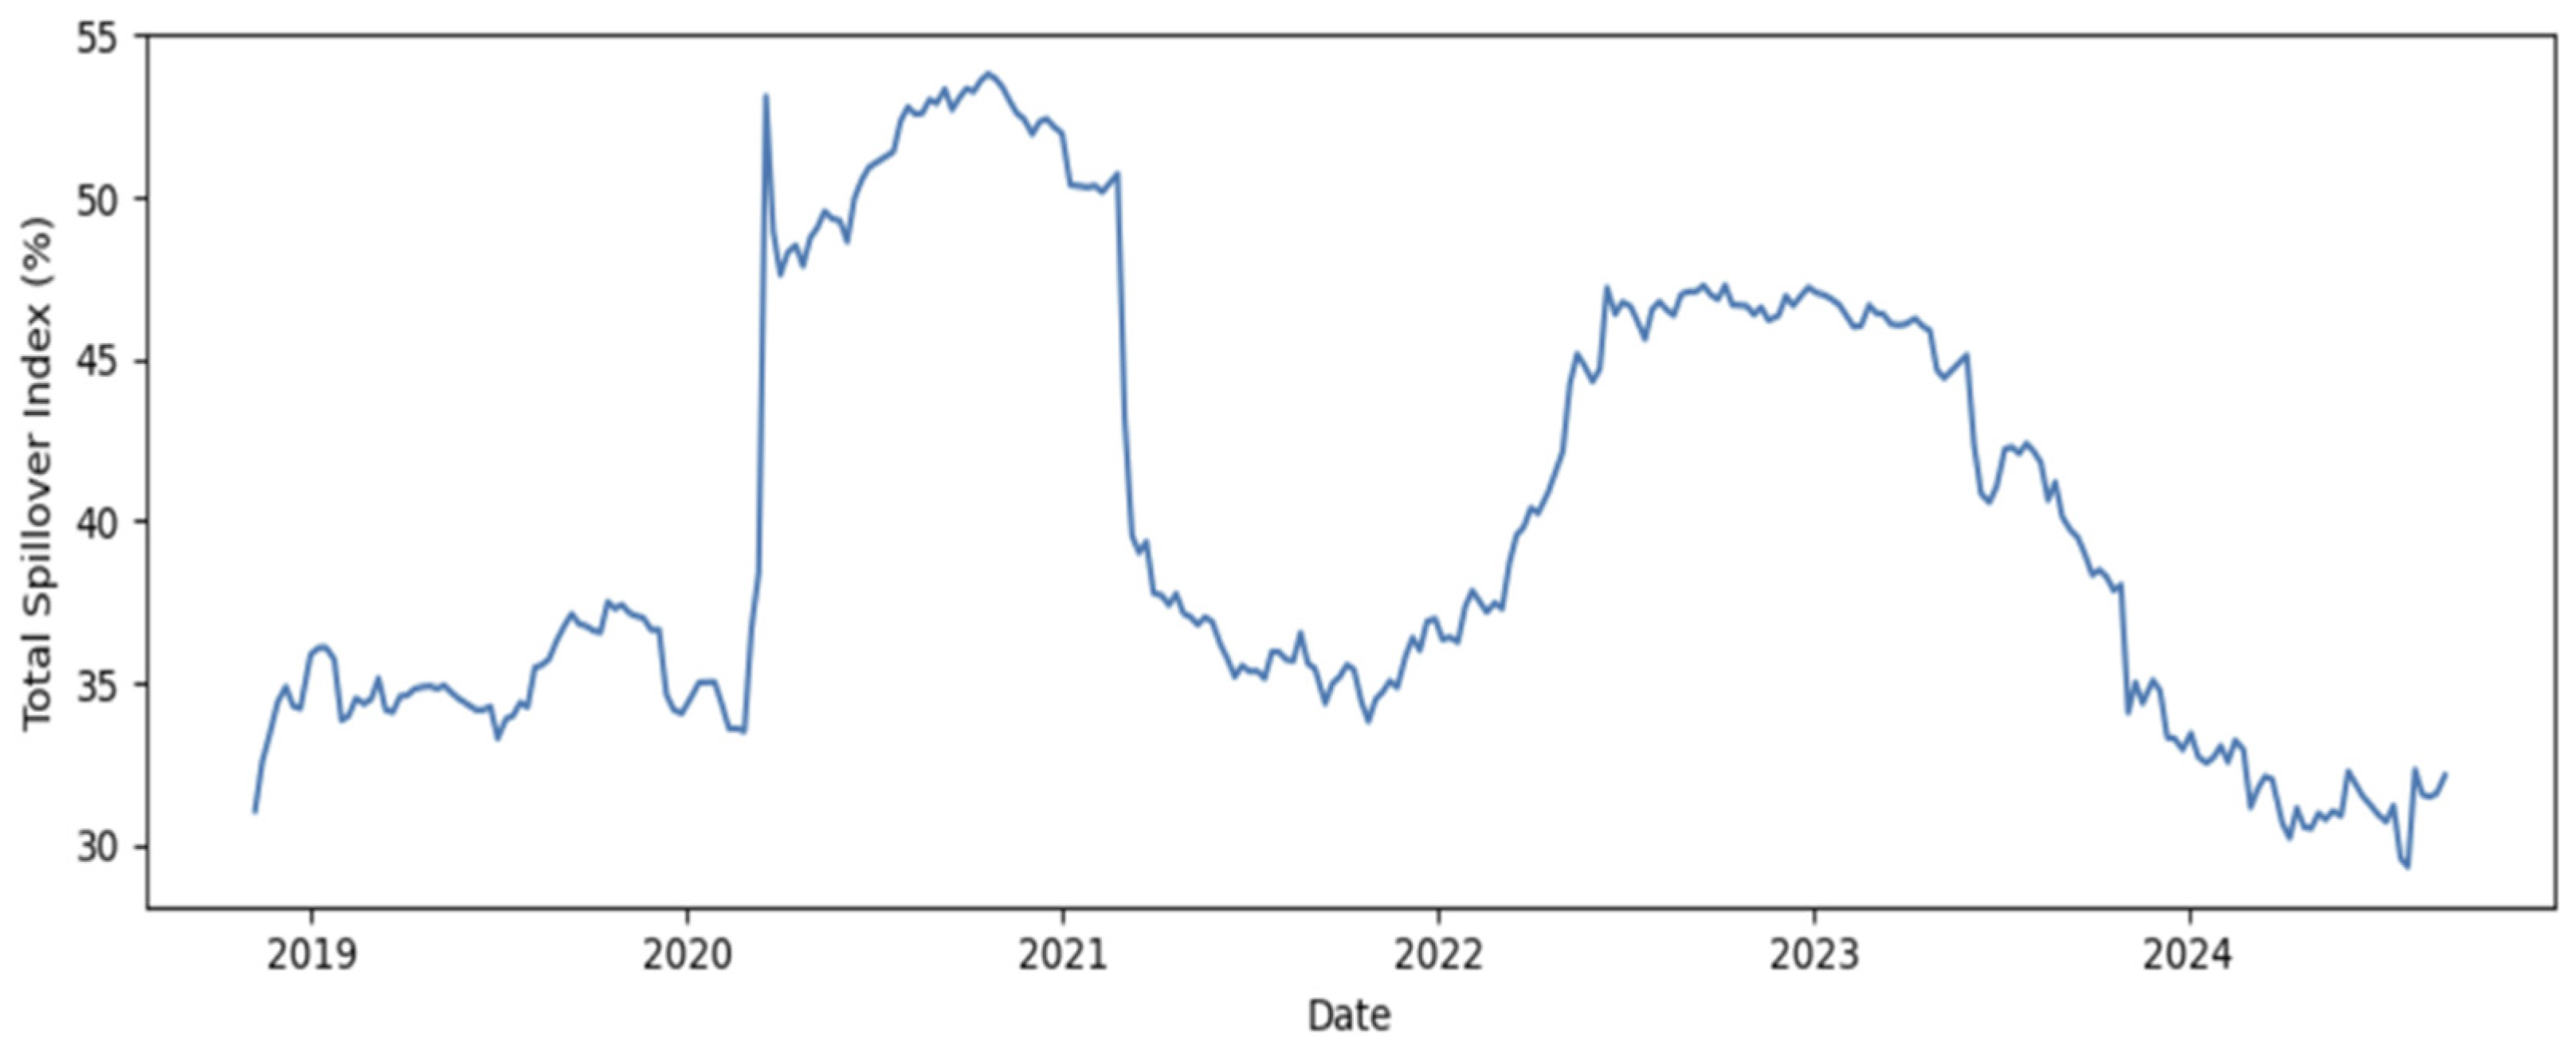
Figure 8 presents the 250-day rolling Total Spillover Index based on the generalized Diebold–Yilmaz framework. Spillover intensity varies substantially over time. Connectedness rises during periods of financial stress, peaking above 50% during the 2020 market disruption and declining toward the low-30% range in calmer regimes. This evidence indicates that cross-market spillovers are episodic and regime dependent, strengthening during turbulent periods and weakening during stable conditions.
The dynamic pattern aligns with the generalized impulse response results, which show that most cross-market shock effects are short-lived. Rather than persistent structural contagion, spillovers appear to reflect temporary synchronization during periods of heightened market risk.

3.6. Robustness Checks

To assess the stability of the empirical findings, several robustness tests are conducted. Results remain qualitatively unchanged under alternative VAR lag lengths (5 and 10), subsample analysis (pre- and post-COVID periods), Gaussian versus Student-t copula specifications, and exclusion of contemporaneous spillover effects. Internal cryptocurrency contagion persists across all specifications, whereas cross-market spillovers remain limited and short-lived.

3.6.1. Alternative Lag Lengths

The baseline VAR specification employs a lag length of 7 based on the Akaike Information Criterion. Re-estimation with alternative lags of 5 and 10 produces similar impulse response patterns. Short-horizon transmission from Bitcoin to Ethereum remains statistically significant, while spillovers to equity indices and gold remain smaller and dissipate rapidly. These results indicate that conclusions are not sensitive to lag selection.

3.6.2. Subsample Stability

The sample is divided into pre-COVID (2017–February 2020) and crisis/post-crisis periods (March 2020–2024) to evaluate structural stability. Although contemporaneous correlations increase during crisis episodes, lagged spillovers remain limited in magnitude. Dynamic responses dissipate within a few days in both subsamples, supporting the interpretation of regime-dependent co-movement rather than persistent contagion.

3.6.3. Copula Specification

Dependence models are re-estimated using both Gaussian and Student-t copulas. The Student-t specification provides superior model fit and captures tail dependence within the cryptocurrency ecosystem. Tail dependence between cryptocurrencies and traditional assets remains negligible, and qualitative results are unchanged across specifications, demonstrating robustness to dependence modeling choices.

3.6.4. Exclusion of Contemporaneous Effects

To distinguish dynamic transmission from contemporaneous co-movement, spillover measures are recomputed excluding h = 0 responses. Cross-market spillovers decline in magnitude, while internal cryptocurrency transmission remains significant. This confirms that results are driven by dynamic shock propagation rather than instantaneous covariance.

4. Economic Significance

4.1. Portfolio and Risk Results

Portfolio analysis indicates that including Bitcoin in diversified portfolios yields measurable risk reduction despite its high volatility. Mean–variance optimization shows that optimal cryptocurrency allocations remain modest (8–14% in equity portfolios), reflecting its role as a supplementary diversification asset rather than a core holding. Portfolio variance reductions of 4–6% and corresponding declines in Value-at-Risk are shown in Table 6, which demonstrates diversification benefits arising from imperfect correlations with traditional assets.
Hedging analysis suggests limited but nonzero risk mitigation potential. Hedge ratios with equities (0.12–0.18) imply that small cryptocurrency positions may partially offset equity exposure, while very low hedge ratios with gold (<0.05) confirm minimal hedging interaction. Combined with impulse response and spillover results showing limited cross-market transmission, the evidence indicates that cryptocurrencies function primarily as diversification instruments rather than strong hedging assets.

4.2. Interpretation for Investors

The economic analysis provides three key insights.
First, despite their high volatility, cryptocurrencies can contribute to portfolio diversification due to their relatively weak spillover relationships with traditional financial assets. The impulse response analysis demonstrates that shocks originating in cryptocurrency markets generate only limited transmission effects to equity indices and gold.
Second, optimal portfolio allocations typically assign a modest weight to cryptocurrencies, reflecting the trade-off between diversification benefits and elevated volatility.
Third, while cryptocurrencies are not strong hedging instruments for traditional assets, their inclusion in a diversified portfolio may reduce overall risk exposure under certain market conditions.
Taken together, these results suggest that cryptocurrencies function primarily as diversification assets rather than safe havens or hedging instruments, consistent with the broader empirical literature on digital asset integration with traditional financial markets.

5. Discussion

The empirical results provide a comprehensive view of the dependence structures and spillover dynamics among cryptocurrencies, equity markets, and gold. By integrating tail-sensitive modeling with dynamic transmission analysis, this study distinguishes structural relationships from simple volatility-driven co-movement.

5.1. Internal Cryptocurrency Interdependence

Internal cryptocurrency dependence emerges as the dominant feature of the digital asset ecosystem. The Student-t copula estimates reveal strong extreme co-movement between Bitcoin and Ethereum, with correlation exceeding 0.83 and tail dependence around 0.59. This indicates that major cryptocurrencies behave as a highly interconnected system where shocks propagate rapidly. Such structural interdependence limits diversification benefits within the cryptocurrency class, particularly during market stress when joint extreme movements become more likely. This aligns with our generalized impulse response evidence showing significant short-horizon transmission from Bitcoin to Ethereum, reinforcing the view that internal contagion is a defining characteristic of digital asset markets.

5.2. Cross-Market Relationships with Equities

Relationships with equities are more nuanced. Dependence on major indices is moderate (correlation 0.15–0.23) but lacks significant tail dependence. This distinction is critical: it suggests that extreme downturns in cryptocurrencies and equities are not systematically synchronized once volatility effects are controlled. Observed correlations likely reflect shared exposure to macroeconomic conditions, liquidity cycles, and investor risk sentiment rather than persistent structural contagion. The episodic nature of these linkages is supported by our Diebold–Yilmaz measures, showing that spillovers intensify during crises but weaken in stable regimes. Consequently, cryptocurrencies exhibit hybrid characteristics influenced by broader financial conditions while maintaining distinct risk dynamics.

5.3. The Segmentation of Gold

Dependence on gold remains weak throughout the sample. Minimal correlation and negligible tail dependence indicate that gold is largely insulated from cryptocurrency shocks. Dynamic impulse responses confirm that crypto-originated disturbances generate only transient effects on gold returns, underscoring its role as a segmented diversification asset. This reinforces traditional financial theory, which characterizes gold as responding to distinct economic drivers, such as inflation expectations and safe-haven demand, rather than digital asset dynamics.

6. Conclusions

This study provides an integrated assessment of dependence structures and dynamic spillover mechanisms between cryptocurrencies and traditional financial assets amidst increasing market institutionalization. By combining volatility filtering, copula-based modeling, and connectedness analysis, we offer a unified perspective on systemic risk transmission.

6.1. Summary of Empirical Evidence

Cryptocurrency Ecosystem: Displays strong internal dependence (BTC–ETH correlation > 0.83; tail dependence ≈ 0.59). This limits diversification among digital assets during extreme market conditions.
Equity Markets: Relationships are moderate and regime-dependent. The absence of significant tail dependence implies that systemic contagion and synchronized extreme losses are limited once volatility is controlled. Cryptocurrencies function as hybrid assets with partial market segmentation.
Gold Assets: Dependence remains weak with negligible tail dependence. Gold’s segmentation reinforces its role as a diversification instrument driven by forces distinct from the digital asset market.
Spillover Dynamics: Cryptocurrencies act predominantly as shock transmitters within their own ecosystem. The Total Spillover Index of 34.06% suggests that institutional expansion has not yet produced pervasive systemic integration with traditional markets.

6.2. Economic Significance and Recommendations

From a portfolio perspective, the results highlight conditional diversification benefits. Modest allocations to Bitcoin (8–14%) can reduce portfolio variance by 4–6% and lower Value-at-Risk. These gains arise from imperfect correlations rather than strong hedging properties. Investors seeking risk reduction should combine cryptocurrencies with traditional assets (like gold) rather than relying on multi-crypto portfolios.

6.3. Limitations and Future Research

While current spillover effects appear limited, increasing institutional adoption may strengthen interdependencies over time. Future research should extend this analysis by incorporating regime-switching models and high-frequency data to capture evolving transmission mechanisms as digital assets become further embedded in global investment portfolios.
The empirical findings provide a nuanced perspective on the “institutionalization” of cryptocurrencies following the 2024 spot ETF approvals. While the entry of institutional capital was expected to synchronize Bitcoin with traditional equities, our results suggest that the cryptocurrency market maintains a significant degree of structural segmentation.

Author Contributions

W.B.: Conceptualization, research design, methodology development, econometric modeling, supervision, interpretation of empirical results, and manuscript writing and revision. X.L.: Data collection, data processing, preliminary empirical analysis, literature review support, and assistance in manuscript preparation, writing—original draft. All authors have read and agreed to the published version of the manuscript.

Funding

This research received no external funding.

Institutional Review Board Statement

Not applicable.

Informed Consent Statement

Not applicable.

Data Availability Statement

The data used in this study, including daily closing prices for Bitcoin, Ethereum, the NASDAQ Composite, the S&P 500, and Gold, were retrieved from the Yahoo Finance public database (https://finance.yahoo.com accessed on 20 February 2026). The sample period spans from 1 January 2017 to 31 December 2024. The compiled dataset used for the analysis is available from the corresponding author upon reasonable request.

Conflicts of Interest

The authors declare no conflicts of interest.

References

  1. Adelopo, I., & Luo, X. (2025). Interconnectedness among cryptocurrencies and financial markets: A systematic literature review. Digital Finance, 7, 1119–1171. [Google Scholar] [CrossRef]
  2. Alamaren, A. S., Lefilef, A., Kaddumi, T., Bendjeddou, S., & Zaghdoud, O. (2025). The transmission and influence mechanism of bitcoin, green bonds, renewable energy, and gold: A quantile connectedness approach. Frontiers in Blockchain, 8, 1738520. [Google Scholar] [CrossRef]
  3. Aliu, F., & Nuhiu, A. (2025). Analyzing the interconnectedness within the volatile crypto market: Evidence from two consequent non economic shocks. SAGE Open, 15(2), 21582440251340458. [Google Scholar] [CrossRef]
  4. Aslanidis, N., Bariviera, A. F., & Laborda, A. P. (2020). Are cryptocurrencies becoming more interconnected? arXiv, arXiv:2009.14561. [Google Scholar] [CrossRef]
  5. Atik, Z., Guven, M., Guloglu, B., Koksalmis, G. H., & Calisir, F. (2025). Exploring nonlinear tail dependencies: Cryptocurrencies, stablecoins, and commodity markets amid monetary shifts. Research in International Business and Finance, 76, 102874. [Google Scholar] [CrossRef]
  6. Baur, D. G., & Hoang, L. T. (2024). Cryptocurrency spillovers and correlations: Inefficiency and co movement. Digital Finance, 6(2), 203–224. [Google Scholar] [CrossRef]
  7. Bauri, E., Shahzad, S. J. H., Roubaud, D., Kristoufek, L., & Lucey, B. (2020). Bitcoin, gold, and commodities as safe havens for stock markets: A comparative analysis. Quarterly Review of Economics and Finance, 77, 156–164. [Google Scholar] [CrossRef]
  8. Caporale, G. M., de Dios Mazariegos, J. J., & Gil-Alana, L. A. (2024). Long run linkages between US stock prices and cryptocurrencies: A fractional cointegration analysis. Computational Economics, 64(6), 3543–3553. [Google Scholar] [CrossRef]
  9. Caporale, G. M., Kang, W.-Y., Spagnolo, F., & Spagnolo, N. (2021). Cyber-attacks, spillovers and contagion in the cryptocurrency markets. Journal of International Financial Markets, Institutions & Money, 74, 101298. [Google Scholar] [CrossRef]
  10. Chen, W. P., Wu, C. C., & Aimable, W. (2025). Cryptocurrency market spillover in times of uncertainty. North American Journal of Economics and Finance, 76, 102347. [Google Scholar] [CrossRef]
  11. Chen, X., DeGrauwe, M., & Gilbert, P. (2025). Risk transmission mechanisms between cryptocurrencies and bond markets. Journal of Empirical Finance, 72, 109640. [Google Scholar]
  12. Corbet, S., Larkin, C., & Lucey, B. (2020). The contagion effects of the COVID-19 pandemic: Evidence from gold and cryptocurrencies. Finance Research Letters, 35, 101554. [Google Scholar] [CrossRef]
  13. Hanif, W., Hernandez, J. A., Troster, V., Kang, S. H., & Yoon, S. M. (2022). Nonlinear dependence and spillovers between cryptocurrency and global/regional equity markets. Pacific Basin Finance Journal, 74, 101822. [Google Scholar] [CrossRef]
  14. Iyer, R., & Popescu, A. (2023). New evidence on spillovers between crypto assets and financial markets (IMF Working Paper 2023/213). International Monetary Fund. [Google Scholar] [CrossRef]
  15. Katsiampa, P. (2017). Volatility estimation for bitcoin: A comparison of GARCH models. Economics Letters, 158, 3–6. [Google Scholar] [CrossRef]
  16. Khan, N., Yaya, O. S., Vo, X. V., & Zada, H. (2025). Quantile time frequency connectedness and spillovers among financial stress, cryptocurrencies and commodities. Resources Policy, 103, 105527. [Google Scholar] [CrossRef]
  17. Kim, J., Kim, S. M., & Kim, S. (2020). On the relationship of cryptocurrency price with US stock and gold price using copula models. Mathematics, 8(11), 1859. [Google Scholar] [CrossRef]
  18. Lee, D., Kim, K., & Kang, H. (2025). Quantile time frequency spillovers among green bonds, cryptocurrencies, and conventional financial markets. International Review of Financial Analysis, 93, 103198. [Google Scholar] [CrossRef]
  19. Lee, M., Kim, S., & Wu, Y. (2023). Dynamic correlation and hedge effectiveness: Bitcoin, gold, and equities across market states. Economic Modelling, 106, 105663. [Google Scholar]
  20. Liu, J., Julaiti, J., & Gou, S. (2024). Decomposing interconnectedness: A study of cryptocurrency spillover effects in global financial markets. Finance Research Letters, 61, 104950. [Google Scholar] [CrossRef]
  21. Mensi, W., Gubareva, M., Ko, H. U., Vo, X. V., & Kang, S. H. (2023). Tail spillover effects between cryptocurrencies and uncertainty in the gold, oil, and stock markets. Financial Innovation, 9, 92. [Google Scholar] [CrossRef]
  22. Mezghani, T., Rabbani, M. R., Trichilli, Y., & Abbes, B. (2024). Revisiting dynamic connectedness, spillover and hedging opportunities among cryptocurrency, commodities, and islamic stock markets. Journal of Islamic Monetary Economics and Finance, 10(1), 35–92. [Google Scholar] [CrossRef]
  23. Milunovich, G. (2018). Cryptocurrencies, mainstream asset classes and risk factors: A study of connectedness. arXiv, arXiv:1809.03072. [Google Scholar] [CrossRef]
  24. Narayan, S., & Kumar, D. (2024). Unveiling interconnectedness and risk spillover among cryptocurrencies and other asset classes. Global Finance Journal, 62, 101018. [Google Scholar] [CrossRef]
  25. Patton, A. J. (2006). Modelling asymmetric exchange rate dependence. International Economic Review, 47(2), 527–556. [Google Scholar] [CrossRef]
  26. Rehman, S. U., Ahmad, T., Desheng, W. D., & Karamoozian, A. (2024). Analyzing selected cryptocurrencies spillover effects on global financial indices: Comparing risk measures using conventional and eGARCH EVT copula approaches. arXiv, arXiv:2407.15766. [Google Scholar]
  27. Sklar, A. (1959). Fonctions de répartition à n dimensions et leurs marges. Publications de l’Institut de Statistique de l’Université de Paris, 8, 229–231. [Google Scholar]
  28. Song, J., Zhang, R., & Wang, X. (2025). Nonlinear dependence and spillovers across cryptocurrency and global equity markets. Pacific Basin Finance Journal, 78, 101915. [Google Scholar]
  29. Umar, Z., Gubareva, M., & Ko, H. U. (2025). Dynamic linkages and volatility spillovers between cryptocurrencies and oil markets. Energy Economics, 110, 105859. [Google Scholar]
  30. Vuković, D. B., Frömmel, M., Vigne, S. A., & Zinovev, V. (2025). Spillovers between cryptocurrencies and financial markets in a global framework. Journal of International Money and Finance, 150, 103235. [Google Scholar] [CrossRef]
  31. Wang, H., Luo, X., & Sun, Y. (2024). Frequency domain spillovers and tail dependencies in digital and financial asset markets. Journal of International Money and Finance, 148, 103185. [Google Scholar]
  32. Wu, S. (2021). Co movement and return spillover: Evidence from bitcoin and traditional assets. SN Business & Economics, 1, 10. [Google Scholar] [CrossRef]
  33. Zeng, S., Liu, B., & Liu, Q. (2025). Asymmetric spillover from bitcoin to green and traditional assets: A comparison with gold. International Review of Economics & Finance, 88, 1397–1417. [Google Scholar] [CrossRef]
  34. Zhang, W., Zhang, L., & Li, J. (2025). Connectedness between geopolitical risk, crypto markets, and traditional assets. Energy Economics, 110, 105840. [Google Scholar]
Figure 1. Integrated Empirical Framework.
Economies 14 00143 g001
Figure 2. Rolling 120-Day Correlations (Log Returns).
Economies 14 00143 g002
Figure 3. GARCH(1,1) Diagnostics For Bitcoin (Katsiampa, 2017).
Economies 14 00143 g003
Figure 4. Generalized IRF: BTC Shock to ETH.
Economies 14 00143 g004
Figure 5. Generalized IRF: BTC Shock to NDX.
Economies 14 00143 g005
Figure 6. Generalized IRF: BTC Shock to SPX.
Economies 14 00143 g006
Figure 7. Generalized IRF: BTC Shock to GOLD.
Economies 14 00143 g007
Figure 8. Rolling Total Spillover Index.
Economies 14 00143 g008
Table 1. Diagnostic Test Results.
TestMethodNull HypothesisResultInterpretation
StationarityADF TestUnit root presentRejected (1%)Series stationary
StationarityPhillips–Perron TestUnit root presentRejected (1%)Confirms stationarity
VAR StabilityCharacteristic RootsRoots outside unit circleAll roots insideVAR stable
Serial CorrelationLM Test (lags 1–10)No residual autocorrelationNot rejectedVAR lag length adequate
Conditional HeteroskedasticityARCH-LM TestNo ARCH effectsRejectedVolatility clustering present
Table 2. Descriptive Statistics of Asset Returns.
AssetMeanStdSkewKurtosisJBstatJBp
BTC0.0011790.044557−0.7406513.214727564.0620
ETH0.0011290.056953−0.6402211.899975739.7670
NDX0.0006260.016357−0.3946213.758558262.0030
SPX0.0004310.012542−0.8156917.4908115,100.410
GOLD0.0003860.009354−0.221027.2184321276.0538.10 × 10−278
Table 3. Copula-Based Dependence and Tail Dependence Estimates.
PairGauss ρGaussAICt-Copula ρdfTail λtAICWinnerAIC
BTC-ETH0.8127−1850.58630.83772.85350.5920−2146.8055Student-t
BTC-NDX0.1490−36.49120.153714.55020.0040−42.4275Student-t
BTC-SPX0.2272−88.86220.231014.64870.0066−95.4703Student-t
BTC-GOLD0.1041−16.67990.101921.79750.0003−17.8941Student-t
NDX-SPX0.6038−775.62860.61966.11390.2366−829.8505Student-t
Table 4. Post-Impact Dynamic Spillovers from Bitcoin Shocks (h ≥ 1).
ResponsePeak_h ≥ 1Peak_DaySignificant_Days_95_h ≥ 1
BTC0.00325373
ETH0.0049634
NDX0.00115577
SPX0.00105727
GOLD−0.0005773
Table 5. Generalized Diebold–Yilmaz Spillover Matrix (VAR(7), H = 10; values in %).
BTCETHNASDAQGOLDSP500FROM
BTC57.1835.311.741.144.6242.82
ETH35.0956.282.341.065.2343.72
NASDAQ2.472.9262.710.8431.0637.29
GOLD2.202.111.0593.171.476.83
SP5005.205.8527.680.9460.3339.67
TO44.9646.1932.813.9842.38
NET+2.14+2.47−4.48−2.85+2.71
Table 6. Optimal Portfolio Weights and Risk Reduction.
PortfolioBTC WeightVariance ReductionVaR Reduction (95%)
BTC–S&P 5008–12%4.3%3.8%
BTC–NASDAQ10–14%6.1%5.0%
BTC–Gold6–9%3.2%2.7%
Disclaimer/Publisher’s Note: The statements, opinions and data contained in all publications are solely those of the individual author(s) and contributor(s) and not of MDPI and/or the editor(s). MDPI and/or the editor(s) disclaim responsibility for any injury to people or property resulting from any ideas, methods, instructions or products referred to in the content.