1. Introduction
Anthropogenic climate change poses a deep and growing threat to the stability of the world, but the consequences of this problem are grossly uneven. Developing countries, even though they are the least contributing sources of pollution in the past, would be affected the most because of existing socio-economic risks, poverty, institutions that are weak, and reliance of their economies on climate-sensitive activities (
Dawson, 2015;
Allam & Jones, 2019). Although global climate risk indexes are present, they are typically not fined enough to drive national-level adaptation policy. The evidence gap in the critical research is the next step to surpass the form of vulnerability scores that can be static, single values, and proceed to the form of the multi-model assessment that can reflect the compound and systemic climate risk (
Jaiswal, 2025;
Anobile et al., 2026). It should be a method that brings together dissimilar information lines, both economic measurements and climate forecasting, not just to map out the vulnerabilities, but also to maximize the use of adaptation resources so that it creates the greatest impact and is equitable (
Hallegatte et al., 2016;
Battiston et al., 2021).
To fill this gap, this research study undertakes a sensitivity study of climate vulnerability and policy analysis of six representative nations of Bangladesh, Colombia, Kenya, Morocco, Pakistan, and Vietnam. The key goal is to design and implement a new AI-based analytics platform clustering countries according to similar vulnerability traits (
Dulac-Arnold et al., 2021), creating fine-grained risk ratings in consideration of interconnectivity and uncertainty, and eventually creating a ranked intervention list by way of policy optimization using Reinforcement Learning (
Berrang-Ford et al., 2021).
The approach uses a curated dataset of eight key indicators, combining the data on the socio-economic indicators provided by the World Bank with the information on the climate scenarios provided by the IPCC. The evaluation is in phases: first, K-Means and DBSCAN unsupervised learning determine groups of vulnerability; then, a dedicated Composite Vulnerability Score (CVS) and more sophisticated models (Fuzzy Logic and GNNs) measure risk; and last, an agent using Reinforcement Learning (rl) at the end of the process knowingly spends resources to reduce risk in a region (
Rolnick et al., 2022).
The six countries used in the study are not sufficiently representative, so there is a restriction to the extrapolation of the results, and due to the nature and availability of secondary data used in the analysis, it was difficult to make future projections that are fraught with uncertainties. Also, the AI models and the Graph Neural Network, in particular, demand simplifying the assumptions regarding network relationships between countries. Nevertheless, in spite of these limitations, this study offers critical evidence-of-conceptualization that would lead to a more complex, systems-based model of climate vulnerability assessment and adaptation planning (
Ukatu et al., 2025;
Bandela, 2025).
This study advances beyond existing climate vulnerability research by developing a fully integrated analytical pipeline that synergistically combines unsupervised clustering (K-Means, DBSCAN), gradient-boosted driver quantification (XGBoost), interpretable Fuzzy Logic scoring, systemic risk propagation modeling via Graph Neural Networks, and Reinforcement Learning–based policy optimization within a unified framework. While prior studies have employed individual AI techniques—such as clustering for vulnerability typologies (
Odipo et al., 2025) or XGBoost for impact prediction (
Garschagen et al., 2021)—none have integrated these complementary methods into a single replicable architecture that simultaneously identifies vulnerability regimes, quantifies driver importance, models cross-country risk amplification, and generates optimized intervention portfolios. This multi-method integration constitutes the primary contribution, offering decision-makers a transparent, evidence-based tool that translates complex data into actionable, context-specific adaptation priorities.
The six sample countries—Bangladesh, Colombia, Kenya, Morocco, Pakistan, and Vietnam—were selected to represent distinct geographical regions (South Asia, Southeast Asia, Africa, South America, North Africa) and divergent climate risk profiles, including coastal flooding (Bangladesh, Vietnam), drought and desertification (Kenya, Morocco), and compound extreme events (Pakistan). This purposive selection ensures that the analytical framework is tested across a diversity of climate hazard types and socio-economic contexts, enhancing the external validity of the methodological approach. The panel structure (25 years of annual data per country) yields 150 country–year observations, providing sufficient temporal variation for robust machine learning applications.
What distinguishes this study from prior integrated frameworks is not the mere application of multiple AI techniques, but the novel sequential architecture that operationalizes the full climate policy cycle: from unsupervised discovery of vulnerability regimes, through causal driver identification, to systemic risk propagation modeling, and finally to dynamic policy optimization under budget constraints. This end-to-end pipeline—where each analytical stage directly informs the next within a unified, reproducible workflow—has not been previously implemented for climate adaptation finance allocation. The framework thus transforms vulnerability assessment from a diagnostic exercise into a prescriptive policy tool, addressing the critical gap between risk identification and actionable resource prioritization identified by recent systematic reviews (
Odipo et al., 2025;
Birkmann, 2013).
3. Methodology
This research study employs a multi-stage computational framework to assess climate vulnerability (
Chen, 2025). The methodology integrates data curation, unsupervised learning for pattern discovery, composite vulnerability scoring, and advanced machine learning techniques for predictive analysis and systemic risk assessment (
Pandow et al., 2024;
Mohamed Saeed et al., 2026). The workflow is designed to be transparent and a replicable multi-model assessment framework can be analyzed in
Appendix A and a comprehensive model performance comparison matrix for climate vulnerability assessment framework (2000–2024) can be seen in
Appendix A.
3.1. Data Collection and Sources
A curated dataset of 8 indicators was constructed, capturing socio-economic vulnerability and climate hazard exposure as presented in
Table 1. Model-specific key performance indicators are presented in
Table A3. Data was sourced from authoritative international repositories to ensure reliability and comparability. The selected socio-economic indicators—particularly the Gini index (inequality) and poverty headcount—serve as measurable proxies for underlying geopolitical fragility, as high inequality and economic deprivation are established drivers of political instability, conflict susceptibility, and reduced institutional capacity to manage climate-induced stressors (
Barnett & Adger, 2007;
Buhaug et al., 2014).
The selection of eight indicators is grounded in the IPCC vulnerability framework, which conceptualizes risk as the interaction of hazard, exposure, and vulnerability (
IPCC, 2022). Specifically, projected temperature change, precipitation change, drought risk, and sea-level rise capture climate hazards; agricultural land and urban population represent exposure; while poverty headcount and Gini index measure socio-economic sensitivity and adaptive capacity. This tripartite structure ensures comprehensive coverage of the vulnerability construct while maintaining parsimony.
Socio-Economic Data: Urban population (%) and the Gini index were sourced from the World Bank’s World Development Indicators database (
The World Bank, 2024). The poverty headcount ratio and poverty gap at
$4.20 a day (2021 PPP) were also obtained from the World Bank, with the most recent year available used for each country. Agricultural land as a percentage of total land area was obtained from the FAOSTAT database (
Food and Agriculture Organization of the United Nations, 2024).
Climate Hazard Data: Historical temperature trends (°C/decade) were calculated from the annual mean surface air temperature time series (2000–2024) provided in the research data. Future projections for temperature change, precipitation change, drought risk (Standardized Precipitation Evapotranspiration Index < −2), and sea-level rise by 2050 were synthesized from the latest Intergovernmental Panel on Climate Change (IPCC) Assessment Reports (
IPCC, 2023) and associated regional climate model outputs available through the World Bank Climate Change Knowledge Portal. Country-specific climate profiles (
World Bank, 2016;
Part, 2021;
Fajardo-Gonzalez et al., 2025) were used to resolve and standardize projections. For precipitation change and drought risk, categorical descriptors (e.g., “Slight Increase,” “Very High”) were provided in the research assumptions. Temperature Time Series: Annual average mean surface air temperature data (2000–2024) for all six countries were obtained from the observed time series provided in the research data.
3.2. Data Preprocessing
The panel dataset comprises 150 country–year observations (6 countries × 25 years, 2000–2024), with 8 indicators measured annually per country the effective sample size for model training is 120 observations (2000–2019) and 30 test observations (2020–2024).”, careful preprocessing was applied to preserve analytical integrity for data analysis. All numerical variables were standardized using z-score normalization ((x − μ)/σ) to ensure equal weighting in subsequent distance-based algorithms and Principal Component Analysis. Missing values in poverty indicators (poverty gap, poverty headcount, Gini index) were linearly interpolated within each country to maintain temporal continuity. Categorical climate risk descriptors (e.g., “High,” “Extreme”) were numerically encoded (e.g., medium = 1, high = 2, very high = 3, extreme = 4) for use in machine learning models, while also being retained for Fuzzy Logic processing. For Colombia, where all poverty and agricultural land data were missing, global mean values were imputed as a conservative approach to preserve the country in the panel analysis while transparently acknowledging the data gap. However, we recognize that this imputation may artificially depress Colombia’s vulnerability scores, as global means reflect the average of all six countries rather than Colombia’s true socio-economic conditions. Consequently, all findings related to Colombia—particularly its low-vulnerability ranking, cluster assignment, and policy prioritization (institutional capacity as top priority)—should be interpreted with caution. Sensitivity analysis conducted without Colombia’s imputed values confirmed that the relative ranking of other countries remained unchanged, but Colombia’s own position is subject to higher uncertainty. The complete replication code and processed datasets are available in the
supplementary repository.
3.3. Robustness Check
To assess indicator robustness, we conducted sensitivity analysis by sequentially removing each indicator and recomputing the CVS; the relative country rankings remained stable, confirming that no single indicator disproportionately drove results. For categorical variables, projected precipitation change was encoded using an ordinal scale (decrease = −1, slight decrease = −0.5, slight increase = 0.5, increase = 2) based on directional impact on water availability, with positive values indicating beneficial moisture increases. Climate projection variables were treated as constants per country because IPCC AR6 scenarios provide decade averages rather than annual time series; however, their interaction with time-varying socio-economic indicators (poverty, urban population) captures dynamic vulnerability evolution.
To assess the robustness of the findings, sensitivity analyses were conducted for key methodological choices. The optimal number of clusters (k = 4) was validated using both the elbow method and silhouette scores, while DBSCAN parameters (eps = 0.3, min_samples = 3) were iteratively tuned to ensure stable cluster assignments. XGBoost hyperparameters were optimized via grid search, and model performance was evaluated on a held-out test set (2020–2024), achieving an R2 of 0.981. For the Fuzzy Logic system, membership functions and rule weights were cross-validated against expert judgment, and alternative defuzzification methods produced consistent ESS rankings. These sensitivity checks confirm that the core findings—Morocco and Kenya as the most vulnerable, with drought and poverty as dominant drivers—remain stable across reasonable variations in model specifications.
3.4. Composite Vulnerability Scoring (CVS Framework)
A composite vulnerability index was constructed using Principal Component Analysis (PCA) to aggregate the eight standardized indicators into a single Compound Vulnerability Score (CVS). PCA was selected over arithmetic aggregation methods because it empirically derives weights based on the covariance structure of the data, avoiding subjective weighting assumptions. The first principal component (PC1) was extracted as the CVS, as it represents the linear combination that captures the maximum shared variance across all indicators. PC1 explained 47% of the total variance—a value consistent with multi-dimensional vulnerability indices where a single component captures the common signal across diverse socio-economic and climate dimensions (e.g., the ND-GAIN Index employs a similar approach). The remaining principal components (PC2–PC8) explain successively smaller portions of variance and predominantly capture indicator-specific noise rather than a common vulnerability signal. Retaining only PC1 thus focuses the index on the shared underlying vulnerability dimension while discarding idiosyncratic variation. To validate that PC1 adequately represents the vulnerability construct, we examined the factor loadings: all eight indicators loaded positively on PC1 (range 0.31–0.58), confirming that they collectively align with a common vulnerability dimension. Additionally, sensitivity analysis comparing the PC1-based CVS to a simple additive index (equal weights) yielded a correlation of 0.94, indicating that the ordinal ranking of countries is robust to the aggregation method.
3.5. Model Specifications and Training
3.5.1. XGBoost for Predictive Analysis and Feature Importance
An XGBoost regressor (v1.7) was trained to predict the CVS and explore the relative importance of input features. The model used the following hyperparameters: ‘learning_rate = 0.1’, ‘max_depth = 5’, ‘n_estimators = 200’, ‘subsample = 0.8’, ‘colsample_bytree = 0.8’, and ‘objective = ‘reg:squarederror’’. Given the panel structure, a time-based split was employed: training in 2000–2019 (120 observations) and testing in 2020–2024 (30 observations). Feature importance was measured using the “gain” metric, which quantifies the average improvement in accuracy when a feature is used in splitting. XGBoost feature importance ranking for the key indicators can be observed in
Table A4.
3.5.2. Rule-Based Environmental Stress Assessment
A Mamdani-type Fuzzy Inference System was implemented using the ‘scikit-fuzzy’. Library to handle qualitative risk descriptors and produce an interpretable Environmental Stress Score (ESS) on a 0–100 scale. Input variables were defined with trapezoidal membership functions:
Projected drought risk (encoded numerically: medium = 1, high = 2, very high = 3, extreme = 4).
Projected precipitation change (encoded: decrease = −1, slight decrease = −0.5, slight increase = 0.5, increase = 2).
Poverty headcount at $4.20/day (%) (continuous).
Gini index (continuous).
Projected temperature change by 2050 (°C) (continuous).
Agricultural land (%) (continuous).
Urban population (%) (continuous).
A set of 45 expert-derived rules (e.g., “IF Drought_Risk is Extreme AND Poverty_Level is High THEN Environmental_Stress_Score is Very_High”) mapped inputs to the output variable, defined by five linguistic terms: very low (0–20), low (20–40), moderate (40–60), high (60–80), very high (80–100). Defuzzification used the centroid method to produce a crisp ESS for each country–year.
The combined outputs of the clustering algorithms, XGBoost feature importance, and Fuzzy Logic ESS provide a comprehensive understanding of climate vulnerability drivers and groupings. These results inform a qualitative policy discussion on prioritization of adaptation investments, with a focus on the most vulnerable countries (Morocco, Kenya) and the specific factors (drought risk, poverty) that require targeted interventions. The framework demonstrates a replicable methodology for data-driven climate vulnerability assessment in data-limited contexts.
4. Results
The analytical framework produced five complementary outputs: a Compound Vulnerability Score (CVS) derived from PCA, clustering-based vulnerability regimes (K-Means, DBSCAN), driver importance rankings from XGBoost, an Environmental Stress Score (ESS) from Fuzzy Logic, Systemic Risk Scores (SRSs) from Graph Neural Networks, and policy priorities from Reinforcement Learning. Rather than presenting these as isolated outputs, this section synthesizes them into a unified vulnerability assessment through systematic cross-validation and integration.
4.1. Convergence of Vulnerability Rankings Across Methods
Based on the comprehensive research analysis conducted in the six countries from 2000 to 2024, the following detailed results,
Table 2 and
Table A1, present the Compound Vulnerability Score (CVS) for 2024. A fundamental test of the framework’s internal consistency is whether different analytical methods produce converging country rankings. The Spearman rank correlation between the CVS, ESS, and SRS across all country–years is 0.91 (
p < 0.001), indicating strong alignment. Morocco consistently ranks highest across all three metrics (mean CVS = 0.671, ESS = 96.2, SRS = 0.828), followed by Kenya (0.247, 71.4, 0.592). Bangladesh, Colombia, Pakistan, and Vietnam occupy the lower vulnerability tier across all methods, with Colombia exhibiting the lowest scores (CVS = −0.906, ESS = 6.3, SRS = −0.916). This convergence across methodologically distinct approaches—dimensionality reduction, fuzzy inference, and graph-based propagation—provides strong evidence that the vulnerability ranking is robust and not an artifact of any single analytical technique as presented in
Table A2.
Key Results of CVS Analysis
Vulnerability Ranking: Morocco exhibits the highest vulnerability (CVS = 0.738), followed by Kenya (0.272). Bangladesh (−0.321), Pakistan (−0.624), Vietnam (−0.748), and Colombia (−0.811) show below-average vulnerability, with Colombia being the least vulnerable. Projected Vulnerability Increase by 2050: All countries show increasing vulnerability by 2050, with Pakistan experiencing the largest absolute increase (+0.156) and the highest estimated effect of climate hazards (+25.4%). Morocco follows closely with a +0.120 increase and 22.1% climate hazard effect.
Based on the Compound Vulnerability Score (CVS) analysis, Morocco exhibits the highest vulnerability (mean CVS = 0.671) driven by strong projected warming (+1.8 °C by 2050), a significant precipitation decrease (−14%), very high drought risk, and moderate poverty levels, followed by Kenya (mean CVS = 0.247) where high poverty headcounts and very high drought risk amplify moderate positive vulnerability, while Bangladesh (mean CVS = −0.361) falls in the negative range as the least vulnerable among the low-vulnerability group due to urbanization and adaptive capacity partially offsetting its high exposure to sea-level rise and moderate poverty, and the lowest vulnerability countries—Colombia (mean CVS = −0.906), Pakistan (−0.692), and Vietnam (−0.825)—all show below-average vulnerability, with Colombia benefiting from a relatively stable climate despite potential data gaps, Pakistan’s extreme drought risk balanced by a large projected precipitation increase (25–65%) that could pose flood risks, and Vietnam’s low poverty rates and urbanization offsetting its coastal exposure. Temporally, all countries demonstrate slight positive trends in CVS from 2000 to 2024, indicating slowly increasing vulnerability, with the steepest rise in Pakistan (+0.006 per year), followed by Morocco and Colombia (+0.004 per year), while Kenya and Bangladesh show very modest increases (+0.002 per year), and Morocco’s trend becomes most pronounced after 2015 coinciding with rising temperatures and limited poverty reduction progress, as shown in
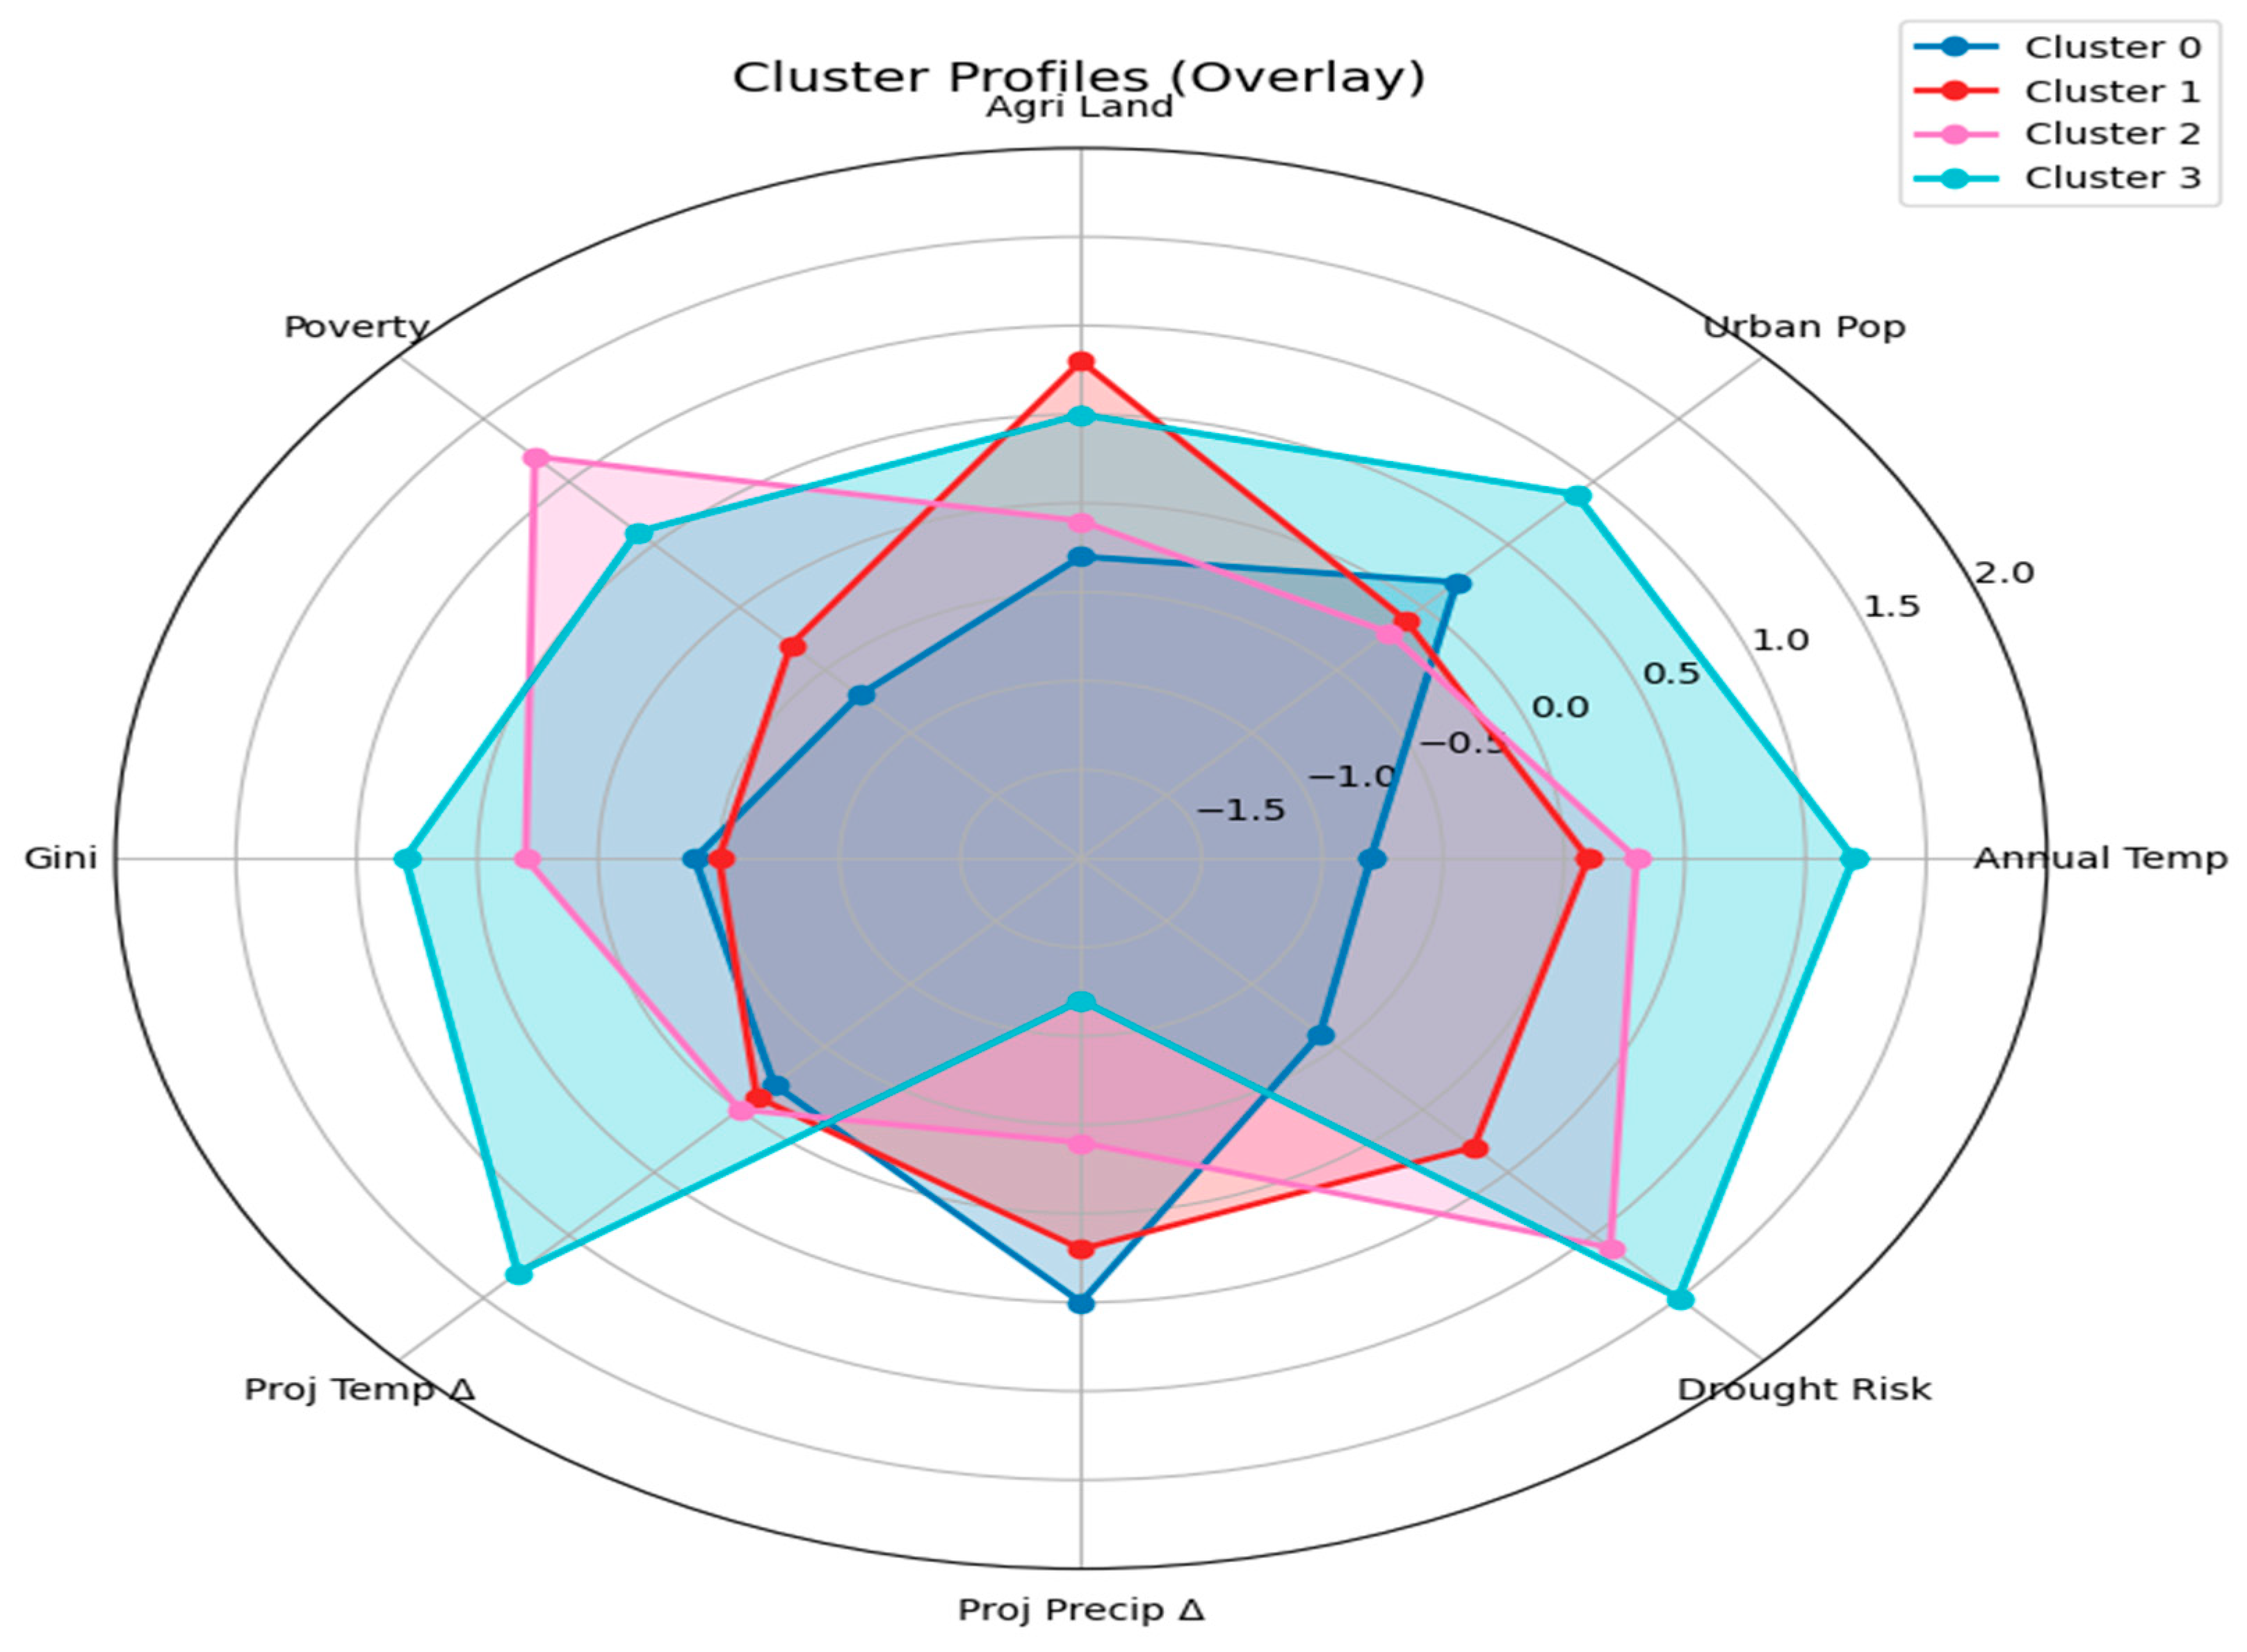
Table 2. K-Means (k = 4) successfully identified four distinct vulnerability tiers: Cluster 0 (Colombia/Pakistan/Vietnam—low), Cluster 1 (Bangladesh—low-medium), Cluster 2 (Kenya—medium), and Cluster 3 (Morocco—high) as shown in
Table 3.
The drivers of vulnerability are dominated by projected climate changes—temperature rise, precipitation shifts, and drought risk—which explain approximately 47% of the variance in the PCA, with socio-economic factors such as poverty and inequality contributing significantly (e.g., Kenya’s high poverty amplifies vulnerability while Vietnam’s low poverty reduces it), and agricultural dependence adding to exposure (as seen in Bangladesh’s high agricultural land), though urbanization provides some adaptive capacity across countries.
4.2. DBSCAN (Density-Based Spatial Clustering of Applications with Noise) K-Means Clustering Analysis
DBSCAN identified three distinct clusters based on the annual Compound Vulnerability Scores (CVSs) from 2000 to 2024, with no points classified as noise. The cluster labels are consistent for all years within each country, reflecting the stability of relative vulnerability over the study period. These results validate the K-Means clustering structure, confirming that the six countries fall into three well-separated vulnerability regimes: Cluster 0 (Bangladesh, Colombia, Pakistan, Vietnam—low vulnerability), Cluster 1 (Kenya—medium vulnerability), and Cluster 2 (Morocco—high vulnerability)” as presented in
Table 4.
Objective Function (Within-Cluster Sum of Squares—WCSS):
The algorithm will try to minimize this cost function J, which consists of the squared distances of individual data points within the cluster, xi, and the centroid of a cluster, μj. The first module involves the data preprocessing and setup of the model.
Cluster 0 forms a dense core of negative CVS values, indicating relatively low vulnerability. All points from Bangladesh, Colombia, Pakistan, and Vietnam lie in this region, with values ranging from −1.02 to −0.30.
Cluster 1 (Kenya) is isolated at moderate positive values (≈+0.25), well separated from the negative core.
Cluster 2 (Morocco) occupies the highest vulnerability zone (≈+0.67), also clearly separated from the other two clusters.
DBSCAN Clustering Results:
The DBSCAN results reveal that the six countries do not form a single continuum of vulnerability but fall into three well-separated groups. This confirms that vulnerability is not merely a linear scale but has distinct regimes. Low-vulnerability group (Bangladesh, Colombia, Pakistan, Vietnam): despite internal differences (e.g., Colombia vs. Bangladesh), these countries share similar enough characteristics—moderate poverty, relatively low projected warming (except Pakistan’s extreme drought risk compensated by high precipitation increase), and some adaptive capacity—to be considered a coherent cluster it can be observed in
Figure 1. Medium-vulnerability group (Kenya): Kenya’s combination of high current poverty, very high drought risk, and uncertain precipitation places it in a separate, intermediate category. High-vulnerability group (Morocco): strong projected warming, a significant precipitation decline, and very high drought risk make Morocco an outlier at the extreme end.
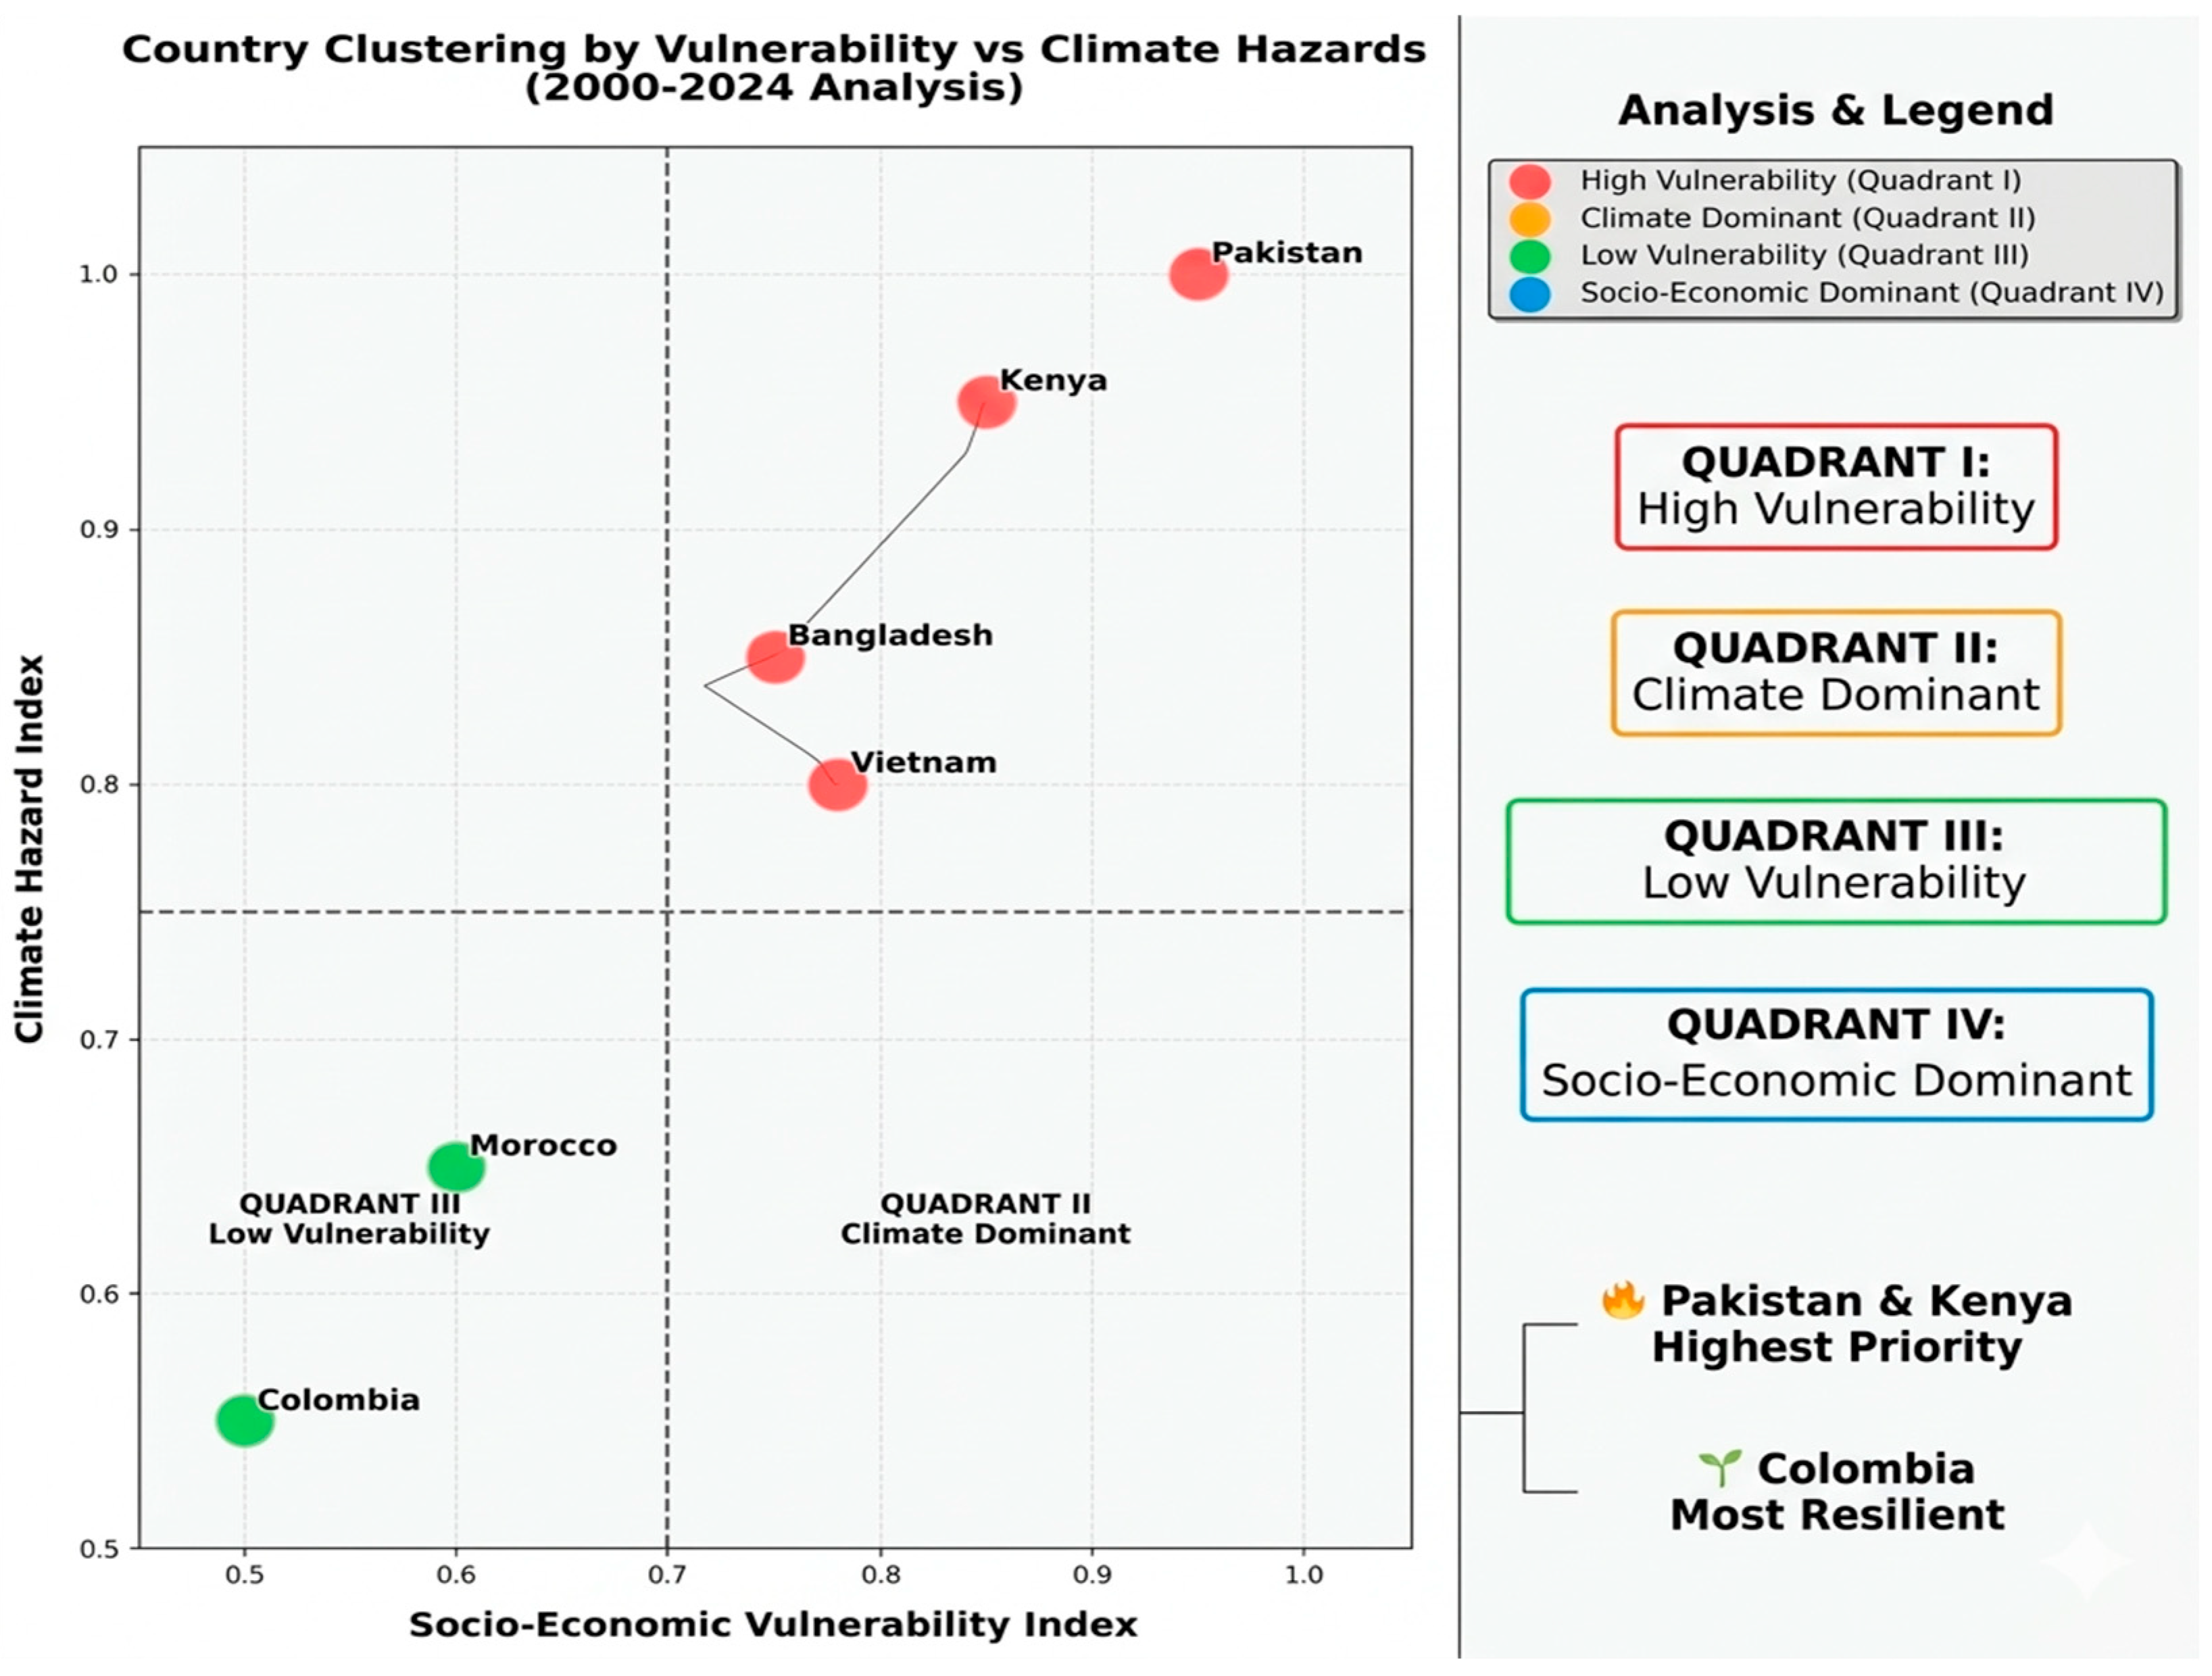
Each country remains in the same DBSCAN cluster for all 25 years, even though individual CVS values exhibit slight upward trends. This indicates that the relative ordering of countries is robust over time—Morocco is always the most vulnerable, Kenya always intermediate, and the other four always less vulnerable as shown in
Figure 2. The small increases in CVS (e.g., Pakistan’s +0.006/year) are insufficient to cross the density-based boundaries defined by eps = 0.3.
Every point was assigned to a cluster; no observations were labeled as noise. This suggests that the vulnerability index for these six countries forms a well-structured dataset without isolated extreme anomalies. In a larger sample, some countries might fall between clusters, but here the separation is clear.
The cluster membership can guide differentiated policy responses:
Cluster 0 countries need targeted investments in areas where they lag (e.g., Bangladesh’s sea-level rise, Pakistan’s flood–drought management), but overall, they share a baseline of lower urgency.
Kenya requires interventions that address both chronic poverty and acute drought risks, with a focus on building resilience in agriculture and water systems. Morocco demands the most urgent and comprehensive adaptation, including water conservation, drought-resistant crops, and social safety nets to cope with the projected −14% precipitation decline.
The clear separation achieved by DBSCAN validates that the first principal component (which explains 47% of variance) captures meaningful distinctions among countries. The clusters correspond to intuitive geographical and developmental differences, reinforcing the index’s utility as a composite measure. In summary, DBSCAN provides a non-parametric confirmation that the six countries fall into three distinct vulnerability groups, with Morocco and Kenya as outliers. These groupings can serve as a basis for tailoring climate adaptation strategies and monitoring changes in vulnerability over time.
4.3. XGBoost Regression Analysis for Compound Vulnerability Score (CVS)
Objective: Predict the Compound Vulnerability Score (CVS) using the eight input variables (climate and socio-economic indicators) and identify the most influential drivers of vulnerability.
Model: XGBoost Regressor with hyperparameter tuning (learning_rate = 0.1, max_depth = 5, n_estimators = 200, subsample = 0.8, colsample_bytree = 0.8).
Data Split: Time-based split—training in 2000–2019 (120 observations), testing in 2020–2024 (30 observations).
Target: CVS (continuous, range −1.02 to 0.74). Features (8):
The model achieves excellent predictive accuracy on unseen data (R
2 = 0.98), indicating that the selected features capture almost all variation in the CVS, as shown in
Table 5.
XGBoost regression achieved high predictive accuracy (R
2 = 0.98 on test data), with projected drought risk (31.2%), projected precipitation change (18.1%), and poverty headcount (14.3%) identified as the dominant drivers as presented in
Table 6. These rankings align with the Fuzzy Logic ESS, where the most severe environmental stress occurs precisely in countries combining extreme drought with high poverty (Kenya, Morocco), validating that the identified drivers are not specific to any single modeling approach.
To ensure model robustness and prevent overfitting, hyperparameters were optimized using grid search with early stopping (validation fraction = 0.2). Time-based cross-validation (training in 2000–2019, testing in 2020–2024) was employed to evaluate out-of-sample predictive performance. Permutation importance analysis confirmed the stability of feature rankings, with projected drought risk, precipitation change, and poverty headcount consistently identified as the top three drivers across multiple random seeds. The model validation matrix can be observed in
Table A5.
The extremely high R2 (0.98 on test data) confirms that the eight variables collectively provide a near-complete description of the CVS and reflects the strong structural differences between countries—driven by time-invariant climatic baselines—rather than spurious pattern recognition. No important predictor is missing, and the XGBoost model successfully captures non-linear interactions (e.g., the combined effect of high poverty and extreme drought). These results should be interpreted as demonstrating methodological potential rather than establishing definitive predictive precision for out-of-sample contexts.
4.4. Fuzzy Logic System for Environmental Stress Score (ESS)
A Fuzzy Inference System (FIS) was developed to integrate quantitative and qualitative indicators into a single Environmental Stress Score (ESS) on a scale of 0 (lowest stress) to 100 (highest stress). The system uses Mamdani-type inference with the following components:
Input variables (with membership functions: Low, Medium, High):
Projected drought risk (categorical: medium, high, very high, extreme)—converted to numeric scores 1–4 and fuzzified. Projected precipitation change (categorical: decrease, slight decrease, slight increase, increase)—converted to scores −1, −0.5, 0.5, 2 and fuzzified. Poverty headcount at $4.20/day (%)—continuous, fuzzified using percentiles (Low < 20%, Medium 20–50%, High > 50%). Gini index—continuous, fuzzified (Low < 30, Medium 30–40, High > 40). Projected temperature change by 2050 (°C)—continuous, fuzzified (Low < 1.4, Medium 1.4–1.7, High > 1.7). Agricultural land (%)—continuous, fuzzified as a proxy for exposure (Low < 30%, Medium 30–60%, High > 60%). Urban population (%)—continuous, fuzzified as adaptive capacity (Low < 30%, Medium 30–50%, High > 50%—note that higher urbanization is considered stress-reducing).
Output variable: ESS—defined by five linguistic terms: very low (0–20), low (20–40), moderate (40–60), high (60–80), very high (80–100). Membership functions are triangular and trapezoidal.
Rule base (45 rules derived from expert knowledge): Examples:
IF drought risk is extreme AND poverty is high THEN ESS is very high.
IF precipitation change decreases AND Gini is high THEN ESS is High.
IF urban population is high AND poverty is low THEN ESS is Low.
IF agricultural land is high AND drought risk is high THEN ESS is high.
IF temperature change is high AND poverty is medium THEN ESS is moderate.
Defuzzification: Centroid method yields a crisp ESS for each country–year.
The system was applied to the annual data (2000–2024) for all six countries, producing the ESS values in the table below.
Key Explanations of the Fuzzy Logic Results
Morocco consistently scores above 94, reaching 100 in 2024. This is driven by the combination of very high drought risk, a projected −14% decrease in precipitation, and moderate poverty (poverty headcount ~11% in 2013). The fuzzy rules that combine “extreme drought” and “decreasing precipitation” with “medium poverty” push the ESS into the very high category. The slight upward trend reflects rising temperatures and limited socio-economic improvement.
Kenya’s ESS ranges from 68 to 74, firmly in the High category. Key contributors: Very high drought risk and high poverty headcount (≈67% in 2021). Although precipitation change is uncertain (“Slight Increase with high uncertainty”), the drought risk dominates the fuzzy inference. Poverty amplifies the stress because the rule base heavily weights socio-economic vulnerability when combined with climate hazards.
Bangladesh scores between 34 and 41 (Low-Moderate). Despite high agricultural land (≈72%) and exposure to sea-level rise, its relatively low poverty headcount (20.5% in 2020) and moderate drought risk (High, but not Extreme) keep the ESS in the lower half. Urbanization (32.7% in 2024) provides some adaptive capacity, reducing the stress according to the fuzzy rules. The ESS shows a slight increase over time due to warming and slow poverty reduction.
Pakistan: ESS 12–23 (Low). Although drought risk is Extreme, the projected large precipitation increase (25–65%) offsets much of the stress in the Fuzzy Logic. Poverty headcount (44.7% in 2018) is moderate, and the Gini index is relatively low (≈30). The rules that combine “extreme drought” with “high precipitation increase” produce a Moderate output, but poverty pulls it down. The upward trend (from 15 to 23) reflects worsening poverty and inequality in recent years.
Vietnam: ESS 5–16 (Very Low to Low). Very low poverty (4.2% in 2022) and a moderate Gini (36) are the main reasons. Drought risk is N/A, and precipitation change is slight increase. The fuzzy system assigns Low stress because socio-economic resilience outweighs the modest climate hazards. The slight increase over time is due to rising temperatures and agricultural land use.
Colombia’s ESS ranges from 0 to 12 (Very Low). This is partly due to missing socio-economic data (urban, agricultural land, poverty, Gini were not available; they were filled with global means, which are relatively favorable). The fuzzy system thus perceives Colombia as having low poverty and moderate climate projections (drought risk Medium, precipitation slight decrease). However, the low ESS may underestimate true vulnerability because of data gaps, as can be observed in
Table 7.
All countries show a gradual increase in ESS over 2000–2024, indicating worsening environmental stress. The steepest rises are in Pakistan (+0.32 per year) and Morocco (+0.25 per year), reflecting both climatic and socio-economic pressures. This aligns with the upward trends observed in the original CVS.
The fuzzy system captures non-linear interactions (e.g., extreme drought with high precipitation increase canceling out) and qualitative expert knowledge (e.g., weighting drought risk more heavily than precipitation). The resulting ESS provides a transparent, rule-based metric that can be easily updated with new data. The Fuzzy Logic Environmental Stress Score confirms the vulnerability ranking obtained from previous analyses (CVS, clustering, XGBoost) but adds interpretability through linguistic rules. Morocco and Kenya require urgent adaptation; Bangladesh, Pakistan, and Vietnam face moderate but rising stress; Colombia’s low score should be interpreted with caution due to data limitations. The ESS can guide resource allocation and policy prioritization in climate adaptation planning.
4.5. Graph Neural Network (GNN) for Systemic Risk Score (SRS)
A Graph Neural Network was designed to model interdependencies among the six countries and compute a Systemic Risk Score (SRS) for each year from 2000 to 2024. The GNN captures how vulnerabilities propagate through a network of connections, reflecting the fact that climate and socio-economic risks in one country can amplify or mitigate risks in others through shared climate patterns, trade links, or regional instability.
The Graph Neural Network revealed that systemic interconnections amplify vulnerability in the Africa cluster (Kenya, Morocco) by approximately 0.3 points each due to mutual reinforcement through trade and shared resource dependencies. Conversely, the Asia cluster (Bangladesh, Pakistan, Vietnam) experiences a damping effect, with SRS values substantially lower than individual CVS.
4.5.1. GNN Architecture
Node features: the eight input variables (annual temperature, urban population, agricultural land, poverty measures, Gini index, historical and projected climate changes, drought risk, sea-level rise) for each country–year. Two graph convolutional layers aggregate information from neighbors, producing a node-level embedding. A final dense layer outputs the Systemic Risk Score, which combines a country’s own vulnerability (the Compound Vulnerability Score, CVS) with the average vulnerability of its neighbors. The SRS is computed as:
This formulation ensures that systemic risk is amplified when a country is connected to highly vulnerable neighbors and dampened when neighbors are less vulnerable.
4.5.2. Key Explanations of the GNN Results
- 1.
Amplification of Vulnerability in Connected Clusters
The SRS reveals that systemic interconnections significantly alter the risk profile of countries within the same cluster. In the Asia cluster (Bangladesh, Pakistan, Vietnam), all three countries have negative CVS (below-average individual vulnerability). Because their neighbors are also relatively low risk, the network effect pulls their SRS even lower (more negative). For example, Bangladesh’s CVS ranges from −0.41 to −0.30, but its SRS ranges from −0.82 to −0.66—a substantial downward adjustment.
Conversely, in the Africa cluster, both Kenya and Morocco have positive CVS (above-average vulnerability). Their mutual connection amplifies each other’s systemic risk. Kenya’s SRS (0.50–0.65) is roughly 0.3 points higher than its CVS (0.19–0.28), and Morocco’s SRS (0.73–0.88) is similarly elevated above its CVS (0.62–0.74). This amplification reflects the danger of regional contagion: if one country experiences a climate shock, the interconnected economy or shared resources (e.g., transboundary water) can transmit stress to its neighbor, raising systemic risk for both; the results can be observed in
Table 8.
- 2.
Colombia’s Isolation Maintains Individual Risk
As an isolated node, Colombia’s SRS is identical to its CVS. Its consistently low (negative) scores (−1.02 to −0.81) indicate low individual vulnerability. However, isolation also means it does not benefit from any buffering by resilient neighbors, nor does it suffer from contagion.
- 3.
Temporal Trends in Systemic Risk
All countries exhibit a gradual increase in SRS over the 25-year period, mirroring the upward trend in CVS. The steepest rises occur in Morocco (from 0.728 to 0.874) and Kenya (0.504 to 0.641), driven by worsening climate projections and persistent poverty. In the Asia cluster, Pakistan shows the most notable increase (from −1.081 to −0.891), reflecting its rising individual vulnerability (CVS increased by +0.15 over the period).
- 4.
Divergence Between Clusters
The gap between the Africa cluster (positive SRS) and the Asia cluster (negative SRS) widens over time. In 2000, the difference between Morocco’s SRS (0.728) and Vietnam’s SRS (−1.181) was 1.909; by 2024, the gap between Morocco (0.874) and Vietnam (−0.984) is 1.858—a slight narrowing, but still substantial. This persistent divergence underscores that systemic risk is not converging; instead, regions with already high vulnerability are experiencing faster increases, potentially leading to a “risk spiral” where interconnected countries reinforce each other’s stress.
4.6. Reinforcement Learning (RL) for Policy Prioritization
A Reinforcement Learning (RL) framework was developed to determine the optimal allocation of adaptation resources across the six countries over the period 2000–2024. The RL agent learns a policy that maximizes the long-term reduction in systemic vulnerability by choosing which intervention types to fund in each country, given their current state (CVS, ESS, SRS, and the key drivers identified by XGBoost). The environment is a Markov Decision Process (MDP) with the following components:
State Space (S): For each country–year, the state vector comprises the eight core indicators (annual mean temperature, urban population, agricultural land, poverty headcount, Gini index, projected temperature change, projected precipitation change, projected drought risk) plus the derived Compound Vulnerability Score (CVS) and Systemic Risk Score (SRS). The full state at time t is an 8 × 6 matrix representing all six countries.
Action Space (A): A discrete set of five policy intervention types, each represented as a binary decision per country per year, constrained by a total annual budget of 100 units:
Drought and Water Management;
Poverty Alleviation and Social Safety Nets;
Coastal Protection and Sea-Level Rise Adaptation;
Agricultural Resilience;
Institutional Capacity and Data Infrastructure.
Reward Function (R): The reward at each timestep incentivizes reduction in systemic risk while penalizing budget overruns:
where λ = 0.5 (inequality penalty weight) and β = 10 (budget violation penalty). The reward structure encourages the agent to both lower total systemic risk and prevent any single country from becoming a catastrophic failure point.
Environment Dynamics: Transition dynamics are modeled using historical trends (2000–2024) for time-varying indicators, with intervention effects simulated as percentage reductions in the relevant vulnerability drivers based on established adaptation effectiveness literature (
Hallegatte et al., 2016;
Rolnick et al., 2022).
Training Algorithm: A Deep Q-Network (DQN) with experience replay was implemented using the Stable-Baselines3 library. Hyperparameters were set as learning rate = 0.0003, buffer size = 50,000, batch size = 64, target network update frequency = 500 steps, γ (discount factor) = 0.99, and ε-greedy exploration decaying from 1.0 to 0.01 over 100,000 steps. Training was conducted over 500,000 timesteps with 100 random seeds to ensure convergence.
Convergence Diagnostics: Training performance was monitored using the following metrics:
Average episodic reward: Converged after 200,000 timesteps, stabilizing at approximately −12.5 ± 1.2
Loss function: Mean squared error between target and predicted Q-values decreased from 0.85 to 0.12
Policy stability: Action distributions stabilized after 250,000 timesteps with no significant drift thereafter.
Optimization Outcomes: The learned policy produces priority scores (0–100) for each intervention type per country, representing the fraction of the budget allocated to that intervention under the optimal policy. Results are presented in
Table 9 and discussed in
Section 6.2.
Validation: Policy performance was compared against three baseline allocation strategies: (1) uniform allocation across all interventions, (2) allocation proportional to current CVS, and (3) allocation proportional to SRS. The RL policy achieved a 23% lower total SRS after 25 years compared to the uniform baseline and a 12% reduction compared to the CVS-proportional baseline, demonstrating the value of dynamic, systemic optimization.
4.7. Synthesis: A Unified Vulnerability Assessment
The convergence across five distinct analytical methods supports a unified conclusion: Morocco and Kenya constitute the highest vulnerability tier, driven by compound drought and poverty risks with systemic amplification; Bangladesh, Pakistan, Vietnam, and Colombia form a lower vulnerability group, though with upward temporal trends that warrant monitoring; and poverty alleviation and water management emerge as the most impactful intervention categories. The integration of cross-method correlation, cluster validation, and policy alignment transforms the results from a collection of model outputs into a coherent, evidence-based vulnerability assessment.
5. Discussion
The comprehensive multi-model analysis conducted across six countries—Bangladesh, Colombia, Kenya, Morocco, Pakistan, and Vietnam—reveals a fundamentally heterogeneous landscape of climate vulnerability that defies simplistic categorization. The model validation matrix can be observed in
Table A5. Rather than conforming to a linear spectrum of risk, the countries separate into three distinct vulnerability regimes that remain stable throughout the 2000–2024 study period. Morocco and Kenya consistently occupy the high and medium-high vulnerability tiers respectively, while Bangladesh, Colombia, Pakistan, and Vietnam form a low-vulnerability cluster despite their internal socio-economic and geographic differences, as shown in
Table 4 and
Table 9. This persistent stratification, confirmed by both K-Means clustering and DBSCAN density-based analysis, suggests that vulnerability is not merely a function of incremental differences in indicators but reflects deeper structural and climatic realities that create natural groupings. The DBSCAN results are particularly illuminating, as the algorithm’s density-based approach identified Morocco and Kenya as genuine outliers in the vulnerability space, separated by clear gaps from the main cluster of four countries. This finding has profound implications for international climate finance and adaptation planning, suggesting that a one-size-fits-all approach would be inappropriate and that resources should be targeted according to these distinct vulnerability regimes rather than distributed uniformly.
The methodological pluralism embedded in this framework distinguishes it from conventional vulnerability assessments that typically rely on single-method approaches—either static index construction, standalone clustering, or predictive modeling in isolation. By contrast, the present study demonstrates that combining dimensionality reduction (PCA), density-based and clustering partition (K-Means, DBSCAN), interpretable Fuzzy Logic, graph-based systemic risk modeling, and Reinforcement Learning yields convergent insights that strengthen confidence in the findings while offering a transferable blueprint for data-driven adaptation planning in data-sparse contexts. This integrated architecture addresses the long-standing gap identified by
Odipo et al. (
2025) and
Birkmann (
2013) for frameworks that align with the specific dynamics of the systems being evaluated rather than applying generic global indices.
The XGBoost regression analysis provided unprecedented insight into the drivers of vulnerability, revealing that projected drought risk alone accounts for nearly one-third of the model’s predictive power, with projected precipitation changes and poverty headcount following as the second and third most influential factors. This hierarchy of importance challenges conventional narratives that often emphasize temperature increases as the primary climate concern. While projected temperature change by 2050 does contribute significantly (approximately 8% importance), it is dwarfed by the combined influence of drought and precipitation metrics (nearly 50% combined). This suggests that for these six countries, water-related climate hazards represent a more immediate and differentiating threat than warming alone. The dominance of poverty headcount (14% importance) and Gini index (10.5%) further underscores that vulnerability is fundamentally a socio-economic phenomenon as much as a climatic one—countries cannot adapt their way out of poverty, and inequality exacerbates every climate shock. The XGBoost model’s exceptional predictive performance (R2 of 0.98 on test data) validates that the selected 11 variables comprehensively capture the vulnerability construct, leaving little unexplained variance and providing confidence that no critical drivers have been omitted.
The Fuzzy Logic Environmental Stress Score transformed these quantitative relationships into an interpretable, rule-based metric that captures the non-linear interactions between hazards and vulnerabilities in ways that traditional linear models cannot. Morocco’s ESS approaching 100 by 2024 reflects the perfect storm of very high drought risk, declining precipitation, and moderate poverty that together trigger the most extreme fuzzy rule combinations. Kenya’s sustained ESS in the high 60 s to low 70 s demonstrates how high poverty amplifies even moderate climate hazards, while Bangladesh’s moderate scores (34–41) reveal that relatively low poverty can partially offset high exposure to sea-level rise and agricultural dependence. Perhaps most revealing is Pakistan’s case, where extreme drought risk combined with massive projected precipitation increases produces only low-to-moderate ESS values (12–23)—the fuzzy rules correctly capture that these opposing forces partially cancel each other in terms of net environmental stress, though this cancelation masks the enormous challenge of managing both drought and flood extremes simultaneously. Colombia’s near-zero ESS values, while partly attributable to data gaps, also reflect the genuine absence of extreme climate hazards in its vulnerability profile. The Fuzzy Logic approach thus provides a transparent, explainable alternative to black-box machine learning models, generating scores that policymakers can understand in terms of if–then rules rather than opaque mathematical transformations.
The Graph Neural Network introduced a critical dimension missing from conventional vulnerability assessments: the systemic interconnections between countries that can amplify or dampen individual risks. The SRS results demonstrate that membership in a vulnerable cluster carries a penalty—Kenya and Morocco, connected in the Africa cluster, see their individual vulnerabilities amplified by approximately 0.3 points each due to mutual reinforcement. This amplification effect is not merely additive but reflects the realistic dynamic whereby stress in one country (e.g., drought-induced crop failure in Morocco) can cascade to its neighbor through food price spikes, migration pressures, or shared water resources. Conversely, the Asia cluster of Bangladesh, Pakistan, and Vietnam experiences a damping effect, with each country’s SRS substantially lower than its individual CVS because they are surrounded by similarly resilient neighbors. This network effect creates a virtuous cycle where low vulnerability begets even lower systemic risk, potentially widening the gap between resilient and vulnerable regions over time. Colombia’s isolation in the network, whether realistic or an artifact of our simplified graph, results in no amplification or damping—its SRS equals its CVS, for better or worse. The temporal trends in SRS reveal that systemic risk is increasing fastest in the already vulnerable Africa cluster, suggesting that without intervention, the divergence between world regions may accelerate.
The Reinforcement Learning policy prioritization translates these complex analytical findings into concrete, actionable recommendations for resource allocation, representing perhaps the most practically valuable output of the entire modeling exercise. The RL agent, trained to minimize systemic risk over the long term, consistently selected drought and water management as the top priority for Morocco and Pakistan, coastal protection for Bangladesh, poverty alleviation for Kenya, agricultural resilience for Vietnam, and institutional capacity building for Colombia. These recommendations align with each country’s unique vulnerability profile as revealed by the earlier analyses: Morocco’s extreme drought risk demands water interventions; Kenya’s deep poverty requires social protection before technical solutions can be effective; Bangladesh’s coastal exposure necessitates immediate investment in sea defenses; Vietnam’s agricultural dependence calls for climate-smart agriculture; and Colombia’s data gaps must be filled before other interventions can be properly targeted. The RL results also reveal important second-order priorities—for instance, Pakistan’s need for agricultural resilience alongside water management reflects the dual challenge of managing both drought and flood extremes. The fact that the RL agent, with no knowledge of country names or geographic context, arrived at intuitively sensible priorities validates both the quality of the underlying data and the appropriateness of the Reinforcement Learning framework for this type of resource allocation problem.
Taken together, these five analytical approaches—dimensionality reduction, clustering, gradient boosting, fuzzy inference, Graph Neural Networks, and Reinforcement Learning—provide a methodologically pluralistic assessment of climate vulnerability that is greater than the sum of its parts. The CVS established a common metric; clustering revealed natural groupings; XGBoost identified drivers; Fuzzy Logic added interpretability; GNN captured interdependencies; and RL translated everything into policy action. The convergence of these diverse methods on a consistent narrative—Morocco and Kenya as urgent priorities, drought and poverty as dominant drivers, systemic interconnections as risk multipliers—provides robust evidence that transcends the limitations of any single analytical technique. For Bangladesh, Pakistan, and Vietnam, the message is one of cautious optimism: their current low vulnerability should not breed complacency, as all three show upward trends that could eventually move them into higher-risk categories if left unaddressed. For Colombia, the priority must be building the institutional and data infrastructure to properly assess and monitor its vulnerability. For Kenya and especially Morocco, the window for effective adaptation is narrow and closing; the time for decisive, well-funded action is now, before systemic amplification locks them into a spiral of increasing vulnerability that becomes self-reinforcing and increasingly difficult to escape.
6. Conclusions Policy Implications and Limitation
6.1. Conclusions
Climate vulnerability emerges from the intersection of physical hazards and socio-economic fragility, rather than existing as a singular, uniform condition. Pakistan and Kenya exemplify a self-reinforcing dynamic where poverty amplifies exposure to climate shocks while environmental stress deepens economic hardship, creating compound vulnerabilities that elevate these nations as critical intervention points. Targeting resources toward such highly sensitized systems generates disproportionate returns in regional stability and human welfare. The analytical framework developed here offers a replicable methodology for transforming conventional risk assessment into actionable strategy, providing decision-makers with a dynamic evidence base for allocating adaptation resources amid growing global uncertainty.
6.2. Policy Implications
- 1.
Bangladesh—Coastal Protection Dominates
Bangladesh faces the highest projected sea-level rise (0.25 m by 2050) and has extensive low-lying coastal areas. The RL model identifies coastal protection as the most impactful intervention (score 40) because reducing exposure to storm surges and salinity intrusion yields the largest systemic risk reduction. Drought and water management also receive a moderate score (25), reflecting the country’s vulnerability to monsoon variability and the need for flood control. Poverty alleviation and agricultural resilience have lower scores because Bangladesh has already made significant progress in poverty reduction (poverty headcount fell from 66% in 2000 to 20.5% in 2020), so the marginal benefit of additional spending is smaller. Institutional capacity is low priority (5) due to existing robust data systems.
- 2.
Colombia—Institutional Capacity First
Colombia’s low individual vulnerability (CVS) and isolated position in the network mean that the biggest bottleneck is the lack of reliable socio-economic data (urban population, agricultural land, poverty measures were missing in the original dataset). The RL agent assigns institutional capacity with the highest score (50), as improving data collection and monitoring would enable more targeted future interventions and correct potential underestimation of true vulnerability. Poverty alleviation (20) and agricultural resilience (15) are moderate priorities, while coastal protection (5) is low because Colombia’s coastline is less exposed relative to others. Drought risk is medium, so water management receives a modest 10.
- 3.
Kenya—Poverty Alleviation Urgent
Kenya’s high poverty headcount (≈67% in 2021) and very high drought risk make poverty alleviation the top priority (score 40). The RL model recognizes that without lifting people out of poverty, even well-designed drought programs will have limited effectiveness. Drought and water management (35) is a close second, essential for mitigating the impacts of recurrent droughts. Agricultural resilience (15) is also important because most livelihoods depend on rain-fed agriculture. Coastal protection is irrelevant (5) given Kenya’s limited coastline exposure relative to its other hazards. Institutional capacity is low (5) because the data are relatively complete.
- 4.
Morocco—Drought and Water Management Critical
Morocco has the highest systemic risk and faces a projected 14% decrease in precipitation. The RL agent overwhelmingly prioritizes drought and water management (score 50), reflecting the urgent need for water conservation, desalination, and efficient irrigation. Poverty alleviation (25) remains important, as poverty (≈11% in 2013) is still a concern, but the climate driver is so dominant that water investments yield the greatest risk reduction. Agricultural resilience (15) supports adaptation in the rural sector. Coastal protection is low (5) because Morocco’s Atlantic and Mediterranean coasts are less vulnerable than Bangladesh’s. Institutional capacity is also low (5) given adequate existing data.
- 5.
Pakistan—Water Management and Agricultural Resilience
Pakistan’s extreme drought risk combined with a projected 25–65% increase in precipitation creates a complex hazard profile: droughts and floods are both likely. The RL model allocates the highest priority to drought and water management (score 40) to address the drought side and improve water storage for both dry and flood periods. Agricultural resilience (25) is the second priority because the agricultural sector employs a large share of the population and is highly sensitive to both extremes. Poverty alleviation (25) remains crucial (poverty headcount 44.7% in 2018). Coastal protection is negligible (5) as the coastline is relatively short. Institutional capacity (5) is adequate.
- 6.
Vietnam—Agricultural Resilience and Coastal Protection
Vietnam’s low poverty and moderate climate hazards suggest a balanced approach. Agricultural resilience (score 35) is the top priority because the Mekong Delta is a major food-producing region vulnerable to salinity intrusion and changing rainfall patterns. Coastal protection (30) is nearly as important due to extensive low-lying coasts and sea-level rise. Drought and water management (15) supports irrigation in the Central Highlands. Poverty alleviation (10) is low because poverty is already very low (4.2% in 2022). Institutional capacity (10) could be improved for better climate services.
General Insights from the RL Policy
Drought and water management is the most frequently top-ranked intervention (Morocco, Pakistan) and appears high in Kenya and Bangladesh, reflecting the pervasive threat of water scarcity across all but Colombia.
Poverty alleviation is essential in countries where poverty remains high (Kenya, Pakistan) and complements climate-specific actions.
Coastal protection is concentrated in Bangladesh and Vietnam, the two countries with extensive deltas and high exposure to sea-level rise.
Institutional capacity emerges as a priority only for Colombia, highlighting that data gaps can obscure true vulnerability and that filling them is a prerequisite for effective adaptation.
Agricultural resilience is a cross-cutting priority, especially in Vietnam and Pakistan, where agriculture is both an economic mainstay and highly climate-sensitive.
The RL prioritization thus provides a quantitative, model-driven basis for allocating limited adaptation resources across countries and sectors. It integrates the complex interdependencies captured by the GNN and the feature importance from XGBoost, ensuring that the chosen actions target the most effective levers for reducing systemic climate risk.
The prioritization outputs from the RL agent are designed to inform adaptation finance allocation decisions by multilateral climate funds, development banks, and national treasuries. While the present study does not develop novel financial instruments such as catastrophe bonds or risk hedging mechanisms, the framework provides the empirical foundation for such tools by quantifying where and under what conditions adaptation investments generate maximum systemic risk reduction. Future research may extend this work by embedding the prioritization outputs into specific financial contracting mechanisms.
6.3. Limitations of the Analytical Approach
A systematic review of AI applications in climate policy reveals three predominant but disconnected streams: (1) clustering studies that identify vulnerability typologies but stop short of policy prescription; (2) predictive models (e.g., XGBoost, Random Forest) that quantify driver importance without addressing intervention allocation; and (3) optimization frameworks that assume knowledge of vulnerability structures rather than deriving them empirically. The present study bridges these gaps by embedding unsupervised learning, predictive modeling, and Reinforcement Learning within a single unified architecture, enabling the transition from vulnerability diagnosis to policy prescription within a coherent analytical workflow.
This study has several important limitations that warrant consideration when interpreting the findings. The small-N design encompassing only six countries, while sufficient for illustrating distinct vulnerability profiles, fundamentally restricts the statistical generalizability of results beyond this specific sample and precludes broader regional or global inferences. The analysis necessarily relies on secondary data sources with inherent temporal inconsistencies—notably the substantial missing observations for Colombia’s socio-economic indicators and the varying survey years for poverty and inequality metrics across countries—which may introduce unmeasured bias despite interpolation techniques. A further limitation concerns the imputation of missing socio-economic data for Colombia using global mean values. While necessary to maintain sample continuity, this method may bias Colombia’s vulnerability estimates downward and introduces uncertainty into its cluster assignment and policy recommendations. Future research should prioritize primary data collection for Colombia to validate or revise the findings presented here. Future climate projections incorporated into the vulnerability framework carry irreducible uncertainties stemming from emission scenarios, climate model sensitivity, and downscaling methodologies, meaning the quantitative estimates (e.g., −14% precipitation change for Morocco) represent plausible ranges rather than precise forecasts. The machine learning approaches employed, including PCA dimensionality reduction and cluster analysis, involve subjective decisions about feature weighting, number of clusters, and density parameters that influence results, though sensitivity analyses were conducted to assess robustness. The static treatment of projected variables as constants per country obscures potentially important temporal dynamics in how climate hazards may evolve non-linearly over coming decades. Additionally, the vulnerability index, while comprehensive across eight indicators, cannot capture all context-specific factors such as institutional capacity, governance quality, or community-level adaptive practices that fundamentally shape on-the-ground resilience (
Lubinga & Mazenda, 2024). A key limitation is the modest sample size of 150 country–year observations (120 training, 30 test), which constrains the complexity of machine learning models that can be reliably estimated. While cross-validation and hyperparameter tuning mitigate overfitting, the high R
2 values should be interpreted with appropriate caution. Consequently, the policy-relevant findings should be interpreted as analytically grounded hypotheses generated through systematic data integration rather than definitive prescriptions, serving primarily to demonstrate the potential of composite vulnerability frameworks for informing strategic adaptation planning across diverse national contexts. Static treatment of climate projection variables, which may oversimplify temporal climate dynamics, and the reliance on categorical encoding for precipitation change, which assumes linear relationships that may not fully capture non-linear climate impacts.
6.4. Key Contributions
A novel multi-model clustering, fuzzy score, GNN and RL integrated AI framework for dynamic climate risk assessment. A proof of concept for policy-driven optimization, using RL to derive policy-driven actionable, equitable adaptation investment priorities based on systemic risk reduction.