Article

Indigenous Entrepreneurship and Income Gaps: Evidence from Mexico 2024

by
Roberto Iván Fuentes-Contreras
*,
Jocelyne Rabelo-Ramírez
and
Moises Librado-González
School of Economics and International Relations, Autonomous University of Baja California, Tijuana 22390, Mexico
*
Author to whom correspondence should be addressed.
Economies 2026, 14(1), 3; https://doi.org/10.3390/economies14010003
Submission received: 17 November 2025 / Revised: 8 December 2025 / Accepted: 13 December 2025 / Published: 23 December 2025
(This article belongs to the Section Labour and Education)

Abstract

Communities that have been structurally and historically marginalized continue to face barriers rooted in practices of exclusion and segregation. These structural constraints often persist within the entrepreneurial sphere, limiting opportunities for Indigenous entrepreneurs to establish and consolidate their businesses. This study examines the sales gap between Indigenous entrepreneurs (IEs) and non-Indigenous entrepreneurs (NIEs) in Mexico. The analysis employs a dual methodological approach based on Oaxaca–Blinder (OB) mean decompositions and recentered influence function (RIF) regressions applied across income deciles. Findings reveal a persistent and significant sales disparity: on average, Indigenous entrepreneurs sell 42.5% less than their non-Indigenous counterparts. Approximately 18% of this difference is explained by observable characteristics such as education and experience, 20.8% by differences in returns to these characteristics, and 5.8% by interaction effects. By distinguishing between gaps driven by endowment differentials and those arising from differential returns, the study highlights the potential role of structural or discriminatory mechanisms underpinning Indigenous disadvantage in the Mexican entrepreneurial ecosystem.

1. Introduction

Inequality has been a persistent feature of Mexico’s economic and social history. Several studies emphasize that the country, like much of Latin America, is characterized by a high concentration of income and limited opportunities for historically marginalized groups, particularly Indigenous peoples (Luz-Tovar & Samario-Zarate, 2023). In the labor market, these disparities are reflected in wage differentials, occupational segmentation, limited social protection, and barriers to accessing formal employment. However, inequality also manifests in a less explored sphere: entrepreneurship.
Entrepreneurship is recognized for its multifaceted impact on labor markets, as it generates employment, fosters innovation, and contributes to economic growth and poverty reduction (Van Praag & Versloot, 2007; Majeed et al., 2024). Nonetheless, the structural inequalities and opportunity constraints that affect vulnerable groups in the labor market are also reproduced within the entrepreneurial domain. While entrepreneurship may serve as a pathway to empowerment, these groups often face additional barriers, such as low literacy, limited access to productive resources, weak social networks, and the absence of a financial safety net—which render their ventures structurally fragile and less capable of achieving sustained growth (Morris, 2020; Morris & Tucker, 2021).
These limitations are particularly acute among Mexico’s Indigenous population, who continue to face obstacles rooted in historical, structural, and everyday discrimination (Cobo, 1986; Vaswani et al., 2023). The marginalization of Indigenous knowledge systems and practices perpetuates exclusion and undermines the legitimacy of business models grounded in culture and territory (Ogunlela et al., 2022; Bastien et al., 2022). Qualitative research has demonstrated that aspects like embeddedness; identity; comunalidad, understood as a form of community life; and Indigenous worldview positively shape entrepreneurial projects and strengthen entrepreneurs’ ties to the community (Molina-Ramírez & Barba-Sánchez, 2021).
If entrepreneurship mirrors the social and economic structures of the broader society, then Indigenous peoples, who have historically faced systemic exclusion and limited access to productive assets, are likely to experience these inequalities within their entrepreneurial activities as well. Rather than serving as a neutral arena of opportunity, entrepreneurship may replicate or even deepen existing asymmetries, as Indigenous entrepreneurs confront overlapping barriers. This perspective suggests that market dynamics alone are insufficient to level the playing field and that structural factors are decisive in shaping entrepreneurial outcomes. This raises the following research question: To what extent do differences in endowments and in returns contribute to explaining the structural sales disadvantage faced by Indigenous entrepreneurs in the Mexican business system, and how does the sales gap between Indigenous and non-Indigenous entrepreneurs vary across the income distribution?
This paper argues that in Mexico, enterprises led by individuals who self-identify as Indigenous exhibit, on average, lower sales performance than those led by non-Indigenous entrepreneurs. This gap reflects both differences in endowments and differential returns, suggesting the possible presence of discriminatory mechanisms. To examine this hypothesis, the study applies a dual methodological strategy: the Oaxaca–Blinder (OB) decomposition to quantify the average gap in the logarithm of quarterly sales and recentered influence function (RIF) regressions to analyze determinants along the distribution, using microdata from the 2024 ENIGH survey.
The study contributes to the academic debate in three main ways. First, it systematically documents income disparities between Indigenous and non-Indigenous entrepreneurs, an area that remains underexplored in the literature. Second, it demonstrates the complementarity between OB and RIF techniques, showing that these approaches allow for an analysis not only of the gap in means but also its distributional heterogeneity. Third, it offers public policy implications, emphasizing the need for differentiated interventions across income segments: targeted programs for lower levels to address Indigenous exclusion, cross-cutting gender equality policies, and production scaling strategies to enhance performance among higher-income entrepreneurs.

2. Literature Review

2.1. Conceptualization Indigenous Peoples

Through instruments such as ILO Convention No. 169 and the United Nations Declaration on the Rights of Indigenous Peoples, international law provides a normative framework for identifying Indigenous peoples based on two key criteria: (a) direct descent from the original inhabitants of a given territory, and (b) the persistence of distinct social, cultural, economic, and political institutions, even if these have undergone historical transformations.
However, this conceptual framework poses practical challenges. Identifying the “original inhabitants” of a territory is complex, as processes of conquest, displacement, and mestizaje have reshaped cultural and geographic boundaries (Stavenhagen, 1992). Determining the extent to which an institution may evolve without losing its Indigenous character remains an open debate.
Bonfil Batalla (1977) distinguishes between “Indigenous” people and “ethnic group”: the former is linked to the historical process of colonization and may encompass multiple ethnicities, while the latter refers to historically rooted units with distinct communicative and relational codes. This distinction becomes increasingly blurred in contemporary urban contexts, where notions such as “urban Indigeneity” (Dorries, 2023) and cultural autochthony and resilience reinforce the connection to ancestral lands and cultural heritage.
Operationally, definitions based on a single criterion, such as language or region, are insufficient. Mexican censuses have adopted self-identification, in line with social identity theory, which recognizes that individuals categorize themselves as members of a group (Trepte & Loy, 2017). This approach incorporates the subjective dimension of belonging and captures the dynamic nature of Indigenous identity amid socioeconomic and historical change (Rodríguez-Cáceres & Behrman, 2024).
Nevertheless, self-identification is subject to variation. Factors such as education, social mobility, age, and migration influence the likelihood of self-identifying as Indigenous (Moreno & Benavides, 2018), leading to potential underreporting in censuses and surveys. Moreno Morales (2019) warns that methodological shifts in census instruments may affect estimates, while Villarreal (2014) emphasizes that in Latin America, and particularly in Mexico, the distinction between Indigenous and non-Indigenous populations depends less on phenotypic traits such as skin color and more on language, cultural practices, and a subjective sense of belonging.

2.2. Entrepreneurship: Classical and Contemporary Perspectives

Since the foundational work of Schumpeter and Swedberg (2021), entrepreneurship has been understood as a driver of innovation and economic transformation through the process of “creative destruction.” Baumol (1996) distinguishes three types of entrepreneurship according to their effects on social welfare: productive, which generates added value, innovation, and formal employment; unproductive, which redistributes wealth through rent-seeking, lobbying, or institutional privileges; and destructive, which undermines productive systems. It is argued that entrepreneurship serves as a tool for identifying business opportunities and, in times of economic instability or crisis, as a refuge from unemployment or to supplement household income (Fairlie & Fossen, 2017; Reynolds, 1992). These multiple conceptualizations of entrepreneurship have implications for what is considered success, at both the individual and collective levels.
More recently, social and community entrepreneurship have emerged as strategies to address structural problems, such as poverty and inequality, in contexts where the State and market fail to provide inclusive solutions (Santos, 2010; Bansal et al., 2019). The literature highlights the role of community as an agent of change, social capital as a strategic resource, and innovation as a distinctive driver (Lumpkin et al., 2018; Kwon et al., 2013; Bacq et al., 2022; Warnecke & Balzac-Arroyo, 2022).
However, conceptual fragmentation and the absence of unified frameworks limit comparability across studies (García-Jurado et al., 2021; Cardella et al., 2021; Teasdale et al., 2022). Despite the existence of robust case studies and systematic reviews, the literature acknowledges the need for longitudinal and comparative research to evaluate long-term impacts and scalability (García-Jurado et al., 2021). Measuring social impact and incorporating sustainability and equity criteria remain pending challenges (Bansal et al., 2019).
Entrepreneurship in Mexico exhibits a dual nature: it can serve as a channel for social mobility and job creation, yet it often functions as a subsistence strategy in informal markets characterized by low productivity (Saavedra Leyva et al., 2023). According to INEGI (2022), more than 20% of the employed population is self-employed, frequently under precarious conditions and without social protection.
The literature on entrepreneurial inequality underscores the relevance of individual factors like education, experience, gender, and ethnicity, together with business characteristics such as sector, size, and formality, in explaining performance. Fairlie and Robb (2008) find that minority-owned firms in the United States experience higher failure rates and lower revenues. In Latin America, Kantis et al. (2020) show that women entrepreneurs are often concentrated in lower-scale, less profitable activities.
Indigenous entrepreneurship is characterized by the integration of economic objectives with social, environmental, and cultural goals, prioritizing collective well-being and the preservation of traditional knowledge (Peredo et al., 2004; Vázquez-Maguirre, 2020; Colbourne, 2021). These initiatives are grounded in strong community ties and participatory governance practices (Vivaldini & Correa, 2025).
Despite persistent barriers such as discrimination, informality, and gaps in public policy (Agu & Margaça, 2025; Foley & O’Connor, 2013; Almehrzi et al., 2024), Indigenous enterprises have made notable contributions. They employ Indigenous workers at rates up to twelve times higher than non-Indigenous firms (Eva et al., 2024; Hunter, 2015), adopt culturally adapted management practices that enhance workplace environments (Eva et al., 2023), and in certain contexts, display superior environmental and market performance (Setyawati et al., 2020; Tawiah et al., 2023).
For Indigenous peoples, studies highlight limited access to credit, commercial networks, and broader markets. All of these obstacles constrain growth (Knight, 2016) and underline the need to understand how ethnic and gender inequalities interact in entrepreneurship (Ratten & Dana, 2017).
Evidence regarding firm performance remains heterogeneous. In Indonesia, no significant differences were found between Indigenous and non-Indigenous micro, small, and medium-sized enterprises (Hamzani & Achmad, 2016), whereas in Poland, Indigenous-owned firms in the food sector achieved higher returns on assets than state-owned or foreign companies (Szymanski et al., 2007). These variations confirm the decisive role of institutional and sectoral contexts, underscoring the need for comparative studies that examine the interaction between Indigenous entrepreneurial culture, economic environment, and public policy. In Mexico, studies have identified a gap disadvantaging Indigenous entrepreneurs, which becomes even wider when intersected with gender (Fuentes et al., 2025).
Mahato and Jha (2023) find that financial inclusion among women entrepreneurs in India has a positive impact on their well-being. This impact is positively associated with women’s entrepreneurial activity, suggesting that this group of women entrepreneurs experiences even greater benefits. Moreover, promoting digital financial inclusion can increase women’s entrepreneurial engagement (Yang et al., 2022). Fostering financial education, potentially generating a virtuous cycle between their entrepreneurial intention, business skills, and financial literacy.
For the Mexican context, the evidence shows that these actions cannot be carried out in a fragmented manner. Financial literacy and entrepreneurial orientation are relevant for improving women’s economic conditions, but it is essential that they be accompanied by complementary strategies. Financial literacy and entrepreneurial orientation play important roles in enhancing financial well-being; however, initiatives focused solely on financial knowledge and that overlook attitudinal components may counteract their positive effects (Cuecuecha Mendoza et al., 2022). Likewise, guiding entrepreneurial activities toward cultural tourism and inclusive land-management programs has proven successful in empowering women and broader communities (Durán-Díaz et al., 2020).
Given that the lack of non-cash payment options, which can be associated with limited access to financial services, disproportionately affects individuals in the lower income deciles, strategies that reduce the costs associated with financial transactions may increase their participation in the financial system, improve their money-management decisions, and strengthen their ability to better withstand financial shocks, especially among women (Prina, 2015).
In Mexico several public policy actions have been implemented to encourage financial inclusion, such as delivering social programs through electronic transfers instead of cash payments (Masino & Niño-Zarazúa, 2020). Empirical evidence shows that access to banking services reduces poverty, informality, and inequality, and promotes human development and its components, health, standard of living, and education (del Carmen Briano-Turrent, 2025).

2.3. Discrimination and Inequality of Opportunities and Outcomes

From an economic perspective, discrimination can be linked to individual preferences within a market. Becker (2010) argues that some market participants experience a decrease in utility when they must hire, work with, or interact with certain groups; this mechanism is known as taste-based discrimination. On the other hand, Arrow (1973) proposes that statistical discrimination arises from incomplete information among economic agents, which prevents them from accurately assessing individual characteristics. As a result, agents rely on group-based stereotypes to approximate expected traits. In both cases, discrimination stems from individual-level decision-making.
Alternatively, discrimination may be structural. In this view, institutions reproduce historical hierarchies linked to race (Wilson, 2011), social class (Rivera & Tilcsik, 2016), or gender (Blau, 1984). Crenshaw (2013) argues that these disadvantages can also be intersectional. When a group is “crossed” by multiple characteristics that have historically been grounds for discrimination, disadvantages accumulate, and the barriers they face become significantly greater.
Under these conditions, it is expected that groups that have been historically discriminated against, such as Indigenous peoples, will exhibit lower performance or returns in their labor or entrepreneurial activities compared to other groups. This outcome is not necessarily attributable to individual or group characteristics but rather to the challenges imposed by institutionalized discrimination that disproportionately affects these populations.
Several studies in Mexico highlight the income and poverty gaps between Indigenous and non-Indigenous people, emphasizing both differences in endowments and mechanisms of discrimination. Garcia Moreno and Patrinos (2011) show that one-quarter of the poverty gap can be explained by discrimination, while the remaining portion is associated with characteristics such as education, age, and occupation. Complementarily, Castañeda-Navarrete (2013) identifies that lower educational endowments and returns, limited access to infrastructure and credit, vulnerability to natural disasters, and labor market constraints linked to discrimination account for the disadvantaged conditions faced by Indigenous people. Likewise, Canedo (2019) finds that, even with improvements in human capital and access to formal employment, the continued participation of Indigenous individuals in informal markets sustains the wage gap. Arceo-Gomez and Torres (2021) attribute the Indigenous people wage disadvantage to lower educational attainment, poorer wage conditions across states, and their concentration in lower-paid activities. Arceo-Gomez and Campos-Vazquez (2014) document discrimination based on Indigenous appearance in hiring processes. Finally, Delaunay (2005) reports that between 1990 and 2000 there was no reduction in economic discrimination against Indigenous peoples, which contributed to migration processes.
Empirical evidence consistently shows that Indigenous identity operates as a penalizing factor within the Mexican labor market. Cano-Urbina and Mason (2016) and Aguilar-Rodriguez et al. (2018) demonstrate that even among monolingual Spanish-speaking and highly acculturated Indigenous individuals, a negative wage gap persists relative to mestizos. This penalty widens when Indigenous workers also speak an Indigenous language, regardless of their Spanish proficiency. These findings suggest that ethnic biases operate beyond observable human capital characteristics, reflecting deep-rooted structural inequalities that constrain income accumulation and social mobility.
The study of inequality, which in recent years has gained renewed attention due to the rise in disparities among individuals across regions, not only involves reflection on its conceptualization and measurement but also distinguishes between inequality of opportunities, such as access to education and health, and inequality of outcomes, reflected in income or wealth. In this sense, as Roemer and Trannoy (2016) argue, individuals with the same “opportunities” are responsible for the outcomes they achieve. The problem arises when, from the outset, individuals face unequal access to what Sen (1996) refers to as “capabilities,” which conditions their individual development and contributes to the reproduction of inequalities in outcomes.
The differences observed between historically marginalized groups, such as Indigenous peoples or women, highlight the persistence of an inequality of opportunities that is reflected in an inequitable distribution of income and wealth, that is, an inequality of outcomes that reproduces original structural disadvantages, a problem present in Mexico and other Latin American countries (Paes de Barros et al., 2009).
This distinction between initial conditions and outcomes achieved is particularly relevant for the analysis of entrepreneurship, as it suggests that the income conditions of entrepreneurs, especially those operating micro and small enterprises, are not homogeneous and are determined by structural barriers that limit the possibilities for growth and business consolidation, such as access to capital, business training, and networks, together with institutional barriers and other elements that shape entrepreneurial trajectories.

2.4. Hypotheses

H1. 
The sales gap observed among Indigenous entrepreneurs is attributable to differences in both endowments and returns, reflecting discriminatory mechanisms. These gaps are deeper at the lower end of the sales distribution and decrease at upper levels, but they do not disappear, indicating persistent structural inequalities.

3. Methodology

3.1. Model Specification

The OB decomposition has been widely used to analyze wage gaps by gender and ethnicity (R. Oaxaca, 1973). This methodology has been applied to estimate inequalities in labor markets (Chen & Hu, 2021), access to healthcare (Rahimi & Nazari, 2021), financial inclusion (Quispe-Mamani et al., 2025), and ethnic wage gaps (Atal et al., 2010). The model specification is as follows:
Let g A , B denote the group (e.g., A = non-Indigenous, B = Indigenous). The outcome variable Y (log income) is modeled using separate linear regressions for each group:
Y i = X i β g + ε i ,           E ε i | X i , g = 0
where X i represents observable characteristics. Let X ¯ g denote the vector of average characteristics for group g.
Δ = E Y   |   g = A E Y   |   g = B =   X ¯ A β A   X ¯ B β B
Let β * denote the non-discriminatory income structure. The threefold decomposition partitions the total gap Δ into endowments, coefficients, and an interaction component:
Δ = X ¯ A X ¯ B β * Endowments   ( E ) +   X ¯ A   β A β * + X ¯ B β * β B Coefficients   ( C )   + X ¯ A X ¯ B β A β * Interaction   ( I )
The endowments effect (E) represents the portion of the gap explained by differences in observable characteristics between groups, evaluated at the reference coefficient structure β * . The coefficients effect (C) captures differences in the returns to those characteristics, reflecting how similar attributes are rewarded differently across groups while holding X constant. Finally, the interaction term (I) measures the residual component that arises from simultaneous variation in both characteristics and coefficients, indicating how disparities in endowments and returns jointly contribute to the observed outcome gap.
This model has several limitations. First, it relies on a linear mean regression framework, which restricts the analysis to average effects and overlooks variations across the income distribution. Second, the results are sensitive to the choice of the reference group, that is, whether the coefficients of the advantaged or disadvantaged group are used as the non-discriminatory benchmark, leading to what is known as the index number problem (R. L. Oaxaca & Ransom, 1994). Third, the unexplained component, often interpreted as discrimination, may also capture unobserved heterogeneity such as differences in skills, preferences, or unmeasured productivity factors, which can bias interpretation. Finally, recent research (Słoczyński & Wooldridge, 2018) indicates that regression-based decompositions can disproportionately reflect the experience of either group depending on their numerical representation, complicating normative conclusions about inequality or discrimination.
To overcome these limitations, in addition to the OB decomposition, this study estimates recentered influence function (RIF) regressions to capture distributional heterogeneity in the income gap between groups. While the OB approach provides a mean-based decomposition of differences in expected outcomes, it does not account for variations across the income distribution. The RIF regression method, developed by Firpo et al. (2009), extends the decomposition framework by allowing estimation of the unconditional marginal effects of covariates on different quantiles of the income distribution. This approach makes it possible to assess whether the magnitude and structure of the income gap differ across lower, middle, and upper segments of the distribution, thereby offering a more nuanced understanding of inequality patterns than the mean-based OB model alone.
Formally, the RIF regression is based on the recentered influence function of a distributional statistic, such as a quantile or the mean. For a random variable Y and a statistic υ =   υ F Y , the RIF is defined as
R I F Y ; υ = υ + I F Y ; υ
where I F Y ; υ denotes the influence function, representing the contribution of each observation to the statistic υ . In the case of quantiles, the influence function for the τ-th quantile q τ is expressed as
IF Y ; q τ = τ 1 Y q τ f Y q τ
with f Y q τ being the density of Y   at   q τ . Substituting this into the first equation yields
RIF Y ; q τ = q τ + τ 1 Y q τ f Y q τ
The RIF of each observation thus serves as a transformed dependent variable, which can be modeled through a standard linear regression of the form
R I F Y i ; q τ = X ¯ i β τ + ϵ i
where X ¯ i represents the vector of observable characteristics of individual i ,   β τ is the vector of parameters associated with quantile τ , and ε i is the error term.
The conditional density at each unconditional quantile is estimated using the kernel density estimator provided in R. All reported standard errors are obtained from a non-parametric bootstrap with 1000 replications. In each replication we resample observations with replacement, recompute the RIFs for all quantiles, and re-estimate the RIF regressions.

3.2. Variables and Operationalization

The empirical strategy integrates a set of variables that reflect both the individual attributes of entrepreneurs and the structural conditions under which their businesses operate. These variables were selected according to their theoretical relevance in explaining income disparities and the persistence of inequality across entrepreneurial groups. Table 1 summarizes the operational definition, measurement scale, and descriptive statistics of each variable.
In the context of this study, entrepreneurs are defined as independent workers, encompassing both self-employed individuals and employers. This definition follows the classification used in the ENIGH survey, where independent workers are those who run their own economic activity, either on their own account or with hired labor. Employees, unpaid family workers, and other occupational categories were excluded from this group to ensure conceptual consistency in the analysis of entrepreneurial income.
The initial unified dataset comprised 23,109 observations, only individuals classified as independent workers. After excluding 89 records reporting zero sales, the final analytic sample consisted of 23,020 valid observations, which were used in all econometric estimations conducted in this study. To ensure transparency and reproducibility, the full data-merging and filtering script is provided. The microdata are publicly available through INEGI’s microdata repository.
The dependent variable is the natural logarithm of quarterly sales, used as a proxy for entrepreneurial performance. The logarithmic transformation reduces the influence of extreme values and allows the estimated coefficients to be interpreted as approximate percentage variations, facilitating a comparative assessment between Indigenous and non-Indigenous entrepreneurs.
Four of the explanatory variables capture the individual endowments of entrepreneurs: sex, education, socioeconomic status, and experience. These dimensions summarize both the accumulation of human capital and the position individuals occupy within the social hierarchy. Education is represented by completed schooling levels on a standardized scale, while socioeconomic status reflects the relative standing of the household in the national distribution of material well-being. Experience is measured as potential labor experience, defined as age minus years of schooling minus six, and its squared term allows for non-linear effects, recognizing that the productivity gains associated with experience may diminish over time.
A second group of variables captures structural and behavioral features of entrepreneurial activity. Type of entrepreneurship distinguishes between employers and self-employed workers, marking differences in business scale, access to resources, and exposure to market risks. Payment beyond cash indicates whether the entrepreneur accepts electronic or alternative payment methods, a factor increasingly associated with formalization, competitiveness, and financial inclusion. The variable main job identifies whether the business constitutes the individual’s principal occupation, signaling the degree of dependency and commitment to entrepreneurial income. Finally, industrial activity denotes whether the establishment operates within the manufacturing sector, typically linked to higher productivity levels and capital intensity relative to commerce or services.
The operational form of the model is specified as follows for the OB decomposition. Let y g i denote the logarithm of quarterly sales for entrepreneur i where g   ϵ   N I E A , I E B . The estimated equation is
log S a l e s g i = β g + β 1 g S e x g i + β 2 g E d u c a t i o n g i + β 3 g S o c i o e c o n o m i c S t a t u s g i   + β 4 g E x p e r i e n c e g i + β 5 g E x p e r i e n c e g i 2 + β 6 g T y p e O f E n t r e p r e n e u r s h i p g i + β 7 g P a y m e n t B e y o n d C a s h g i + β 8 g M a i n J o b g i + β 9 g I n d u s t r y g i + ε g i
To strengthen the validity of our findings in terms of sensitivity and population representativeness, we conducted a comprehensive robustness assessment using weighted OLS estimations employing official ENIGH expansion factors as analytical survey weights, along with clustered standard errors at the primary sampling unit level
We estimated additional OB models that incorporated key control variables, including: (i) locality size, to explicitly characterize the market environment; (ii) hours worked, to control for individual labor input; and (iii) a disaggregation of economic activity into services, commerce, and industrial sectors
Furthermore, we re-estimated the OB baseline model on a second specification based on a propensity-score matched sample designed to balance the likelihood of adopting non-cash payment methods across groups, in this model, the component associated with the coefficient part reduces to values close to zero. Finally, to validate the specificity of our policy inference, we estimated a placebo OB decomposition for a highly comparable entrepreneur subgroup expected to experience similar market conditions regardless of ethnic identity.
Overall, results show that the estimated relationship between covariates and the sales level, particularly the effect associated with ethnicity, maintains the same structural interpretation and model dynamics identified in the main estimations.
For the RIF, each quantile τ 0.1 , 0.2 , 0.3 , 0.4 , 0.5 , 0.6 , 0.7 , 0.8 , 0.9 is estimated using a pooled model:
R I F   Y i ; q τ =   α τ + δ τ I n d i g e n o u s +   γ i X i + ε i τ
As a robustness check, we also estimated the unconditional quantile regressions using net profits. The patterns of the RIF coefficients are similar across both specifications
The estimation of both models and the visualizations were carried out in Statistical analyses were performed in R (version 4.3.1, build 2023.06.1+524; R Core Team, 2023), using the following packages: oaxaca, rifreg, car, nortest, lmtest, sandwich, svyglm, MatchIt and ggplot2.
Consequently, the analysis was limited to units with positive revenues, ensuring the economic interpretability of the natural logarithm transformation. The Lilliefors test (p < 2.2 × 10⁻¹⁶) indicated non-normal residuals, which is expected given the typical skewness of income-related variables, while the Breusch–Pagan test (BP = 358.76, p < 2.2 × 10⁻¹⁶) revealed heteroskedasticity. Coefficient estimates were therefore reported with White-HC1 robust standard errors. Variance inflation factors were below 2 for all covariates, except for the experience and experience-squared terms (≈13 each), whose correlation is mechanical and does not suggest problematic multicollinearity. Overall, these diagnostics support the consistency of the estimates and justify the use of robust inference procedures.
The threefold OB decomposition was implemented using the Cotton (1988) weighting scheme. In this framework, the reference coefficients are defined as a weighted average of the group-specific estimates, where the weight corresponds to the relative size of each group in the analytical sample. The value w = 0.6793 was applied, reflecting the proportion of non-Indigenous entrepreneurs in the data. This specification yields a balanced benchmark that represents the average productive structure of the population and mitigates potential extrapolation bias associated with using one group as the sole reference.

4. Results and Discussion

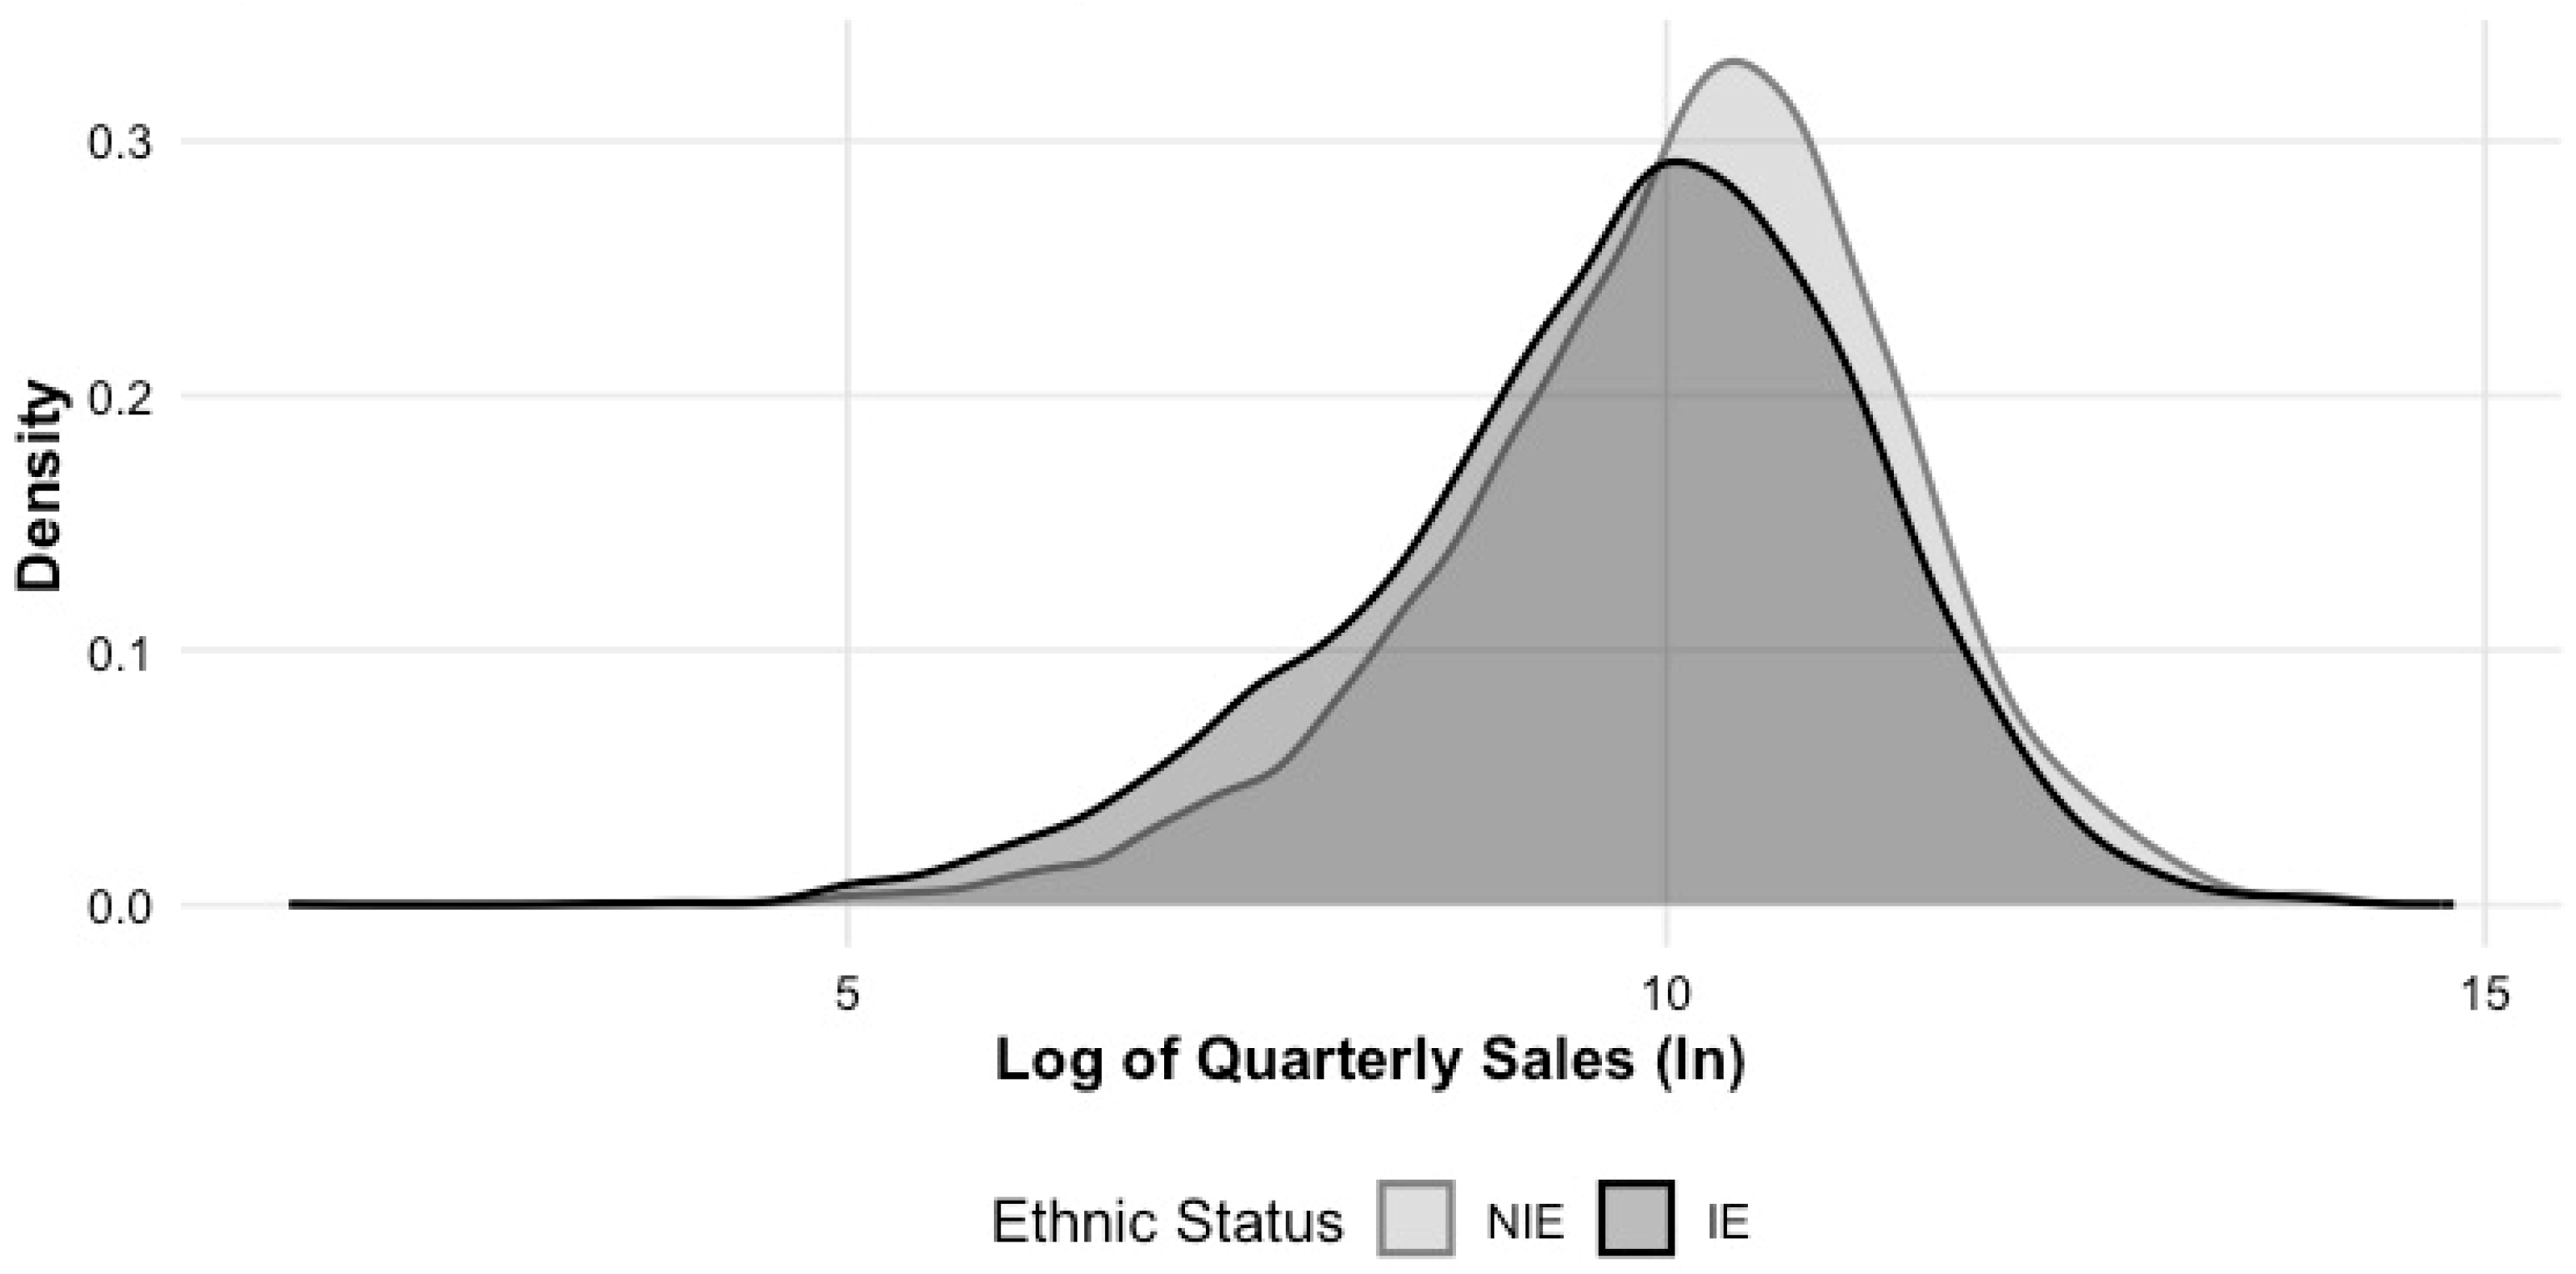
The distribution of sales (Figure 1) shows that Indigenous entrepreneurs (IEs) and non-Indigenous entrepreneurs (NIEs) share a similar overall shape and are concentrated around medium income levels. However, the density of the Indigenous population shifts toward lower values across the entire range of the distribution. This indicates that, on average, IEs tend to report lower sales, with their distribution concentrated toward the left, whereas NIEs display a distribution shifted to the right and a higher mean level of sales.
Out of the total observations, 32% correspond to IEs, a higher proportion than the 19.4% Indigenous share reported in the 2020 National Census. This, together with the greater dispersion observed in this group, may reflect the high incidence of self-employment as an economic strategy among Indigenous populations.
The share of women in both groups is similar, at 54.8% among NIEs and 58.6% among IEs, suggesting that female participation in entrepreneurship transcends ethnic boundaries. However, the educational gap between groups is substantial. The average level of schooling reaches 3.33 among NIEs compared to 2.86 among IEs, reflecting a lower accumulation of human capital within the IE group. As expected, the average socioeconomic stratum is considerably higher among NIEs, revealing a persistent context of structural disadvantage. This variable is a composite index that classifies households according to the socioeconomic characteristics of their members, as well as the physical and infrastructural features of their dwellings.
Both groups show similar average labor experience, suggesting comparable job trajectories. Nonetheless, IEs display a slightly higher proportion of employers and a greater concentration in industrial activities, often linked to small-scale production units such as family workshops. A critical difference emerges in payment methods: only 15.9% of IEs accept non-cash payments, compared to 30.1% among NIEs, reflecting persistent gaps in financial inclusion that may limit their commercial capacity and growth potential.
Before implementing the OB decomposition, a series of preliminary diagnostic tests were conducted to ensure the internal consistency and robustness of the analytical model. The results of the mean comparison tests confirmed statistically significant differences between Indigenous and non-Indigenous entrepreneurs across all analyzed dimensions, with particularly pronounced disparities in socioeconomic status, educational attainment, and the use of non-cash payment methods.

4.1. Oaxaca–Blinder Results

Table 2 confirms that the inequality in sales between IEs and NIEs is not a marginal but a substantive phenomenon. On average, NIEs earn 42.5% more income than IEs. This gap persists even after controlling for observable characteristics, indicating that ethnic identity functions as a differentiating factor in the economic returns of entrepreneurship in Mexico. In other words, two individuals with similar productive attributes may experience markedly divergent economic trajectories depending on their ethnic affiliation.
The explained component reveals that part of the gap is grounded in differences in human capital, socioeconomic conditions, and productive resources. In other words, a portion of inequality stems from material disparities that place IEs at a disadvantage from the outset. However, the largest contribution arises from the unexplained component, reflecting a scenario of unequal returns: IEs are “paid less” for the same attributes, pointing to processes of market segmentation, differences in the quality of productive integration, or potential discriminatory barriers.
The interaction term, although negative and statistically significant, suggests a partial compensatory effect; some combinations of endowments and returns help to narrow the gap, but their magnitude is insufficient to offset the structural factors that penalize IEs.
When analyzed by variable (Table 3), the entrepreneur’s sex contributes to the sales gap in two distinct ways. On the one hand, differences in endowments indicate that the gender composition is less favorable for the Indigenous group on account of the higher proportion of women, which is systematically associated with lower entrepreneurial income levels in Mexico, thus widening inequality. On the other hand, the returns further amplify the gap, showing that Indigenous women receive considerably lower economic recognition for their entrepreneurial effort compared to non-Indigenous women and especially to men. In other words, holding other factors constant, being both a woman and Indigenous translates into a cumulative penalty, revealing a clear mechanism of intersectional inequality.
The results for socioeconomic status offer a particularly revealing contribution. Endowments favor NIEs, widening the gap due to their better initial material conditions. However, the returns associated with this variable are negative and statistically significant, implying that each improvement in socioeconomic status yields proportionally greater benefits for IEs. This result suggests a compensatory effect: when IEs gain access to better conditions, the increase in their income is comparatively larger than that of NIEs.
Participation in industrial activities widens the gap. On the one hand, differences in endowments show that IEs are underrepresented in industrial sectors. At this scale, industrial activities are often associated with family workshops, implying production levels that operate on a small scale and rely on artisanal processes rather than mass production. The returns linked to this variable reveal an additional mechanism of inequality: IEs capture lower economic benefits than NIEs. The industrial sector, which should represent a channel for productive mobility, instead functions as a space where structural biases or limitations persist, whether technological, scale-related, or financial.
The use of payment methods other than cash, such as transfers or card payments, contributes significantly to the income gap through the endowment channel. This indicates that NIEs exhibit a higher adoption of financial tools, which facilitates their integration into broader markets and reduces operational risks. The effect of returns is not statistically significant, suggesting that when IEs gain access to these financial instruments, the market neither penalizes nor rewards them differently from NIEs.
A distinct pattern emerges regarding variables related to labor trajectories. Linear experience reduces the gap through the endowment component, indicating that on average, IEs accumulate more years of potential experience than NIEs. However, the quadratic component shows that prolonged experience yields higher returns for NIEs, likely because they operate in sectors and under business models that better capitalize on such accumulated experience. This divergence underscores that accumulated experience alone is insufficient: the sectoral structure and entrepreneurial networks within which that experience is gained play a crucial role in the ability to turn experience into income.
The negative endowment component for type of entrepreneurship indicates that IEs have a slightly higher presence as employers, which tends to reduce the gap. The positive contribution of endowments in the main job variable suggests that NIEs devote a greater proportion of their time to their business activity, thereby widening the gap. In both cases, the returns are not statistically significant.

4.2. Distributional Heterogeneity

The results from the RIF (Table 4) model reveal marked heterogeneity in the penalty faced by IEs across the sales distribution. In the lower deciles, being Indigenous is associated with sharper reductions in sales, suggesting the presence of more intense structural barriers among those in conditions of greater economic vulnerability.
Moving toward higher quantiles, the magnitude of this penalty diminishes but does not disappear, indicating that improvements in sales do not entirely eliminate the effects of discrimination or market segmentation; they merely moderate them. This pattern reveals that inequality is deepest precisely among those segments facing the greatest economic vulnerabilities.
The results also show that being a woman is associated with significantly lower sales levels across all quantiles of the distribution. In the first decile, women report sales that are 62.8% lower than those of men with similar characteristics. Although the gap narrows at higher levels of the distribution, it does not vanish, highlighting a persistent form of structural inequality.
Socioeconomic status exhibits a positive and highly significant relationship with sales levels across all quantiles. In the lower segments of the distribution, belonging to a higher socioeconomic stratum is associated with 8.3% higher sales. However, this effect decreases progressively as business income increases, reaching 2.2% in the 10th decile.
Belonging to the industrial sector is associated with a sales penalty across the entire distribution. The sign and magnitude of the effect reveal that industrial ventures operate under greater structural constraints compared to those in commerce and services.
Taken together, the results from both the OB decompositions and the RIF regressions demonstrate a consistent and robust diagnosis: income inequality between IEs and NIEs in Mexico arises not only from disparities in productive endowments but, more importantly, from structural differences in the economic returns that each group derives from entrepreneurship. Even when IEs manage to accumulate favorable attributes, such as more experience, greater dedication to their business, or advances in financial inclusion, these factors do not translate into proportional increases in sales, particularly among those at the lower end of the distribution. The negative effects associated with Indigenous identity and gender consistently indicate that these disadvantages are cumulative and reinforce one another, especially in segments characterized by lower business performance.
At the same time, the differences observed along the distribution show that inequality is not uniform but more pronounced in segments with higher economic vulnerability. This penalty partially decreases among businesses with higher levels of sales but never disappears, suggesting that higher income mitigates, yet does not eliminate, the effects of structural segmentation and exclusion. The empirical evidence thus confirms that entrepreneurial inequalities stem not only from unequal starting points but also from an economic environment that differentially values skills and efforts according to the entrepreneur’s social position and ethnic identity. These findings underscore that the income gap is, at its core, a deeply structural phenomenon, which is highly relevant for the design of economic and productive inclusion policies targeting Indigenous populations.
Overall, the empirical findings support the first hypothesis, indicating that the inequality in outcomes between IEs and NIEs in Mexico is not circumstantial but structural. The 42.5% average sales gap, identified through the OB decomposition, is explained both by initial differences in human capital, socioeconomic status, and access to productive tools, and by differential returns that disproportionately penalize IEs. Thus, even when IEs achieve comparable capabilities, the market continues to assign them a lower economic value, reflecting persistent segmentation within entrepreneurial opportunity structures.
Additionally, the results from the RIF model confirm the second hypothesis, showing that this penalty is not uniform across the income distribution. The negative effects associated with Indigenous identity are more strongly concentrated in the lower deciles of sales, precisely where higher socioeconomic vulnerability and precarious forms of production organization have been previously observed. Although the gap narrows at higher sales levels, suggesting some mitigating capacity among those who run more successful businesses, the penalty persists and never reverses. This implies that entrepreneurship, far from acting as a mechanism of economic mobility, may reproduce historical inequalities, particularly among those operating under conditions of greater vulnerability.

5. Conclusions

The results reveals a substantive and persistent inequality in performance between IEs and NIEs. The average sales gap, approximately 0.35 log points, equivalent to 52.5%, does not depend on a specific model. Results are consistent between the OB decomposition and the decile-based RIF. Inequality of opportunities manifests in insufficient endowments of Indigenous entrepreneurs, such as educational disadvantages; lower social capital, which is linked to their socioeconomic status; and poor access to modern financial services, resulting in a reliance on cash payments, among other factors that limit their initial opportunities.
On the other hand, inequality of outcomes is reflected in differential returns, the undervaluation of socioeconomic characteristics, or discriminatory practices related to socioeconomic level and gender, since even with the same observed traits, IEs derive lower returns from their businesses than NIEs. Both dimensions of inequality reinforce each other in a vicious cycle where lower initial endowments restrict the growth of IE businesses, while low returns, resulting from structural or discriminatory barriers, perpetuate the gaps.
The results are consistent in showing a twofold structural constraint, driven by differences in starting conditions (endowments) and by an undervaluation of characteristics that are equivalent in both groups (returns), which prevents IEs from fully developing their entrepreneurial skills. Even when they improve their endowments, the outcome gap does not completely close.
The penalty associated with Indigenous identity is concentrated at the lower end of the distribution, which is more consistent with a “sticky floor” than with upper-end constraints. Although the magnitude diminishes in the higher quantiles, the gap does not disappear, suggesting that the stock of economic, social, and educational capital mitigates, but does not eliminate, the initial disadvantage. This holds true for both IEs and women, with the latter facing deeper disparities. In contrast, education, socioeconomic status, and the acceptance of non-cash payment methods are associated with higher sales and reductions in overall inequality.
These results offer public policy implications for reducing these gaps. The combination of endowment and return gaps requires complementary interventions: targeted programs in education and financial literacy, complemented by regulations that facilitate access to financial services regardless of region or area, together with the development of intercultural entrepreneurial training for lower-income segments with an emphasis on community-based ventures, as well as regulatory and/or market mechanisms that promote equity in returns.
This study documents a significant and persistent gap when comparing sales between NIEs and IEs, a phenomenon that remains understudied. When Indigenous identity is defined through self-identification, IEs exhibit lower average sales across the distribution; although this penalty diminishes as sales increase, it never disappears, even after controlling for observable characteristics. The most evident challenge is the differentiated return between groups for characteristics such as being a woman, which points to structural mechanisms that disadvantage IEs.
From a conceptual standpoint, the study contributes to the literature on inequality of opportunities and outcomes by showing how both dimensions interact within the entrepreneurial sphere. This invites reflection on the intersectional barriers faced by Indigenous entrepreneurs and how structural inequalities are also reproduced within the sphere of entrepreneurship.
This consistency suggests that we cannot reject the hypothesis proposed in this study: that the disparity in entrepreneurial performance is associated with inequalities in opportunities and outcomes, and that these inequalities interact to shape business performance in varying magnitudes across the distribution.
The results help support specific targeted interventions that have shown success (Mahato & Jha, 2023; Cuecuecha Mendoza et al., 2022; Prina, 2015; del Carmen Briano-Turrent, 2025). At the lower end, interventions that expand basic capabilities; in the middle of the distribution, policies that strengthen business capabilities; and in higher-performing firms, programs that facilitate scaling, integration into value chains, and participation in public procurement may reduce the risk that structural penalties persist even among relatively successful IEs.
The results should be interpreted considering several limitations. The cross-sectional nature of the data limits causal inference. The measurement of Indigenous identity through self-identification may underestimate the actual size of this group. Reported sales are self-declared and subject to underreporting and seasonality, in addition to being a rough approximation of business performance that does not account for communal, environmental, or cultural objectives as performance metrics. As Morales et al. (2021) note, Indigenous enterprises should be analyzed from a hybrid perspective, one that recognizes the practices that attempt to mimic mainstream objectives while also being influenced by their own cultural practices.
Furthermore, variables such as business age or physical capital are not available; these may constitute omitted variables that inflate the unexplained component. In addition, education and experience may be endogenous, as both can be shaped by structural discrimination. Future research could address this issue through the use of instrumental variables.
Overall, the evidence indicates that closing income gaps requires tackling the structural conditions that shape who becomes an entrepreneur, under what terms, and with what chances of converting capabilities into dignified and sustained livelihoods.

Author Contributions

Conceptualization, R.I.F.-C., J.R.-R. and M.L.-G.; methodology, R.I.F.-C.; software, R.I.F.-C.; validation, R.I.F.-C. and J.R.-R.; formal analysis, R.I.F.-C.; investigation, J.R.-R.; resources, M.L.-G.; data curation, R.I.F.-C.; writing—original draft preparation, R.I.F.-C., J.R.-R. and M.L.-G.; writing—review and editing, R.I.F.-C. and J.R.-R.; visualization, R.I.F.-C. and J.R.-R.; supervision, J.R.-R. and M.L.-G. All authors have read and agreed to the published version of the manuscript.

Funding

This research received no external funding.

Informed Consent Statement

Not applicable.

Data Availability Statement

The data used in this study are publicly available and can be downloaded from the National Household Income and Expenditure Survey (ENIGH) database of the National Institute of Statistics and Geography (INEGI) of Mexico, accessible at https://www.inegi.org.mx/programas/enigh/nc/2024/ (accessed on 1 August 2025). Software Source Code: https://drive.google.com/drive/folders/1qY-kMqTeoaYpbFySzBgDpFWmzkJoYLfd?usp=sharing (accessed on 1 December 2025).

Acknowledgments

The authors gratefully acknowledge the institutional support provided by the Autonomous University of Baja California.

Conflicts of Interest

The authors declare no conflicts of interest.

References

  1. Agu, G., & Margaça, C. (2025). Indigenous igbo entrepreneurship scheme: Relevance, restraints, and remedies. Businesses, 5(1), 9. [Google Scholar] [CrossRef]
  2. Aguilar-Rodriguez, A., Miranda, A., & Zhu, Y. (2018). Decomposing the language pay gap among the indigenous ethnic minorities of Mexico: Is it all down to observables? Economics Bulletin, 38(2), 689–695. [Google Scholar]
  3. Almehrzi, A., Tipu, S., & Sarker, A. (2024). Determinants, processes, and impacts of indigenous entrepreneurship: A systematic literature review. Journal of Enterprising Communities: People and Places in the Global Economy, 18(3), 646–681. [Google Scholar] [CrossRef]
  4. Arceo-Gomez, E., & Campos-Vazquez, R. (2014). Race and marriage in the labor market: A discrimination correspondence study in a developing country. American Economic Review, 104(5), 376–380. [Google Scholar] [CrossRef]
  5. Arceo-Gomez, E., & Torres, P. (2021). Brechas salariales por autoidentificación indígena y rasgos lingüísticos en México. Sobre México Temas De Economía, 1(3), 129–161. [Google Scholar] [CrossRef]
  6. Arrow, K. J. (1973). The theory of discrimination. In O. Ashenfelter, & A. Rees (Eds.), Discrimination in labor markets (pp. 3–33). Princeton University Press. Available online: https://www.jstor.org/stable/j.ctt13x10hs.5 (accessed on 1 December 2025).
  7. Atal, J. P., Ñopo, H., & Winder, N. (2010). Gender and ethnic wage gaps in Latin America at the turn of the century. Inter-American Development Bank. [Google Scholar]
  8. Bacq, S., Hertel, C., & Lumpkin, G. (2022). Communities at the nexus of entrepreneurship and societal impact: A cross-disciplinary literature review. Journal of Business Venturing, 37(5), 106231. [Google Scholar] [CrossRef]
  9. Bansal, S., Garg, I., & Sharma, G. (2019). Social Entrepreneurship as a path for social change and driver of sustainable development: A systematic review and research agenda. Sustainability, 11(4), 1091. [Google Scholar] [CrossRef]
  10. Bastien, F., Coraiola, D., & Foster, W. (2022). Indigenous peoples and organization studies. Organization Studies, 44, 659–675. [Google Scholar] [CrossRef]
  11. Baumol, W. J. (1996). Entrepreneurship: Productive, unproductive, and destructive. Journal of Business Venturing, 11(1), 3–22. [Google Scholar] [CrossRef]
  12. Becker, G. S. (2010). The economics of discrimination. University of Chicago press. [Google Scholar]
  13. Blau, F. D. (1984). Discrimination against women: Theory and evidence. In W. Darity (Ed.), Labor economics: Modern views. Recent economic thought series (Vol. 4). Springer. [Google Scholar] [CrossRef]
  14. Bonfil Batalla, G. (1977). El concepto de indio en América: Una categoría de la situación colonial. Boletín Bibliográfico de Antropología Americana (1973–1979), 39(48), 17–32. (In Spanish) [Google Scholar]
  15. Canedo, A. (2019). Labor market discrimination against indigenous peoples in Mexico: A decomposition analysis of wage differentials. Iberoamericana—Nordic Journal of Latin American and Caribbean Studies, 48(1), 12–27. [Google Scholar] [CrossRef]
  16. Cano-Urbina, J., & Mason, P. (2016). Acculturation and the labor market in Mexico. IZA Journal of Labor Policy, 5, 21. [Google Scholar] [CrossRef]
  17. Cardella, G., Hernández-Sánchez, B., Monteiro, A., & Sánchez-García, J. (2021). Social entrepreneurship research: Intellectual structures and future perspectives. Sustainability, 13(14), 7532. [Google Scholar] [CrossRef]
  18. Castañeda-Navarrete, J. (2013). Poverty dynamics in Mexico, 2002–2005. An ethnicity approach. Brazilian Review of Econometrics, 33, 69–89. [Google Scholar] [CrossRef]
  19. Chen, J., & Hu, M. (2021). City-level hukou-based labor market discrimination and migrant entrepreneurship in China. Technological and Economic Development of Economy, 27(5), 1095–1118. [Google Scholar] [CrossRef]
  20. Cobo, J. R. M. (1986). Study of the problem of discrimination against indigenous populations. United Nation. [Google Scholar]
  21. Colbourne, R. (2021). Indigenous entrepreneurship. In The palgrave handbook of minority entrepreneurship. Springer International Publishing. [Google Scholar] [CrossRef]
  22. Cotton, J. (1988). On the decomposition of wage differentials. The Review of Economics and Statistics, 70(2), 236–243. [Google Scholar] [CrossRef]
  23. Crenshaw, K. W. (2013). Mapping the margins: Intersectionality, identity politics, and violence against women of color. In The public nature of private violence (pp. 93–118). Routledge. [Google Scholar]
  24. Cuecuecha Mendoza, A., Vasquez Corona, A., & Meneses Ortiz, P. (2022). ¿Existe un vínculo entre la inclusión y el alfabetismo financiero de mujeres?: Evidencia desde México. Economía: Teoría y Práctica, 30(57), 139–168. [Google Scholar] [CrossRef]
  25. Delaunay, D. (2005). Análisis individual y contextual en la identificación de los pueblos indígenas (México, 1990–2000). Available online: https://hdl.handle.net/11362/12772 (accessed on 1 June 2025).
  26. del Carmen Briano-Turrent, G. (2025). The effect of financial inclusion on economic and social indicators in Mexico. Latin American Journal of Central Banking, 6(1), 100161. [Google Scholar] [CrossRef]
  27. Dorries, H. (2023). Indigenous urbanism as an analytic: Towards Indigenous urban theory. International Journal of Urban and Regional Research, 47(1), 110–118. [Google Scholar] [CrossRef]
  28. Durán-Díaz, P., Armenta-Ramírez, A., Kurjenoja, A., & Schumacher, M. (2020). Community development through the empowerment of indigenous women in Cuetzalan Del Progreso, Mexico. Land, 9(5), 163. [Google Scholar] [CrossRef]
  29. Eva, C., Harris, J., Bodle, K., Foley, D., Hunter, B., & Nichols, N. (2023). “It’s self-determination. Blackfullas making right decisions for blackfullas”: Why indigenous-owned businesses create better Indigenous employment outcomes. Australian Journal of Social Issues, 59(1), 29–56. [Google Scholar] [CrossRef]
  30. Eva, C., Hunter, B., Bodle, K., Foley, D., & Harris, J. (2024). Closing the employment gap: Estimations of Indigenous employment in Indigenous- and non-Indigenous-owned businesses in Australia. The Economic and Labour Relations Review, 35(3), 685–707. [Google Scholar] [CrossRef]
  31. Fairlie, R. W., & Fossen, F. M. (2017). Opportunity versus necessity entrepreneurship: Two components of business creation (Stanford Institute for Economic Policy Research Discussion Paper No. 17-014). Stanford Institute for Economic Policy Research. [Google Scholar] [CrossRef]
  32. Fairlie, R. W., & Robb, A. M. (2008). Race and entrepreneurial success. The MIT Press. [Google Scholar]
  33. Firpo, S., Fortin, N. M., & Lemieux, T. (2009). Unconditional quantile regressions. Econometrica, 77(3), 953–973. [Google Scholar] [CrossRef]
  34. Foley, D., & O’Connor, A. (2013). Social capital and the networking practices of indigenous entrepreneurs. Journal of Small Business Management, 51, 276–296. [Google Scholar] [CrossRef]
  35. Fuentes, R., Librado-González, M., & Salinas, K. (2025). Assessing sales performance gaps by gender and Indigenous identity among Mexican entrepreneurs. Journal of Infrastructure, Policy and Development, 9(2), 11405. [Google Scholar] [CrossRef]
  36. Garcia Moreno, V., & Patrinos, H. (2011). Indigenous peoples and poverty in Mexico (Indigenous Peoples Country Brief; no. 7). World Bank. Available online: http://documents.worldbank.org/curated/en/126671468280475397 (accessed on 2 May 2025).
  37. García-Jurado, A., Pérez-Barea, J., & Nova, R. (2021). A new approach to social entrepreneurship: A systematic review and meta-analysis. Sustainability, 13(5), 2754. [Google Scholar] [CrossRef]
  38. Hamzani, U., & Achmad, D. (2016). The performance of Micro, Small and Medium Enterprises (MSMEs): Indigenous ethnic versus non-Indigenous ethnic. Procedia—Social and Behavioral Sciences, 219, 265–271. [Google Scholar] [CrossRef][Green Version]
  39. Hunter, B. (2015). Whose business is it to employ Indigenous workers? The Economic and Labour Relations Review, 26, 631–651. [Google Scholar] [CrossRef]
  40. Kantis, H. D., Federico, J. S., & García, S. I. (2020). Entrepreneurship policy and systemic conditions: Evidence-based implications and recommendations for emerging countries. Socio-Economic Planning Sciences, 72, 100872. [Google Scholar] [CrossRef]
  41. Knight, M. (2016). Race-ing, classing and gendering racialized women’s participation in entrepreneurship. Gender, Work and Organization, 23, 310–327. [Google Scholar] [CrossRef]
  42. Kwon, S., Heflin, C., & Ruef, M. (2013). Community social capital and entrepreneurship. American Sociological Review, 78, 1008–1980. [Google Scholar] [CrossRef]
  43. Lumpkin, G. T., Bacq, S., & Pidduck, R. J. (2018). Where change happens: Community-level phenomena in social entrepreneurship research. Journal of Small Business Management, 56(1), 24–50. [Google Scholar] [CrossRef]
  44. Luz-Tovar, C. D. L., & Samario-Zarate, J. (2023). The effect of ethnicity on the mexican labor market; An analysis of wage discrimination in the indigenous population. Contaduría y Administración, 68(2). [Google Scholar] [CrossRef]
  45. Mahato, J., & Jha, M. K. (2023). Does financial inclusion promote sustainable livelihood development? Mediating effect of microentrepreneurship. Journal of Financial Economic Policy, 15(4/5), 485–499. [Google Scholar] [CrossRef]
  46. Majeed, A., Fathallah, Z., Jassim, H., Turki, M., & Abbas, S. (2024). Study the impact of entrepreneurship and innovation in the labor market on activating poverty reduction strategies. International Journal of Business and Management Sciences, 4(4), 32–50. [Google Scholar] [CrossRef]
  47. Masino, S., & Niño-Zarazúa, M. (2020). Improving financial inclusion through the delivery of cash transfer programmes: The case of Mexico’s progresa-oportunidades-prospera programme. The Journal of Development Studies, 56(1), 151–168. [Google Scholar] [CrossRef]
  48. Molina-Ramírez, E., & Barba-Sánchez, V. (2021). Embeddedness as a differentiating element of indigenous entrepreneurship: Insights from Mexico. Sustainability, 13(4), 2117. [Google Scholar] [CrossRef]
  49. Morales, A., Calvo, S., Martinez, J. M. G., & Martin, J. M. M. (2021). Hybrid forms of business: Understanding the development of indigenous social entrepreneurship practices. Journal of Business Research, 124, 212–222. [Google Scholar] [CrossRef]
  50. Moreno, M., & Benavides, M. (2018). Dynamics of ethnic and racial self-identification in contemporary Peru. Ethnic and Racial Studies, 42, 1686–1707. [Google Scholar] [CrossRef]
  51. Moreno Morales, D. E. (2019). The mysterious case of the disappearing Indians: Changes in self-identification as indigenous in the latest inter-census period in Bolivia. Latin American and Caribbean Ethnic Studies, 14(2), 151–170. [Google Scholar] [CrossRef]
  52. Morris, M. (2020). The liability of poorness: Why the playing field is not level for poverty entrepreneurs. Poverty & Public Policy, 12(3), 304–315. [Google Scholar] [CrossRef]
  53. Morris, M., & Tucker, R. (2021). The entrepreneurial mindset and poverty. Journal of Small Business Management, 61, 102–131. [Google Scholar] [CrossRef]
  54. National Institute of Statistics and Geography (INEGI). (2022). National Survey of Occupation and Employment (ENOE), fourth quarter 2022. INEGI. Available online: https://www.inegi.org.mx/programas/enoe/15ymas/ (accessed on 1 June 2025).
  55. Oaxaca, R. (1973). Male-female wage differentials in urban labor markets. International Economic Review, 14(3), 693–709. [Google Scholar] [CrossRef]
  56. Oaxaca, R. L., & Ransom, M. R. (1994). On discrimination and the decomposition of wage differentials. Journal of Econometrics, 61(1), 5–21. [Google Scholar] [CrossRef]
  57. Ogunlela, O., Ojugbele, H., & Tengeh, R. (2022). Towards a theory of indigenous entrepreneurship: A classic? International Journal of Entrepreneurship and Small Business, 45(1), 1–15. [Google Scholar] [CrossRef]
  58. Paes de Barros, R., Ferreira, F., Molina, J., & Saavedra, J. (2009). Measuring inequality of opportunities in Latin America and the Caribbean. World Bank. [Google Scholar]
  59. Peredo, A., Anderson, R., Galbraith, C., Honig, B., & Dana, L. (2004). Towards a theory of indigenous entrepreneurship. International Journal of Entrepreneurship and Small Business, 1(1–2), 1–20. [Google Scholar] [CrossRef]
  60. Prina, S. (2015). Banking the poor via savings accounts: Evidence from a field experiment. Journal of Development Economics, 115, 16–31. [Google Scholar] [CrossRef]
  61. Quispe-Mamani, J. C., Aguilar-Pinto, S. L., Incacutipa-Limachi, D. J., Quispe-Layme, M., Flores-Turpo, G. A., Cáceres-Quenta, R., Alegre-Larico, M. I., Mamani-Flores, A., Velásquez-Velásquez, W. L., Rosado-Chávez, C. A., & Guevara-Mamani, M. (2025). Decomposing the gender gap in financial inclusion: An oaxaca–blinder analysis for Peru, 2024. Social Sciences, 14(9), 567. [Google Scholar] [CrossRef]
  62. Rahimi, E., & Nazari, S. (2021). A detailed explanation and graphical representation of the Blinder-Oaxaca decomposition method with its application in health inequalities. Emerging Themes in Epidemiology, 18, 12. [Google Scholar] [CrossRef]
  63. Ratten, V., & Dana, L. (2017). Gendered perspective of indigenous entrepreneurship. Small Enterprise Research, 24, 62–72. [Google Scholar] [CrossRef]
  64. Reynolds, P. D. (1992). Sociology and entrepreneurship: Concepts and contributions. Entrepreneurship Theory and Practice, 16(2), 47–70. [Google Scholar] [CrossRef]
  65. Rivera, L. A., & Tilcsik, A. (2016). Class advantage, commitment penalty: The gendered effect of social class signals in an elite labor market: The gendered effect of social class signals in an elite labor market. American Sociological Review, 81(6), 1097–1131. [Google Scholar] [CrossRef]
  66. Rodríguez-Cáceres, A., & Behrman, J. (2024). Demarcation and difference: Language and indigenous self-identity in Latin America. Socius: Sociological Research for a Dynamic World, 10, 23780231241298319. [Google Scholar] [CrossRef]
  67. Roemer, J., & Trannoy, A. (2016). Equality of opportunity: Theory and measurement. Journal of Economic Literature, 54(4), 1288–1332. [Google Scholar] [CrossRef]
  68. Saavedra Leyva, R. E., Texis Flores, M., & Beltrán-Salomón, E. (2023). Análisis del desempleo en la actividad emprendedora de los sectores económicos: Emprendimiento por oportunidad o necesidad. Contaduría y Administración, 68(2), 250–270. [Google Scholar] [CrossRef]
  69. Santos, F. (2010). A positive theory of social entrepreneurship. Journal of Business Ethics, 111, 335–351. [Google Scholar] [CrossRef]
  70. Schumpeter, J. A., & Swedberg, R. (2021). The theory of economic development. Routledge. [Google Scholar]
  71. Sen, A. (1996). Capacidad y bienestar. In M. Nussbaum, & A. Senn (Eds.), La calidad de vida (pp. 54–79). FCE. [Google Scholar]
  72. Setyawati, H., Suroso, A., Adi, P., Adawiyah, W., & Helmy, I. (2020). Making local product attractive: The role of indigenous value in improving market performance. GeoJournal of Tourism and Geosites, 29(2), 746–755. [Google Scholar] [CrossRef]
  73. Słoczyński, T., & Wooldridge, J. M. (2018). A general double robustness result for estimating average treatment effects. Econometric Theory, 34(1), 112–133. [Google Scholar] [CrossRef]
  74. Stavenhagen, R. (1992). Los derechos de los indígenas: Algunos problemas conceptuales. Nueva Antropología, 13(43), 83–99. (In Spanish) [Google Scholar]
  75. Szymanski, A., Gorton, M., & Hubbard, L. (2007). A comparative analysis of firm performance in post-socialist economies: Evidence from the Polish food processing industry. Post-Communist Economies, 19, 433–448. [Google Scholar] [CrossRef]
  76. Tawiah, V., Matemane, R., Oyewo, B., & Lemma, T. (2023). Saving the environment with indigenous directors: Evidence from Africa. Business Strategy and the Environment, 33(3), 2445–2461. [Google Scholar] [CrossRef]
  77. Teasdale, S., Bellazzecca, E., De Bruin, A., & Roy, M. (2022). The (r)evolution of the social entrepreneurship concept: A critical historical review. Nonprofit and Voluntary Sector Quarterly, 52, 212S–240S. [Google Scholar] [CrossRef]
  78. Trepte, S., & Loy, L. S. (2017). Social identity theory and self-categorization theory. The International Encyclopedia of Media Effects, 63, 1–13. [Google Scholar] [CrossRef]
  79. Van Praag, M., & Versloot, P. (2007). What is the value of entrepreneurship? A review of recent research. Small Business Economics, 29, 351–382. [Google Scholar] [CrossRef]
  80. Vaswani, M., Sutter, A., Lapshina, N., & Esses, V. (2023). Discrimination experienced by immigrants, racialized individuals, and indigenous peoples in small- and mid-sized communities in southwestern ontario. Canadian Review of Sociology = Revue Canadienne de Sociologie, 60(1), 92–113. [Google Scholar] [CrossRef]
  81. Vázquez-Maguirre, M. (2020). Building sustainable rural communities through indigenous social enterprises: A humanistic approach. Sustainability, 12(22), 9643. [Google Scholar] [CrossRef]
  82. Villarreal, A. (2014). Ethnic identification and its consequences for measuring inequality in Mexico. American Sociological Review, 79(4), 775–806. [Google Scholar] [CrossRef] [PubMed]
  83. Vivaldini, M., & Correa, V. (2025). Spatial embeddedness in indigenous rural entrepreneurship: A systematic literature review. Journal of Enterprising Communities: People and Places in the Global Economy, 19(4), 765–791. [Google Scholar] [CrossRef]
  84. Warnecke, T., & Balzac-Arroyo, J. (2022). Community, capabilities, and the social entrepreneurship ecosystem. Community Development, 54, 359–381. [Google Scholar] [CrossRef]
  85. Wilson, W. J. (2011). The declining significance of race: Revisited & revised. Daedalus, 140(2), 55–69. [Google Scholar] [CrossRef]
  86. Yang, X., Huang, Y., & Gao, M. (2022). Can digital financial inclusion promote female entrepreneurship? Evidence and mechanisms. The North American Journal of Economics and Finance, 63, 101800. [Google Scholar] [CrossRef]
Figure 1. Distribution of Log-Sales.
Economies 14 00003 g001
Table 1. Operationalization of research variables.
VariableDescriptionGroupMeanStandard DeviationMicrodata Module
Sales (log)Natural logarithm of quarterly sales of the businessNIE10.0541.378Business Module
IE9.6991.511
EducationCompleted level of education (scale 0–8)NIE3.3271.216Population Module
IE2.8561.261
Socioeconomic StatusHousehold socioeconomic level (1 = Low, 4 = High)NIE2.220.775Module
IE1.6850.722
ExperiencePotential labor experience (Age—schooling—6)NIE28.03214.268Population Module
IE29.05114.264
VariableDescriptionGroupProportionMicrodata Module
SexSex of the entrepreneur (female = 1)NIE0.548 (Female)Population Module
IE0.586 (Female)
Type of EntrepreneurshipType of entrepreneur (1 = Employer, 0 = Self-employed)NIE0.299 (Employer)Labor Module
IE0.336 (Employer)
Payment Beyond CashAccepts non-cash payments (1 = Yes)NIE0.301 (Accepts non-cash payments)Business Module
IE0.159 (Accepts non-cash payments)
Main JobMain job of the entrepreneur (1 = Main activity)NIE0.87 (Main activity)Labor Module
IE0.843 (Main activity)
IndustryOperates in industrial sector (1 = Yes)NIE0.216 (Industry)Business Module
IE0.315 (Industry)
Number of ObservationsNIE15,638ENIGH 2024, Population Module
IE7382
Table 2. Oaxaca–Blinder decomposition of the income gap between IEs and NIEs.
Type of DecompositionComponent β Std. Error% in Sales
ThreefoldTotal0.3544842.54%
Endowment0.16546 ***0.0147118.01%
Coefficients 0.18903 ***0.0183320.80%
Interaction −0.05964 ***0.01349−5.79%
TwofoldTotal0.3544842.54%
Explained0.16546 ***0.0147118.01%
Unexplained0.18903 ***0.0183320.80%
Significance levels: *** p < 0.001. % in sales calculated as 100   × e β 1 , given that results are expressed in natural logarithms.
Table 3. Oaxaca–Blinder decomposition by variable (Threefold w = 0.6793).
VariableEndowmentsSE%CoefficientsSE%InteractionSE%
Intercept0.10500.105611.1
Sex0.0276 ***0.00552.800.0830 ***0.01948.63−0.0056 **0.0017−0.56
Education0.0202 **0.00482.040.04660.05524.770.00730.00820.73
Socioeconomic Status0.0269 **0.00822.73−0.1028 **0.0513−10.85−0.0296 **0.0134−2.93
Experience−0.0532 ***0.0116−5.18−0.04560.1296−4.680.00160.00480.16
Experience20.0508 ***0.01195.210.05720.07345.89−0.00320.0044−0.32
Type of Entrepreneurship−0.0364 ***0.0066−3.57−0.00940.0113−0.940.00110.00130.11
Industrial Activity0.0457 ***0.00444.670.0929 ***0.01019.73−0.0324 ***0.0045−3.18
Payment Beyond Cash0.0603 ***0.00466.420.00020.01180.020.00020.00650.02
Main Job0.0222 ***0.00432.24−0.03670.0435−3.66−0.00120.0014−0.12
Significance levels: *** p < 0.001, ** p < 0.01. % in sales calculated as 100   × e β 1 , given that results are expressed in natural logarithms.
Table 4. Heterogeneity across the distribution.
Variable0.10.20.30.40.50.60.70.80.9
Intercept6.17 ***7.14 ***7.68 ***8.24 ***8.68 ***9.19 ***9.55 ***10.02 ***10.64 ***
Indigenous −0.410 ***
[−33.7%]
−0.262 ***
[−23.1%]
−0.213 ***
[−19.2%]
−0.188 ***
[−17.1%]
−0.176 ***
[−16.1%]
−0.149 ***
[−13.9%]
−0.108 ***
[−10.2%]
−0.079 **
[−7.6%]
−0.057 *
[−5.5%]
Sex −0.99 ***
[−62.8%]
−0.93 ***
[−60.4%]
−0.87 ***
[−58.0%]
−0.81 ***
[−55.0%]
−0.73 ***
[−51.9%]
−0.67 ***
[−48.9%]
−0.59 ***
[−44.7%]
−0.51 ***
[−40.0%]
−0.45 ***
[−36.2%]
Education0.055 **
[+5.6%]
0.033 *
[+3.4%]
0.058 ***
[+6.0%]
0.048 ***
[+4.9%]
0.046 ***
[+4.7%]
0.037 ***
[+3.8%]
0.043 ***
[+4.4%]
0.032 ***
[+3.3%]
0.032 ***
[+3.2%]
Socioeconomic Status0.080 **
[+8.3%]
0.071 **
[+7.4%]
0.043 *
[+4.4%]
0.042 **
[+4.3%]
0.050 ***
[+5.1%]
0.046 ***
[+4.7%]
0.044 **
[+4.5%]
0.038 **
[+3.9%]
0.022
[+2.2%]
Experience0.085 ***
[+8.9%]
0.074 ***
[+7.7%]
0.066 ***
[+6.8%]
0.059 ***
[+6.1%]
0.051 ***
[+5.2%]
0.044 ***
[+4.5%]
0.037 ***
[+3.8%]
0.033 ***
[+3.4%]
0.025 ***
[+2.5%]
Experience2−0.0014 ***
[−0.14%]
−0.0012 ***
[−0.12%]
−0.0011 ***
[−0.11%]
−0.0010 ***
[−0.10%]
−0.00086 ***
[−0.09%]
−0.00075 ***
[−0.08%]
−0.00063 ***
[−0.06%]
−0.00055 ***
[−0.06%]
−0.00043 ***
[−0.04%]
Type of Entrepreneurship0.871 ***
[+139.2%]
0.912 ***
[+149.8%]
0.943 ***
[+157.1%]
0.981 ***
[+166.9%]
1.018 ***
[+171.1%]
1.026 ***
[+181.1%]
1.101 ***
[+200.7%]
1.130 ***
[+206.8%]
1.164 ***
[+221.3%]
Industrial Activity−0.880 ***
[−58.9%]
−0.710 ***
[−50.8%]
−0.568 ***
[−43.4%]
−0.492 ***
[−38.9%]
−0.410 ***
[−33.7%]
−0.355 ***
[−29.9%]
−0.330 ***
[−28.1%]
−0.326 ***
[−27.8%]
−0.289 ***
[−25.1%]
Payment Beyond Cash0.486 ***
[+62.6%]
0.452 ***
[+57.2%]
0.439 ***
[+55.1%]
0.399 ***
[+49.0%]
0.376 ***
[+45.7%]
0.369 ***
[+44.5%]
0.378 ***
[+45.9%]
0.405 ***
[+50.0%]
0.448 ***
[+56.5%]
Main Job1.188 ***
[+229.6%]
1.114 ***
[+204.7%]
1.069 ***
[+191.3%]
0.989 ***
[+169.8%]
0.867 ***
[+138.0%]
0.724 ***
[+106.2%]
0.637 ***
[+89.1%]
0.543 ***
[+72.1%]
0.458 ***
[+58.1%]
Significance levels: *** p < 0.001, ** p < 0.01, * p < 0.05. % in sales calculated as 100   × e β 1 , given that results are expressed in natural logarithms.
Disclaimer/Publisher’s Note: The statements, opinions and data contained in all publications are solely those of the individual author(s) and contributor(s) and not of MDPI and/or the editor(s). MDPI and/or the editor(s) disclaim responsibility for any injury to people or property resulting from any ideas, methods, instructions or products referred to in the content.