Abstract
This article investigates the macroeconomic and labor market conditions that shape the adoption of artificial intelligence (AI) technologies among large firms in Europe. Based on panel data econometrics and supervised machine learning techniques, we estimate how public health spending, access to credit, export activity, gross capital formation, inflation, openness to trade, and labor market structure influence the share of firms that adopt at least one AI technology. The research covers all 28 EU members between 2018 and 2023. We employ a set of robustness checks using a combination of fixed-effects, random-effects, and dynamic panel data specifications supported by Clustering and supervised learning techniques. We find that AI adoption is linked to higher GDP per capita, healthcare spending, inflation, and openness to trade but lower levels of credit, exports, and capital formation. Labor markets with higher proportions of salaried work, service occupations, and self-employment are linked to AI diffusion, while unemployment and vulnerable work are detractors. Cluster analysis identifies groups of EU members with similar adoption patterns that are usually underpinned by stronger economic and institutional fundamentals. The results collectively suggest that AI diffusion is shaped not only by technological preparedness and capabilities to invest but by inclusive macroeconomic conditions and equitable labor institutions. Targeted policy measures can accelerate the equitable adoption of AI technologies within the European industrial economy.
Keywords:
artificial intelligence adoption; macroeconomic determinants; labor market structure; panel data analysis; machine learning models JEL Classification:
O33; E24; C23; J24; O52
1. Introduction
Over the last few years, artificial intelligence (AI) has developed into a transformational general-purpose technology with the potential to transform economies, modify production systems, and reorient the roles of innovation and competitiveness. Its spread to different sectors—from manufacturing to health care, and from finance to public administration—sustains the hope of dramatic increases in efficiency, new business models, and better decision support. Consequently, we know little about how systemic factors—like access to finance, globalization, public investment policies, or institutional quality—interact with firm incentives and country-specific innovation systems to impact the diffusion of AI technologies. In addition, those few that do deal with macro-factors tend to concentrate on narrow measures like GDP or innovation indicators, and not on the more nuanced and multidetermined nature of economic development and how this translates to digital transformation (Popović et al., 2025). In Europe, where supranational guidelines in digital policy are complemented by national implementation, a deeper understanding of these macro-factors is essential for designing effective policies that can facilitate the deployment of AI in different economic contexts.
Research Objectives: To address the growing concern about the structural determinants of the surge in artificial intelligence (AI), this study proposes three well-structured research objectives. The article primarily aims to empirically estimate the relationship between significant macroeconomic and labor market variables (such as GDP per capita, domestic credit, healthcare expenditure, inflation, trade openness, and employment composition) and the adoption of AI technology in European Countries among large firms (over 250 employees). An innovative element of the article is the inclusion of an assessment of macroeconomic and institutional factors, whereas the literature on the topic typically focuses exclusively on firm-level determinants.
Second, the article combines a traditional econometric analysis through the application of panel data models with a set of machine learning algorithms. This dual approach allows both the investigation of linear relationships and the approach to nonlinearity, not only explanatory but also predictive, through the application of various algorithms, compared with each other in terms of performance using appropriate statistical indicators.
Third, the article presents a Clustering analysis performed through the application of the unsupervised k-Means algorithm to highlight the presence of Clusters among the analyzed countries. This Clustering allows for the specificities of the countries to be taken into account from a macroeconomic and institutional perspective.
Research gap: The scientific literature on the adoption of artificial intelligence in companies has grown significantly. However, studies on the topic generally take a micro-founded approach, assessing companies’ capacity to innovate and their ability to digitalize. Macroeconomic issues, such as those related to the institutional framework, are neglected. The relationship between companies’ ability to adopt forms of artificial intelligence and the structure of the labor market is also often overlooked. However, labor market conditions are necessary as they highlight the existence of incentives that can be offered to workers to acquire the skills necessary for AI adoption in companies. These gaps are even more serious in Europe due to a certain degree of institutional heterogeneity and labor market structures observed at the national level. High unemployment, especially when combined with medium-to-low levels of human capital, can inhibit investment in AI and reduce the productivity of applying innovative technologies within companies. To fill these gaps, this study considers both macroeconomic and institutional elements, as well as those relating to the labor market, in 28 European countries between 2018 and 2023.
The article proceeds as follows: Section 2 presents a critical analysis of the relevant literature; Section 3 presents the conceptual framework; Section 4 shows the methodology and the data preprocessing techniques; Section 5 presents the econometric results; Section 6 shows the results of the confrontation obtained using different machine learning regression algorithms; Section 7 presents the Cluster analysis; Section 8 shows the policy implications; Section 9 analyses limitations and future research; Section 10 provides the conclusions. Appendix A presents the results of the cross-validation analysis for the KNN algorithm, and Appendix B presents the hyperparameters of the machine learning algorithms used for regressions.
2. Literature Review
Artificial intelligence (AI) is not only regarded as a technological breakthrough but also as a macroeconomic shock with important implications. It is reshaping productivity spaces, altering labor markets, further widening inequalities in incomes, and presenting new challenges in inflation targeting as well as in macroeconomic governance. However, even as the scholarly literature labels AI as transformative, the systematic linking of its diffusion to broader macroeconomic frameworks is still lacking; this is the case in Europe in particular. That is exactly where the present study intervenes.
Abrardi et al. (2019) pave the way by posing AI as a general-purpose technology with spillovers in the broader economy, as well as institutions and capital barriers that are able to delay diffusion. Acemoglu (2025) complements such a viewpoint through formalizing the macroeconomic automation-driven substitution–productivity improvement trade-off in such a way that AI’s long-term economic effects are conditional on institutions. Autor (2022) supports the latter in presenting AI employment dynamics as biased in favoring high-skill employees, which causes skill-biased technological change and amplifies wage polarization.
However, much such research remains macro-theoretical and not empirically supported in diverse institutional contexts. Agrawal et al. (2019) describe AI as a “prediction engine”, central to industrial productivity, but their work is not based on an empirical connection to national-level enablers like access to credit or public investment in innovation. Albanesi et al. (2023), for Europe, advise caution even when high-tech aspirations are in place; this is because traditional kinds of employment, shed as a result of automation, are not well compensated in new ICT jobs—the suggestion being that the aggregate gains coming from AI are not well shared and are structurally conditioned.
Aldasoro et al. (2024) provide some monetary policy ideas, such as using AI to stimulate output while constraining inflation, but the cross-country difference in such an effect is underexplored. Moreover, in developmental contexts, Aromolaran et al. (2024) prove that AI investment reduces poverty when diffusion is inclusive and broad-based. That conditionality illuminates the role of diffusion mechanisms, which are typically excluded in texts focusing on AI’s payoff. At the firm level, Babina et al. (2024) document that AI can spur innovation, but market concentration threatens small firms that are lacking the absorption capacity to transform. Bickley et al. (2022) mention that AI is revolutionizing the economics practice itself, but the lack of a harmonized technique inhibits generalizability in such claims.
Such dissimilar works, though thematically substantial, point to a crucial omission: not many reconcile macroeconomic configuration with the empirical modeling of AI diffusion. As aptly commented on by Hoffmann and Nurski (2021) and Gualandri and Kuzior (2024), the firm-level focus in the prevailing scholarship overlooks the role that macro-level policy and national institutions play in shaping diffusion patterns, not least in heterogeneous European economies. The omission is considerable because European countries significantly differ in their digital preparedness, infrastructure, credit markets, and labor market inflexibility.
Bonab et al. (2021) make a normative case for “anticipatory regulation” for the avoidance of AI-promoted growth in inequality. Moreover, Bonfiglioli et al. (2023) link AI adoption in U.S. commuting regions to polarization in cognitive labor, which includes regional disparity—an element perhaps evident in Europe. Brynjolfsson and Unger (2023) present AI as structurally transformative, but Brynjolfsson et al. (2018) note a “productivity paradox,” in which potential benefits are not realized due to under-measurement and late diffusion. Brynjolfsson et al. (2023) note that generative AI is expected to raise productivity for low-skilled labor, but its diffusion remains patchy. The suggestion is that policy and institutional settings are important mediators between AI’s macroeconomic effects. On the behavioral front, Camerer (2018) puts forward the possibilities that algorithmic choice could transform macroeconomic behavior itself. Such results are, however, largely conceptual and lack empirical support. Chen et al. (2024) project various global effects for AI, highlighting infrastructure and institutional absorptive capacity differentials. Cockburn et al. (2018) indicate that AI’s returns in R&D would become even more concentrated, perpetuating innovation inequality. Such warnings, however, lack country-level adoption profiles and therefore provide little guidance for policy.
Comunale and Manera (2024) caution that policy changes for change in technology are late, which can further enhance frictions in labor markets, but Czarnitzki et al. (2023) show that productivity gains from AI vary greatly in knowledge firms. Eloundou et al. (2023), Ernst et al. (2019), and Felten et al. (2018) emphasize task automation and reskilling for labor but are silent about macroeconomic preconditions for smooth transition. Gazzani and Natoli (2024) advocate for inclusive growth using augmentative AI, but structural enablers for such inclusiveness are not fully elaborated.
Thus, the current body of research is thematically well-grounded but structurally incomplete. Although theory recognizes AI’s macro-level implications, no systematic, cross-country empirical research linking AI adoption rates to macroeconomic fundamentals such as trade openness, access to domestic credit, or health spending—the very essence of economic resilience and innovation preparedness—bridges the gap. The current study tries to bridge this fundamental empirical gap.
By means of a dual-method approach—econometric modeling (fixed and random effects) and machine learning algorithms (e.g., K-Nearest Neighbors, Clustering)—the present article explores the national-level macroeconomic characteristics and institutional configurations that can be used in explaining AI adoption in large European firms. With such an endeavor, it responds to demands for methodological innovation and policy-driven empirical scholarship, such as those raised by the following authors: Ruiz-Real et al. (2021); Szczepanski (2019); Trabelsi (2024); Varian (2018); Wagner (2020); L. Wang et al. (2021); X. Wang et al. (2025); Webb (2019); Wolff et al. (2020) and Zekos (2021).
Such, for example, is the case for AI-driven nonlinear macro-behavior requiring high institutional capacity. The idea that AI can exacerbate the offshoring of thinking work, endangering middle-skill occupations, is shown by Webb (2019). The idea that AI’s productivity advantage in healthcare is contingent on public belief and governmental capacities—with the latter being a macro-institutional variable—is related by Wolff et al. (2020). The idea that setting AI’s net social benefits against future public damages requires global cooperation is pointed out by Zekos (2021). Yet, such comments are made in isolation and are seldom embedded in consistent, comparative analyses.
Our study makes a typological contribution in the Cluster analysis of European countries, showing that structurally similar economies can exhibit different AI adoption paths due to institutional mismatch. The paper further provides predictive modeling for estimating diffusion in alternative policy futures—a factor that is not present in the previous scholarship. Finally, in our study, we are not merely descriptive but rather diagnostic and prescriptive, which not only aids theory building but also policy guidance. Lastly, the worth of such research lies in connecting theory and empirics, micro and macro, and even technology and policy. The paper bridges a significant gap in AI scholarship in portraying an institutionally grounded, cross-country research on European adoption dynamics, in advancing knowledge on the European economic, structural, and policy drivers behind digital change.
A synthesis of the literature review according to macro-themes is presented in the following Table 1.

Table 1.
Synthesis of the literature.
Artificial intelligence is not just a technological innovation but a transformative macroeconomic force subject to national institutions, policy, and structural conditions. While existing work hints at AI’s productivity value and risk factors—in such areas as inequality and labor polarization—the bulk of the work is theoretical, firm-level, or U.S.-centric. Understudied in AI adoption are crucial macroeconomic factors like trade openness, credit access, and expenditure on health. Our study fills the gap in the inclusion of panel econometrics and machine learning for an AI diffusion study in European countries. Our study determines structural and institutional factors that provide a novel, evidence-based typology for inclusive and adaptive AI policy formation.
3. AI Readiness in Context: Integrating Macroeconomic and Labor Market Structures into a Framework for Enterprise Innovation
Larger company adoption of artificial intelligence (AI) is now better understood as a result not just of firm-specific preparedness but of broader macroeconomic and labor market configurations. This approach places macroeconomic configuration and labor market characteristics—involving unemployment, labor quality, and institutional flexibility—in a prominent role for shaping the environment wherein larger companies opt to adopt AI. This underlying assumption is that national contexts bestow or withhold enabling systemic preconditions for the integration of AI technologies, and that these systemic preconditions operate themselves through various mediating channels: financial liquidity, exposure to trade, direction of investment, and labor flexibility. While sectoral competition, internet infrastructure, and managerial foresight are pertinent at the company level, macro-level constraints of structural unemployment, capital allocation distortions, or openness to trade have a significant impact on the ability of companies to undertake a technology-transformation decision. This theoretical model draws on extant traditions of national systems of innovation, macro-labor economics, and structuralist development thinking to create a parsimonious but integrated description of the interplay of macroeconomic empirical variables and labor market movements on the adoption of AI amongst larger European firms.
This theoretical model draws on three interconnected theoretical orientations.
3.1. Innovation Systems Theory
Artificial intelligence use among European countries can be realized through a theoretical lens based on Innovation Systems Theory. This conceptual framework regards innovation not as a univocal event but as a consequence of diversified interplays amongst firms, public institutions, labor market structures, and macroeconomic environments (Freeman, 1987; Lundvall, 1992). A system’s ability to generate and diffuse innovation depends not merely on technology availability but, equally, on institutional environment quality and national economic structural cohesion. Based on this framework, macrostability, openness of exchange, health expenditure, and credit availability are primitive factors that dictate the systemic composition of innovation (Gama & Magistretti, 2025). Concurrently, the labor market structure—inferred through formal jobs, precarious work, and industrial labor—either favors or hinders the diffusion of new emerging technologies. Those economies with stable, regulated, and industrially integrated labor systems are more capable of absorbing innovation and grounding it towards sustaining transformative development (Cannavale et al., 2022). This framework, theoretically, encapsulates institutional and structural viewpoints beneath a similar analytical frame, which gives prominence to the complementarity of public policy, labor flows, and technology investment (Purnomo, 2023). This systemic logic further illuminates the differential paths that can be observed amongst countries with equally similar economic features, giving prominence to the internal coherence of the system’s constituents for widespread and sustainable usage of AI. Lastly, technology adoption comes to be realized as an emergent consequence of a national innovation system, rather than being a mere linear function of economic means or of sheer technology capacity.
3.2. Resource-Based View (RBV) of a Macroeconomic Context
Long applied at the firm level, the Resource-Based View (RBV) gains useful explicatory power when generalized to the broader macroeconomic environment of digital transformation. In the bigger picture, national resources like credit availability, trade openness, and technology infrastructure investment are critical firm-level enablers of capacity. The analysis of artificial intelligence (AI) adoption in the article applies this schema, underscoring the structural economic determinants of firms’ capacities to utilize early-stage digital technologies. By the logic of the RBV, the firm can create a competitive advantage from having valuable, rare, inimitable, and non-substitutable resources. When macroeconomic structures supply these preconditions—through the stable availability of finance, market openness, and government technology infrastructure expenditure—they act like systemic resources that supplement the internal resources of firms (Stroumpoulis et al., 2022; Jiang et al., 2024). For instance, countries with high credit availability enable firms to invest long-term in adopting and internalizing AI. In contrast, open trade regimes enable the acquisition of digital technology, including externalities, from outside countries. Investments in infrastructure, particularly in digital connectivity infrastructure, combined with publicly incurred expenditures on research, further lower innovation obstacles and accelerate rapid technology diffusion (Khan et al., 2024). The present article validates the idea that these macro-structural variables are not just backdrops but active technology-transformation agents. Distinguishing country groupings of various adopting AI levels, consistent with country differences in regimes of credit, openness, and government expenditure, reinforces the emphasis of RBV on the resource richness of the environment. Firms operating from macroeconomically supportive settings are better off mobilizing internal capacity, including dynamically responding to new opportunities of AI. In sum, the article announces a macro-level extension of the RBV, where national economic settings constitute resource pools whose dimensions condition firms’ adaptive capacities. This reinforces the widespread sentiment that the success of AI diffusion relies not only on company strategy but equally, if not more so, on the external resource environment.
3.3. Labor Market Adjustment Theory
The Labor Market Adjustment Theory provides a critical lens through which we can analyze national variations in artificial intelligence adoption, as examined in the article. Based on this theory, an economy’s ability to adapt to technological change depends significantly on the labor market setup of the country—specifically, unemployment scenarios and labor market flexibility. High levels of unemployment combined with labor market rigidity are usually a reflection of structural weakness or institutional resistance, which can impede a country from shifting towards new technologies like AI. Employment-related variables—wage employment, vulnerable employment, and industrial employment—are stressed in the article as reflections of labor market health, flexibility, and overall resiliency. Formal-intensive economies with a lower share of vulnerable or informal labor are more likely to record high levels of AI technology absorption. This observation confirms the theoretical hypothesis that labor markets that can reshape the workforce more effectively are better positioned to accommodate technology shocks and restructure work arrangements to accommodate AI (Song, 2024). Moreover, labor market flexibility (operationalized via the hiring, re-skilling, and wage elasticity, mobility of labor) remains a deciding factor for businesses and economies to shift towards digital transformation imperatives (Dave, 2024). In more flexible systems, technology replacement of specific jobs can be offset through brisk entries into new professions, which diminishes social resistance and enables the better diffusion of innovations. This Cluster analysis, introduced in the article, highlights these relationships; they reflect a scenario where countries that benefit from low levels of unemployment and relatively stable labor market arrangements are more accepting of absorbing technology deployments, and they are more efficient at sustainably absorbing them. Thus, these results empirically verify Labor Market Adjustment Theory: structural flexibility and labor market resilience are the major predictors of a country’s ability to shift towards the new-age, AI-led economy. Labor markets are not passive sites but are active agents of technological progress.
Overall, this combined framework demonstrates that the grand-scale enterprise adoption of artificial intelligence (AI) is not merely the result of internal capabilities or sectoral demands; rather, it is profoundly embedded in the broader macroeconomic, institutional, and labor market configurations of each national economy. Drawing on Innovation Systems Theory (Arroyabe et al., 2024), the Resource-Based View of the macroeconomic level (Li et al., 2025), and Labor Market Adjustment Theory (Sultana et al., 2024; C. Wang & Jiao, 2025), the model captures the multidimensional character of AI diffusion amongst the economies of Europe. It demonstrates how technology transformation is anchored through complementarity amongst national innovation ecosystems, the systemic availability of resources, and labor market adaptive capacity. Each of these theoretical lenses, in turn, assists in unearthing new insights regarding the interrelationship between macro-conditionality (such as institutional convergence, financial liquidity, and labor market flexibility), on the one hand, and firm-level innovation decisioning, on the other. Empirical corroboration from the survey substantiates this integration, discovering distinctive national groupings possessing differential absorbing capacity for scaling AI technologies (Arroyabe et al., 2024). This, in turn, reiterates the importance of formulating policy responses that not only intensify firm-level digital preparatory capacity but also—through the creation of an enabling macroeconomic and institutional base—can facilitate the widespread, and therefore inclusive, adoption of AI. Ultimately, effective diffusion of AI flows not from discrete technological advances but from the structural alignment of economic governance, institutional delimitation, and labor market functioning.
3.4. Hypothesis Formation: Linking Macroeconomic and Institutional Contexts to AI Adoption
These macro-level factors not only influence the motivation of firms to invest in AI but, more basically, their capacity to scale and internalize such technologies successfully. Drawing from this theoretical foundation, the study derives the following hypothesis:
H1:
In Europe, large firms’ adoption of artificial intelligence (AI) is associated with national macroeconomic stability, institutional consistency, and labor market flexibility, beyond the capacity level of firms.
4. A Methodologically Integrated Approach to Analyzing AI Adoption: Panel Econometrics Meets Machine Learning
For systematically de-linking the structural and institutional determinants of European AI adoption, this study employs an integrated empirical framework. It complements panel econometric approaches with supervised machine learning processes along with unsupervised Clustering algorithms in pursuit of explanatory robustness, predictive accuracy, and typological differentiation. These paths work in synergistic combination in order to produce a multidimensional view of AI diffusion across European member states. The variable chosen for investigating the adoption of artificial intelligence focuses on the adoption of AI in large European companies. This choice is based on both practical reasons and theoretical and economic policy issues. In theory, such enterprises possess refined organizational structures, significant economic means, and refined management capacities—the primary requirements for absorbing and utilizing refined technologies such as artificial intelligence (AI). Large enterprises possess significantly greater chances of possessing a qualified workforce, refined infrastructures of technology, as well as economic means of efficiently utilizing AI in production and control systems (Ardito et al., 2024; Oldemeyer et al., 2025). SMEs possess structural disadvantages of limited digitalization, limited financial means, as well as technical and strategic capacity shortages, due to which they possess limited potential for utilizing AI in systematic and scale-based manners (Zavodna et al., 2024; Kukreja, 2025). Large enterprises, in any case, not only possess larger potential for innovative capacities, they also possess specific potential for clear productivity as well as capacity gains in operations; additionally, they show gains in improving their commercial offering to customers and stakeholders. Apart from this, adoption in such enterprises possesses multiplier gains across value chains, with indirect impulses towards SMEs occurring towards innovations as well (Ardito et al., 2024).
Panel Econometric Models: Given the multi-country, multi-year nature of the dataset (2018–2023, 28 European countries), panel data models attempt to account for both the cross-sectional as well as time series dimensions, thereby capturing dynamic heterogeneity as well as unobservable country-level impacts. Fixed-effect models perform exceptionally well in controlling unobserved, time-invariant heterogeneity across countries, such as those that occur due to variations in institutional environments, regulation, or cultural perceptions of technological innovations, thereby allowing a more sophisticated causal interpretation of AI adoption’s macroeconomic determinants. In contrast, random-effects models assume orthogonality between the regressors as well as unobserved country-specific impacts, resulting in more efficient estimates, if this assumption holds. Choice between these two designs is aided by the Hausman test, which investigates the consistency of estimators, with ancillary evidence coming in specification diagnostics such as the Breusch–Pagan test and F-tests (Popović et al., 2025). Application of these models determines statistically significant and robust associations between AI adoption (ALOAI) and a variety of macroeconomic indicators, with positive associations with health expenditure, GDP per head, openness of trade, and inflation. At the same time, it identifies, in some instances, unexpectedly adverse associations with domestic credit extended towards the private sector as well as with gross fixed capital formation, indicative of potential inefficiencies or structural mismatches in financial as well as capital resources being deployed in the context of some countries.
Supervised Machine Learning Algorithms: To complement the econometric analysis, we conducted a technical and scientific comparison of eight supervised machine learning algorithms: Boosting, Decision Tree, K-Nearest Neighbors (KNNs), Linear Regression, Neural Networks, Random Forest, Regularized Linear Regression, and Support Vector Machines (SVMs). These models have been trained using normalized data and tested using standard indicators of predictive performance, including MSE, RMSE, MAE, MAPE, and R2 (Tapeh & Naser, 2023; Ozkan-Okay et al., 2024). Among them, KNN emerged as the best-performing algorithm with near-zero prediction error as well as full explanatory power (R2 = 1.000). In order to determine the robustness of these results and reduce concerns of overfitting, a cross-validation exercise has been conducted as detailed in Appendix A. Moreover, dropout analysis using KNN as a framework revealed domestic credit towards the private sector, as well as GDP per capita, and expenditure on health, as the most significant AI adoption drivers, revealing significant roles of internal financial perspectives as well as institutional capacity vis à vis external trade openness in determining the diffusion of tech.
Unsupervised Clustering Analysis: In order to explore latent typologies of AI diffusion in EU nations, a whole range of unsupervised learning schemes was employed, including Density-Based, Fuzzy C-Means, Hierarchical, Model-Based, Neighborhood-Based, and Random Forest Clustering protocols. The analysis applied these procedures to macroeconomic and institutional indicators to uncover structural similarities among countries, revealing distinct patterns in their AI adoption trajectories (Shokouhifar et al., 2024). Inferences derived from such Clusters yield meaningful structures in countries’ responses towards macroeconomic pressures—the likes of inflation shocks (Czeczeli et al., 2024), fiscal policy changes (Andrejovská & Andrejkovičova, 2024), as well as digital labor preparedness gaps (Iuga & Socol, 2024)—thereby enabling further specialized comparative research as well as evidence-based policy design. Such structural convergence research utilizing such a Clustering-based method reinforces multi-method research complementarity, merging causal inference employing panel data models, predictive power employing machine learning, as well as typological insight utilizing Clustering. Such juxtaposition is particularly relevant in spheres such as financial institutions as well as cybersecurity, in which thematic segmentation as well as strategic differentiation signify most (Olasiuk et al., 2023), as well as being in alignment with prevailing research needs in multisectoral empirical underpinnings in AI policy research (Popescu et al., 2024).
A combined methodological design of panel data econometric models, supervised machine learning models, and unsupervised Clustering algorithms has some notable strengths in examining AI adoption in EU countries. Firstly, econometric panel data offer stringent causal interpretability with control of both cross-sectional and temporal variations, and can control unobservable, time-invariant, country-specific factors such as institutional quality or cultural innovation. It enhances internal validity and isolates macroeconomic determinants of AI diffusion with methodological refinement. Secondly, complementation of econometric models with supervised machine learning models such as Boosting, KNN, SVM, and Random Forest, enables the modeling of complex, nonlinear associations overlooked by traditional linear models. With standardized performance indicators such as MSE, RMSE, MAE, MAPE, and R2, it offers a sound comparison of algorithmic performance. KNN emerged as the top-performing model, with validity tested using cross-validation (Appendix A), resulting in greater confidence in inferences with control of overfitting. Thirdly, dropout analysis in the KNN framework provided insights into variable importance, including domestic credit, GDP per head, expenditure on health, and most internal drivers of AI adoption—highlighting financial and institutional preparedness at the expense of external trade-based drivers. Fourthly, unsupervised Clustering algorithms such as Density-Based, Fuzzy C-Means, Hierarchical, Model-Based, and Neighborhood-Based algorithms allow AI diffusion typology identification of latent structures in AI diffusion using structural agglomeration of countries with similar structures with diverging adoption patterns. These Clusters act as rich sources of inputs towards focused policy interventions, highlighting the response of countries at this level towards inflationary pressures, fiscal duress, and labor market shortages. Overall, this multi-methodology is tractable with causal description, prediction modeling, and structural classification under one empirical structure. It is especially insightful as a beacon towards evidence-informed digital as well as innovation policy and is in alignment with current research calls towards multi-methods in AI governance scholarship research (Shokouhifar et al., 2024; Popescu et al., 2024; Olasiuk et al., 2023).
We have used the variables shown in Table 2.
Table 2.
Variables, acronyms, and sources of data.
Some specifications on the definition of the ALOAI variable and on the exclusion of some industrial sectors: Exclusion of agriculture, mining, and as finance industry units from the ALOAI indicator is methodologically and substantively defensible. These units have technologically and structurally distinct profiles, significantly differing from those of units in manufacturing and services. Agriculture, as well as mining, for example, have capital-intensive modes of production with limited digitalization. Although AI applications persist in them—such as precision agriculture or predictive maintenance—the applications are comparatively niche-based and do not pervasively stretch across large enterprises (Hasteer et al., 2024). Finance is, on the other hand, a digital outlier industry with early and sophisticated AI adoption in fields such as fraud detection, algorithmic trading, and customer analytics (Hassan, 2024). The inclusion of this industry would risk muddying cross-industry comparability due to its extremely high degree of digital maturity (Lopez-Garcia & Rojas, 2024). In addition, this industry is subject to a distinct set of regulation schemes influencing AI adoption in ways inapplicable in other industry contexts, thus introducing regulation variable confounders at variance with study goals of establishing the macroeconomic and labor market determinants of AI adoption (Kumari et al., 2022). The inclusion of such structurally distinct industry units would allow us to work towards reducing industry comparability as well as ensuring the coherence of the ALOAI indicator. In addition, the agriculture and mining industry units typically have irregular data coverage in EUROSTAT, mainly due to firm size distributions and confidentiality restrictions (Hasteer et al., 2024). The inclusion of such industry units would compromise the statistical soundness of the study. Exclusion of such units thus ensures a sounder, comparable, and policy-relevant depiction of AI adoption among large enterprises in Europe.
Data Preprocessing and Gap Filling—Implementing Piecewise Linear Interpolation for Missing Values: The treatment of missing data was achieved through the formalization of a piecewise linear interpolatory method across the dataset. It was chosen in conformity with foregoing methodological demands, i.e., its empirical simplicity, low risk of distortion, as well as conformity with the structure of panel data. With such an approach, one can create believable, continuous series within empirical boundaries while preserving comparability across sections. Computational implementation of the method follows and steadfastly the linear formula below, which captures the assumption of a uniform rate of change between known annual observations with the avoidance of overfitting or spurious curvature in interpolated estimates. Specifically, the following formula has been applied:
where is the interpolated value at year t, and are the known values at the bounding years. In Belgium—looking at the period between 2021 (41.44) and 2023 (47.86), for instance—we can see that, in 2022, the interpolated value is precisely the arithmetic mean (44.65), as would be the case in a simple linear interpolating function. In those cases in which only one initial data value is available (e.g., in 2020 or 2021)—as in Germany’s or Croatia’s cases—prior years can be backward-extrapolated along a fixed inclination; meanwhile, successive years are forward-extrapolated until the next available value is reached. Moreover, because no fluctuations or advanced curvatures are demonstrated in such interpolated series, this prevents any adoption of polynomial- or spline-type interpolating methods. Adopted in this way, such an approach ensures temporal homogeneity and continuity over partially completed time series, in addition to offering a smooth, plausible course of history. From a validity perspective, linear interpolation is a well-respected approach in economic research in cases wherein believable endpoint values exist, as well as in cases wherein missing values have to be approximated without injecting artificial deformation. In this case, it allows one to formulate a harmonious dataset that is susceptible to panel and econometric investigations, with stable, interpretable estimates in the succeeding modelling stages (Table 3).
Table 3.
Linear interpolation of missing panel data: constructing harmonized AI adoption time series (2018–2024).
The scientific rationale of applying piecewise linear interpolation in recreating missing annual values of AI adoption is grounded in sound methodological bases of time series work as well as numerical approximation, as illustrated by Dezhbakhsh and Levy (2022). Piecewise linear—in its premise—comprises the idea that, between two empirically observed points, the most objective and the least assumption-laden estimate is the one that progresses at a constant clip. This makes it particularly desirable in economic indicators such as AI adoption, wherein transitions at the annual frequency will tend towards a slow and policy- or wave-dictated progression rather than a spasmodic or unstable progression; this feature is stressed by Niedzielski and Halicki (2023). The theoretical validity of the method lies in its parsimoniousness: it introduces no inflection points, no curvatures, and no extraneous assumptions concerning its functions. By holding observed trends in place in their monotonicity as well as their directionality, it keeps interpolated values mathematically valid; moreover, the values remain intuitively believable and behaviorally consonant in longitudes of adoption data that are forthcoming in economics work (Kwon et al., 2020).
Notably, this method avoids the overfitting tendency of otherwise more detailed alternatives such as spline smoothing or polynomial interpolation. Polynomial interpolation, especially when applied with sparse or irregularly spaced data, is notoriously liable to introduce high-order wiggles unsupported in underlying empirical processes—a condition known as Runge’s phenomenon. Such phantom oscillations, mathematically correct as they stand, can belie true-world interpretations and render the data analytically misleading. Spline smoothing, being less liable to this vice, nonetheless introduces smoothness assumptions at the possible cost of artificial continuity or curvature between points, veiling structural shifts or shocks of economic substance, as Asanjan et al. (2020) illustrated. Moreover, both polynomial-based and spline-based procedures require a dense series of data in order to be reliable; linear interpolation, in contrast, is still reliable with widely spaced observations, as in this instance of missing annual observations in this AI adoption dataset. Also, linear interpolation is accurate to the boundary conditions—not pushing interpolated values outside of the minimum or maximum of bounding data points, a desirable quality in empirical economics, where values above observed values without argument can damage credibility.
Furthermore, linear interpolation satisfies several demands of temporal as well as cross-sectional coherence. Using an identical method across all countries ensures methodological homogeneity, thereby preserving comparability in panel data applications. Applying different interpolation methods across countries—such as splines in some cases and linear approximations in others—introduces systematic variation, potentially confounding subsequent statistical inferences and compromising cross-national comparability. In contrast, the piecewise linear approach provides a neutral, reproducible, and transparent base for cross-country comparison. Methodological transparency further allows replication, auditability, and conformity with expectations of peer-reviewed economic research. Thirdly, in practice, linear interpolation is feasible with downstream processes such as fixed-effects panel regression, time-differencing, and Clustering analyses, which do not require further corrections of models or tuning of parameters. It is compliant with the principle of parsimony in epistemology—embracing simplicity as a sufficient explanation in scenarios in which data does not justify added complexity. Overall, piecewise linear interpolation utilized in this case is not only technically a sufficient choice with regard to the structure of data but is scientifically defendable and it is balanced with analytical rigor and empirical realism (Shi et al., 2023). A synthesis is represented in Table 4.
Table 4.
Piecewise linear interpolation of missing annual AI adoption values: harmonizing panel data across European economies (2018–2024).
Finally, piecewise linear interpolation as employed herein is a methodologically valid and empirically meaningful solution in reconstructing missing annual values in AI adoption levels between countries. Its merits include its simplicity, its computationally transparent handling of values, and its allowance of both temporal and cross-sectional comparability assumptions in panel data applications. In contrast with such polynomial-based solutions as would impose unrealistic curvature or hide substantial economic changes, linear interpolation ensures directionality homogeneity without generating trends. It ensures interpolated values move strictly between known values of points with integrity, as well as the plausibility of the reconstructed series, as illustrated by the data for Belgium in 2021–2023. Moreover, as a procedure, it accommodates sparse or irregularly distributed values well without risking overfitting or artificial smoothing with elaborate schemes. Applying a uniform procedure across countries ensures methodological homogeneity in the research process, thereby preventing non-random noise or distortions in subsequent econometric modeling. It also enables replicability, auditability, and adherence to the expectations of standards of economic research. Overall, this approach achieves the research objective of generating a harmonized, continuous dataset enabling a robust, interpretable, and policy-informed longitudinal research analysis, without sacrificing empirical realism.
5. Understanding AI Diffusion in EU Enterprises: Evidence from Fixed- and Random-Effects Models
To understand the macroeconomic determinants that lead large European enterprises to embrace artificial intelligence (AI) technologies, our study employs a metric-driven panel data approach with fixed-effects and random-effects estimates. The dependent variable, ALOAI, represents a percentage of enterprises with 250 or more employees having a minimum AI technology form, based on Eurostat data and excluding agriculture, mining, and financial sectors. The study examines a panel of 28 European nations observed in 2018–2023. Our study objective remains to estimate the effect of a macroeconomic indicator on key areas, including health expenditure, domestic credit, exports, GDP per capita, capital formation, inflation, and trade openness, impacting AI diffusion across nations and over time. Based on a comparison between performance and coefficient values between fixed-effects and generalized least squares (GLS) random-effects models, our study intends to establish statistically significant AI adoption predictors and assess their relative contributions.
We have estimated the following equation:
where i = 281 and t = [2018; 2023].
The econometric results are shown in Table 5.
Table 5.
Panel data estimation of macroeconomic determinants of AI adoption: fixed-effects and random-effects model results (2018–2023).
The panel data analysis of the adoption of artificial intelligence (AI) by large European enterprises provides important evidence on the macroeconomic drivers of technological diffusion among firms. This analysis employs fixed-effects and random-effects (GLS) econometric models, utilizing 151 observations and a comprehensive set of macroeconomic indicators, including current health expenditure (HEAL), domestic credit to the private sector (DCPS), exports of goods and services (EXGS), gross domestic product per capita (GDPC), gross fixed capital formation (GFCF), inflation as measured by the GDP deflator (INFD), and trade openness (TRAD). The results demonstrate the strong influence of these economic variables. Empirical research by Doran et al. (2025) supports this methodological approach, analyzing automation systems across European industries and confirming that the structure of economic sectors plays a crucial role in technology adoption. Similarly, Buglea et al. (2025) apply panel data to study Central and Eastern European countries, affirming that both structural and macroeconomic factors significantly shape technology adoption. The fixed-effects estimation, which accounts for unobserved heterogeneity among countries, identifies several variables with statistically significant impacts on AI adoption. Notably, health expenditure has a highly significant and positive impact (coefficient = 3.969, p < 0.01); this suggests that increased public spending on health may enhance institutional capabilities or support personnel investment, both of which could facilitate the deployment of AI. This positive significance is consistently observed in the random-effects estimations (coefficient = 3.690), reinforcing the robustness of the results across different estimation techniques. The version of the analysis based on the fixed-effects and random-effects (GLS) econometric models, with 151 observations and on the complete range of macroeconomic indicators available (current health expenditure, HEAL; domestic credit to the private sector, DCPS; exports of goods and services, EXGS; gross domestic product (GDP) per capita, GDPC; gross fixed capital formation, GFCF; inflation as captured by the GDP deflator, INFD; and trade openness, TRAD), provides strong evidence for the economic variables’ influence. Empirical work by Doran et al. (2025) provides support for the methodological approach. These authors analyze European industry automation systems and confirm the key role of economic sector structures in dictating technology take-up. Buglea et al. (2025) apply panel data on Central and Eastern European countries to analyze the adoption of digital transformation and confirm the role of structural and macro-variables in shaping technology adoption. The fixed-effects estimation, accounting for unobserved heterogeneity of countries, identifies various variables with statistically significant impacts on the adoption of AI. Health expenditure has a highly significant and positive impact (coefficient = 3.969, p < 0.01), implying that increased public spending on health might reflect both wider institutional capabilities or investment in personnel, not independently contributing to the potential deployment of AI. The exact significance and positive impact are replicated in the random-effects estimations (coefficient = 3.690), establishing the robustness of the results to different estimation techniques.
Another significant finding is the statistically significant and negative impact of domestic credit to the private sector (DCPS), with a coefficient of −0.286 in fixed effects and −0.159 in random effects, which are significant results at standard levels. This unexpected finding suggests that, in some economies, financial richness does not necessarily imply innovation support or digital transition; rather, it can imply capital utilization inefficiencies. Wagan and Sidra (2024) overcome a similar complexity by highlighting how—with massive investments in AI—countries can differ in their efficiency in using venture capital. Goods and services exports (EXGSs) also produce a stable and significant negative link with AI adoption in both models, with coefficients of −2.152 and −1.726, respectively. This finding may suggest that, with their overwhelming orientation into classical export-led development models, traditional economies tend to lag in digital innovations, possibly owing to path dependency associated with low-tech or labor-intensive formation patterns, or structural inelasticities blocking disruptive technology adoption. The finding corresponds with Abdelaal (2024), who indicates that conventional structure-dominated economy types lag in their reallocation of resources to the high-tech sectors of AI implementation. GDP per capita (GDP) makes a small but statistically significant positive contribution, suggesting that wealthier economies, as theorized, are more likely to adopt AI technologies.
Meanwhile, magnitude remains small (0.000579 in fixed effects and 0.000753 in random effects), suggesting that, by itself, GDP’s problem remains not dominant but a constituent factor in the broader set of facilitating factors. The finding corresponds with those by Žarković et al. (2025), who report that GDP per capita’s contribution to economic modernization shows significant heterogeneity between old and new joining EU nations. Their study upholds a presumption from a theoretical perspective that additional structural determinants shape divergent development patterns and technology dissemination processes.
Gross fixed capital formation (GFCF), quantifying investments in infrastructure and productive assets, unexpectedly produces a negative and significant coefficient in both specifications. We have raised critical questions regarding the allocation of investment flows—specifically, whether investors predominantly direct capital toward conventional physical assets rather than intangible or digital infrastructures, essential for effective AI integration. The result is consistent with evidence from Giannini and Martini (2024) on enduring regional heterogeneity in economic structure and innovation preparedness throughout the European Union, many of which are likely to bias the efficiency of traditional spending. Inflation (INFD), quantified by the GDP deflator, has a positive and significant impact on the adoption of AI; this perhaps captures the instance of moderate inflation accompanying vigorous investment environments or policies with the aim of expansion that support digital innovation. Last, trade openness (TRAD) exerts a strong positive and highly significant influence in both specifications (estimates of 1.058 and 0.855), affirming that access to world markets is a stimulus for the adoption of AI. Such mechanisms as exposure to foreign competition, technology transfer, and integration into foreign-led global value chains likely drive this outcome. Empirical evidence from Nguyen and Santarelli (2024) supports this interpretation, showing that open European economies benefit substantially from AI-related spillovers due to their higher degree of global integration. Statistically, the fixed-effects (FE) specifications demonstrate significant explanatory power, with an R-squared value of 0.924 and a significantly high F-statistic (F = 41.706); these values indicate that the considered regressors explain a large proportion of variance in the dependent variable. Both random-effects (RE) models yield statistically significant estimates as well (Chi2 = 75.88, p < 0.00001). There does not exist any systematic distinction identified between the two models’ estimators; however, as per the Hausman test (Chi2 = 8.057, p = 0.328), this observation suggests inconsistent RE estimates as being valid under test assumptions. It is necessary to clarify, though, that the non-rejection of the null in the Hausman test does not imply that RE is superior, nor does it invalidate FE as a specification. It only suggests there is no statistical distinction in coefficient estimates between the two methodological approaches. FE selection cannot thus simply base itself on the Hausman result but on a broader statistical and theory-based appraisal. In this regard, whilst in no way questioned in this research study, there is substantial diagnostic evidence in favor of FE. Firstly, there is conclusive evidence of unobserved heterogeneity with both the F-test of group intercepts F = 17.36, p ≈ 0.00, as well as of substantial heteroskedasticity using the Breusch–Pagan test of heteroscedasticity Chi2 = 158.842, p ≈ 0.00. Both of these findings suggest support for FE due to its superior adaptability in controlling unobserved, time-invariant characteristics at the country level, such as institutional environments, structural features, and long-term socio-economic changes—these, unless controlled, can lead to biased inferences. Despite the Durbin–Watson statistic (~0.59) hinting at moderate autocorrelation, the estimates remain valid in terms of significance and stability. Both theory-based arguments and diagnostic evidence thus suggest support for using the fixed-effects approach. There shall be no uncertainty in the final text that such a choice is not one of test results individually, but one of an integrated appraisal by data structure as well as research objectives.
Ultimately, these results affirm a multidimensional and sometimes non-monotonic correlation between macroeconomic markers and the adoption of AI. Structural drivers such as spending on health, financial stability, and integration into trade are available to underpin digital innovation. In contrast, variables traditionally associated with development, such as capital and the formation of credit, are not necessarily positively correlated in all cases. Tiutiunyk et al. (2021) argue that, although macroeconomic stability in European economies is positively correlated with digital transformation, its interaction with traditional growth variables such as credit and capital is more complicated and varies depending on the circumstances. Increasing levels of access to investment or credit will be insufficient. They must direct support toward activities that foster innovation and are backed by institutional preparation. For example, Iuga and Socol (2024) demonstrate how institutional variables significantly influence the readiness of European member states to adopt AI, and complacency in bridging these gaps will leave brain drain exposed, especially in the less-developed European regions.
Furthermore, the goodness of fit of the models reinforces the importance of macroeconomic policy in shaping the digital competitiveness of European economies. With rising salience placed on the adoption of AI as a driver of industrial modernity and economic resilience, such a macro-booster to adoption can feed into more targeted and effective interventions, both in member states and in the European Union. For example, spurring adoption of AI is not about more investment of assets but strategic coordination of finance systems, trade policy, health infrastructure, and digital plans to provide the canvas onto which innovation can seize. Such holistic strategic coordination is consistent with evidence by Challoumis (2024), who argues that AI is remapping economic fundamentals and calling on fiscal and innovation policies to make space in turn to accommodate a new finance paradigm. The macroeconometric robustness of the models, in particular the large R-squared of the fixed-effects formulation and p-value convergence between estimators, reinforces the importance of such inferences. Notably, the conclusions push policy to be strategic and dimensional, balancing macroeconomic planning and digital innovation ambitions.
This is not just about enhancing health systems and participating in international trade; it is about aligning lending and investment channels to facilitate capabilities entirely digitally. Meanwhile, among the significant sources of economic competitiveness and resilience—especially in Europe’s wider digital and green transformations—this question confirms policymakers’ need to underpin the macroeconomic foundations that can lead to the success of AI technologies in business.
From Job Quality to Tech Readiness—Labor Market Determinants of AI Diffusion: In recent years, the adoption of artificial intelligence (AI) technologies by firms has been the target of wide-ranging debates about their implications for the work market. On the one hand, AI has the potential to boost productivity, streamline business processes, and create new economic opportunities. On the contrary, it generates mounting concerns about the replacement of human work—particularly the work that is repetitive and requires low skills—due to automation and cognitive systems. Such a tension between the virtue of technological inventiveness and the disruptive force of work raises questions about how the nature of the work market affects the adoption of AI in a variety of national contexts. The model includes six explanatory variables which encompass the salient aspects of the work market: the share of employers among total employment (EMPL), work in services (SERV), the share of self-employed workers (SELF), the unemployment rate (UNEM), the share of workers with vulnerable employment (VEMP), and the share of waged and salaried workers (WAGE). Such a model aims to clarify the way the structure and the quality of the work market shape the capacity and the will of firms to adopt AI technologies. Understandings of such inter-relations are, indeed, of central importance, not only as a means of interpreting the current trends in AI diffusion, but also as a guide for the design of public policy which promotes the digital transformation of the economy as well as inclusive work market evolution. We directly estimate the following relationship. We applied three different econometric approaches—panel data with fixed effects, panel data with random effects, and dynamic panel data models—to capture this relationship. By utilizing a multi-method design, we guarantee the robustness of the estimates and better capture the way in which labor market circumstances influence the adoption of AI over time and across countries. Our empirical coverage extends to 28 European countries over the 2018–2023 interval, providing an exhaustive overview of AI diffusion as it applies to labor market behavior in different national settings.
We estimated the following equation:
where i = 28 and t = [2018; 2023].
The presented model is designed with the aim of analyzing the determinants of artificial intelligence (AI) adoption by large European enterprises. The dependent variable, ALOAI, represents the percentage of firms with at least 250 employees that use at least one AI technology, such as machine learning or image recognition. The regression equation includes six explanatory variables, all related to the structure and quality of the labor market: the share of employers in total employment (EMPL), employment in the service sector (SERV), the share of self-employed workers (SELF), the unemployment rate (UNEM), the percentage of workers in vulnerable employment (VEMP), and the proportion of waged and salaried workers (WAGE). The dataset consists of 28 cross-sectional units observed over six years, totaling 168 observations. We used three different estimation techniques: a random-effects model (GLS), a fixed-effects model, and a dynamic panel model that includes the lagged dependent variable, ALOAI. The figures suggest strong consistency between the different specifications. EMPL is statistically significant and harmful for the fixed- and random-effects models. The notion that the share of the labor market that is occupied by employer-established firms does not need to encourage AI adoption comes as a surprise. However, this finding may reflect the nature of these family-centric, relatively small business firms; they are often reluctant to use financial resources, and prefer a classic business model (Hoffmann & Nurski, 2021). For both the fixed- and random-effects models, the coefficient comes up as −20,000, which reveals a qualitatively significant influence.
In contrast, service sector work (SERV) exerts a considerable and significant influence in a positive direction on AI adoption. This result aligns with the ongoing European economic digital transformation, whereby the service sector accounts for the leading provider of technological innovation (Gualandri & Kuzior, 2024). Sector segments like information technology, health, education, and financial services are becoming highly integrated with AI-related applications. The considerable positive relationship reflects the larger need and implementation capability for AI technologies for such segments. Such a constructive influence holds for all models, which vary the coefficient between about 1.1 and 2.9 with the specification.
Self (SELF) is another variable that shows a significant positive correlation with ALOAI, as the variable accounts for the percentage of self-employed individuals. The result shows that, the greater the proportion of self-employed individuals, the greater the AI adoption of big firms. That might reflect a dynamic and innovation-oriented entrepreneurial environment. An environment conducive to business startup, specifically the tech sector, might similarly have a positive effect on big firms through the diffusion of the innovations generated by startups and freelancers (Spagnuolo et al., 2025). Also, greater self-employment might reflect greater use of information and communication technologies, which in turn makes the adoption of AI technologies easier.
Another significant variable exhibiting a negative and statistically significant association with AI adoption for all the models is the unemployment rate (UNEM). This result bolsters the proposition that, for the countries undergoing labor market difficulties, firms have a weaker capacity to innovate and adopt new technologies. Unemployment tends to go hand-in-hand with undesirable macroeconomic conditions, fewer funds available to firms, and a lower need for firms to compete, all of which may discourage the adoption of AI solutions (Dave, 2024).
Similarly, the variable VEMP—which depicts the share of workers engaged in vulnerable employment—reveals a negative and significant coefficient for two of the three models. The economic and social relevance of the variable becomes important: significant labor market vulnerabilities often translate into informal work, precarious contracts, and inadequate social protection. In such a situation, companies are likely to have fewer formalized units and are reluctant to incur the substantial first costs of such advanced technologies as AI. They are likely to lack the skilled workforce required for the effective adoption of such instruments (Du, 2024). Moreover, decentralized and precarious labor markets could reflect the wider structural vulnerabilities of the economy that hinder its innovative capabilities.
In contrast, the coefficient of WAGE, the proportion of waged and salaried workers, is positive and statistically significant in all models. That means that, the wider the coverage of formal, secure work, the higher the probability that firms will employ AI technologies. This finding stresses the importance of a well-structured labor market as a precondition for technological innovation. Salaried work also reflects the fact that firms are larger and better structured, with access to the financial resources required for long-term investment in technology. Those firms have, as a general rule, formal procedures along with a workforce enjoying the benefits of labor protection, which are helpful when it comes to the adoption and implementation of AI systems.
In the dynamic model, the lagged dependent variable ALOAI(t−1) enters with a significant and very high coefficient (0.87), indicating strong temporal persistence of AI adoption. Firms adopt AI during a year with a very high likelihood of continuing and broadening it during subsequent years. The dynamic reflects a cumulative process, such that initial adoption produces subsequent learning, adaptation, and cumulative consolidation as time progresses. The significant dynamic effect highlights the importance of public policy instruments that compel firms to venture into such a cumulative process, as it seems self-sustaining.
More broadly, the analysis reveals that the labor market’s structure and quality are central drivers of the adoption of AI technologies by firms. Economies with formal, stable, and service-oriented labor forces are better equipped for AI adoption. By contrast, conditions with widespread unemployment, precarious employment, and a greater prevalence of less formal types of employment have lower AI-diffusion rates. Among the policy lessons, these have significant implications for the articulation of public policy design. Supporting labor formalization, investment in the services sector, enabling innovative entrepreneurship, and combating unemployment are all policy approaches that simultaneously strengthen the labor market and encourage the digital transformation of the economy.
Also, the strong dynamic effect obtained for the panel model shows that policy should not just try to stimulate first AI adoption; it should also stimulate firms through their whole process of technological integration. Policies of this kind include the offering of training programs, technical services, and improved access to funds for investment in digitization. By shaping the right innovation context and reducing the first adoption barriers, public policy can have a decisive influence in hastening the diffusion of AI to the main areas of the European economy (Table 6).
Table 6.
Labor market determinants of AI adoption: Fixed-effects, Random-effects, and dynamic panel estimations (2018–2023).
Statistical results and diagnostic tests of the three estimated models—random-effects (GLS), fixed-effects (within estimator), and the one-step dynamic panel—provide a complete picture of the robustness and validity of the relationship between the labor market variables and the adoption of AI by major European enterprises. The dependent variable for all models is ALOAI, which sets the percentage of major enterprises adopting at least one AI technology (Gualandri & Kuzior, 2024). Let us start with the random-effects model. We have a total of 168 observations from 28 cross-sectional units over six years. Log-likelihood of the model is −658.48, while the Akaike and Schwarz information criteria are 1330.96 and 1352.83, respectively. The sum of the squared residuals is high (around 24,963), and the standard error of the regression is quite sizable at 12.41. They indicate that, while the model explains a part of the variation in AI adoption, the explanatory power of the model is mainly about the remaining variation (Popović et al., 2025). Between-group variance is 119.87, while the within-group variance is 32.31, revealing much heterogeneity both across and over the periods. The estimated rho value, which shows the proportionate amount of variation as a result of individual-specific effects, is about 0.38. That means 38% of the total variation in the ALOAI is a result of differences rather than the periods, that is, the countries. The estimated results are better as per the explanatory power of the model. The model produces an R-squared value of 0.3376, while the LSDV R-squared (least squares dummy variable) is remarkably high at 0.9031, indicating that the model explains more than 90% of the total variation in AI adoption when it controls for all country-specific effects (Wagan & Sidra, 2024). The related F-statistic (F(33,134) = 37.82) is highly significant with a p-value nearly equal to zero, which reveals that the joint impact of the regressors and fixed effects is statistically significant. Log-likelihood improves considerably while shifting to the fixed-effects model, going up to −511.33, while the Akaike and Schwarz criteria improve to 1090.67 and 1196.88, respectively.
These improvements imply better model fit than the random-effects specification. The standard error of regression is also reduced to 5.68, implying improved precision. However, the Durbin–Watson statistic remains low, at 0.911 for both models, indicating the possibility of the existence of serial correlation in the residuals. For the dynamic panel model, which includes a lagged dependent variable, the sample size reduces to 112 observations as the first period is lost during dynamic estimation. We have a very high coefficient for the lagged dependent regressor ALOAI(-1) of 0.87, which is statistically significant at the 1% level. This result confirms the existence of strong path dependency for AI adoption: the history of past AI adoption of a country strongly predicts the country’s continuing AI adoption in the following years (Spagnuolo et al., 2025). We obtained a Sargan over-identification test Chi-square statistic of 60.60 with a p-value of 0.0000, which rejects the null hypothesis of valid over-identifying restraints. This result could imply the existence of possible problems affecting the instruments used during the model. However, the results of the Arellano–Bond tests for serial correlation are reassuring. We have the AR(1) test significant (z = −2.60, p = 0.0092), as expected when first differences are used.
In contrast, the AR(2) test yields no significant results (z = −0.08, p = 0.9357), supporting the validity of the dynamic model, as there is no evidence of a second-order effect. Several specifications and robustness tests similarly inform the model choice. We have the decisive rejection of the null hypothesis of zero variance for the random effects by the Breusch–Pagan test, with a Chi-square of 208.93 and a p-value effectively set as zero. We have proved the existence of significant unobserved heterogeneity across countries (Atajanov & Yi, 2023). However, the Hausman test gives a decisive result arguing for the fixed-effects model choice. We have the consistency of the GLS random-effects estimator tested as compared to the fixed effects, which comes out with a Chi-square statistic of 23.51, a p-value of 0.0006, and the rejection of the null hypothesis that the random-effects estimator becomes consistent (Yum, 2022). We have the regressors violating the primary assumption of the random-effects model, correlating with the individual-specific effects.
The joint tests for the regressors also confirm the relevance of the model specifications accordingly. For the fixed-effects estimation, the F-test of all the regressors (F(6, 134) = 11.38) appears significant at a very high level, while the p-value comes to about 2.92 × 10⁻¹⁰. For the Wald test in the case of the dynamic model, similarly, the joint significance of the regressors included appears to hold, while the Chi-square statistic comes to 228.35, as the p-value remains well below 0.01. These values certainly create no doubt about the explanatory power of the used regressors (Bustani et al., 2024). Additionally, the test of differing group intercepts in the case of the fixed-effects model strongly rejects the null of a common intercept common to all the included countries. An F-statistic of 20.00 with a p-value effectively at zero reveals that country-specific factors are indeed significant and cannot go unnoticed, further confirming the validity of the applicability of the fixed-effects model.
On the whole, the collectively indicated set of statistical tests and diagnostics tends towards the fixed-effects model as the best-specifying model for the characterization of AI adoption among large European firms. It fits better, has higher explanatory power, and satisfies the several assumptions that are violated by the random-effects model. The dynamic panel model similarly gives significant insights, primarily about the persistence of the adoption of AI over time. However, we have exercised some caution regarding the validity of the instruments used. Collectively, the estimates are statistically robust and have significant policy implications about the role played by the characteristics of the labor market while shaping the adoption of technology.
The econometric investigation of 28 European nations during the 2018–2023 period sheds light on how the structural features of the labor market have a substantial impact on the adoption of artificial intelligence (AI) technologies by significant numbers of enterprises. Outcomes, robust for fixed-effects, random-effects, and dynamic panels, reflect several statistically significant associations. A higher share of employers relative to total employment reveals a negative association with AI adoption, which posits that economies with a predominance of scarce, frequently family-managed firms are less likely to adopt highly advanced technologies. Employment in the services sector, conversely, reveals a robust positive association, which reflects the significant role played by services as drivers of the digital innovation impulse. Analogously, a higher percentage of self-employed people reveals a positive association with AI adoption, possibly indicating a dynamic environment of entrepreneurship that optimally benefits the process of technological diffusion. Elevated percentages of unemployment and higher percentages of staff occupied in precarious work, conversely, indicate a negative association with AI uptake, which signals the limitations imposed by the volatility of the labor market upon innovation. A higher percentage of waged and salaried workers reveals a positive association with AI adoption, which reflects the notion that the highly formalized and structured labor markets are optimally better suited to the process of technological investment. The dynamic panel model, finally, reveals robust persistence of AI use throughout the observation period, as testified by the existence of a significant and higher coefficient of the lagged dependent variable, revealing that, when initiated, AI adoption widens and perseveres, possibly as a consequence of the investment undertaken by the enterprise. Such a finding has policy implications. For the enhancement of the formalization of the labor market, combating the rates of unemployment, facilitating innovative initiatives within the services sector, and boosting entrepreneurship can permit a healthier framework that prefers AI adoption. Additionally, public policy must not merely catalyze the entry of adoption; instead, it must stimulate enterprises through the complete process of their absorption of technology, through the provision of information programs, as well as the provision of better access to funds. Generally, the discussion reveals that the effective diffusion of AI depends upon both technological readiness and inclusive and stable forms of labor market institutions.
6. Decoding AI Adoption in Europe: A Comparative Evaluation of Predictive Models and Macroeconomic Drivers
To complement inferences derived from panel data regression estimates, the subsequent analysis shifts the focus to a machine learning orientation. Econometric techniques interpret causality based on exogenously specified assumptions and the average effects of macroeconomic and labor market variables on AI uptake. However, they sometimes fail to model complex, nonlinear relationships between predictors. Machine learning algorithms, in contrast, seek maximal prediction accuracy and can discover latent structures in data without subjecting them to strong parametric constraints. The use of supervised learning algorithms such as K-Nearest Neighbors (KNNs), Random Forest, and Support Vector Machines (SVMs) provides a robustness check against the econometric findings, as well as alternative insights about which variables matter and about generalizability. The shift toward machine learning methods then complements the empirical strategy, as well as making for both methodological triangulation and further findings pertinent to policy.
This section performs a comparative analysis on eight regression models, i.e., Boosting, Decision Tree, K-Nearest Neighbors (KNNs), Linear Regression, Neural Networks, Random Forest, Regularized Linear Regression, and Support Vector Machines (SVMs). We evaluated the models using standardized performance metrics, such as the root mean square error (MSE), root mean square error (RMSE), mean absolute error (MAE/MAD), mean absolute percentage error (MAPE), and coefficient of determination (R²). They normalized all input data prior to evaluation to ensure unbiased and consistent comparisons across models. Our selection of machine learning algorithms in this work—K-Nearest Neighbors (KNNs), Random Forest, Boosting, Support Vector Machines (SVMs), Decision Tree, Linear Regression, Regularized Linear Regression, and Neural Networks—was an intentional attempt at ensuring methodological diversity, predictive power, and adherence with the dataset’s characteristics, in addition to the study’s objectives. These models have been selected in this work because each of them has specific achievements in handling nonlinearities, high-dimensional data, and varied levels of interpretability (Assis et al., 2025; Khan et al., 2020; Sutanto et al., 2024; Walters et al., 2022). KNN was a controversial selection because of its non-parametric method of viewing local patterns of complex, high-dimensional data. KNNs have a propensity for being selection-sensitive as well as prone to possible overfitting; thus, we counterbalanced such drawbacks with procedures of cross-validation in Annex A. Random Forest was a controversial selection because of its propensity for ensemble learning, in addition to its reduction in variance (because of the pooling of hundreds of Decision Trees); moreover, it shows increased predictive accuracy, irrespective of the examples of multicollinear or noisy data, though this comes at the cost of interpretability in some way (Sutanto et al., 2024; Assis et al., 2025). A Gradient Boosting algorithm was utilized because of its continuous focus on the correction of the errors of preceding models, with the possibility of attaining high precision and sensitivity in the differentiation of subtle data patterns. However, this comes with the requirement of subtle fine-tuning in order to not be affected by overfitting or computational expenses (Walters et al., 2022). SVMs have been utilized in high-dimensional spaces, and in applications where resistance to the presence of outliers is important (Assis et al., 2025; Khan et al., 2020). Decision Trees constitute a transparent baseline model that means it is simple enough to visualize and interpret the data of the model (Sutanto et al., 2024). We have employed Linear Regression and Regularized Linear Regression models (e.g., Ridge, Lasso) as baselines to evaluate the performances of more complex models. They were used to apply regularization procedures to prevent overfitting and address multicollinearity (Khan et al., 2020). Neural Networks raised some interest in order to explore the probable capacities of modeling extremely nonlinear associations; however, they are computationally intensive and opaque (Khan et al., 2020; Walters et al., 2022). This heterogeneous set, as a whole, enables the comparability of performance trade-offs between simplicity and complexity and between interpretability and accuracy; thus, we have been able to facilitate a richer, more robust and policy-relevant modeling of AI-adoption determinants. The objective here is to explore each model’s predictive capacity and generalizability in predicting AI uptake in large firms in Europe. Mainly accompanied by model benchmarking, this section also includes a study on KNN-based feature importance using mean dropout loss for ranking macroeconomic factors according to their contribution toward AI uptake. Such analyses offer both methodological insights and policy-relevant evidence on the structural economic variables that condition AI diffusion in different national contexts. Figure 1 presents the comparative results of the regression models.
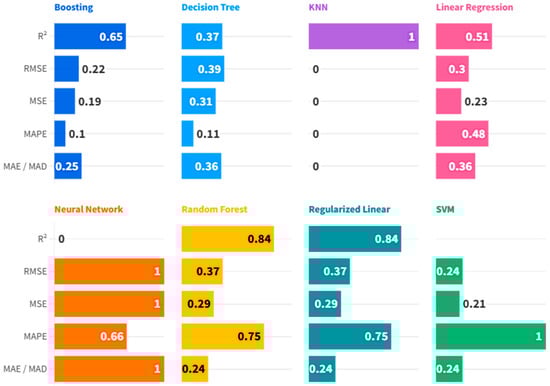
Figure 1.
Performance comparison of regression algorithms based on standard evaluation metrics. All input data were normalized to ensure comparability across models.
In comparing the performances of eight regression models—Boosting, Decision Tree, K-Nearest Neighbors (KNNs), Linear Regression, Neural Networks, Random Forest, Regularized Linear Regression, and Support Vector Machines (SVMs)—our consideration is on the same five basic statistical measures of mean square error (MSE), root mean square error (RMSE), mean absolute error/mean absolute deviation (MAE/MAD), mean absolute percentage error (MAPE), and coefficient of determination (R2). These measures are essential indicators of how well the models fit, are stable, and generalize to unseen data. Lower values in MSE, RMSE, MAE/MAD, and MAPE indicate better prediction accuracy, model stability, and generalization to unseen data. Of all the models tested, KNN shines with near-perfection in all the measures of evaluation with MSE, RMSE, MAE/MAD, and MAPE of 0.000 and R2 of 1.000. The outcome denotes a perfect match between predicted and observed values, resulting in zero error. Though such kinds of performances are scarce in actual practical use and might be suggestive of overfitting, data leakage, or data with too-low complexity, the results as they are set put KNN in the list of best performers and the top algorithm in this comparison. The application of KNN in environmental disciplines—as demonstrated by Raj and Gopikrishnan (2024) in vegetation dynamics modeling—highlights the algorithm’s effectiveness with highly ordered, feature-rich data. The second-best is Boosting, which performs well with an MSE of 0.187, an RMSE of 0.222, an MAE/MAD of 0.247, an MAPE of 0.100, and an R2 of 0.650. These results indicate that Boosting provides an excellent balance of low deviation and decent explanation of variance, making it well-suited for practical use, especially in complicated or more noisy environments. SVMs perform reasonably well based on mean deviation with an MAE/MAD of 0.241, which is better than those obtained using Boosting and Random Forest. However, it has the worst MAPE of 1.000 and thus significantly loses credibility in matters of percent-based precision, such as financial prediction or health prediction. In addition, the R2 of 0.248 is relatively low and represents little power to explain the dependent variable’s variance. Such volatility in SVMs is also witnessed in education analytics, where Kumah et al. (2024) observed such shortcomings in identifying nonlinear behavior in the prediction of students’ performance, especially with the involvement of categorical variables or in the case of badly scaled variables.
Conversely, Regularized Linear Regression and Random Forest have almost identical MSE values of 0.293, RMSEs of 0.374, MAE/MADs of 0.242, and R2s of 0.841. However, both models have significant errors in the form of MAPE (0.750), with poor relative prediction precision. Despite that, their big R2, though not always linked with low MSE, reveals they are useful in instances when capturing the general trend—not specific values—is the objective.
Chandra et al. (2024) also demonstrate such a balance between error-based measures and variance explanation when comparing different machine learning models used to predict production processes. They commend Random Forest for its ability to match trends but criticize it for its sensitivity to outliers. Decision Tree is no better on most measures. Its MSE and RMSE (0.310 and 0.388, respectively) are among the largest, with their MAE/MAD (0.361) and R2 (0.370) values also being among the largest. Decision Tree performs decently only on the MAPE measure (0.107), showing slightly better relative error than Random Forest and SVMs. Vijayalakshmi et al. (2023) also illustrate these frailties in their prediction of medical insurance prices, where they found that regression models provided more stable relative performances across both absolute and percentage metrics. Linear Regression produces slightly better results, yielding an MSE of 0.230, an RMSE of 0.298, an MAE/MAD of 0.357, and an R² of 0.510. These outcomes are considered average and reflect a respectable balance between model complexity and generalizability, though they do not excel in any particular metric. Last—and best of all the models (though still very poor)—is the Neural Network, with the greatest possible MSE, RMSE, and MAE/MAD (all equal to 1.000) values and the lowest possible R2 (0.000); the results suggest that it is not able to learn any functional mapping of the features to the target. Its MAPE of 0.658 supports this. Such a low performance can be due to either the poor optimization of the architecture, insufficient training data, or a network that is too deep to be processed by the dataset. Elnaeem Balila and Shabri (2024) evidence the same weakness in the model in a property price prediction application, with deep models performing poorly with simpler models, owing to overfitting and data-poor generalization.
Among all the examined models, K-Nearest Neighbors (KNNs) achieved the finest all-around performance, with minimal error rates and retaining all the target variable’s variance. However, such ideal results must, of course, give us pause for concern regarding overfitting and poor generalizability, in the event the model has memorized cases rather than having identified powerful patterns. In correction, we employed hold-out testing and cross-validation before even considering the KNN for release. With consistency of performance for the portions of the data, KNN is the optimal solution for accuracy-driven scenarios. When transferability and robustness are prioritized, Boosting is a more trustworthy solution. It will always yield a better error reduction vs. the generalizability of the model trade-off. Following this are Regularized Linear Regression and Random Forest, which have the same explanatory power but have relatively higher residual errors. The Support Vector Machines (SVMs), despite their low MAE, produced high MAPE values, and so they are not favored in applications in which proportional accuracy is most critical. These results support the caveat made in Elnaeem Balila and Shabri (2024) not to use very sophisticated models, such as deep neural nets, in situations for which less sophisticated methods will suffice. The authors’ illustration of the use of the time-honored machine learning approach for predicting realty prices in Dubai is a good illustration of the principle that we often prefer reliability and interpretability over algorithmic novelty. Aside from predictive accuracy, practical usability in the real world also considers computational cost, scalability, interpretability, and noise sensitivity. KNN, being accurate, is, however, computationally expensive, and feature set scaling is highly sensitive—these are flaws that decrease its scalability. Boosting and Random Forest are more robust and applicable in larger datasets, but they are computationally expensive. Linear models, which are less accurate, are also most often required in highly regulated fields such as healthcare and finance, where interpretability is a hard requirement. Zeleke et al. (2023), for instance, employed the use of Gradient Boosting in the prediction of prolonged in-hospital stay, in effect illustrating the applicability of the method in high-risk, high-complexity uses. Likewise, Kaliappan et al. (2021) illustrated the value of generalizability in public health predictions, most significantly in the modeling of COVID-19 reproduction rates, thus also establishing the practical versatility of Boosting. Ultimately, the algorithmic choice must satisfy the target application’s objectives and constraints. In performance-obsessed scenarios, KNN is unbeatable in all the metrics considered. Boosting comes close, in turn sacrificing accuracy for stability. Random Forest and Regularized Linear Regression are in the second tier, being best in variance explanation but with relative error trade-offs. SVM and Decision Tree models deliver mediocre results, while Linear Regression, despite its effectiveness, lacks strong arguments. Neural Networks, considering the results thus far, would need drastic re-optimization before being considered. These results establish the basis for disciplined model selection, hyperparameter tuning, and thoughtful advancement in predictive modeling.
The level of mean dropout loss is presented in Figure 2.
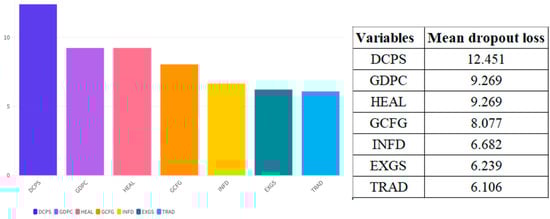
Figure 2.
Mean dropout loss. Note: mean dropout loss is defined here as root mean squared error (RMSE) based on 50 permutations.
We applied K-Nearest Neighbors (KNNs) predictive models to investigate the large-scale adoption of artificial intelligence (AI) technologies in Europe, defined as the proportion of firms with 250 or more employees that employ at least one AI system. Our analysis was grounded in a standardized matrix of national-level indicators. These are health expenditure (HEAL), domestic credit to the private sector (DCPS), exports (EXGS), GDP per capita (GDPC), gross fixed capital formation (GFCF), inflation (INFD), and trade openness (TRAD), all of which cover the major structural and financial features of European economies. To estimate the predictive importance of each variable, we employed mean dropout loss, the averaged root mean squared error of 50 random permutations. We estimate the loss of model accuracy resulting from the removal of each feature, thereby determining its relative importance for prediction. Among all the predictors, the most significant mean dropout loss of 12.451 was realized in the domestic credit to the private sector (DCPS), thus qualifying as the most contributing variable. The above demonstrates the fundamental importance of access to finance in enabling investment and technological change driven by artificial intelligence in the large firm. The finding further underscores the broader importance of liquid financial market conditions that enable risk-taking and support capital-intensive technological change. We base this interpretation on the findings of Kotrachai et al. (2023), who identified financial variables as key predictors in credit card fraud detection models and demonstrated the predictive significance of internal financial dynamics. With that contrast, trade openness (TRAD) and goods and services export (EXGS) recorded relatively low dropout losses of 6.106 and 6.239, respectively, suggesting that external economic activity is relatively insignificant in specifications AI adoption. The contrast suggests that internal developmental and financial capability is more significant than exposure to external trade in preparing for the integration of AI. The health sector also records the same trend, such that Sehgal et al. (2024) depicted that internal clinical terms prevailed over external behavioral terms significantly in early-stage predication of diabetes driven by AI. Overall, the results show that structural conditions and internal financial conditions are the most significant enablers of the diffusion of AI in large organizations. They also show that policy interventions that try to spur adoption of AI should pay more emphasis on establishing a robust domestic financial infrastructure than trade liberalization in the external sector.
The K-Nearest Neighbors algorithm also does well when identifying structured adoption patterns of technology, for example, in Chaurasia et al. (2022), when analyzing the adoption of mobile technology among individuals who have dementia. According to their findings, the models of proximity can discover delicate but recurrent patterns of adoption in various socio-economic segments. Among the variables examined, health expenditure (HEAL) and GDP per capita (GDPC) recorded the same dropout loss of 9.269 and therefore ranked them in the intermediate level of predictor importance. This convergence shows that institutional and human capital capabilities—such as economic affluence and investment in public health—jointly shape the economic environment that enables AI adoption. Siddik et al. (2025) concur similarly on this argument, noting that institutional readiness in health and education infrastructure, among others, is pivotal in catalyzing technology-intensive and sustainable sectoral and macroeconomic growth. Gross fixed capital formation (GFCF) then showed a relatively low dropout loss of 8.077, which is indicative of the less critical nature of infrastructural investment in the population’s preparation for the use of AI compared to credit access or institutional capacity. Inflation (INFD) then showed a loss of 6.682, which is consistent with its intermediate status. Though moderate levels of inflation are viable for a dynamic economy, high or uncertain levels of inflation erode confidence in long-term tech investments. The result is consistent with Gonzalez (2025), who demonstrated that machine learning models of inflation prediction increasingly pay greater relative weight to the interlinkages of macroeconomic volatility and tech investment decisions.
Overall, the KNN test shows an apparent gradient of variable importance. The most important predictor of AI adoption is domestic credit access, followed by institutional build-out and proxies of national wealth. The latter are also significant but capture a lesser percentage of the model’s predictive variance. These findings highlight the multi-domain character of AI adoption and suggest that internal finance systems and public investment frameworks are more proximal determiners of the outcome than external economic opening. The findings, therefore, have the potential to guide targeted policy interventions that set local credit access, institutional infrastructure build-out, and macroeconomic strategies alongside digital innovation goals.
The predictive values of the model are indicated in Table 7.
Table 7.
Feature contributions in KNN predictions of AI adoption by large European enterprises.
The additive explanations from the application of the K-Nearest Neighbors (KNNs) algorithm to the prediction of ALOAI—the share of large Europe companies making use of one or more of the three selected AI technologies—are of use in understanding macroeconomic drivers of AI adoption in five different test cases. Based on data from Eurostat, the baseline prediction (titled “Base”) by the model is supplemented by measuring the additive effectiveness of seven macro-variables in isolation: current health spending (HEAL), domestic private sector credit (DCPS), exports of goods and services (EXGS), economic output per capita (GDPC), gross fixed capital formation (GFCF), inflation (INFD), and trade (TRAD). In Case 1, the final prediction of 28.210 represents modest improvement from the baseline of 26.351, courtesy of mostly positive marginal effects from GFCF (+4.913) and HEAL (+2.395), implying that investment and government spending on health facilitate AI takeoff. This is, in turn, nearly reversed by large negative marginal effects from DCPS (−6.413) and TRAD (−1.041), meaning poor access to finance and low integration in external markets cut down on the prospects of AI diffusion, despite other encouraging circumstances. These are in accordance with findings by Okoye (2023), who demonstrates how underinvestment in institutional infrastructure such as education critically degrades the explicative power of machine learning models in the presence of systemic financing restrictions. The more stable economic profile in Case 2 results in a final prediction of 33.490, where the increase is driven by HEAL (+2.969), GFCF (+3.040), and INFD (+1.839), and other variables have little marginal effect. The single notable negative marginal contribution is that from DCPS (−1.807), implying some financial constraint but otherwise robust economic fundamentals supporting the uptake of AI. The inflation effects observed are also in accordance with results from Maccarrone et al. (2021), who highlighted that macro volatility—where moderate and reliable—is supportive of innovation since it sends the message of a dynamic and growth-oriented setting. Case 3 possesses very poor macro fundamentals and is characterized by large drops from the baseline, with a forecast of ALOAI being equal to 15.690. This is characterized by large negative marginal effects from DCPS (−8.334) and GFCF (−5.020), which imply low financial flexibility and underdevelopment of assets. These patterns substantiate the sensitivity of KNN prediction models to internal economic structure and capital restrictions, as seen in Y. Wang et al. (2024), wherein enhanced KNN models in stock prediction highlighted the pivotal role of economic input variables on model variance stability and accuracy (Figure 3).
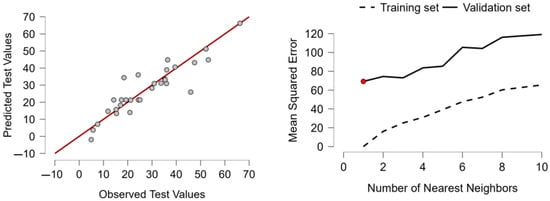
Figure 3.
K-Nearest Neighbors (KNNs) regression performance: predicted vs. observed values and error by number of neighbors. Grey dots show individual prediction accuracy, while the red dot marks the chosen K-NN model.
While minor positive effects are triggered by EXGS (+0.658), HEAL (+0.334), and TRAD (+1.182), these are insufficient to balance the overall downward pressures, such that this economy is not in favorable position to be undergoing technological transformation. Case 4 is more nuanced: although its final estimate of 23.030 is slightly below the base, under the influence of downward pulls of HEAL (−2.654), GFCF (−8.331), DCPS (−5.391), and GDPC (−0.204), the large positive influence of TRAD (+9.229) and INFD (+2.877) provides partial alleviation. This suggests an economy with poor home investment but superior international integration, with international trading dynamics providing partial alleviation from internal weaknesses—isolated in the profile of potential emerging market with selective digital development. These tendencies are in line with those of Alayo et al. (2022), who found that internationalization in weak structural contexts can improve innovation performance, especially where organizational form is flexible. Case 5 is a self-evident exception, with the highly boosted ALOAI prediction of 66.220 being a large, better-than-base departure. This is supported by very strong support from all of GFCF (+18.006), DCPS (+15.768), GDPC (+2.582), EXGS (+1.517), TRAD (+5.173), and INFD (+1.513), except from HEAL (−4.690); accordingly, in this case, perhaps government spending priorities are unbalanced. In any event, it is well and truly outgunned by the pro-innovation influences of the other variables. In each case, some consistencies are evident: both GFCF and DCPS are always the largest in magnitude variables, with very elevated levels of investment having the greatest impact on the disclosed use of AI, and negative levels of credit having the greatest depressing influence. TRAD always contributes constructively inasmuch as it is strong, such that international integration is clearly an important facilitatory factor of AI diffusion. INFD, although traditionally viewed as a risk factor, is found to be used here as a euphemism for managed economic expansion in support of investing in AI under certain assumptions. This is consistent with new work by Benigno et al. (2023) and Stokman (2023), in which it is illustrated that inflation—when certain and anchored—can be used as evidence of favorable investment environments and not economic chaos. Accordingly, Erdoğan et al. (2020) verify the complexity of inflation dynamics in crisis periods (like COVID-19), with warnings to broad assumptions of all inflation harming innovation. GDP per capita has weak and mixed effects, such that aggregated wealth is not in itself highly determinant of technological adoption by enterprises. In a similar vein, health expenditures are found to have mixed effects, which are beneficial in some settings and negative in others, perhaps depending on whether such spending complements or crowds out innovation funding. In conclusion, these additive explanations reveal that the adoption of AI is driven less by overall economic prosperity and more by the structural investment makeup, degree of exposure to international trade, and access to finance. Countries wishing to expand enterprise-level adoption of AI need to therefore prioritize policies increasing productive capital formation, securing strategic access to credit, and further integration into world markets. These results also highlight the usefulness of interpretable machine learning techniques in policy design, in which knowing the specific impact of individual variables can facilitate more optimal intervention design than black-box prediction (Ning et al., 2022; Walters et al., 2022; Chib & Singh, 2023). Overall, the KNN-based additive explanation model uncovers the subtle and setting-specific interaction between macroeconomic circumstance and dispersion of AI and offers evidence from data to support ongoing progress towards digital transformation in Europe.
7. Evaluating Clustering Algorithms for AI Adoption Analysis in Europe: A Multi-Metric Approach
To assess the relative performance of various Clustering techniques in capturing large European firm artificial intelligence (AI) adoption patterns, standardized evaluation measures were employed to assess six different algorithms, including Density-Based, Fuzzy C-Means, Hierarchical, Model-Based, Neighborhood-Based, and Random Forest Clustering. These measures—ranging from explanatory power (R2) to statistical efficiency (AIC, BIC), from measures of geometric cohesion (Silhouette Score, Dunn Index) to Cluster structure (Entropy, Maximum Diameter, Calinski–Harabasz Index)—allow the relative merits and demerits of each algorithm to be assessed in detail. The aim of this is to identify the algorithm that best achieves a balance between model fit, interpretability, and the geometric integrity of the resulting Clusters and thereby offers the best of all possible instruments to analyze AI diffusion along macroeconomic patterns (Figure 4).
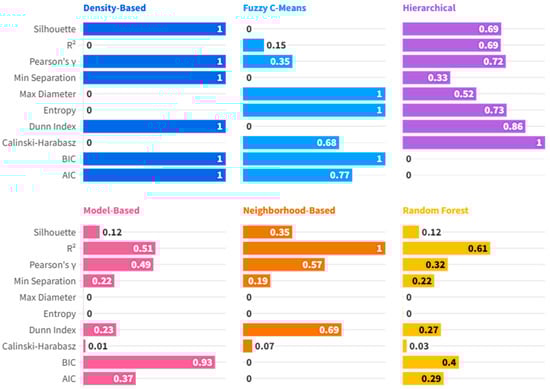
Figure 4.
Comparative evaluation of clustering and classification algorithms across multiple performance metrics.
Comparison of six Clustering techniques—Density-Based Clustering, Fuzzy C-Means Clustering, Hierarchical Clustering, Model-Based Clustering, Neighborhood-Based Clustering, and Random Forest Clustering—has different performance profiles on various standardized evaluation measures. These measures are R2, AIC, BIC, Silhouette Score, Maximum Diameter, Minimum Separation, Pearson’s Gamma, Dunn Index, Entropy, and the Calinski–Harabasz Index, all standardized to between 0 and 1 to enable direct comparison. The objective of the analysis here is to identify the algorithm with the best balance between statistical quality and geometrical Clustering quality. Beginning with R2, which is the ratio of the amount of the variance in the data that is explained by the Clustering model, to the total amount of variance in the data, we have the best possible score by Neighborhood-Based Clustering, reflecting an excellent explanation of the data. Hierarchical Clustering is next with the best possible score, followed by moderate scores from Random Forest Clustering. Lower in the ranks are Model-Based and Fuzzy C-Means, and lowest in the ranks is Density-Based Clustering, implying a failure to explain the data’s variance structure. These are in line with the observations by Sarmas et al. (2024), who highlighted the superiority of ensemble and neighborhood-aware Clustering in capturing subtle consumer behavior for demand response in transport systems. Regarding criteria for selecting models—such as the Akaike Information Criterion (AIC) and the Bayesian Information Criterion (BIC), which measure both the goodness of fit and the complexity of models—Hierarchical Clustering and Neighborhood-Based Clustering obtain the best possible scores, implying optimal performance. In turn, Density-Based Clustering and Fuzzy C-Means obtain the worst possible scores, implying the low efficiency of the models and possible overfitting or lack of parsimony. When comparing the Silhouette Score, which is how similar an object is to its Cluster in contrast to other Clusters, we have the best possible score by Density-Based Clustering, implying forming well-separated and well-defined Clusters. Hierarchical Clustering is the next best, followed by moderate cohesion by Neighborhood-Based Clustering. Fuzzy C-Means, Model-Based, and Random Forest obtain poor scores in this dimension, meaning that their Cluster boundaries are not well defined. These findings are in line with general trends found in comparative Clustering research, such as that of Thamrin and Wijayanto (2021), who illustrated different kinds of performance trade-off between soft and hard Clustering models based on the data structure and population homogeneity.
Looking in particular at Maximum Diameter, which measures the most significant intra-Cluster distance and ideally would be minimized, Model-Based Clusters, Density-Based Clusters, and Neighborhood-Based Clusters exhibit the tightest Clusters with the lowest diameters. Conversely, Fuzzy C-Means measures the most significant value, reflecting large and perhaps poor Clusters. This trend is in line with the application of Clustering observed in Elkahlout and Elkahlout (2024), wherein the spatial Clustering of groundwater wells necessitated the diligent consideration of intra-Cluster variability to obtain meaningful geographic boundaries. Hierarchical Clusters and Random Forest Clusters are in the middle of the spectrum. Minimum Separation—which is the measure of the minimum distance between Cluster centers and would be optimally significant—positions Density-Based Clusters on top, with excellent Cluster separation. Hierarchical Clusters achieve a middle performance; while Neighborhood-Based Clusters score low, this is perhaps suggestive of overlapping or close Clusters. Fuzzy C-Means ranks lowest, further evidence of the former’s poor intra- and extra-class definability. Pearson’s Gamma, reflecting data distance correlations with Cluster assignments, places Density-Based Clusters in the top position, with Hierarchical Clusters and Neighborhood-Based Clusters performing reasonably well. Random Forest and Fuzzy C-Means are lowest on this list, and imply poor spatial correspondence. The Dunn Index, which integrates both the Cluster compactness and Separation and serves as a substantial measure of overall Cluster quality, yet again positions Density-Based Clusters on top, with Hierarchical Clusters and Neighborhood-Based Clusters are positioned immediately in second and third positions. This measure is in keeping with observations from Silhouette, Separation, and Pearson’s Gamma. Fuzzy C-Means and Model-Based Clusters lag, reflecting poor intra-class compactness and inter-class distinctness. This is consistent with observations by Da Silva et al. (2020), who highlighted the importance of dynamic and incremental measures of validity to rank complex partitioning techniques, particularly where Clusters undergo changes or updates in the online setting. Entropy, reflecting here the degree of disorder or randomness in Cluster assignments and optimally would be low, further penalizes Fuzzy C-Means, which measures the most outstanding value, and suggests overlapping and noisy Clusters.
In contrast, Density-Based Clusters, Neighborhood-Based Clusters, and Model-Based Clusters obtain the lowest entropies and more ordered Cluster assignments. These findings confirm the warning uttered by Gagolewski et al. (2021) that Cluster validity indexes can differ in significant ways between and among different algorithms and are best interpreted in their specific contexts and not comparatively in isolation. Lastly, the Calinski–Harabasz Index, the variance ratio measure that penalizes low between-Cluster and within-Cluster dispersion, ranks Hierarchical Clustering first, and Fuzzy C-Means second. This is at odds with the rest of the measures but suggests that Hierarchical Clustering works exceptionally well if viewed from a variance-based dimension. On this measure, the lowest rank is occupied by Density-Based Clustering, and it is possible to speculate that, although they are spatially well-defined, such Clusters will not meet traditional expectations of statistical variance—this difference expresses the model-agnostic findings highlighted by Sarmas et al. (2024) in their research on explainable ensemble Clustering on the modeling of complex systems.
Together, the results demonstrate that no algorithm excels on all measures, but that different patterns are clear. Density-Based Clustering performs well in terms of Clustering quality, particularly in terms of geometry, with leading scores in measures of structure, separation, and coherence such as Silhouette Score, Dunn Index, Pearson’s Gamma, and Minimum Separation. These findings are in line with those of Auliani et al. (2024), who demonstrated the superiority of the former in creating well-separated Clusters in car sales data, especially in the data with noise. However, the weak behavior of Density-Based Clustering in statistical measures such as R2, AIC, BIC, and the Calinski–Harabasz Index identifies it as lacking in explanation and statistical efficiency in pursuit of robust model-based inference. Hierarchical Clustering, on the other hand, has top-performing overall behavior with top ratings in R2 and Calinski–Harabasz coupled with decent performance in structural measures such as Dunn Index and Pearson’s Gamma. This is in line with findings by Azkeskin and Aladağ (2025), who viewed Hierarchical Clustering to be effective in identifying regional energy patterns with statistical cohesiveness. Hierarchical Clustering is thus found to be a balanced algorithm with the potential to produce statistically sound and geometrically meaningful Clusters. Neighborhood-Based Clustering has the best statistical profile with leading results in R2, AIC, and BIC, and decent results in Diameter, Entropy, and compactness. It does not have the lead in measures of geometrical separation, but is strong enough on all sides to be a serious runner. The balanced statistical foundation and decent structure of the models provide it with the potential to bridge the gap between interpretability and performance. Random Forest Clustering is found in the middle ground with decent behavior on all sides but does not excel in any specific area. Similarly, Model-Based Clustering has mixed results with some decent statistical behavior but poor geometrical Cluster properties—this trend was also observed by Ambarsari et al. (2023) in comparing fuzzy versus probabilistic Clustering methods in population welfare segmentation. Fuzzy C-Means Clustering, on the other hand, attains mixed results on nearly all measures, especially in terms of cohesion, separation, Entropy, and statistical fit. This is consistent with findings by Sarmas et al. (2024), who demonstrated fuzzy Clustering methods to be lacking in situations where clear delineation and strong interpretability are needed. Considering all these findings collectively, Neighborhood-Based Clustering is the best performer overall. Its balance of strong statistical fit, computational efficiency, simple Cluster shape, and moderate but sufficient structural preservation makes it the best overall and most consistent algorithm for use in Clustering in this context. While Density-Based Clustering generates well-separated and spatially coherent Clusters, the lack of statistical stability decreases the utility of this algorithm in contexts that require both interpretability and inferability. Hierarchical Clustering is still another strong option, particularly when using variance-based measures or hybrid approaches. Ultimately, the choice of algorithm would best be dictated by the specific aims of the analysis—whether statistical explanation, geometric simplicity, and/or implementation ease is of utmost importance. However, with the application of the normalization measures here, Neighborhood-Based Clustering provides the best overall and strongest balance of performance in all of the measures of evaluation.
The Elbow method is used to determine the optimal number of Clusters. The optimal number of Clusters is 7, as shown in the following Figure 5.
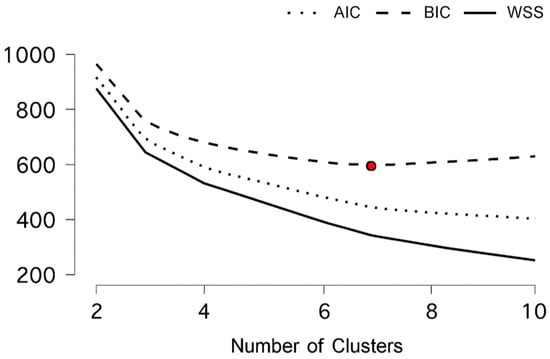
Figure 5.
Optimal number of clusters with the Elbow method. Red dot marks the Elbow point where BIC bottoms out, indicating the optimal number of Clusters.
The following table shows the metric characteristics of the Clusters (Table 8).
Table 8.
Centroid profiles and structural metrics of seven Clusters: a comparative evaluation of Clustering algorithms for AI adoption.
The Clustering outcomes here, based on macroeconomic indicators, are presented in an attempt to provide explanations of the patterns of adoption of artificial intelligence (AI) technologies—reflected in ALOAI—among large European companies in different countries and industrial contexts. Such an explanation is based on standardized macroeconomic indicators such as current health expenditures (HEAL), domestic credit to the non-financial sector (DCPS), exports (EXGS), GDP per capita (GDPC), gross fixed capital formation (GFCF), inflation (INFD), and trade openness (TRAD). The derived Clusters of the seven models are quite dissimilar in size, within-Cluster homogeneity/similarity, and Silhouette Score, reflecting significant heterogeneity in how macroeconomic environments are related to the adoption of AI among European countries. Cluster 5 is the largest (n = 58), with a moderate within-Cluster heterogeneity proportion (0.384), a reasonably large within-Cluster sum of squares (124.42), and a moderate silhouette (0.346). Rather strikingly, it has a negative ALOAI center of −0.837, reflecting below-average use of AI despite containing the most significant number of countries. Its economic profile of uniformly negative or near-zero on salient variables such as GDP per capita (−0.821), domestic credit (−0.826), and trade openness (−0.074) reflects countries that are perhaps economically constrained, locked into traditional systems, or less integrated with the world, and lag in the spread of AI. This is consistent the findings of with Popović et al. (2025), who illustrate how adoption of AI is positively linked with circular use of material and innovation-driven economies—factors that Cluster five countries may lack.
Furthermore, Brey and van der Marel (2024) suggest the strategic role of human capital in enabling the integration of AI, and that Cluster 5 underperformance can also be traced to educational infrastructure and digital preparedness deficits. On the opposite side, Cluster 2, among the better-defined Clusters (n = 25, var. exp. 0.187), is characterized by a very-high ALOAI center of 1.407, reflecting above-average enterprise-level use of AI. Its macroeconomic profile of strong GDP per capita, moderate management of inflation, and healthy and favorable levels of both domestic and external credit and trade reflects dynamic economies. Such countries are also likely to have more developed financial and strategic digital systems and more exposure to international markets and innovation systems. Czeczeli et al. (2024) note that such countries are more likely to be resistant to inflation and policy flexible—two properties that foster economic stability and support investment in AI (Figure 6).
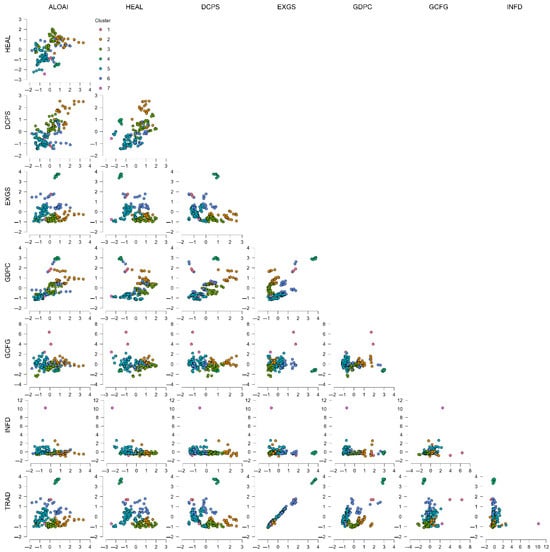
Figure 6.
Pairwise scatterplot matrix of standardized macroeconomic variables by Cluster.
Their economic profile comprises favorable values on nearly all the indicators, with special characteristics including strong home credit (1.512), moderate exports (−0.453), and respectable GDP per capita (0.907). Such a Cluster is expected to comprise developed, mid-sized European economies with stable access to capital and balanced external trade profiles that support moderate to high AI adoption. Such findings are supported by Bosna et al. (2024), who used Clustering and ANFIS analysis to reveal macroeconomic balance to be the primary determinant of supporting growth and innovation following eurozone membership. Cluster 6 is small (n = 24) but shares comparable structural characteristics with Cluster 2, except the low ALOAI center (0.379); this means that—although macroeconomic fundamentals are reasonably favorable such as health spending (0.39), trade openness (0.837), and exports (0.857)—other variables such as labor market rigidity, policy gaps, or low industrial digital maturity are likely to curb AI diffusion. These structural barriers are likely to be symptomatic of institutional preparedness challenges as discovered in the regression inflation study of Czeczeli et al. (2024), where Clustering was used to untangle different preparedness profiles for economic shocks. Cluster 3 is the largest low-ALOA Cluster with a large Silhouette Score (n = 35, silhouette = 0.334, ALOAI = 0.018). It has marginally positive health and credit indicators but negative exports (−0.741), trade openness (−0.776), and GDP per capita (−0.095), signifying internal economic development with minimal external market integration. Such findings are in consonance with observations by Arora et al. (2024), who showed by correlation and Clustering that macroeconomic groupings of variables tend to divide along lines of internal vs. external orientation with implications on preparedness to innovate. Cluster 4 is small (n = 6) but is different in having a high Silhouette Score (0.894) and above-mean ALOAI (0.693). It is marked by robust exports (3.619), trade openness (3.579), and very high GDP per capita (2.933), but poor health spending (−1.533) and GFCF (−1.215). This is indicative of a group of high-income, export-dependent economies where the dynamism of the private sector is capable of compensating for poor public investment and infrastructure in health. Such configurations are representative of those influenced by industrial competitiveness rather than by institutional support; this was also shown by Merkulova and Nikolaeva (2022) within their Cluster membership of European tax indicators and fiscal capacity. Cluster 1, small in number (n = 2), has highly elevated measures of GDP per capita (1.809), trade (1.693), exports (1.653), and GFCF (5.168), but with very low health spending (−0.897) and domestic credit (−1.156). ALOAI is flat (0.018), inferring the under-adoption of AI due to underdeveloped policy ecosystems or a mismatch between financial and innovation systems. Nenov et al. (2023) see a similar mismatch in their neural model predictions, noting how successful economies have low innovation outcomes if institutional or behavioral factors are not appropriately in balance with structural capabilities. Cluster 7 includes an extreme dataset in isolation, with highly elevated inflation (10.237) and negative scores in credit, GDP per capita, and trade. Its negative ALOAI (−0.527) is evidence of systemic economic volatility and is best interpreted as representing simply an extreme (outlier) or abnormal macroeconomic regime that does not reflect wider tendencies. Such extremes are in support of the application of unsupervised Clustering analysis to reveal macroeconomic outliers, as previously demonstrated in multidimensional Cluster research such as Bosna et al. (2024) and Czeczeli et al. (2024). See Figure 7.

Figure 7.
Cluster membership visualization in two-dimensional projection with case labels.
Conversely, the least-adopting Clusters (Clusters 5 and 3) are characterized by poor access to finance, low productivity, and low international integration. This is in line with the cross-European country analysis by Popović et al. (2025), which revealed how extremely sensitive AI adoption is to material use strategies and economic environment, especially in environments with restricted access to material inputs. The evidence supports the suggestion that economic sophistication, access to finance, and external orientation (through exports and international trade) are positively associated with AI adoption in large enterprises. There are exceptions, though—like Cluster 1′s very macro indicators with low adoption and Cluster 4′s external orientation and high GDP with low public spending—highlighting that economic factors are not sufficient to secure innovation adoption. Instead, as emphasized by Uren and Edwards (2023), organizational maturity and technology readiness mediate the role. The preparedness of the institution, sector patterns, and the prevailing digital cultural environment crucially mediate whether economic slack is turned into technological adoption. Such influences are evidenced in the work by Kochkina et al. (2024), who found that industry-specific strategic fit, enhanced by sector-matched application of AI and preparedness assessments, plays an influential role in shaping successful integration of AI—even within technologically developed environments. The Silhouette Scores also verify the heterogeneity of these Clusters. Cluster 4, with a score of 0.894, is the internally best-coherent Cluster and is marked by stable and replicable profile features—i.e., distinct macro indicators and adoption of AI. Cluster 2 and Cluster 6, on the other hand, although prospective in economic orientation, have poor Silhouette Scores, exemplifying more internal heterogeneity and perhaps more intricate dynamics. Cluster 5 and Cluster 3, despite having a large number of entities, are low-adopting domains and require targeted intervention in policy. Such Clusters are likely to enjoy the most significant benefits from strategic intervention in the form of targeted investment in infrastructure, digital skills and education programs, and international competitiveness-enhancing programs. In essence, such Cluster analysis reveals that extensive European firm adoption of AI is positively associated with access to financing, external orientation, and GDP per capita, though they are not determining factors. Institutional power, technological readiness, and strategic fit—through public–private investment systems especially—are essential to the macroeconomic levers’ translation into successful digital transformation (Table 9).
Table 9.
Cluster centroids and performance metrics based on multi-algorithm Clustering of AI-adoption determinants.
The data analysis of the implementation of the K-Nearest Neighbors (KNNs) Clustering algorithm on the set of macroeconomic and financial variables provides insightful observations regarding the patterns of artificial intelligence (AI) adoption—through the ALOAI indicator—among large enterprises (250+ staff) with European economies. Not accounting for agriculture, mining, and finance, the ALOAI indicator records the proportion of enterprises utilizing any of the AI technologies, such as machine learning or image recognition. The standard variables on which the Clustering is performed are current health spending (HEAL), domestic credit to the non-financial sector (DCPS), exports of goods and services (EXGS), gross domestic product (GDP) per capita (GDPC), gross fixed capital formation (GFCF), inflation (INFD), and trade openness (TRAD). The seven Cluster centroids represent the average standardized figures of each of the variables from the member countries. Cluster 2 is characterized by the greatest ALOAI indicator (1.407), which validates strong adoption of AI by its constituents. This Cluster records high-availability credit (DCPS = 1.512), significant health spending (HEAL = 1.512), robust GDP per capita (GDPC = 0.907), and robust investment in capital formation (GFCF = 0.762). Despite slightly low values in exports and trade, the economies’ internal resilience regarding infrastructure, investment, and access to finance appears sufficient to facilitate digital transformation. The observed patterns are consistent with Iuga and Socol (2024), who emphasize how readiness in the use of artificial intelligence and preventing brain drain are inextricably connected with institutional investment and the availability of finance. That such uptake is observed in the Cluster suggests collaboration of macroeconomic stability, investment in the provision of social services, and financial capability to produce technological innovation, regardless of whether they have a macroeconomic orientation towards international trade. This supports arguments in Czeczeli et al. (2024), who observe that economic resilience and preparedness—especially in situations of macroeconomic volatility—are intricately ingrained in the fiscal and lending architecture of a nation. Cluster 4 also features the ALOAI indicator with a high score (0.693), although with differences in the economic profile. It features the highest levels of exports (EXGS = 3.619) and trade openness (TRAD = 3.579), as well as the highest level of GDP per capita (GDPC = 2.933). On the contrary, it features low health spending (HEAL = −1.533) and negative capital formation (GFCF = −1.215), reflecting low investment in public infrastructure or long-term assets. This reflects that economic models are based on private-sector dynamism, high competitiveness, and international integration. As the analysis by Papagiannis et al. (2021) of intelligent infrastructure and public–private preparedness in Eastern Europe reveals, the robust adoption of AI is even possible in market-exposure- and innovation-pressure-driven systems lacking public investment. Cluster 6 features an ALOAI of moderate magnitude (0.379) and is a mixed–transitional group. It features mixed signs, with positive values of credit availability (DCPS = 0.857), modest health spending (HEAL = −0.277), and robust trade openness (TRAD = 0.837), but other factors are near-average or slightly below average. The profile identifies emerging and converging economies that have the macroeconomic fundamentals of digital transformation but have not yet translated them into elevated levels of AI adoption. As Iuga and Socol (2024) highlight, such economies tend to require stronger institutional infrastructure, targeted policy instruments, and measures to counter brain drain to leverage their AI preparedness more effectively. Additionally, workforce competencies and support structures of innovation may not yet be fully compatible with the demands of digital transformation. Cluster 3, with very low ALOAI (0.018), is characterized by the economic profile of structural weakness. While it features modest health and credit indicators, it features negative values of exports (−0.741), trade (−0.776), and GDP per capita (−0.095). This reflects underdeveloped and weakly integrated economies into international markets, with low external exposure and low national income levels that heavily hamper technological diffusion. These findings are corroborated by Guarascio et al. (2025), who illustrate that regional heterogeneity in exposure to AI and employment is disproportionately driven by macroeconomic underdevelopment and sectoral inflexibility. Even with some government investment in health and/or credit, structural weaknesses prevent firms from rolling out cutting-edge technologies on a large scale. Cluster 5 has the lowest ALOAI score (−0.837), and it is characterized by very weak digital transformation. The economic indicators are unambiguously negative or low on average, such as GDP per capita (−0.821), availability of credits (−0.131), low health spending (−0.826), and low capital formation (−0.739). These economies are presumably faced with several systemic barriers—economic, institutional, and infrastructure—that severely impinge on the capabilities of businesses to access digital instruments and invest in AI technologies. As demonstrated by Rađenović et al. (2024) from their Cluster analysis of eco-innovation, such underdevelopment is typically an indicator of overall policy inertness and poor coordination of innovation ecosystems. In the absence of targeted fiscal measures, support for private sector digitalization, and inclusion into European innovation policies, these economies are unlikely to escape low adoption equilibria (Figure 8).

Figure 8.
Cluster-wise standardized means of macroeconomic variables with error bars.
Cluster 1 is an intriguing and educational example in which a low ALOAI (0.018) is found with exceptionally favorable macroeconomic indicators. It is the best performer in GDP per capita (1.809), exports (1.653), and trade integration (1.693), and in gross fixed capital formation (GFCF = 5.168), reflecting a structural wealth and integration profile. But it also manifests stark weaknesses in health spending (HEAL = −0.897) and access to credit (DCPS = −1.156). Such dualities imply that macroeconomic prosperity is not in itself enough to provide successful AI adoption. As Uren and Edwards (2023) contend, organizational preparedness in the form of digital competency, strategic alignment, and institutional flexibility is paramount in converting advantageous macro settings into innovation results. Likewise, Baumgartner et al. (2024) note the requirement of essential digital capabilities and transformation competencies on the firm level, which in turn might be scarce even in ostensibly prosperous economies. Hence, the example of Cluster 1 serves to illustrate that the diffusion of AI is demonstrably dependent on the convergence of financial accessibility, institutional backing, and technological preparedness. Cluster 7 consists of a single extreme outlier. It is characterized by anomalously high inflation (INFD = 10.237) and negatively skewed values on all of the remaining indicators, including GDP per capita, access to credit, and international integration. The attendant negative ALOAI (−0.527) reinforces the hypothesis that macro dysfunction generates a setting hostile to digital innovation. Such settings are typically associated with brain drain (Iuga & Socol (2024)), policy ambiguity, and low institutional capability, which together constitute a feedback cycle of sub optimality in AI preparedness. Here, any push to support the adoption of AI would not be merely about altering digital policy, but macroeconomic stabilization. Cluster 7 is thus best interpreted as structural abnormality, and presents in itself a cautionary reminder of technological transformation’s foundational prerequisites.
Defining Clusters by Macroeconomic and Innovation Attributes. Based on centroid features such as GDP per head, credit provision, and export intensity, and in reference to AI adoption levels (ALOAI), the Clusters can be renamed as follows:
- Cluster 1: Paradox Economies of Structure—High trade intensity with wealth, but low AI adoption performance due to credit or institutional issues.
- Cluster 2: Innovation-Ready Economies—Robust macroeconomic foundations and institutional sophistication supporting high AI adoption.
- Cluster 3: Internally Constrained Economies—Moderate fundamentals with low external integration and subdued AI engagement.
- Cluster 4: Market-Driven Innovators—High external orientation and competitiveness with restricted public investment.
- Cluster 5: Structural Laggards—Economies with widespread macroeconomic and infrastructural shortcomings, with low AI adoption.
- Cluster 6: Transitional Potentials—These new markets have rising fundamentals, but their potential in AI-led transformation remains unaccomplished.
- Cluster 7: Structural Outliers—Special cases with macroeconomic volatility in the form of hyperinflation and significantly low AI activity.
Conclusions: The present paper systematically elucidates the structural determinants of the adoption of artificial intelligence among large European firms, unveiling diversified macroeconomic profiles through an ALOAI-indicator-centered Clustering procedure. Seven Clusters, identified through Non-Hierarchical K-Nearest Neighbors techniques, are characterized through standardized national indicators such as GDP per capita, trade openness, credit in the non-financial sector, gross fixed capital formation, public health, and inflation—that is, they describe the multidimensional fabric of structural, institutional, and financial environments. Adoption of AI, being the Cluster-wise centroid of ALOAI, exhibits pronounced variation that tracks these underlying macro profiles strongly. Cluster 2, with the highest value of ALOAI (1.407), is indicative of those digitally advanced economies that are marked by strong credit access, macroeconomic stability, low inflation pressure, and public expenditure on health. These economies are institutionally and financially primed for digital transformation and are best positioned to absorb frontier technologies. By contrast, Cluster 5, the largest in terms of members, has the lowest ALOAI rating (−0.837), comprising economies that are structurally held back by poor credit systems, poor investment potential, and low integration with world markets. They are symptoms of the diffusion of technology’s systemic barriers, a testament to the accumulated penalty of macroeconomic weakness. Most importantly, the relationship is not linear. Cluster 1, despite having excellent macro indicators such as outstanding GDP per capita, stellar export performance, and high capital formation, exhibits zero AI adoption (ALOAI = 0.018). The puzzle here is that prosperity in and of itself is not sufficient for generating digital innovation in the absence of certain complementarities, such as available credit and institutional maturity. Similarly, Cluster 4 achieves outstanding AI adoption with the help of strong trade openness and export intensity, but low public investment—pointing to the compensatory role of private-sector dynamism in digitally competitive economies. These Clusters are therefore not merely statistical abstractions but empirically guided typologies of national digital preparation. ALOAI then becomes a latent indicator of macro-institutional coordination, variation across Clusters reflecting the relative compatibility of economic policy, financial infrastructure, and innovation systems. By extension, then, the adoption of AI among Europe’s major corporations is inextricably tied to the larger macro-institutional framework. This is not the result of prosperity alone, but the result of the strategic complementarity of financial accessibility, institutional power, digital infrastructure, and organizational complexity. The Cluster approach described here offers a transferable template for identifying and interpreting systemic digital transformation readiness in various national environments.
8. Aligning Macroeconomic Policy with AI Adoption: Strategic Priorities for Europe
The quantitative analysis of macroeconomic drivers of adoption of AI by large enterprises in 28 European member states from 2018 to 2023 provides rich lessons for policy to facilitate digital transformation. Based on both the use of econometric panel models and machine learning techniques, including KNNs, the findings support the multidimensionality and complexity of AI diffusion in institutional, economic, and technological contexts. Most notably, they illustrate how macro indicators such as GDP per capita, inflation control, and ease of access to credit are important inputs. However, they cannot implement integration of AI on their own. Instead, such inputs need to be supplemented by strategic fit with institutional capacity, sector maturity, and organization preparedness. As emphasized by Agrawal et al. (2021), adoption of AI is not about accessing technology—it, in many cases, involves organizational and sector transformation of the entire machinery, with policies of an adaptive nature going beyond the use of classic economic levers. Perhaps the best evidence is between health spending and the adoption of AI. This points to the fact that public health spending supports not only the evolution of human capital but institutional maturity as well, both of which are key requisites to uptake. In that regard, public health modernization and digital innovation are inseparable policies that need to be reconciled with in national policies, and more so with systemic shocks such as the COVID-19 crisis. Rather than regarding them as two distinct policy arenas, digital transformation and social infrastructure need to be conceptualized in integrated national plans. This argument is favorable to the hypothesis that an overall plan of development with investment in education, health, and digital capability is more efficient than single innovation policies. That is to say, adoption of AI is more effective in those settings where societal development and digital transformation are required in tandem. This argument is supported by Übellacker (2025), who presents evidence regarding perceptions of shortages of AI by individuals, particularly by underprepared institutions, to in turn impact preparedness despite overall economic resilience. European policymakers thus need to use instruments like the Recovery and Resilience Facility to balance macro-financial planning with such technological ambitions. As evidenced by Kochkina et al. (2024), sector digital maturity and leadership initiatives are determinants in the translation of congenial macro environments to technological implementation. Secondly, evidence of a negative correlation between banking sector credit to the home country’s private sector and adoption of AI requires more specific analysis of financial allocation and policy design.
In orthodox theory, access to finance is meant to stimulate technological progress. However, evidence from the data suggests otherwise. A plausible explanation is in the form of misallocation of capital, with financial funds redirected into low-tech or traditional sectors not related to innovation. As demonstrated by Criste et al. (2021) in their analysis of the consistency of the credit cycle, structural inefficiencies and asynchronous dynamics of European area credit will be a barrier to the effective use of available financial funds to growth-enhancing sectors. Beyond this divergence, this is also symptomatic of institutional bias in lending patterns or the underdevelopment of systems of financial innovation. To effectively use financial liquidity to finance AI development, policymakers need to redirect credit and capital flows to innovation sectors and startups, in the form of instruments like AI-specific guarantees, innovation funds, or blended finance platforms. As demonstrated by Ferraro et al. (2023), intervention by the public sector in the form of the European Cohesion Framework on R&D and innovation has measurable impacts on SME productivity, employment, and exports—highlighting the potential of targeted finance in raising digital competitiveness.
Third, the uniformly negative coefficients attached to exports of goods and services in both fixed- and random-effects models indicate the existence of structural inertia in economies heavily dependent on traditional export bases. Such economies might be prone to path dependency, in which incumbent sectors resist digital disruption in order to protect existing comparative advantages. Consistent with results by Dudzevičiūtė (2021), such exports are observed to contribute to aggregate economic growth; yet, this is only the case if their composition matters—standardized, low-tech exports are found to stifle innovation-driven transformation unless they are combined with digital capabilities. To overcome such barriers, “smart specialization” approaches are required. These require the coordination of industrial policy to be driven by digital innovation ecosystems, such that traditional export bases can transform by incorporating AI and associated technologies into production and service provision. Incentivizing exporters to upgrade from commoditized to technological and data-driven output ensures that digital transformation does not simply occur in parallel; rather, it ensures that it is ingrained within export-oriented growth models. Conversely, trade openness is found to have a substantial, positive impact on AI adoption, reinforcing the proposition that economies with increased integration into the world economy are more likely to innovate more intensively. As illustrated by Marčeta and Bojnec (2023), trade openness is a key driver of world competitiveness and convergence among European economies. It provides knowledge spillovers, raises competitive pressure, and allows access to new technologies—all of which serve as drivers of enterprise-level AI integration. European external and internal policies are thus required to transform beyond providing tariff-free market access and instead integrate digital standards, intellectual property rights, and cross-border data protocols into bilateral and multilateral trade agreements. In addition, these external measures need to be backed by internal policies facilitating both SMEs and large corporates to take advantage of innovation opportunities generated by trade by investing in digital infrastructure, engendering cross-border digital preparedness, and advancing governance cohesiveness throughout the single market. Notably, although frequently employed as a measure of national wealth, GDP per capita is found to have only a marginal influence in the KNN-based importance assessments below both goods and health expenditure. The evidence here implies economic prosperity is not enough to ensure digital transformation. This aligns with the findings of Dritsaki et al. (2023), who established that macro-factors play a part in innovation, but their influence is contingent on environmental and institutional enablers. The implication is that resource abundance is to be complemented by efficient allocation measures and institutional coordination in order to produce innovative results.
Such evidence is supported by Costantini et al. (2023), who observe convergence in eco-innovation in countries with institutional support and focused policy contexts. Applied to the adoption of AI, it is obvious that absorptive capacity, institutional quality, and incentives are key drivers. European Cohesion Policy must also redirect efforts to equalize not only physical infrastructure in lag regions, but also assistance to administrative modernization, skills ecosystems, and regulation streamlining—a basis on which to facilitate digital absorption and sustainable innovation. Gross fixed capital formation (GFCF) presents evidence of counterintuitive but statistically significant negative correlation with the adoption of AI. It is evidence with implications that investment in European economies is perhaps biased in the direction of familiar tangible assets, such as physical infrastructure and machinery, and not intangible digital assets like AI algorithmic content, cloud infrastructure, or workforce skills upgrade. In Licchetta and Meyermans (2022) analysis, investment in the COVID-19 era remained focused on traditional capital, in particular infrastructure and public buildings—sectors not immediately open to digital transformation. This finding provides evidence of a mismatch between investment type and digital transformation aims. European and member state fiscal policies thus need to redirect to stimulate capital deepening in digital and AI-related technology. Targeted tax incentives for the acquisition of AI software and digital R&D are one such possible avenue, along the lines of the argument made by Morina et al. (2024) on strategic investment incentives. A further step is that the Europeans’ digital chapter in the green taxonomy has the potential to direct investment by the private sector to sustainable and digitally oriented outcomes, and that public procurement mechanisms can be re-engineered to create incentives for AI-driven innovation in health, public administrations, and infrastructure. The statistical influence of inflation on the adoption of AI is to be viewed with circumspection. Although not suggestive of direct causality, it can exercise investment dynamism in moderate inflation times, and cause adaptive economic behavior and capital transference realism. Results in Bańkowski et al. (2023) demonstrate that, in periods of inflation, the government has the potential to adjust public finance policies and strive to increase investment in innovation to sustain competitiveness. Thus, inflation is not inherently an obstacle to the adoption of AI, provided that macroeconomic stability is ensured and countercyclical digital investment is maintained. Other than these macroeconomic considerations, the Clustering and machine learning results also affirm that adoption patterns of AI are not taking place in all structurally comparable economies. For instance, Cluster 2—where macro indicators are well-balanced and intensive use of AI is taking place—is in contrast with Cluster 5, where access to finance is poor, and low trade integration and low capital investment restrain the spread of AI. This difference is in affirmation of results by Usman et al. (2024), who argue that economic openness must be complemented by sectoral capacity and policy consensus in order to translate into results in the form of innovation or productivity growth.
These observations require different policy approaches. Top-performing Clusters need to concentrate on securing and leveraging competitive strengths, such as leadership in AI regulation or standard-setting within Europe. By contrast, underperforming Clusters need institutional restructuring, investment in digital infrastructure, and capability development, including development of skills related to digital competencies and local ecosystems of innovation. Without such targeted support measures, the European digital divide can grow deeper, imperiling the Digital Europe Programme and the cohesion of European innovation strategy goals. European coordination plays a particularly significant role in the digital transformation of the continent in the areas of emerging policy instruments such as the AI Act, Chips Act, and the Digital Decade policy program. These instruments need to be regarded not as distinct initiatives, but as complementary elements in one integrated strategy for diminishing digital fragmentation, enhancing technological convergence, and enhancing pan-Europe competitiveness in AI. As described by Pehlivan (2024), the AI Act proposes the implementation of a risk-analysis-based governance plan to handle artificial intelligence in member states, with the provision of a legal support structure to facilitate trustworthy and secure AI. Analogously, Schulz et al. (2024) portray the Chips Act as aiming to upgrade the semiconductor ecosystem in Europe—a key facilitator of enhanced use of AI and European digital sovereignty.
To complement such regulation and investment plans, the European Commission urgently needs to prioritize harmonization in both technical and institutional levels. This entails harmonizing benchmarking tools for AI, like the ALOAI indicator, and benchmarking dashboards that can provide policymakers with real-time information on the adoption and readiness of regions to adopt and use AI. Such evidence-based tools would improve comparability, transparency, and accountability and facilitate ex ante planning and ex post policy analyses. Notably, the policy process itself can be enhanced with the help of AI-driven decision support. The K-Nearest Neighbors (KNNs) algorithm, coupled with explainable AI measures like SHAP values, permits interpretable models of adoption drivers to be formulated. As this research exemplifies, variables like access to finance, openness to trade, and capital formation play important roles in influencing enterprise-level adoption of AI. With such model-based governance, the European can better design and customize interventions with much finer-grained granularity, allocating funds to contexts in which macroeconomic alignment and readiness of the institutional infrastructure are best. However, such applications of machine learning to policy design also have to be balanced with methodological caution. Hazards such as overfitting, data bias, and ecological fallacies remain paramount, especially in cross-country research in which structural heterogeneity is ever-present. As Kezlya et al. (2024) indirectly note in biodiversity research, capturing the complexity of ecosystem contacts is as challenging as capturing the dynamics of AI uptake: systems are connected, local factors count, and prediction is not policy.
In conclusion, Europe’s shift to an economy driven by AI requires an intricate, multidimensional policy response. Financial measures need to be redirected to support intangible innovation; public spending needs to build institutional capability; industrial and trade policies need to unlock digital competition. Most importantly, policy design itself needs to be more adaptive, data-driven, and evidence-based—deploying AI not merely as a research object but as an instrument of governance.
9. Discussions, Limitations, and Future Research
This study provides a multi-aspect, stringent exploration of artificial intelligence (AI) adoption drivers of large European businesses. Employing panel data econometric modeling as well as machine learning approaches, it allows us to further understand how European companies’ digital transformation potential is substantially impacted due to the structural labor market as well as macro indicators. In its findings, it provides positive statistical proof in favor of some of the most powerful AI-adoption-determinant parameters—such as employment of workers in formal work establishments, percentage of service sector, self-employment rates, as well as work market stability—once again in favor of a solidly built socio-economic framework (Gualandri & Kuzior, 2024). However, no research is ever complete; some of the structural, methodological, and contextual issues in this study represent a heterogeneous set of potential research directions. Moreover, there is some structural vulnerability of the European innovativeness ecosystem, which is susceptible to stifling AI diffusion, regardless of positive macro-structures or favorable labor market structures (Popović et al., 2025; Hoffmann & Nurski, 2021). Another limitation of this study is that it addresses only large companies (businesses with more than 250 employees). Adoption studies of AI focus on large corporations primarily, due to their organizational structure, financial leverage, and technological prowess. However, the findings of such studies cannot be universally applied to SMEs, which share vastly contrasting characteristics and limitations. SMEs represent over 99% of European businesses and have altogether different concerns, such as restricted financial accessibility, underdeveloped digital foundations, and restricted institutional support (Ardito et al., 2024). Even though proxies such as employment or service employment give a macro-labor perspective, they only partially explain the finer points of digital capacity, such as educational attainment levels, digital literacies, or concentration of Clusters of R&D. Firm or subnational finer-grained data would refine our understanding of how the quality of workforces and institutional readiness intersect in enabling AI adoption (Kabashkin et al., 2023; Bogoslov et al., 2024).
From a methodological viewpoint, while panel models offer robustness, they treat countries as homogeneous units. However, Europe is characterized by massive intra-country heterogeneity. National-level differences—in industrial Clusters, in labor markets, and in systems of innovation—are at times greater in effect than national means (Mallik, 2023). It may be possible that including regional data or multilevel modeling would be of greater value in understanding such intra-country dynamics. There is yet another problem facing Europe’s underdeveloped venture capital framework—this is one of the reasons for the scale-up inhibition of AI as well as its commercialization. Europe’s venture ecosystem is still in its developmental stage compared to the U.S. and China, and it is prone to compromising high-risk, high-reward AI research (Brey & van der Marel, 2024; Leogrande et al., 2022).
Additionally, Europe’s open innovation systems lack cohesion. Inadequate collaboration between industry, academy, and government hinders knowledge transfer as well as the diffusion of technology, halting the development of vibrant, scalable innovation systems (Misuraca & Van Noordt, 2020). Persistent regional disparities—in transport infrastructure, human capital quality, and education—also exacerbate a “dual-speed” AI adoption throughout the continent. Urban centers like Paris or Amsterdam accelerate, while rural zones and peri-urban regions trail, with further differentiation at risk (Mallik, 2023).
Research agenda for the future: Although this study presents a robust, multifaceted analysis of the macroeconomic and labor market factors behind the Europe-wide adoption of artificial intelligence among large firms, several significant future research paths remain unexplored. A first direction for future study would be to extend analysis to the sector level, which could provide more detailed information on the heterogeneity of artificial intelligence adoption across various sectors, including manufacturing, healthcare, and finance, which are themselves being rapidly digitalized. Sector-specific factors, such as technology intensity, institutional settings, i.e., regulation, and labor demand for specific skills, could uncover differentiated diffusion of artificial intelligence not reflected through aggregated national data. Second, subsequent studies must explore national digital plans and policy frameworks to derive insights into shaping the outcomes of AI adoption and readiness. It is worth studying the heterogeneous effects of the digitalization plans of European member nations, infrastructure investment, and sophistication of regulation, most particularly on innovation system consistency and institutional capacity. Third, attention must be given to the long-term, path-dependent nature of AI adoption. AI is not a sudden tech jump but a long-term transformational process. Scholars must study, longitudinally, the impact of early adoption of AI on firm productivity, labor reorganization, value chain reconfiguration, not least in previously unexamined sectors such as agriculture, logistics, and cultural industries.
Furthermore, subsequent studies can use firm and subnational data to account for intra-country diversity. This can be useful to model better localized innovation ecosystems, skills Clusters, and institutional enablement to influence adoption outcomes. Multilevel modeling methods can be used to analyze national, regional, and firm-specific interactions. Finally, a comparative research agenda comparing innovation ecosystems and venture capital maturity would illuminate financing arrangements that turn on or off the scaling of innovations of AI. This is most relevant for Europe, where diversified venture market structures and a scarcity of public–private collaboration continue to hinder technology commercialization. Comparisons from high-growth hubs to stalled peripheries can discern paths for transcending adoption divides, towards a more balanced and resilient digital transition for Europe.
10. Conclusions
This research provides a refined empirical investigation of large European firms’ adoption of artificial intelligence (AI) using the combination of panel data economies with ancillary machine learning models. We present robust, multifaceted evidence of how both macroeconomic environments and labor market characteristics moderate firms’ willingness and capacity to adopt AI technologies. From a scientific perspective, one of this research’s central contributions is demonstrating that adoption of AI is not driven by a single variable, but is driven by a set of related variables. Both fixed-effects and dynamic panel data models confirm that labor market composition—more particularly, prevalence rates of formal employment, self-employment, and employment in the service sector—substantially determines adoption rates. Economies with larger shares of salaried employment, as well as those with active self-employed markets, enjoy greater rates of AI adoption. This would imply that institutional security in organized markets, coupled with entrepreneurial vigor, creates a more favorable ground for technical advancements. The effect of unemployment and precarious work is likewise determining. The negatively significant correlation of AI adoption with these measures means structural vulnerability in the labor market can serve as a disincentive to triggering digital change. High rates of unemployment and precariousness of work can reduce firms’ financial and organizational strengths in investing in emerging technologies. Moreover, such settings can impact the quality of the readily available flexible workforce—a condition sine qua non in envisioning successful AI integration. Another important finding of science is the temporal persistence of AI adoption, as is evident in the dynamic panel model. The positive coefficient of the lagged dependent variable indicates that, once firms undertake AI adoption, this process is cumulative and self-enforcing. This has main theory implications, unveiling a path-dependent process of early adoption yielding greater returns with learning, internal capacity-building, as well as adaptation at the institutional level. The macro view of this study corroborates and bolsters these findings. High rates of expenditure on public health reveal a positive association with the diffusion of AI, with human capital, as well as institutional capacity, emerging as essential determinants. Trade openness is further uncovered as a significant positive force, confirming that interconnected economies have higher vulnerability towards technology spillovers, as well as competitive pressure, in response to which adoption of AI is initiated. On the other hand, negative associations with domestic credit and gross fixed capital formation challenge conventional assumptions of higher financial and physical capital invariably contributing towards innovation. The implications here is that that expenditure direction and quality—rather than merely expenditure volume—are most significantly relevant. Activities devoted to physical infrastructure or conventional industry might omit considerations of digital capability necessary in AI. This suggests that we refine our understanding of capital allocation in innovation-led growth processes. The scientific value of this research is further supplemented by using machine learning models, specifically K-Nearest Neighbors (KNNs), to validate and supplement econometric results. These models confirm the heterogeneity of AI adoption at the national level as well as the significance of macro-labor structures in grouping nationally similar profiles. Specifically, countries with comparable economic indicators but differing AI adoption levels demonstrate the relevance of intangible factors—such as policy coordination, strategic governance, and quality of institutions—in shaping digital readiness. From a policy viewpoint, the stakes in this work run high. As a starting point, policy architecture aimed at accelerating AI adoption has to be reviewed. Policies need not only provide financial incentives or digital connectivity, they must also address the right market failures in employment. Policies aiming to promoting formal employment, reskilling, and innovation Clusters in the services sector will fare better in speeding up digital transformation. Second, long-term strategic alignment of macro-policy with digital goals is stressed in the research. Policies of trade, credit, and investment need reformulation in favor of intangible products, institutional development, and knowledge-based industries. Moreover, because of established AI adoption pathway dependence, there is a requirement for public support not only in primary adoption but also in supporting companies throughout the whole lifecycle of technology adoption. Lastly, this study demonstrates that AI adoption is a multi-leveled process in the broader economic and institutional context. It provides a sound empirical foundation for further research as well as definitive insights for policymakers who wish to facilitate inclusive, sustainable digital transformation in Europe.
Author Contributions
Conceptualization, C.D., A.C., M.S., and A.L.; methodology, C.D., A.C., M.S., and A.L.; software C.D., A.C., M.S., and A.L.; validation, C.D., A.C., M.S., and A.L.; formal analysis, C.D., A.C., M.S., and A.L.; investigation, C.D., A.C., M.S., and A.L.; resources, C.D., A.C., M.S., and A.L.; data curation, C.D., A.C., M.S., and A.L.; writing—original draft preparation, C.D., A.C., M.S., and A.L.; writing—review and editing, C.D., A.C., M.S., and A.L.; visualization, C.D., A.C., M.S., and A.L.; supervision, C.D., A.C., M.S., and A.L.; project administration, C.D., A.C., M.S., and A.L.; funding acquisition, C.D., A.C., M.S., and A.L. All authors have read and agreed to the published version of the manuscript.
Funding
This research received no external funding.
Data Availability Statement
Sources: Eurostat: https://ec.europa.eu/eurostat/databrowser/view/isoc_eb_ai/default/table?lang=en (accessed on 10 January 2025) and World Bank Databank: https://databank.worldbank.org/source/world-development-indicators (accessed on 10 January 2025).
Conflicts of Interest
The authors declare no conflicts of interest.
Appendix A. Validation Strategies and Robustness of the KNN Model
To secure the robustness, accuracy, and generality of our prediction model, we applied two validation procedures for the K-Nearest Neighbors (KNNs) regression algorithm: a 20% holdout validation and a 5-fold cross-validation method. The methods were both used for verifying the predictive capacity for the surge in artificial intelligence (AI) in the European region for large firms from a list of multidimensional macroeconomic variables. Normalized validation was performed, scaling on features taken to remove biases due to variation in the unit of measurement. This step is desirable considering the Euclidean distance function in KNNs (Table A1).
Table A1.
Performance comparison of K-Nearest Neighbors (KNNs) regression using 20% holdout and 5-fold cross-validation.
Table A1.
Performance comparison of K-Nearest Neighbors (KNNs) regression using 20% holdout and 5-fold cross-validation.
| Training and Validation Data | 20% for Validation Data | k-Fold with 5-Fold |
|---|---|---|
| Weights | Rectangular | Rectangular |
| Distance | Euclidean | Euclidean |
| n (Train) | 96 | 97 |
| n (Validation) | 25 | 24 |
| n (Test) | 30 | 30 |
| Validation MSE | 132.224 | 62.494 |
| Test MSE | 27.207 | 46.926 |
| Validation set | Mean Squared Error | Mean Squared Error |
| MSE | 39.096 | 46.926 |
| MSE (scaled) | 0.129 | 0.141 |
| RMSE | 6.253 | 6.85 |
| MAE/MAD | 4.888 | 4.67 |
| MAPE | 21.68% | 67.23% |
| R2 | 0.871 | 0.86 |
In the first technique, the standard 80/20 train–validation split was adopted. A total of 96 observations were held back for training in the complete set, 25 were held for validation, and a separate set of 30 was set aside for testing. The rectangular weight and Euclidean distance KNN model was trained without altering parameterization in validation. This holdout technique yielded good performance indicators, such as an R2 value of 0.871, an RMSE value of 6.253, and an MAPE value of 21.68%. The results suggest the presence of a good relationship between the predicted output and the actual output in the validation set, as well as good model fitting and generalizability to new test data (Test MSE = 27.207). To ensure accuracy in such findings and reduce the likely impact of partitioning bias in the data, we also adopted a 5-fold cross-validation method. The rigorous process, in such an instance, randomly divided the data into five folds, each of equal size. For every repetition, four folds (n ≈ 97) were for training, while a single fold (n ≈ 24) was for validation, placing the validation fold in variation for every run in the set of five runs. The prediction in the model was then pooled across folds to offer shared performance statistics. The technique yielded an R2 value of 0.86, an RMSE value of 6.85, and an MAPE value of 67.23%. Although MAPE significantly rose in the cross-validation setting, the latter likely reflects responsiveness on the part of MAPE to outlier or extreme percentage errors, where, in a few folds, actuals could approach zero. Cross-validated validation MSE (62.494) was significantly lower compared to that in the holdout technique (132.224), which points toward increased consistency and less variation in the prediction made on the model on various splits in the data. Also, scaled MSE values (0.129 for holdout, 0.141 for cross-validation) reflect a marginal increment, which further indicates resistance on the model’s part toward variation in train as well as in validation partitions. Systematic results in both validation experiments indicate that the KNN model is capable of performing consistently for all data splitting configurations. The rectangular weighting setting and Euclidean distance, in conjunction with normalized features, also aided in keeping the measurements of distance unbiased, so that local structure in the data could be picked up reliably by the model. The non-parametric nature of the KNN algorithm also made it well-suited for discovering nonlinear relationships between macroeconomic indicators and AI uptake. Compared to different baselines offered in the paper, like Boosting, Random Forest, Support Vector Machines (SVMs), and Neural Networks, KNN consistently performed competitively or even superior in important metrics. Such a finding, together with good interpretability and few assumptions, also further attests to the KNN as being a sound and practically reliable predictive modeling tool in applications in macroeconomic research. In total, both the 20% holdout and 5-fold cross-validation techniques verified the goodness and validity of the KNN model. The algorithm indicated good predictive ability, minimal generalization error, and maximum explanation power for both validation techniques. The findings are consistent in verifying the soundness of the model and provide evidence in support of the use of the model in policy-informed applications on IT change and penetration of AI in the macroeconomic context.
Appendix B. Hyperparameter Settings and Evaluation of Clustering Techniques
For Clustering algorithms in the domain of unsupervised machine learning, correctly selected hyperparameters need to yield relevant, reproducible results. These hyperparameters are extremely sensitive to both algorithmic structure and data nature, controlling everything from Cluster shape and density through convergence to interpretability. Table A2, Table A3, Table A4, Table A5, Table A6 and Table A7 offer systematic tabular summaries of hyperparameter settings across six diverse Clustering methods: Density-Based (DBSCAN), Fuzzy C-Means, Hierarchical, Model-Based, Neighborhood-Based (K-Means), and Random Forest Clustering. Each table specifies the crucial operational parameters—distance measures, iteration limits, initialization schemes, and Cluster determination plans—that regulate each method’s behavior. A common feature of any procedure is feature scaling, such that variables contribute proportionally in distance-based computations. The selection of the Cluster number is further improved with the Bayesian Information Criterion (BIC), supporting objectivity and parsimonious modelling. Some methods, such as Random Forest or Hierarchical Clustering, have a largely deterministic nature. In contrast, others have stochastic components, although most of such configurations with no fixed, definite random seed imply that no strict reproducibility is imposed. In this section, a critical commentary is provided of such hyperparameters, with discussion of suitability, potential disadvantages, and implications for the quality and robustness of the Clustering.
Table A2.
Hyperparameters of Density-Based Clustering.
Table A2.
Hyperparameters of Density-Based Clustering.
| Parameter | Value | Description |
|---|---|---|
| Epsilon neighborhood size | 2 | Radius (ε) used to define the neighborhood around a point. |
| Min. core points | 5 | Minimum number of points within ε to define a core point. |
| Distance | Normal | Distance metric used (likely Euclidean). |
| Scale features | Enabled | Features are scaled before training. |
| Set seed | Disabled | No random seed is set; results may vary on different runs. |
Table A2 includes some of the most prominent of these hyperparameters as they would be used with the Density-Based approach to Clustering, explicitly referring to the DBSCAN (Density-Based Spatial Clustering of Applications with Noise) approach. A choice of epsilon neighborhood of size 2 with a minimum core of 5 is in agreement with the general employment of DBSCAN, insofar as a trade-off between being sensitive to noise points and being able to identify well-separated dense Clusters must be struck. These parameters set the core structure of the Clustering approach: ε sets the radius in which points will be considered neighbors, while the value of min_samples (provided herein with a value of 5) only allows thoroughly dense regions of space to be considered Clusters. With “Normal” as a distance measure, it means there is a standard Euclidean measure of distance being utilized, although it would be beneficial to define this term, as this will vary across platforms. It is a noteworthy feature that scaling is enabled, something one would desire in DBSCAN when features have considerably different ranges. Without scaling, it will most likely give a bias to this measure of distance due to features with larger ranges, consequently affecting the neighborhoods being calculated. The absence of a hardcoded random seed implies that, while DBSCAN is primarily deterministic, initializations or preprocessing with stochastic operations can cause slight variability in the outputs between one run of a program and another. This will have little effect on DBSCAN itself, but the control of the seeds will enable greater reproducibility to be attained.
Table A3.
Hyperparameters of Fuzzy C-Means Clustering.
Table A3.
Hyperparameters of Fuzzy C-Means Clustering.
| Parameter | Value | Description |
|---|---|---|
| Max. iterations | 25 | Maximum number of iterations for the optimization process. |
| Fuzziness parameter | 2 | Fuzziness coefficient used in fuzzy Clustering (e.g., Fuzzy C-Means). |
| Scale features | Enabled | Input features are scaled prior to Clustering. |
| Set seed | Disabled | No specific random seed is set. |
| Cluster determination | Optimized (BIC) | Number of Clusters is automatically determined using Bayesian Information Criterion (BIC). |
| Max. Clusters | 10 | Maximum number of Clusters considered during automatic optimization. |
| Fixed Cluster number | Disabled | The number of Clusters is not fixed but selected based on the optimization criterion. |
Table A3 provides concise information on the Fuzzy C-Means (FCM) Cluster algorithm’s allocation of hyperparameters. Fuzziness is allotted 2, a general research default value of fuzzy Clustering, and it specifies just how much the memberships between Clusters overlap. A fuzziness of 2 allows a balanced degree of fuzz in Cluster estimates, such that units can exist in several Clusters partially, as is FCM’s main strength vis a vis complex Clustering algorithms like K-Means. The highest number of iterations, 25, is an adequate computation threshold at convergence, although in specific data complexity contexts, convergence will require a larger threshold. Feature scaling is enabled, as required in FCM, because the algorithm is based on distance and may be distorted by values of unequal magnitudes. Cluster determination is especially automated using the Bayesian Information Criterion (BIC), with a maximum of 10 Clusters considered. This allows one to select a model balancing between fitness and complexity when trying not to overfit. It is important to not select a Cluster number, and rather optimize on BIC, which brings robustness as well as objectivity in Clustering; this is especially the case in exploratory data analysis. Finally, because the random seed is uninitialized, it would subtly affect initialization as well as convergence behavior, although this is typically marginal in FCM. However, this would permit the control of a seed, facilitating reproducibility in specific cases with stable output of Clustering across executions as a condition.
Table A4.
Hyperparameters of Hierarchical Clustering.
Table A4.
Hyperparameters of Hierarchical Clustering.
| Parameter | Value | Description |
|---|---|---|
| Distance | Euclidean | Distance metric used to compute dissimilarity between data points. |
| Linkage | Average | Linkage method used in Hierarchical Clustering (average distance between Clusters). |
| Scale features | Enabled | Input features are normalized or standardized before Clustering. |
| Set seed | Disabled | No fixed random seed is applied. |
| Cluster determination | Optimized (BIC) | Number of Clusters is automatically selected using Bayesian Information Criterion (BIC). |
| Max. Clusters | 10 | Maximum number of Clusters considered during automatic model selection. |
| Fixed Cluster number | Disabled | The number of Clusters is not manually set; it’s determined through optimization. |
Table A4 defines configuration parameters in the Hierarchical Clustering procedure with emphasis on automated selection of models. In computing distances between data points, we utilize the Euclidean distance measure, as in standard hierarchical Clustering, which is appropriate for continuous, scaled data. We select the average linkage method in computing the average of all pairs of points in two Clusters; it yields well-balanced Cluster patterns, not sensitive to chaining, with moderate sensitivity towards points with extreme values. It is a suitable selection in circumventing the compact Cluster bias due to complete or Ward linkage. Notably, feature scaling is turned on, such that all of the variables contribute proportionally to the distance metric. This step is important when features differ in scale or units, since raw features can skew Clustering output by overwhelming distance calculations. The model includes automatic Cluster number determination, using the Bayesian Information Criterion (BIC). This adds a statistically driven Cluster selection layer of complexity compared to fitting a Cluster model. The Cluster number is capped at a maximum of 10 to limit the Cluster model search space and reduce the risk of overfitting in high-dimensional data. The random seed is not fixed but variable, but this is less of a problem in agglomerative Hierarchical Clustering, as it is deterministic with a fixed distance matrix. Reproducibility can be enhanced, though, if there is any random step involved (e.g., sampling of features or initialization in preprocessing).
Table A5.
Hyperparameters of Model-Based Clustering.
Table A5.
Hyperparameters of Model-Based Clustering.
| Parameter | Value | Description |
|---|---|---|
| Model | Auto | The Clustering model is selected automatically by the system. |
| Max. iterations | 25 | Maximum number of iterations allowed during the training process. |
| Scale features | Enabled | Features are scaled before training (e.g., normalized or standardized). |
| Set seed | Disabled | No fixed random seed is set. |
| Cluster determination | Optimized (BIC) | The number of Clusters is selected automatically using the Bayesian Information Criterion (BIC). |
| Max. Clusters | 10 | Maximum number of Clusters considered during model selection. |
| Fixed Cluster number | Disabled | The number of Clusters is not set manually but determined through optimization. |
Table A5 shows the hyperparameter settings of the Model-Based Clustering method. Model selection is “Auto,” allowing automatic selection of the most appropriate model based on the data. It is an adaptive setting, further allowing increased flexibility in the process, along with enhancing Clustering output, in scenarios of unknown data structure. The maximum number of iterations is set as 25, as is traditional with the Expectation-Maximization (EM) algorithm used in Model-Based Clustering. This suffices under most conditions but may inhibit convergence in larger, complex datasets. This is a computer power versus model precision trade-off. Scaling of features is enabled, a necessary step because Model-Based Clustering commonly assumes the normal distributions of the features with equal contribution. Without scaling, a larger range of features may have excessive influence on the covariance structure and on the skewness of the Cluster assignment. Cluster identification is carried out using Bayesian Information Criterion (BIC) optimization, with as many as 10 Clusters considered. BIC is well-received in model selection, balancing between the fit and the simplicity of a model. This is automated to remove any subjective bias and enhance the reproducibility of the solutions in Clustering. Although it does not define a random seed—thereby enabling minor variations due to stochastic initializations of EM procedures—this is a minor constraint.
Table A6.
Hyperparameters of Neighborhood-Based Clustering.
Table A6.
Hyperparameters of Neighborhood-Based Clustering.
| Parameter | Value | Description |
|---|---|---|
| Center type | Means | Specifies that Cluster centers are calculated as means (K-Means Clustering). |
| Algorithm | Hartigan–Wong | The specific algorithm used for K-Means optimization. |
| Distance | Euclidean | Distance metric used to compute dissimilarity between points. |
| Max. iterations | 25 | Maximum number of iterations for convergence. |
| Random sets | 25 | Number of random initializations (starting configurations). |
| Scale features | Enabled | Input features are scaled (normalized or standardized) prior to Clustering. |
| Set seed | Disabled | No random seed is set for reproducibility. |
| Cluster determination | Optimized (BIC) | Number of Clusters is selected automatically using Bayesian Information Criterion (BIC). |
| Max. Clusters | 10 | Maximum number of Clusters to consider during model selection. |
| Fixed Cluster number | Disabled | The number of Clusters is not fixed manually. |
Table A6 illustrates the setting of the hyperparameter of the Neighborhood-Based Clustering approach, specifically K-Means Clustering, as centers of means of one sort. As is widely known, the Hartigan–Wong approach—a commonly used method of optimizing within-Cluster variability—is, in practice, quick and efficient. This distance measure is good with K-Means, under assumptions of isotropic spherical Clusters, performing best with features of similar scale. In response, feature scaling is enabled so that all of the variables contribute equally to distance calculations. This is a vital preprocessing step, especially in handling mixed-scale or high-dimensional data. The initialization can only handle up to 25 iterations and 25 random initial values; therefore, it improves the solution’s strength since it allows the algorithm to dodge suboptimal local minima. Several initial values are fundamental in K-Means since it is rather sensitive to the initial position of centroids. Cluster selection is automatically carried out using the Bayesian Information Criterion (BIC), with 10 Clusters being maximally examined. While BIC is best known for Model-Based Cluster procedures, its application here is a data-guided effort at trading model quality against simplicity, adding objectivity in specifying Cluster number. There is no fixed number of Clusters, allowing variability in capturing data structure. Although no random seed is provided, thereby thwarting strict reproducibility, this does not disqualify the quality of the configuration.
Table A7.
Hyperparameters of Random Forest Clustering.
Table A7.
Hyperparameters of Random Forest Clustering.
| Parameter | Value | Description |
|---|---|---|
| Trees | 1000 | Number of trees used in the ensemble (likely Random Forest-based Clustering). |
| Scale features | Enabled | Input features are scaled prior to training. |
| Set seed | Disabled | No random seed is specified. |
| Cluster determination | Optimized (BIC) | The number of Clusters is selected automatically using Bayesian Information Criterion (BIC). |
| Max. Clusters | 10 | Maximum number of Clusters evaluated during the optimization. |
| Fixed Cluster number | Disabled | The number of Clusters is not set manually but determined during training. |
Table A7 illustrates the setting of one Clustering method with Random Forests, one of those increasingly employed in unsupervised learning with proximity matrices or tree-based measures of similarity. The fact that 1000 trees have been considered means there is an excellent emphasis on stabilizing power as well as on robustness. High numbers of trees move towards increasingly accurate and stable proximity estimations, a crucial need in retrieving Clusters out of ensemble-based models. Scaling of features is enabled, which, while not technically required for decision-tree-based models, is desirable with other preprocessing operations or resulting algorithms relying on distance measures. This is indicative of a general policy of feature handling in Clustering algorithms across research. This Clustering assignment procedure is streamlined using the Bayesian Information Criterion (BIC), with 10 Clusters considered as the maximum. As much as BIC is traditionally associated with probabilistic or Model-Based Clustering, its use in this case is likely a post-processing quality judgment of Clustering in trading off between model complexity and good data fitting. This reflects an automated selection procedure, enhancing the objectivity of the Clustering output. The number of Clusters is not fixed, thus allowing the model to adapt accordingly without being required to conform to some user assumptions of structure in such data. Despite no random seed being given, with possible effect on reproducibility based on implementer considerations, this is a reasonable constraint with otherwise usually deterministic Random Forests training.
Note
| 1 | Countries are: Austria, Belgium, Bosnia and Herzegovina, Bulgaria, Denmark, Estonia, Finland, France, Germany, Greece, Hungary, Ireland, Italy, Latvia, Lithuania, Luxembourg, Malta, Netherlands, Norway, Poland, Portugal, Romania, Serbia, Slovakia, Slovenia, Spain, Sweden, Turkey. |
References
- Abdelaal, M. (2024). AI in manufacturing: Market analysis and opportunities. arXiv, arXiv:2407.05426. [Google Scholar]
- Abrardi, L., Cambini, C., & Rondi, L. (2019). The economics of artificial intelligence: A survey. European University Institute, San Domenico di Fiesole (FI). [Google Scholar]
- Acemoglu, D. (2025). The simple macroeconomics of AI. Economic Policy, 40(121), 13–58. [Google Scholar] [CrossRef]
- Agrawal, A., Gans, J., & Goldfarb, A. (Eds.). (2019). The economics of artificial intelligence: An agenda. University of Chicago Press. [Google Scholar]
- Agrawal, A. K., Gans, J. S., & Goldfarb, A. (2021). Ai adoption and system-wide change (No. w28811). National Bureau of Economic Research. [Google Scholar]
- Alayo, M., Iturralde, T., & Maseda, A. (2022). Innovation and internationalization in family SMEs: Analyzing the role of family involvement. European Journal of Innovation Management, 25(2), 454–478. [Google Scholar] [CrossRef]
- Albanesi, S., Silva, A. D., Jimeno, J. F., Lamo, A., & Wabitsch, A. (2023). New technologies and jobs in Europe (IZA Discussion Papers 16227). Institute of Labor Economics (IZA). [Google Scholar]
- Aldasoro, I., Doerr, S., Gambacorta, L., & Rees, D. M. (2024). The impact of artificial intelligence on output and inflation. Bank for International Settlements, Monetary and Economic Department. [Google Scholar]
- Ambarsari, E. W., Dwitiyanti, N., Selvia, N., Cholifah, W. N., & Mardika, P. D. (2023). Comparison approaches of the fuzzy c-means and gaussian mixture model in clustering the welfare of the Indonesian people. KnE Social Sciences, 16–22. [Google Scholar] [CrossRef]
- Andrejovská, A., & Andrejkovičova, I. (2024). Tax revenues and tax rates in the context of macroeconomic determinants. Journal of Entrepreneurship & Sustainability Issues, 12(1), 253–267. [Google Scholar]
- Ardito, L., Filieri, R., Raguseo, E., & Vitari, C. (2024). Artificial intelligence adoption and revenue growth in European SMEs: Synergies with IoT and big data analytics. Internet Research. [Google Scholar]
- Aromolaran, O., Ngepah, N., & Saba, C. S. (2024). Macroeconomic determinants of poverty in South Africa: The role of investments in artificial intelligence. Access Journal, 5(2), 288–305. [Google Scholar] [CrossRef] [PubMed]
- Arora, G., Tiwari, S., Wu, Y., & Mei, X. (2024). An exploration to the correlation structure and clustering of macroeconomic variables. arXiv, arXiv:2401.10162. [Google Scholar] [CrossRef]
- Arroyabe, M. F., Arranz, C. F., De Arroyabe, I. F., & de Arroyabe, J. C. F. (2024). Analyzing AI adoption in European SMEs: A study of digital capabilities, innovation, and external environment. Technology in Society, 79, 102733. [Google Scholar] [CrossRef]
- Asanjan, M. F., Purutçuoğlu, V., Arı, F., & Gökçay, D. (2020, November 19–20). Comparison of data interpolation methods in time course pupil diameter data. 2020 Medical Technologies Congress (TIPTEKNO) (pp. 1–4), Antalya, Turkey. [Google Scholar]
- Assis, A., Dantas, J., & Andrade, E. (2025). The performance-interpretability trade-off: A comparative study of machine learning models. Journal of Reliable Intelligent Environments, 11(1), 1. [Google Scholar] [CrossRef]
- Atajanov, T., & Yi, C. D. (2023). The panel analysis of the effects of FDI and export on the economic growth of CIS countries. Journal of International Trade & Commerce, 19(1), 143–163. [Google Scholar]
- Auliani, S. N., Novita, R., & Afdal, M. (2024). Implementation of density-based spatial clustering of applications with noise and fuzzy C–means for clustering car sales. The Indonesian Journal of Computer Science, 13(4). [Google Scholar] [CrossRef]
- Autor, D. (2022). The labor market impacts of technological change: From unbridled enthusiasm to qualified optimism to vast uncertainty (No. w30074). National Bureau of Economic Research. [Google Scholar]
- Azkeskin, S. A., & Aladağ, Z. (2025). Evaluating regional sustainable energy potential through hierarchical clustering and machine learning. Environmental Research Communications, 7(1), 015002. [Google Scholar] [CrossRef]
- Babina, T., Fedyk, A., He, A., & Hodson, J. (2024). Artificial intelligence, firm growth, and product innovation. Journal of Financial Economics, 151, 103745. [Google Scholar] [CrossRef]
- Bańkowski, K., Checherita-Westphal, C. D., Jesionek, J., Muggenthaler, P., Briodeau, C., Schoonackers, R., Kuckuck, J., Urke, K., Hickey, R., Papaoikonomou, D., Martínez Pagés, J., Schmidt, K., Caprioli, F., Avgousti, A., Brusbārde, B., Strazdaite, V., Delobbe, O., Sant, K., Italianer, J., & Prammer, D. (2023). The effects of high inflation on public finances in the euro area. Available online: https://ideas.repec.org/p/ecb/ecbops/2023332.html (accessed on 21 July 2025).
- Baumgartner, M., Horvat, D., Kinkel, S., & Kick, E. (2024). Key competences for the adoption of AI-based innovations in organisations. International Journal of Innovation Management, 28(09n10), 2440002. [Google Scholar] [CrossRef]
- Benigno, P., Canofari, P., Bartolomeo, G., & Messori, M. (2023). Inflation dynamics and monetary policy in the euro area. Economic Governance and EMU Scrutiny Unit. [Google Scholar]
- Bickley, S. J., Chan, H. F., & Torgler, B. (2022). Artificial intelligence in the field of economics. Scientometrics, 127(4), 2055–2084. [Google Scholar] [CrossRef]
- Bogoslov, I. A., Corman, S., & Lungu, A. E. (2024). Perspectives on artificial intelligence adoption for European union elderly in the context of digital skills development. Sustainability, 16(11), 4579. [Google Scholar] [CrossRef]
- Bonab, A. B., Rudko, I., & Bellini, F. (2021). A review and a proposal about socio-economic impacts of artificial intelligence. In Business revolution in a digital era: 14th international conference on business excellence, ICBE 2020, Bucharest, Romania (pp. 251–270). Springer International Publishing. [Google Scholar]
- Bonfiglioli, A., Gancia, G., Papadakis, I., & Crinò, R. (2023). Artificial intelligence and jobs: Evidence from us commuting zones (Technical Report, CESifo Working Paper). Munich Society for the Promotion of Economic Research—CESifo GmbH. [Google Scholar]
- Bosna, J., Valčić, S. B., & Peša, A. (2024). Measuring the effect of entry into the eurozone on economic growth–data storytelling using clustering and ANFIS. Technological and Economic Development of Economy, 30(3), 646–666. [Google Scholar] [CrossRef]
- Brey, B., & van der Marel, E. (2024). The role of human-capital in artificial intelligence adoption. Economics Letters, 244, 111949. [Google Scholar] [CrossRef]
- Brynjolfsson, E., & Unger, G. (2023). The macroeconomics of artificial intelligence. IMF: International Monetary Fund. [Google Scholar]
- Brynjolfsson, E., Li, D., & Raymond, L. R. (2023). Generative ai at work (Technical Report). National Bureau of Economic Research. [Google Scholar]
- Brynjolfsson, E., Rock, D., & Syverson, C. (2018). Artificial intelligence and the modern productivity paradox: A clash of expectations and statistics (pp. 23–57). University of Chicago Press. [Google Scholar]
- Buglea, A., Cișmașu, I. D., Gligor, D. A. G., & Jurcuț, C. N. (2025). Exploring the impact of digital transformation on non-financial performance in central and eastern european countries. Electronics, 14(6), 1226. [Google Scholar] [CrossRef]
- Bustani, B., Swandari, F., & Yunani, A. (2024). Green capital dynamics: Investigating the impact of capital structure on profitability among IDX LQ45 low carbon leaders in Indonesia. Accounting and Finance Studies. [Google Scholar]
- Camerer, C. F. (2018). Artificial intelligence and behavioral economics. In The economics of artificial intelligence: An agenda (pp. 587–608). University of Chicago Press. [Google Scholar]
- Cannavale, C., Esempio Tammaro, A., Leone, D., & Schiavone, F. (2022). Innovation adoption in inter-organizational healthcare networks–the role of artificial intelligence. European Journal of Innovation Management, 25(6), 758–774. [Google Scholar] [CrossRef]
- Challoumis, C. (2024, December 17–20). AI and the economy—A deep dive into the new financial paradigm. XVI International Scientific Conference (pp. 176–200), Paris, France. [Google Scholar]
- Chandra, M., Vimal, K. E. K., & Rajak, S. (2024). A comparative study of machine learning algorithms in the prediction of bead geometry in wire-arc additive manufacturing. International Journal on Interactive Design and Manufacturing (IJIDeM), 18(9), 6625–6638. [Google Scholar] [CrossRef]
- Chaurasia, P., McClean, S., Nugent, C. D., Cleland, I., Zhang, S., Donnelly, M. P., Scotney, B. W., Sanders, C., Smith, K., Norton, M. C., & Tschanz, J. (2022). Modelling mobile-based technology adoption among people with dementia. Personal and Ubiquitous Computing, 26(2), 365–384. [Google Scholar] [CrossRef]
- Chen, W. X., Shi, T. T., & Srinivasan, S. (2024). The value of AI innovations. Harvard business school working paper (No. 24-069). Harvard Business School. [Google Scholar]
- Chib, P. S., & Singh, P. (2023). Recent advancements in end-to-end autonomous driving using deep learning: A survey. IEEE Transactions on Intelligent Vehicles, 9(1), 103–118. [Google Scholar] [CrossRef]
- Cockburn, I. M., Henderson, R., & Stern, S. (2018). The impact of artificial intelligence on innovation (Vol. 24449). National Bureau of Economic Research. [Google Scholar]
- Comunale, M., & Manera, A. (2024). The economic impacts and the regulation of ai: A review of the academic literature and policy actions. International Monetary Fund. [Google Scholar]
- Costantini, V., Delgado, F. J., & Presno, M. J. (2023). Environmental innovations in the EU: A club convergence analysis of the eco-innovation index and driving factors of the clusters. Environmental Innovation and Societal Transitions, 46, 100698. [Google Scholar] [CrossRef]
- Criste, A., Lupu, I., & Lupu, R. (2021). Coherence and entropy of credit cycles across the euro area candidate countries. Entropy, 23(9), 1213. [Google Scholar] [CrossRef]
- Czarnitzki, D., Fern’andez, G. P., & Rammer, C. (2023). Artificial intelligence and firm-level productivity. Journal of Economic Behavior & Organization, 211, 188–205. [Google Scholar] [CrossRef]
- Czeczeli, V., Kolozsi, P. P., Kutasi, G., & Marton, Á. (2024). Exposure and preparedness for wartime inflation in the EU: Retrospective cluster analysis. Society and Economy, 46(3), 236–255. [Google Scholar] [CrossRef]
- Da Silva, L. E. B., Melton, N. M., & Wunsch, D. C. (2020). Incremental cluster validity indices for online learning of hard partitions: Extensions and comparative study. IEEE Access, 8, 22025–22047. [Google Scholar] [CrossRef]
- Dave, B. (2024). Technology and AI—Impact on country’s growth and unemployment. ShodhSamajik: Journal of Social Studies, 1(1), 35–53. [Google Scholar] [CrossRef]
- Dezhbakhsh, H., & Levy, D. (2022). Interpolation and shock persistence of prewar US macroeconomic time series: A reconsideration. Economics Letters, 213, 110386. [Google Scholar] [CrossRef]
- Doran, N. M., Badareu, G., & Puiu, S. (2025). Automation systems implications on economic performance of industrial sectors in selected European Union countries. Systems, 13(1), 26. [Google Scholar] [CrossRef]
- Dritsaki, M., Dritsaki, C., & Tsianaka, E. (2023). The effect of macroeconomic and environmental factors on innovation in EU member countries. Journal of Infrastructure, Policy and Development, 7(3), 2560. [Google Scholar] [CrossRef]
- Du, J. (2024). The impact of artificial intelligence adoption on employee unemployment: A multifaceted relationship. International Journal of Social Sciences and Public Administration, 2(3), 321–327. [Google Scholar] [CrossRef]
- Dudzevičiūtė, G. (2021). Does causality exist between exports and economic development? Evidence from selected EU countries. Journal of International Studies, 14(4), 56–66. [Google Scholar] [CrossRef]
- Elkahlout, G. R., & Elkahlout, M. A. (2024). Employing cluster analysis in defining groundwater wells patterns in Rafah. Edelweiss Applied Science and Technology, 8(6), 3542–3555. [Google Scholar] [CrossRef]
- Elnaeem Balila, A., & Shabri, A. B. (2024). Comparative analysis of machine learning algorithms for predicting Dubai property prices. Frontiers in Applied Mathematics and Statistics, 10, 1327376. [Google Scholar] [CrossRef]
- Eloundou, T., Manning, S., Mishkin, P., & Rock, D. (2023). GPTs are GPTs: An early look at the labor market impact potential of large language models. arXiv, arXiv:2303.10130. [Google Scholar] [CrossRef]
- Erdoğan, S., Yıldırım, D. Ç., & Gedikli, A. (2020). Dynamics and determinants of inflation during the COVID-19 pandemic period in European countries: A spatial panel data analysis. Duzce Medical Journal, 22, 61–67. [Google Scholar] [CrossRef]
- Ernst, E., Merola, R., & Samaan, D. (2019). Economics of artificial intelligence: Implications for the future of work. IZA Journal of Labor Policy, 9(1), 1–35. [Google Scholar] [CrossRef]
- Felten, E. W., Raj, M., & Seamans, R. (2018). A method to link advances in artificial intelligence to occupational abilities. AEA Papers and Proceedings, 108, 54–57. [Google Scholar] [CrossRef]
- Ferraro, S., Männasoo, K., & Tasane, H. (2023). How the EU Cohesion Policy targeted at R&D and innovation impacts the productivity, employment and exports of SMEs in Estonia. Evaluation and Program Planning, 97, 102221. [Google Scholar] [PubMed]
- Freeman, C. (1987). Technology policy and economic performance: Lessons from Japan. Science Policy Research Unit University of Sussex and Pinter Publishers. [Google Scholar]
- Gagolewski, M., Bartoszuk, M., & Cena, A. (2021). Are cluster validity measures (in) valid? Information Sciences, 581, 620–636. [Google Scholar] [CrossRef]
- Gama, F., & Magistretti, S. (2025). Artificial intelligence in innovation management: A review of innovation capabilities and a taxonomy of AI applications. Journal of Product Innovation Management, 42(1), 76–111. [Google Scholar] [CrossRef]
- Gazzani, A. G., & Natoli, F. (2024). The macroeconomic effects of AI innovation. Available at SSRN. [Google Scholar] [CrossRef]
- Giannini, M., & Martini, B. (2024). Regional disparities in the European Union. A machine learning approach. Papers in Regional Science, 103(4), 100033. [Google Scholar] [CrossRef]
- Gonzalez, D. A. (2025). Exploring the impact of machine learning and AI on inflation prediction: A bibliometric approach. Studies of Applied Economics, 43(1). [Google Scholar] [CrossRef]
- Gualandri, F., & Kuzior, A. (2024). Drivers of AI adoption in enterprises: A European-wide analysis. Materials Research Proceedings, 45. [Google Scholar] [CrossRef]
- Guarascio, D., Reljic, J., & Stöllinger, R. (2025). Diverging paths: AI exposure and employment across European regions. Structural Change and Economic Dynamics, 73, 11–24. [Google Scholar] [CrossRef]
- Hassan, A. S. (2024). Factors driving artificial intelligence adoption in South Africa’s financial services sector. Academic Journal of Interdisciplinary Studies, 13(5), 394–411. [Google Scholar] [CrossRef]
- Hasteer, N., Mallik, A., Nigam, D., Sindhwani, R., & Van Belle, J. P. (2024). Analysis of challenges to implement artificial intelligence technologies in agriculture sector. International Journal of System Assurance Engineering and Management, 15(5), 1841–1860. [Google Scholar] [CrossRef]
- Hoffmann, M., & Nurski, L. (2021). What is holding back artificial intelligence adoption in Europe? Bruegel. [Google Scholar]
- Iuga, I. C., & Socol, A. (2024). Government artificial intelligence readiness and brain drain: Influencing factors and spatial effects in the European Union member states. Journal of Business Economics and Management, 25(2), 268–296. [Google Scholar] [CrossRef]
- Jiang, L., Xuan, Y., & Zhang, K. (2024). Unlocking innovation potential: The impact of artificial intelligence transformation on enterprise innovation capacity. European Journal of Innovation Management. ahead-of-print. [Google Scholar] [CrossRef]
- Kabashkin, I., Misnevs, B., & Zervina, O. (2023). Artificial intelligence in aviation: New professionals for new technologies. Applied Sciences, 13(21), 11660. [Google Scholar] [CrossRef]
- Kaliappan, J., Srinivasan, K., Qaisar, S. M., Sundararajan, K., Chang, C. Y., & Suganthan, C. (2021). Performance Evaluation of Regression Models for the Prediction of the COVID-19 Reproduction Rate. Frontiers in Public Health, 9, 729795. [Google Scholar] [CrossRef] [PubMed]
- Kezlya, E. M., Glushchenko, A. M., & Kulikovskiy, M. S. (2024). Diatom diversity from watercourses of north-eastern Kamchatka with description of one new species. Diversity, 16(9), 592. [Google Scholar] [CrossRef]
- Khan, A. N., Mehmood, K., & Ali, A. (2024). Maximizing CSR impact: Leveraging artificial intelligence and process optimization for sustainability performance management. Corporate Social Responsibility and Environmental Management, 31(5), 4849–4861. [Google Scholar] [CrossRef]
- Khan, W. A., Chung, S. H., Awan, M. U., & Wen, X. (2020). Machine learning facilitated business intelligence (Part I) Neural networks learning algorithms and applications. Industrial Management & Data Systems, 120(1), 164–195. [Google Scholar]
- Kochkina, N., Andriushchenko, I., & Gatto, G. (2024, October 10–12). Strategic AI adoption: Economic impact, case studies from handy. ai, and industry readiness. 2024 IEEE International Conference on Artificial Intelligence & Green Energy (ICAIGE) (pp. 1–6), Yasmine Hammamet, Tunisia. [Google Scholar]
- Kotrachai, C., Chanruangrat, P., Thaipisutikul, T., Kusakunniran, W., Hsu, W. C., & Sun, Y. C. (2023, November 15–17). Explainable AI supported evaluation and comparison on credit card fraud detection models. 2023 7th International Conference on Information Technology (InCIT) (pp. 86–91), Chiang Rai, Thailand. [Google Scholar]
- Kukreja, A. (2025). AI Adoption in SMEs: Integrating supply chain and financial strategies for competitive advantage. International Journal for Multidisciplinary Research, 7(1). [Google Scholar] [CrossRef]
- Kumah, M. S. K., Fiakumah, W. K., Gozah, E. K. A., & Edekor, L. K. (2024). Key factors that predict students’ mathematics competence in a college of education in Hohoe. Volta Region of Ghana. [Google Scholar]
- Kumari, B., Kaur, J., & Swami, S. (2022). Adoption of artificial intelligence in financial services: A policy framework. Journal of Science and Technology Policy Management, 15(2), 396–417. [Google Scholar] [CrossRef]
- Kwon, H. R., Hong, T. E., & Kim, P. (2020, September 17–19). Method of estimation of missing data in AMI system. 9th International Conference on Smart Media and Applications (pp. 39–43), Jeju, Republic of Korea. [Google Scholar]
- Leogrande, A., Magaletti, N., Cosoli, G., & Massaro, A. (2022). e-Government in Europe. A machine learning approach. Available at SSRN. [Google Scholar] [CrossRef]
- Li, K., Cai, Y., Pei, Y., & Yuan, C. (2025). The impact of artificial intelligence adoption on firms’ innovation performance in the digital era: Based on dynamic capabilities theory. International Theory and Practice in Humanities and Social Sciences, 2(3), 228–237. [Google Scholar] [CrossRef]
- Licchetta, M., & Meyermans, E. (2022). Gross fixed capital formation in the euro area during the COVID-19 pandemic. Intereconomics, 57(4), 238–246. [Google Scholar] [CrossRef]
- Lopez-Garcia, J., & Rojas, E. M. (2024, August 21–23). Barriers to AI adoption and their influence on technological advancement in the manufacturing and finance and insurance industries. 2024 IEEE Colombian Conference on Communications and Computing (COLCOM) (pp. 1–6), Barranquilla, Colombia. [Google Scholar]
- Lundvall, B. A. (1992). National systems of innovation: Towards a theory of innovation and interactive learning (Vol. 242). Pinter. [Google Scholar]
- Maccarrone, G., Morelli, G., & Spadaccini, S. (2021). GDP forecasting: Machine learning, linear or autoregression? Frontiers in Artificial Intelligence, 4, 757864. [Google Scholar] [CrossRef]
- Mallik, A. K. (2023). The future of the technology-based manufacturing in the European Union. Results in Engineering, 19, 101356. [Google Scholar] [CrossRef]
- Marčeta, M., & Bojnec, Š. (2023). Trade openness, global competitiveness, and catching up between the European Union countries. Review of International Business and Strategy, 33(4), 691–714. [Google Scholar] [CrossRef]
- Merkulova, T., & Nikolaeva, O. (2022). Cluster analysis of tax indicators in Europien countries (Vol. 102, pp. 69–81). Bulletin of VN Karazin Kharkiv National University Economic Series. VN Karazin Kharkiv National University. [Google Scholar]
- Misuraca, G., & Van Noordt, C. (2020). AI watch-Artificial intelligence in public services: Overview of the use and impact of AI in public services in the EU (JRC Research Reports, (JRC120399)). Publications Office of the European Union. [Google Scholar]
- Morina, F., Misiri, V., & Alijaj, S. (2024). Examining the relationship between public debt and private consumption in European OECD countries (2011–2020). Quantitative Finance and Economics, 8(1), 75–102. [Google Scholar] [CrossRef]
- Nenov, I., Simeonova-Ganeva, R., Ganev, K., & Mengov, G. (2023, October 5–7). A neural model forecasts macroeconomic indicators. 2023 International Conference Automatics and Informatics (ICAI) (pp. 156–159), Varna, Bulgaria. [Google Scholar]
- Nguyen, D., & Santarelli, E. (2024). Trade openness and the diffusion of artificial intelligence technologies in Europe: A panel data approach. European Economic Review, 154, 104218. [Google Scholar]
- Niedzielski, T., & Halicki, M. (2023). Improving linear interpolation of missing hydrological data by applying integrated autoregressive models. Water Resources Management, 37(14), 5707–5724. [Google Scholar] [CrossRef]
- Ning, Y., Ong, M. E. H., Chakraborty, B., Goldstein, B. A., Ting, D. S. W., Vaughan, R., & Liu, N. (2022). Shapley variable importance cloud for interpretable machine learning. Patterns, 3(4), 100452. [Google Scholar] [CrossRef]
- Okoye, K. (2023, October 13–15). Technology-mediated method for prediction of global government investment in education toward sustainable development and aid using machine learning and classification. 2023 IEEE Global Humanitarian Technology Conference (GHTC) (pp. 151–158), Radnor, PA, USA. [Google Scholar]
- Olasiuk, H., Kumar, S., Singh, S., & Ganushchak, T. (2023, December 1–3). Mapping research clusters of artificial intelligence for financial services using topic modelling: A machine learning insight. 2023 Global Conference on Information Technologies and Communications (GCITC) (pp. 1–6), Bengaluru, India. [Google Scholar]
- Oldemeyer, L., Jede, A., & Teuteberg, F. (2025). Investigation of artificial intelligence in SMEs: A systematic review of the state of the art and the main implementation challenges. Management Review Quarterly, 75(2), 1185–1227. [Google Scholar] [CrossRef]
- Ozkan-Okay, M., Akin, E., Aslan, Ö., Kosunalp, S., Iliev, T., Stoyanov, I., & Beloev, I. (2024). A comprehensive survey: Evaluating the efficiency of artificial intelligence and machine learning techniques on cyber security solutions. IEEE Access, 12, 12229–12256. [Google Scholar] [CrossRef]
- Papagiannis, F., Gazzola, P., Burak, O., & Pokutsa, I. (2021). A European household waste management approach: Intelligently clean Ukraine. Journal of Environmental Management, 294, 113015. [Google Scholar] [CrossRef]
- Pehlivan, C. N. (2024). Report: The EU artificial intelligence (AI) Act: An introduction. Global Privacy Law Review, 5(1), 31–42. [Google Scholar] [CrossRef]
- Popescu, R., Corboș, R.-A., & Bunea, O. (2024). From bytes to insights through a bibliometric journey into AI’s influence on public services. Applied Research in Administrative Sciences. [Google Scholar]
- Popović, A., Todorović, A., & Milijić, A. (2025). Artificial intelligence adoption and its influence on circular material use: An EU cross-country analysis. Economics of Sustainable Development, 9(1), 1–28. [Google Scholar] [CrossRef]
- Purnomo, B. R. (2023). Artificial intelligence and innovation practices: A conceptual inquiry. Jurnal Fokus Manajemen Bisnis, 13(2), 215–228. [Google Scholar] [CrossRef]
- Rađenović, Ž., Janjić, I., & Talić, M. (2024). Targeting eco-innovation performance among EU countries: Cluster outcome. SCIENCE International Journal, 3(1), 189–194. [Google Scholar] [CrossRef]
- Raj, D. K., & Gopikrishnan, T. (2024). Soft computing techniques for predicting vegetation dynamics in Delhi. Journal of Earth System Science, 133(4), 241. [Google Scholar] [CrossRef]
- Ruiz-Real, J. L., Uribe-Toril, J., Arriaza Torres, J. A., & de Pablo Valenciano, J. (2021). Artificial intelligence in business and economics research: Trends and future. Business Economics and Management (JBEM), 22(1), 98–117. [Google Scholar] [CrossRef]
- Sarmas, E., Fragkiadaki, A., & Marinakis, V. (2024). Explainable AI-based ensemble clustering for load profiling and demand response. Energies, 17(22), 5559. [Google Scholar] [CrossRef]
- Schulz, M., Pehl, M., & Trinitis, C. (2024, May 7–9). The European chips act and its impact on teaching. 21st ACM International Conference on Computing Frontiers: Workshops and Special Sessions (p. 146), Ischia, Italy. [Google Scholar]
- Sehgal, D., Kaur, I., Sharma, V., Gautam, B., Singh, A., & Kumar, N. (2024, July 27–28). AI-driven early diabetes prediction. 2024 IEEE 3rd World Conference on Applied Intelligence and Computing (AIC) (pp. 40–48), Gwalior, India. [Google Scholar]
- Shi, W., Karastoyanova, D., Huang, Y., & Zhang, G. (2023). Bidirectional piecewise linear representation of time series and its application in clustering. IEEE Transactions on Instrumentation and Measurement, 72, 1–13. [Google Scholar] [CrossRef]
- Shokouhifar, M., Fanian, F., Rafsanjani, M. K., Hosseinzadeh, M., & Mirjalili, S. (2024). AI-driven cluster-based routing protocols in WSNs: A survey of fuzzy heuristics, metaheuristics, and machine learning models. Computer Science Review, 54, 100684. [Google Scholar] [CrossRef]
- Siddik, A. B., Forid, M. S., Yong, L., Du, A. M., & Goodell, J. W. (2025). Artificial intelligence as a catalyst for sustainable tourism growth and economic cycles. Technological Forecasting and Social Change, 210, 123875. [Google Scholar] [CrossRef]
- Song, H. (2024). Multiple impacts of artificial intelligence on employment: Skill-biased automation and the need for reskilling. Technology and Employment Journal, 39(1), 87–103. [Google Scholar]
- Spagnuolo, F., Casciello, R., Martino, I., & Meucci, F. (2025). Exploring the impact of artificial intelligence on the pursuit of SDGs: Evidence from European state-owned enterprises. Corporate Social Responsibility and Environmental Management, 32(2), 1987–2001. [Google Scholar] [CrossRef]
- Stokman, A. (2023). Accelerating inflation expectations of households in the euro area: Sources and macroeconomic spending consequences. Applied Economics Letters, 31(18), 1925–1930. [Google Scholar] [CrossRef]
- Stroumpoulis, A., Kopanaki, E., & Varelas, S. (2022). Role of artificial intelligence and big data analytics in smart tourism: A resource-based view approach. WIT Transactions on Ecology and the Environment, 256(2022), 99–108. [Google Scholar]
- Sultana, F., Talpur, U., Iqbal, M. S., Ali, A., & Memon, K. H. (2024). The macroeconomic implications of automation and AI on labor markets and employment. The Critical Review of Social Sciences Studies, 2(2), 497–507. [Google Scholar] [CrossRef]
- Sutanto, T., Aditya, M. R., Budiman, H., Ridha, M. R. N., Syapotro, U., & Azijah, N. (2024). Comparison of logistic regression, random forest, svm, knn algorithm for water quality classification based on contaminant parameters. Journal of Data Science, 2024(48), 1–7. [Google Scholar] [CrossRef]
- Szczepanski, M. (2019). Economic impacts of artificial intelligence (AI). Available online: https://policycommons.net/artifacts/1334867/economic-impacts-of-artificial-intelligence-ai/1940720/ (accessed on 20 July 2025).
- Tapeh, A. T. G., & Naser, M. Z. (2023). Artificial intelligence, machine learning, and deep learning in structural engineering: A scientometrics review of trends and best practices. Archives of Computational Methods in Engineering, 30(1), 115–159. [Google Scholar] [CrossRef]
- Thamrin, N., & Wijayanto, A. W. (2021). Comparison of soft and hard clustering: A case study on welfare level in cities on Java Island: Analisis cluster dengan menggunakan hard clustering dan soft clustering untuk pengelompokkan tingkat kesejahteraan kabupaten/kota di pulau Jawa. Indonesian Journal of Statistics and Its Applications, 5(1), 141–160. [Google Scholar] [CrossRef]
- Tiutiunyk, I., Drabek, J., Antoniuk, N., Navickas, V., & Rubanov, P. (2021). The impact of digital transformation on macroeconomic stability: Evidence from EU countries. Journal of International Studies (2071–8330), 14(3), 220–234. [Google Scholar] [CrossRef]
- Trabelsi, M. A. (2024). The impact of artificial intelligence on economic development. Journal of Electronic Business & Digital Economics, 3(2), 142–155. [Google Scholar] [CrossRef]
- Uren, V., & Edwards, J. (2023). Technology readiness and the organizational journey towards AI adoption: An empirical study. International Journal of Information Management, 68, 102588. [Google Scholar] [CrossRef]
- Usman, M., Saeed, A., Latif, A., & Zakir, A. (2024). Energy consumption and trade liberalization: Investigating performance of economic growth for French economy. Journal of Asian Development Studies, 13(1), 402–411. [Google Scholar] [CrossRef]
- Übellacker, T. (2025). Making sense of AI limitations: How individual perceptions shape organizational readiness for AI adoption. arXiv, arXiv:2502.15870. [Google Scholar] [CrossRef]
- Varian, H. R. (2018). Artificial intelligence, economics, and industrial organization (Vol. 24839). National Bureau of Economic Research. [Google Scholar]
- Vijayalakshmi, V., Selvakumar, A., & Panimalar, K. (2023, January 23–25). Implementation of medical insurance price prediction system using regression algorithms. 2023 5th International Conference on Smart Systems and Inventive Technology (ICSSIT) (pp. 1529–1534), Tirunelveli, India. [Google Scholar]
- Wagan, S. M., & Sidra, S. (2024). Exploring the impact of ai research, venture capital investment, and adoption on productivity: A multi-country panel data analysis. Journal of European Economy, 23(4), 688–713. [Google Scholar] [CrossRef]
- Wagner, D. N. (2020). Economic patterns in a world with artificial intelligence. Evolutionary and Institutional Economics Review, 17(1), 111–131. [Google Scholar] [CrossRef]
- Walters, B., Ortega-Martorell, S., Olier, I., & Lisboa, P. J. (2022, July 18–23). Towards interpretable machine learning for clinical decision support. 2022 International Joint Conference on Neural Networks (IJCNN) (pp. 1–8), Padua, Italy. [Google Scholar]
- Wang, C., & Jiao, D. (2025). Impact of artificial intelligence on the labor income distribution: Labor substitution or production upgrading? Finance Research Letters, 73, 106674. [Google Scholar] [CrossRef]
- Wang, L., Sarker, P., Alam, K., & Sumon, S. (2021). Artificial intelligence and economic growth: A theoretical framework. Scientific Annals of Economics and Business, 68(4), 421–443. [Google Scholar] [CrossRef]
- Wang, X., He, T., Wang, S., & Zhao, H. (2025). The impact of artificial intelligence on economic growth from the perspective of population external system. Social Science Computer Review, 43(1), 129–147. [Google Scholar] [CrossRef]
- Wang, Y., Xie, Y., Wu, Y., & Yang, Y. (2024). Improved KNN-based Stock Price Prediction. Academic Journal of Computing & Information Science, 7(6), 38–43. [Google Scholar] [CrossRef]
- Webb, M. (2019). The impact of artificial intelligence on the labor market. Available online: https://ssrn.com/abstract=3482150 (accessed on 20 July 2025).
- Wolff, J., Pauling, J., Keck, A., & Baumbach, J. (2020). The economic impact of artificial intelligence in health care: Systematic review. Journal of medical Internet research, 22(2), e16866. [Google Scholar] [CrossRef]
- Yum, M. (2022). Model selection for panel data models with fixed effects: A simulation study. Applied Economics Letters, 29(19), 1776–1783. [Google Scholar] [CrossRef]
- Zavodna, L. S., Überwimmer, M., & Frankus, E. (2024). Barriers to the implementation of artificial intelligence in small and medium-sized enterprises: Pilot study. Journal of Economics and Management, 46, 331–352. [Google Scholar] [CrossRef]
- Zekos, G. I. (2021). Economics and law of artificial intelligence. Finance, economic impacts, risk management and governance. Springer. [Google Scholar]
- Zeleke, A. J., Palumbo, P., Tubertini, P., Miglio, R., & Chiari, L. (2023). Machine learning-based prediction of hospital prolonged length of stay admission at emergency department: A Gradient Boosting algorithm analysis. Frontiers in Artificial Intelligence, 6, 1179226. [Google Scholar] [CrossRef] [PubMed]
- Žarković, M., Ćetković, J., & Cvijović, J. (2025). Economic growth determinants in old and new EU countries. Panoeconomicus, 72(2), 183–210. [Google Scholar] [CrossRef]

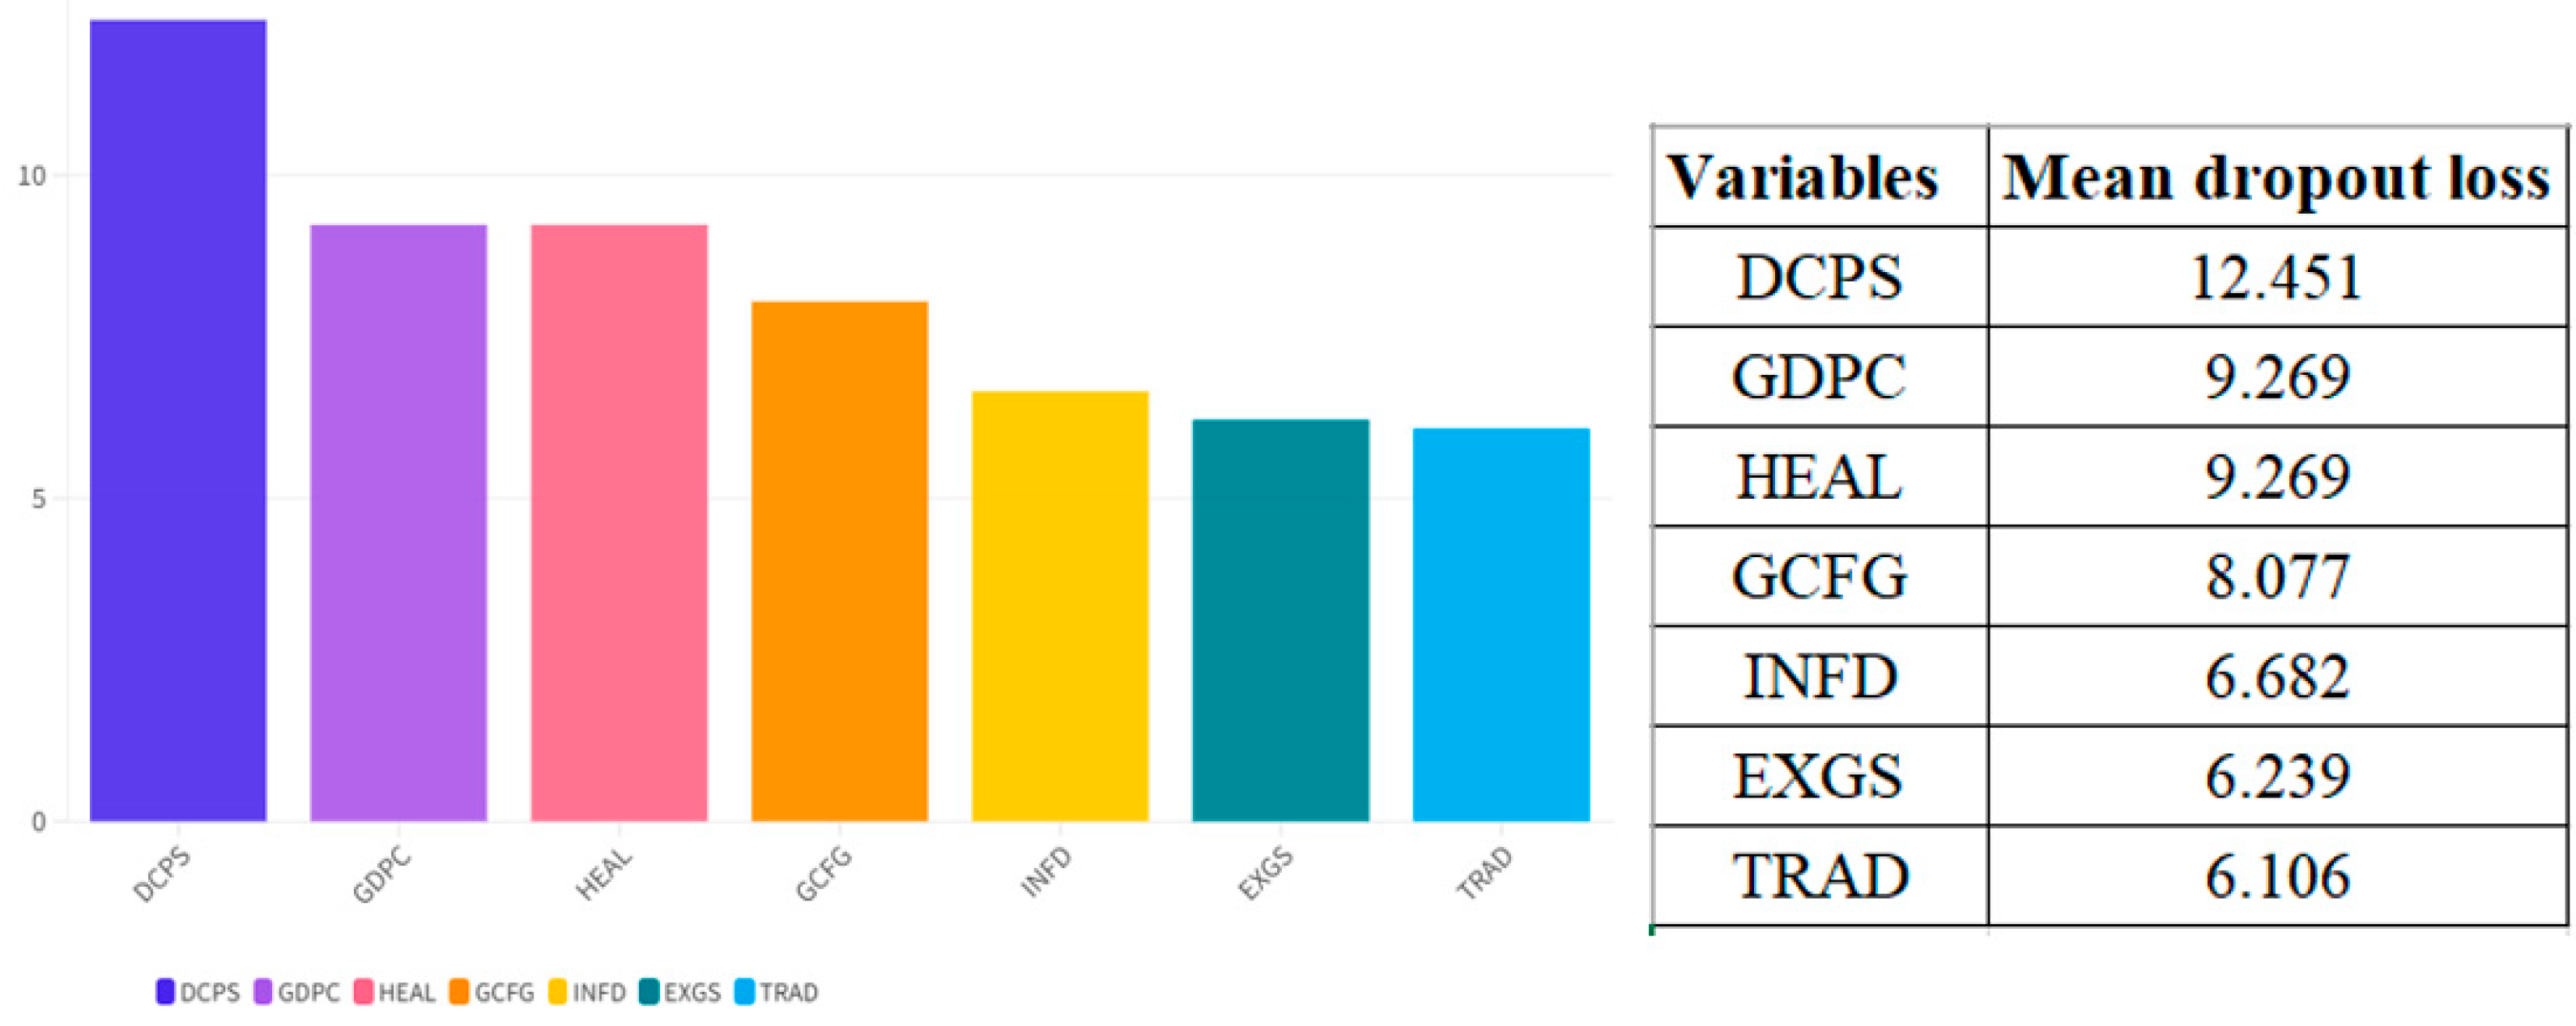
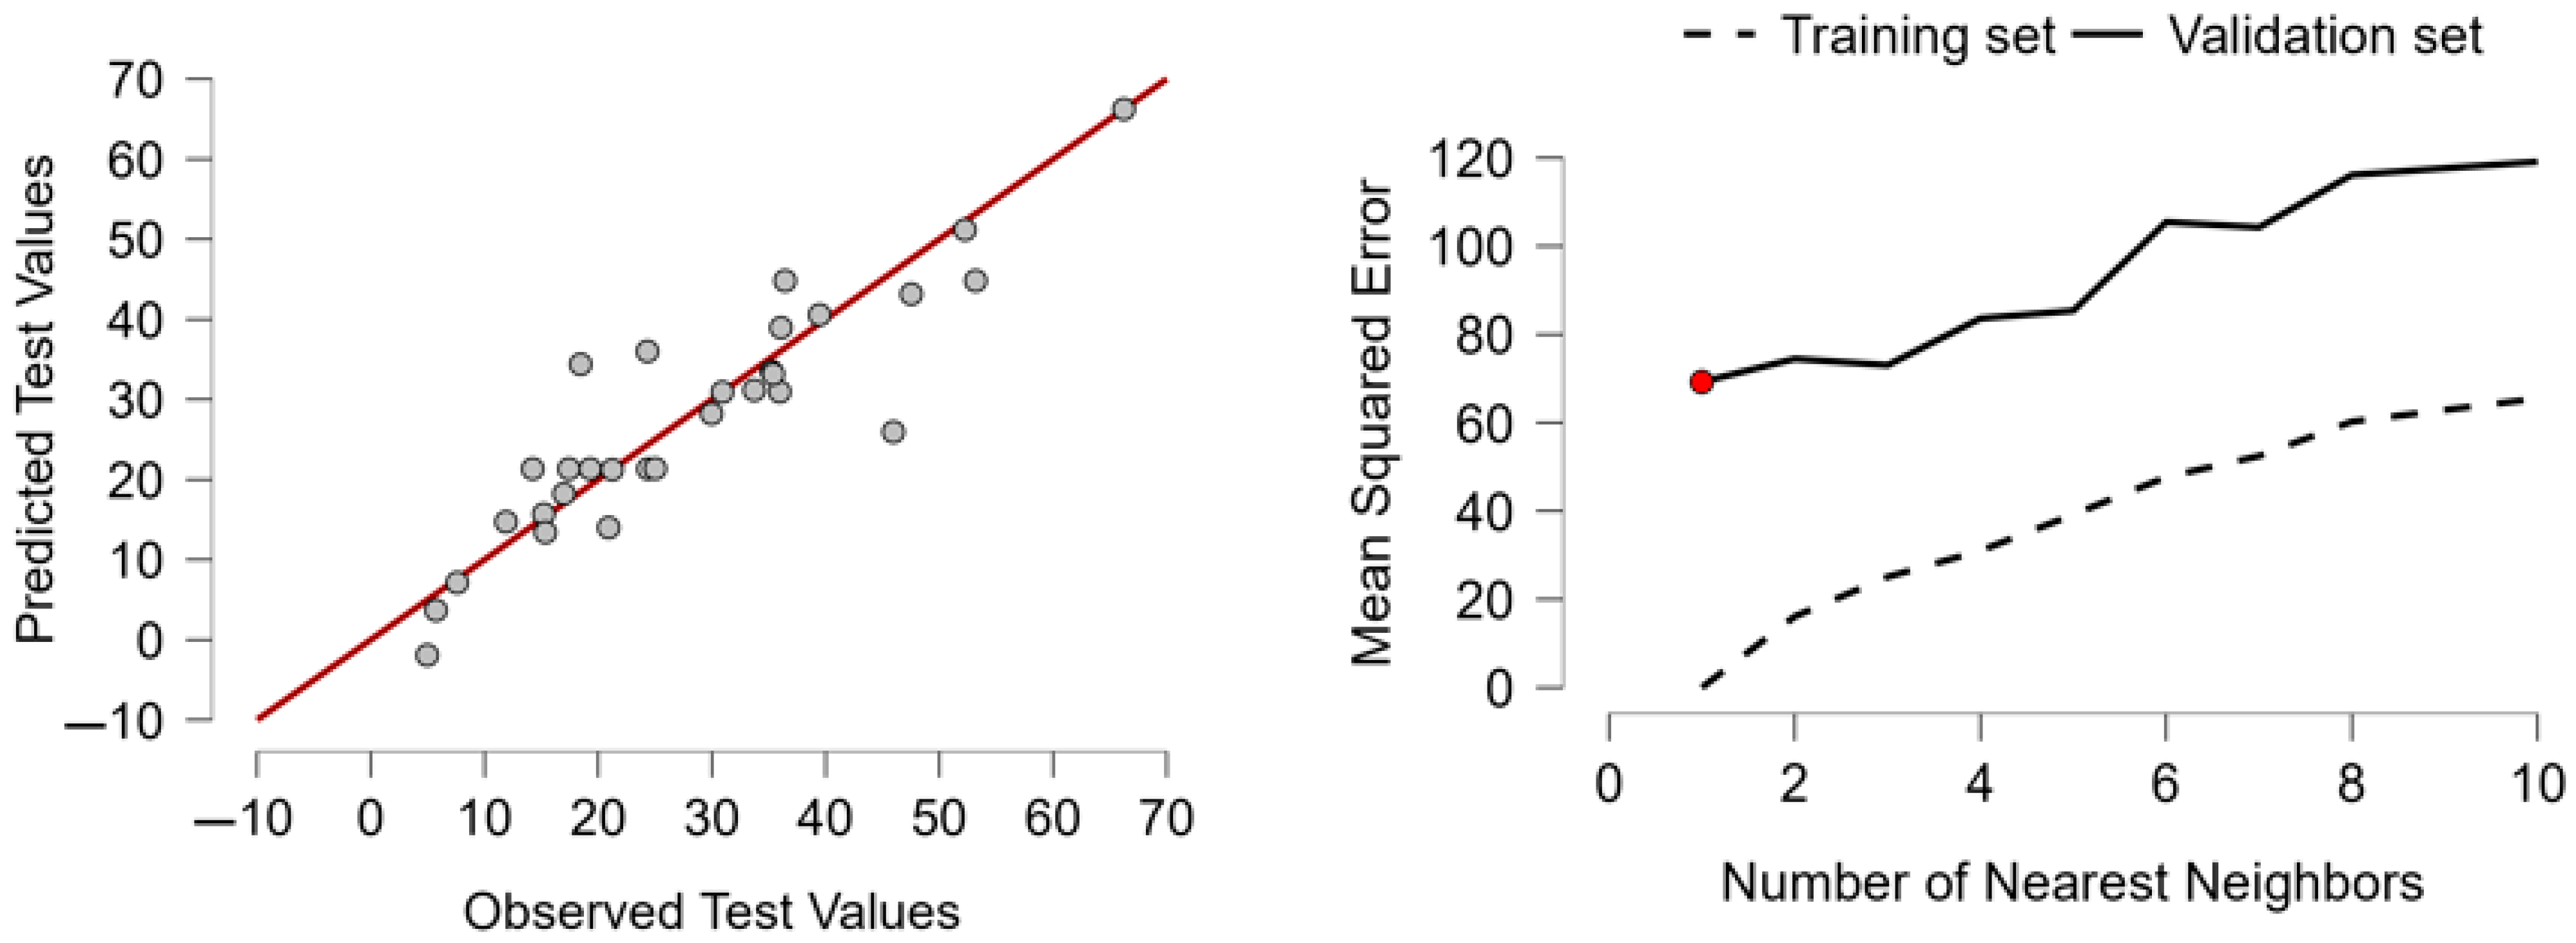
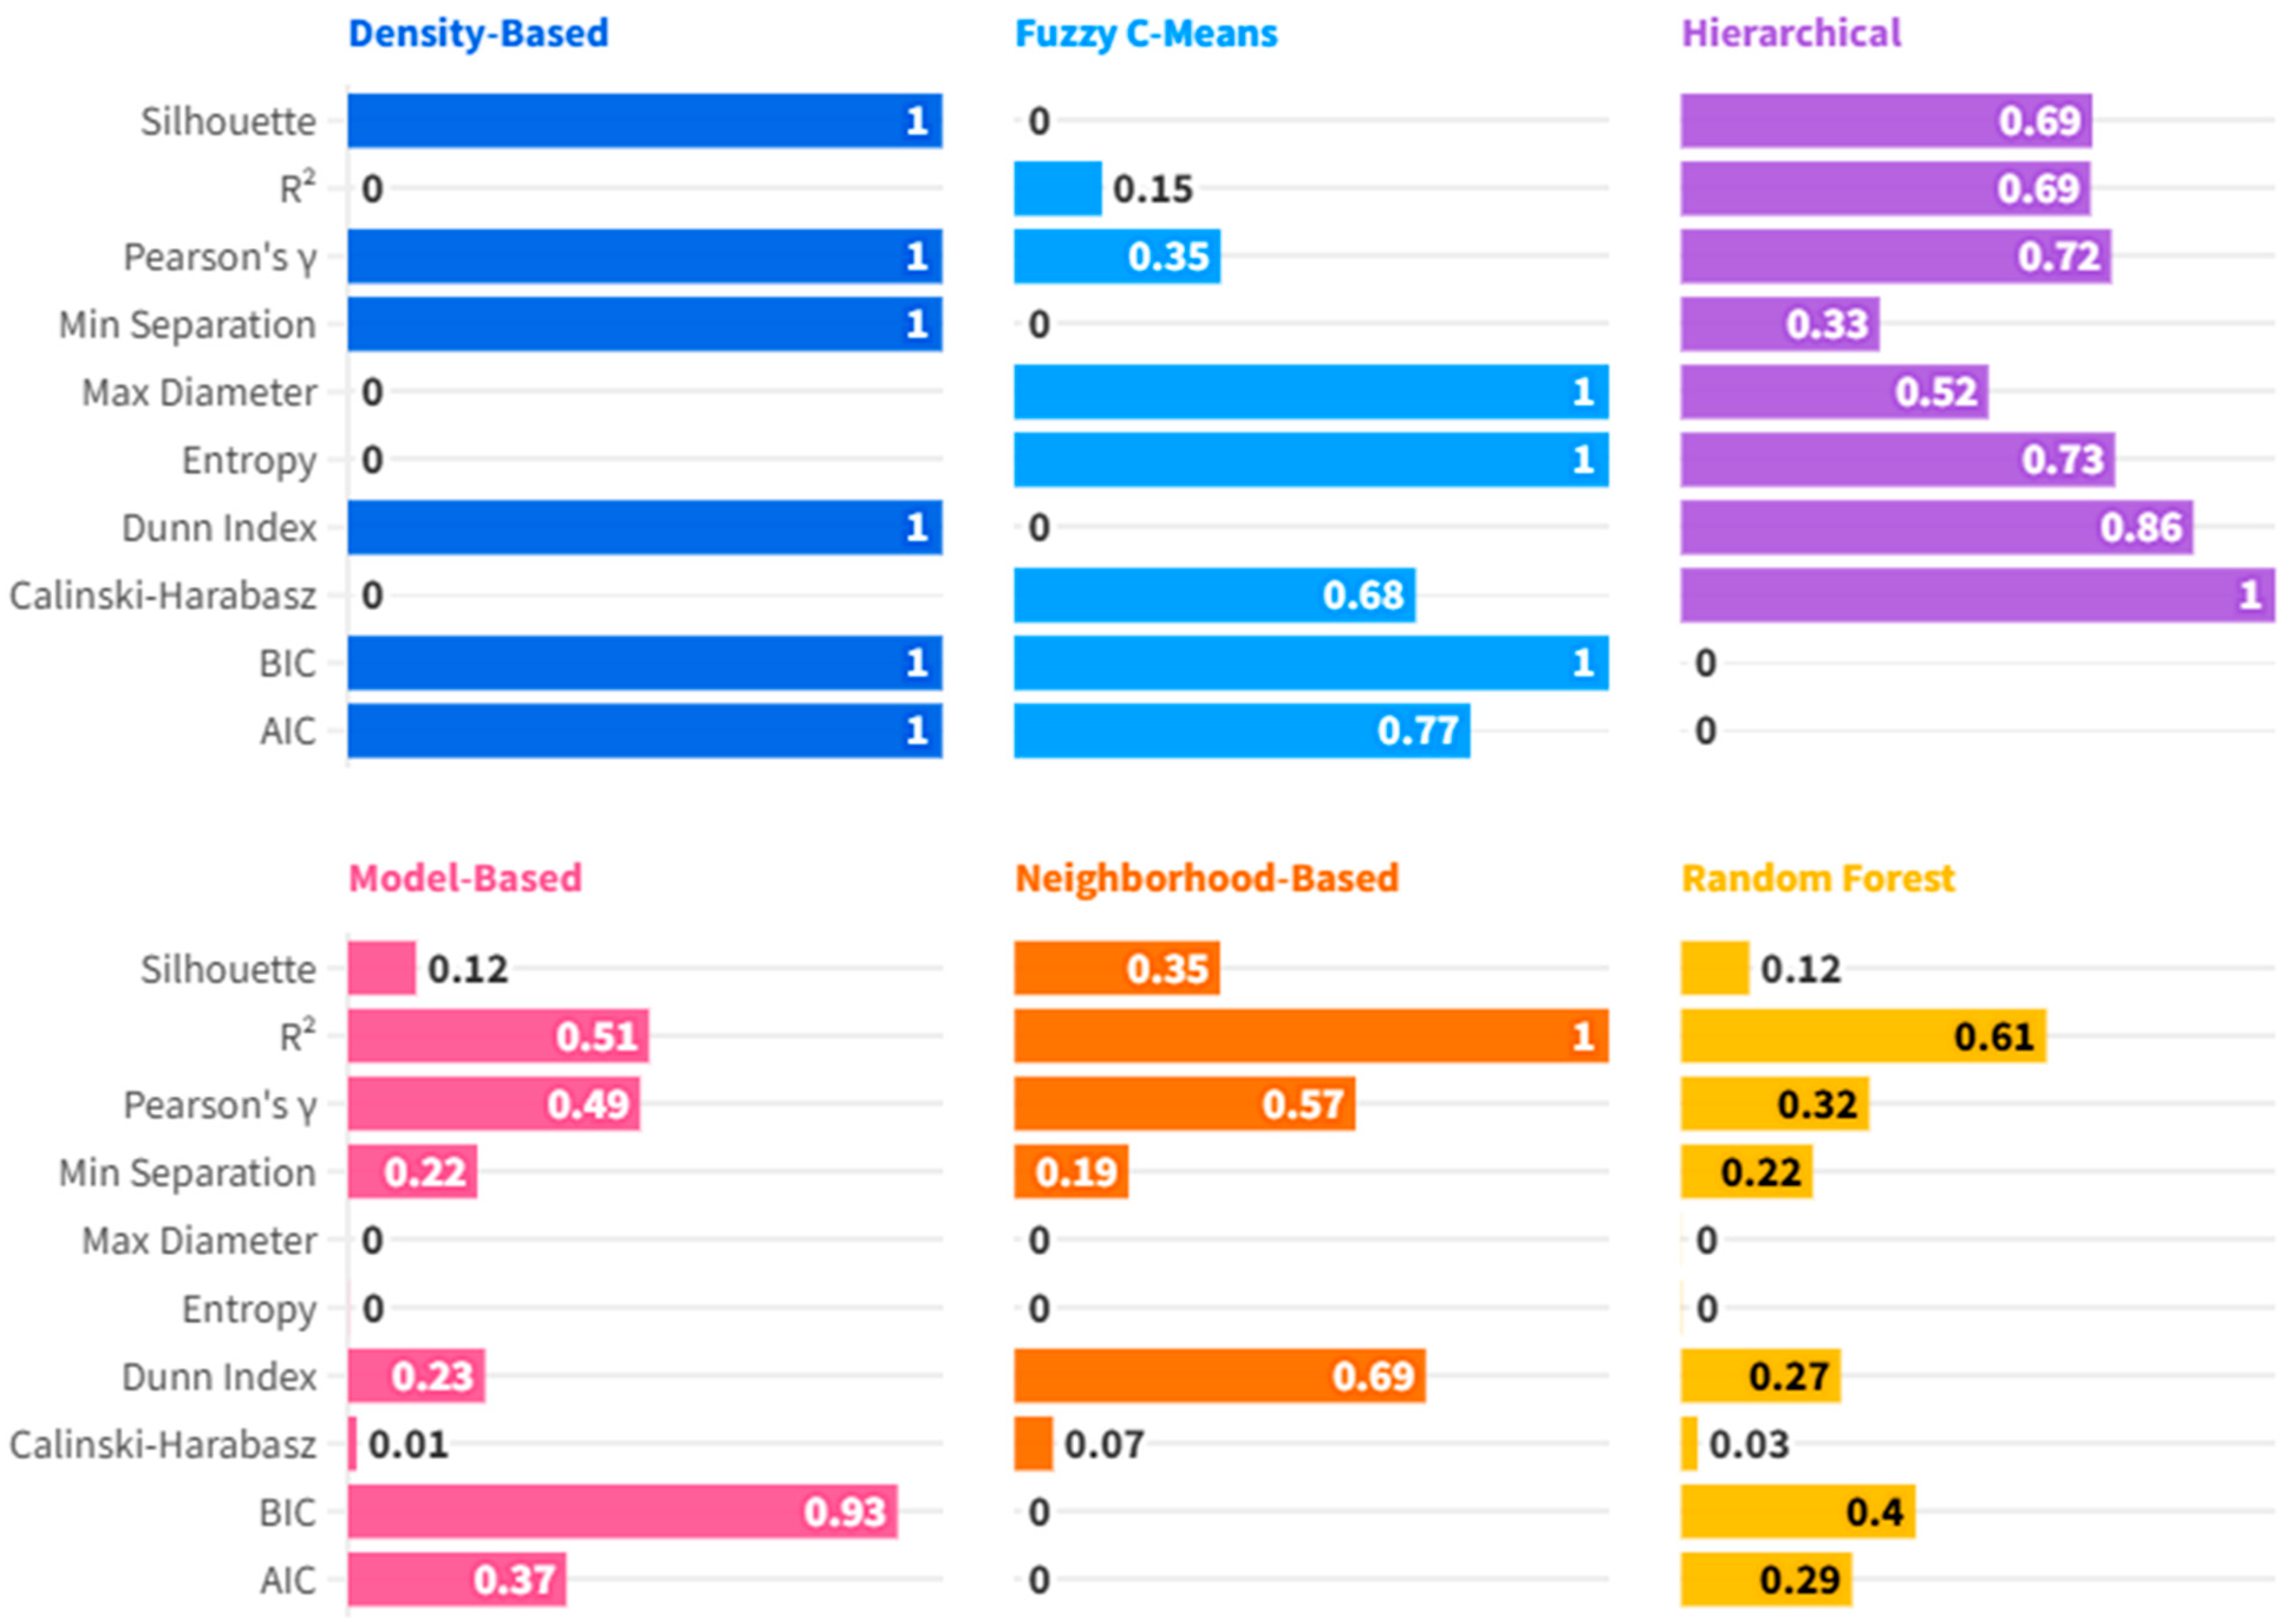
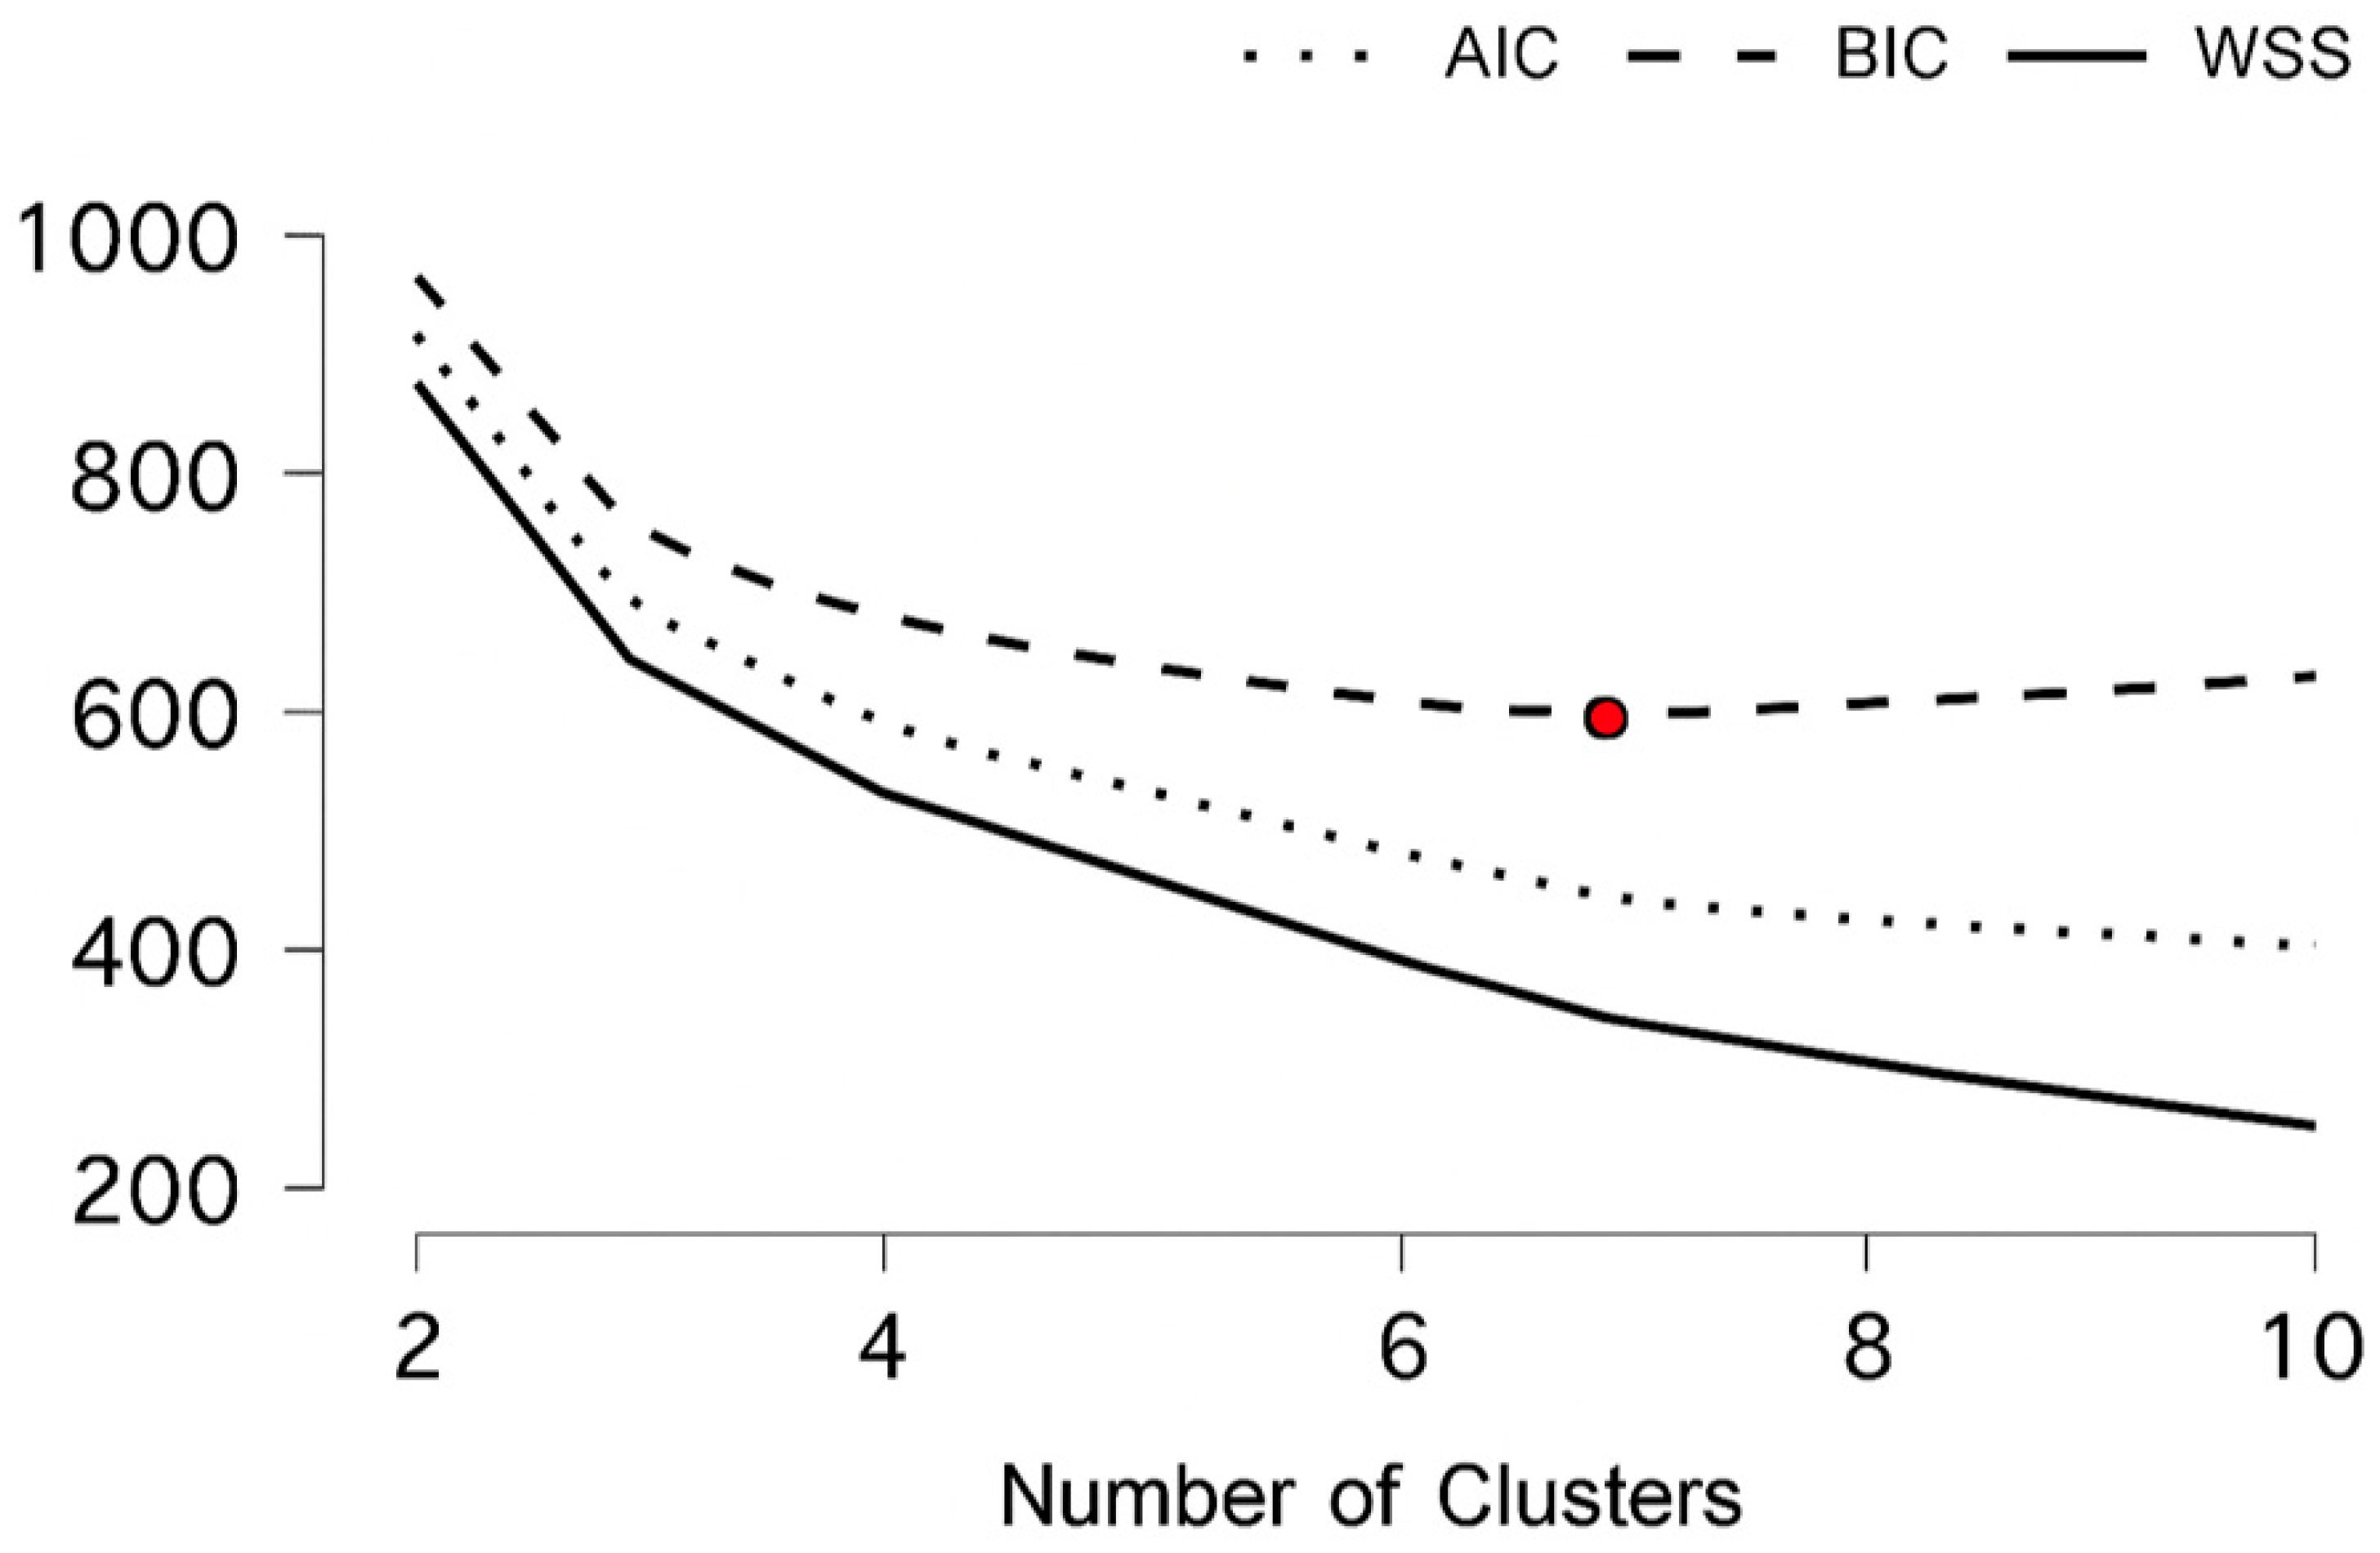
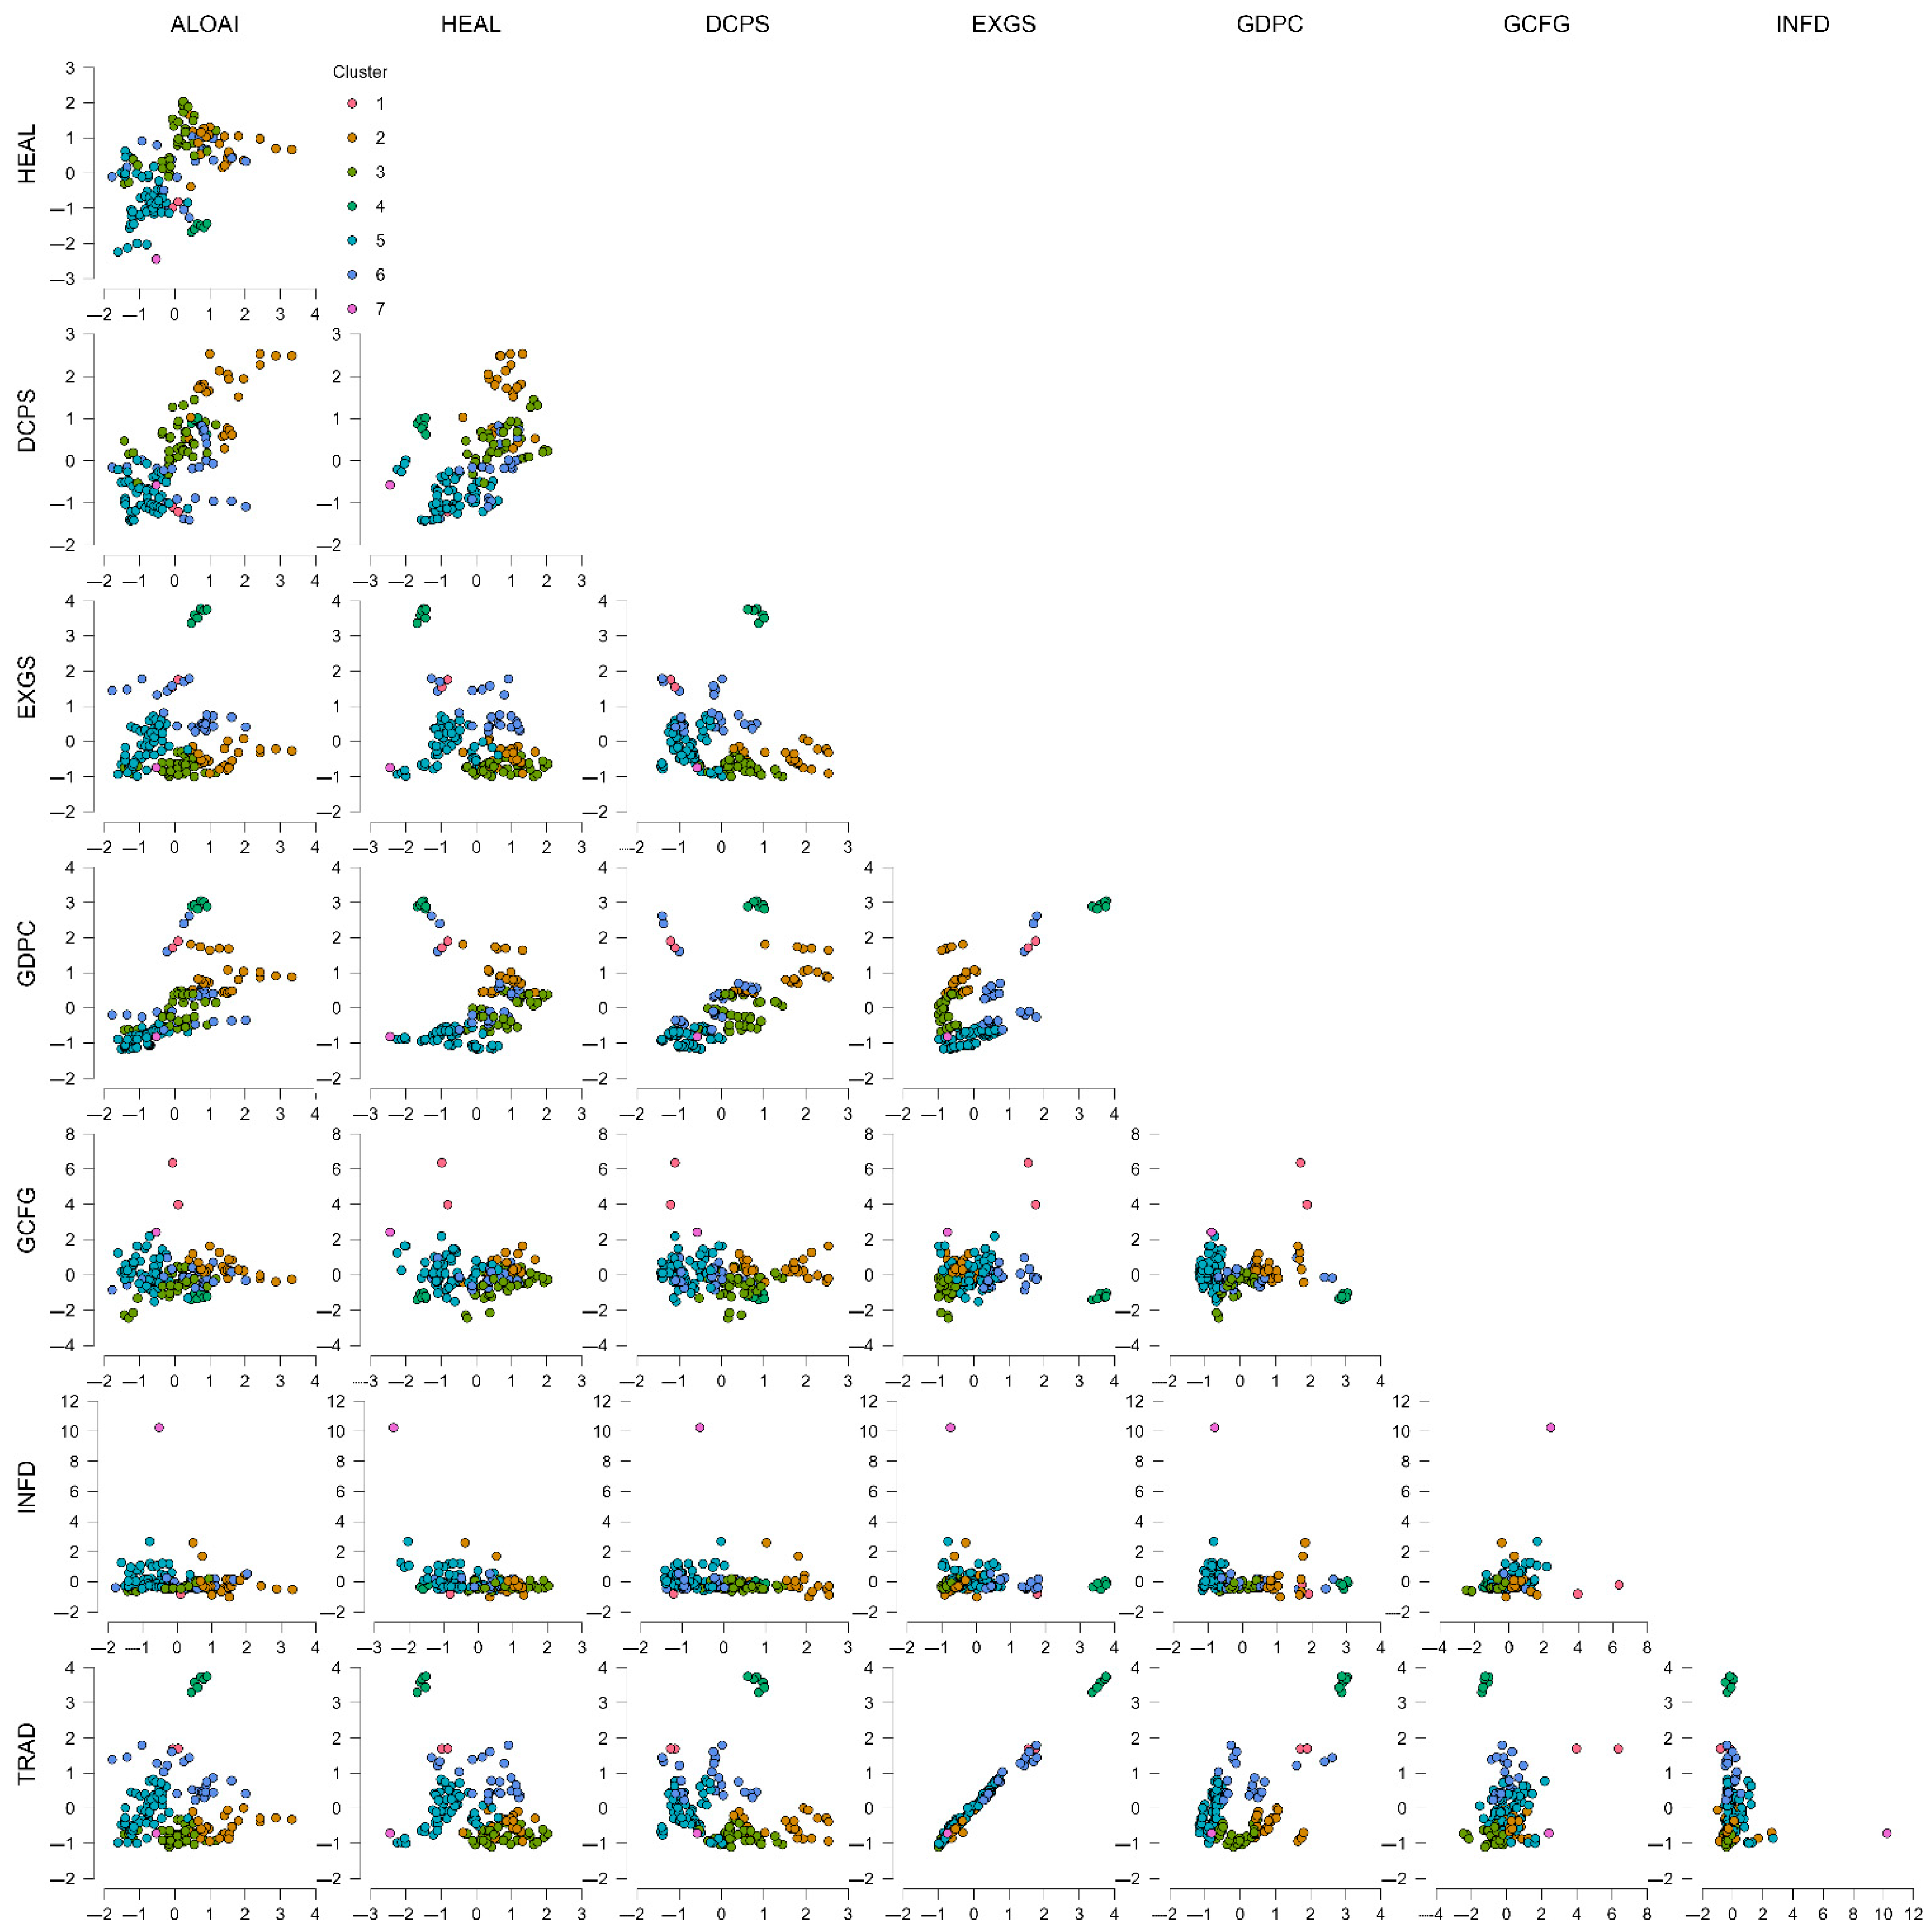
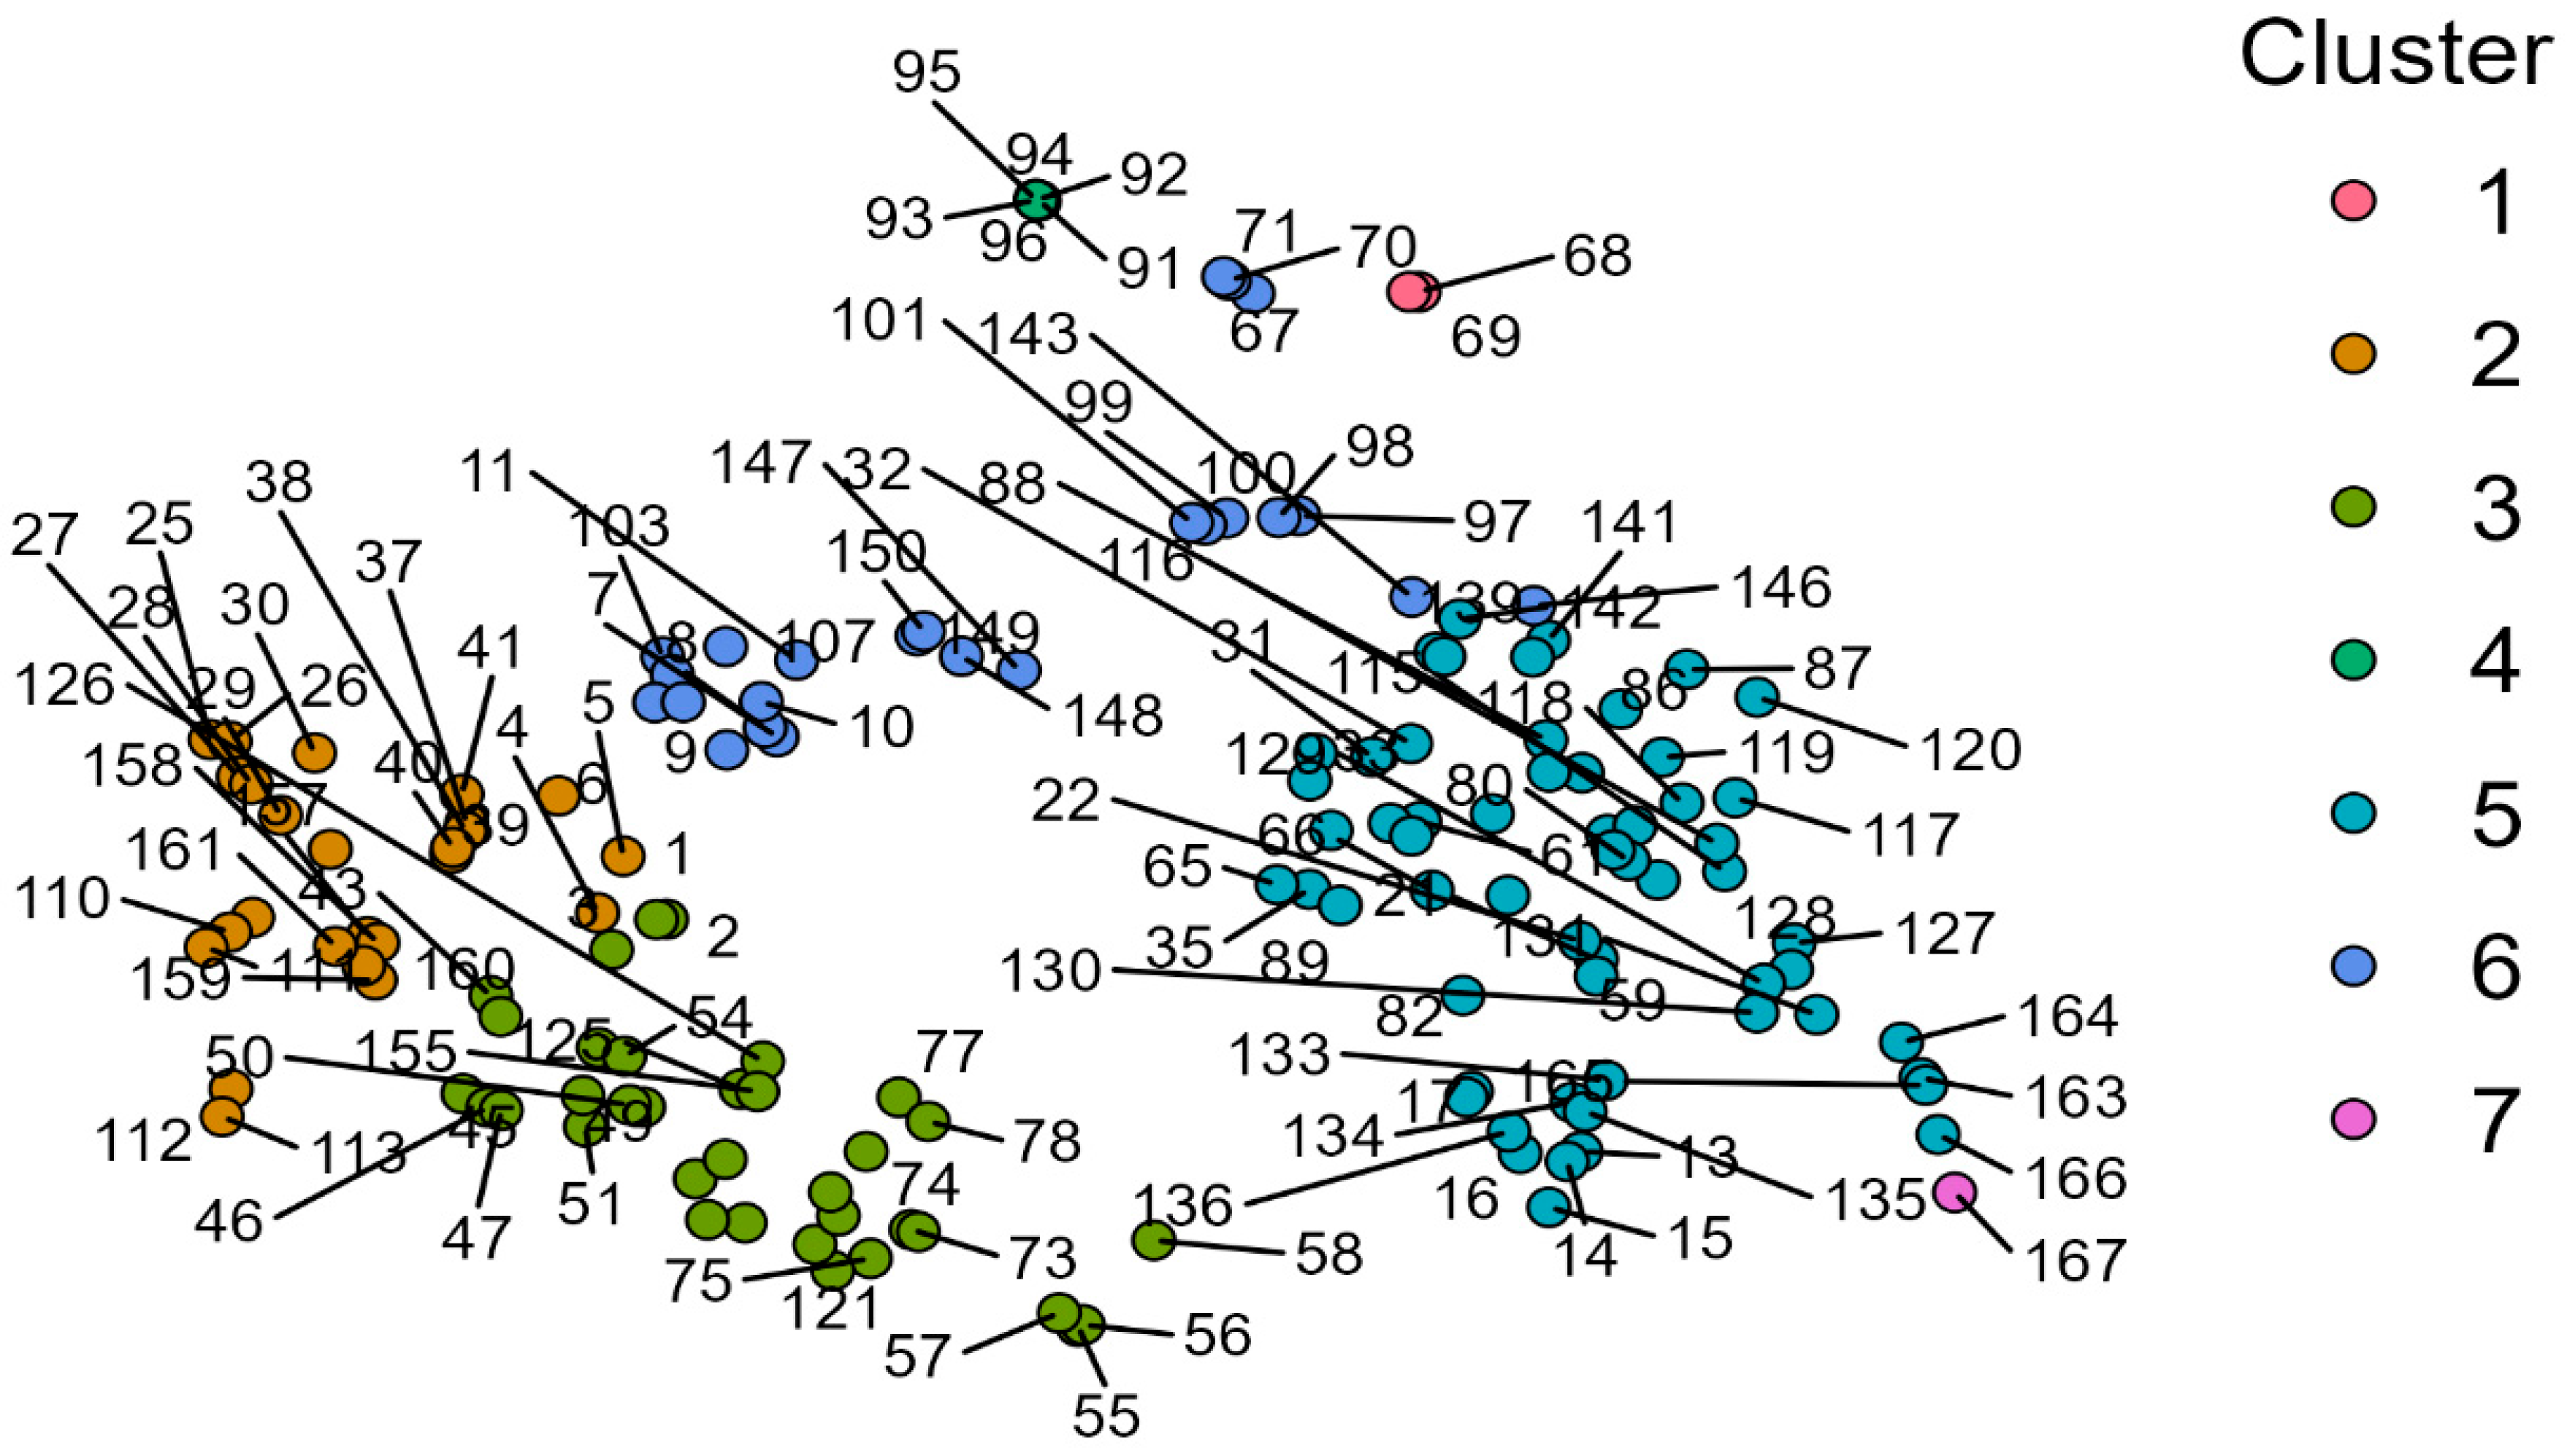
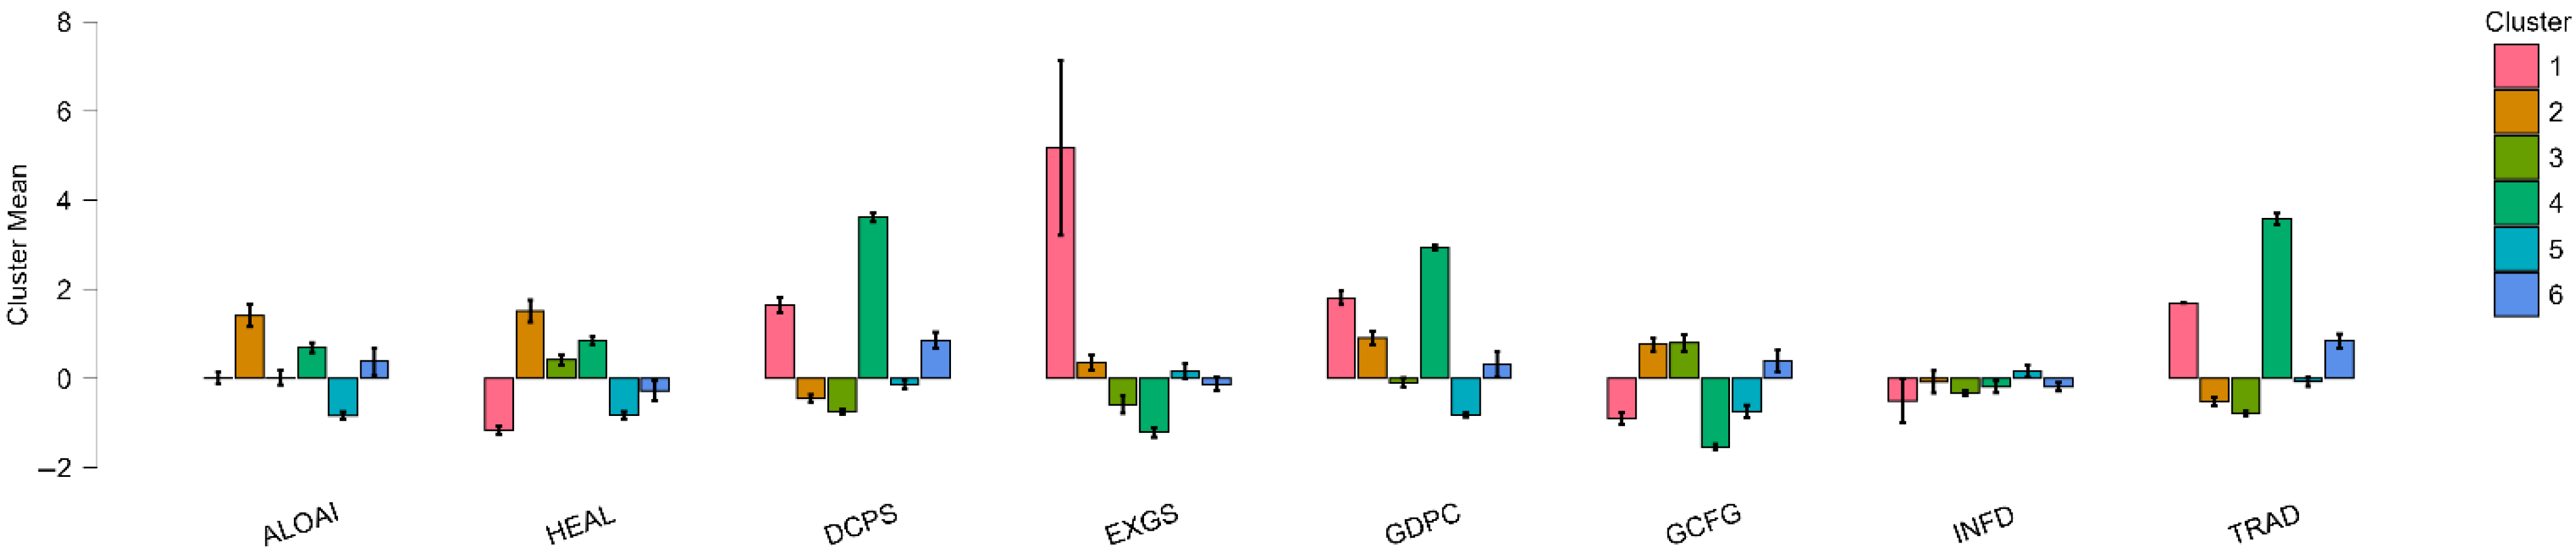
Disclaimer/Publisher’s Note: The statements, opinions and data contained in all publications are solely those of the individual author(s) and contributor(s) and not of MDPI and/or the editor(s). MDPI and/or the editor(s) disclaim responsibility for any injury to people or property resulting from any ideas, methods, instructions or products referred to in the content. |
© 2025 by the authors. Licensee MDPI, Basel, Switzerland. This article is an open access article distributed under the terms and conditions of the Creative Commons Attribution (CC BY) license (https://creativecommons.org/licenses/by/4.0/).