Drivers of S&P 500’s Profitability: Implications for Investment Strategy and Risk Management
Abstract
1. Introduction
2. Literature Review
3. Materials and Methods
- Unemployment rate in the USA (UR US 2023),
- Inflation rate in the USA (CPI 2023),
- Nominal amount of GDP in the USA (US GDP 2023),
- Basic interest rates in the USA (FFR 2023),
- Volatility index (CBOE 2023),
- Dollar index (NB US 2023),
- Index of economic activity in the USA (CEAI 2023),
- Index of industrial production in the USA (IP TI 2023),
- Trade balance in the USA (TB 2023),
- Monetary aggregate M2 (M2 2023),
- Return of the S&P 500 stock index (SP 2023; S&P NASDAQ 2023),
- Monthly yield (coupon) of 30-year US government bonds (MY US 2023),
- Gold yield (GSP 2023),
- Bitcoin yield (BHP 2023).
4. Results and Discussion
- The eigenvalue is less than 0.01.
- The conditionality index exceeds 30.
- The variance proportions for at least two explanatory variables are greater than 0.5.
5. Conclusions
Author Contributions
Funding
Institutional Review Board Statement
Informed Consent Statement
Data Availability Statement
Conflicts of Interest
References
- Aboura, Sofiane. 2022. A note on the Bitcoin and Fed Funds rate. Empirical Economics 63: 2577–603. [Google Scholar] [CrossRef]
- Akhtaruzzaman, Md, Brian M. Lucey, Sabri Boubaker, and Ahmet Sensoy. 2021. Is gold a hedge or a safe-haven asset in the COVID-19 crisis? Economic Modelling 102: 105588. [Google Scholar] [CrossRef]
- Al-Awadhi, Abdullah M., Khaled Alsaifi, Ahmad Al-Awadhi, and Salah Alhammadi. 2020. Death and contagious infectious diseases: Impact of the COVID-19 virus on stock market returns. Journal of Behavioral and Experimental Finance 27: 100326. [Google Scholar] [CrossRef]
- Albulescu, Claudiu T. 2021. COVID-19 and the United States financial markets’ volatility. Finance Research Letters 38: 101699. [Google Scholar] [CrossRef]
- Baker, Scott R., Nicholas Bloom, Steven J. Davis, Kyle Kost, Marco Sammon, and Tasaneeya Viratyosin. 2020. The unprecedented stock market reaction to COVID-19. The Review of Asset Pricing Studies 10: 742–58. [Google Scholar] [CrossRef]
- Bazetska, Hana, Deena Serogina, and Nadya Obukhova. 2021. Using the theories of behavioral economics in the process of analyzing the financial market as a method of increasing the efficiency of the functioning of the state economy. Paper presented at the 14th International Scientific Conference on Public Economics and Administration, Ostrava, Czech Republic, September 8; pp. 42–53. [Google Scholar]
- Becker, Ralf, Adam E. Clemens, and Andrew McClelland. 2009. The jump component of S&P 500 volatility and the VIX index. Journal of Banking & Finance 33: 1033–38. [Google Scholar]
- Belas, Jaroslav, and Ashiqur Rahman. 2023. Financial management of the company. Are there differences of opinion between owners and managers in the SME segment? Journal of Business Sectors 1: 1–9. [Google Scholar] [CrossRef]
- Bhar, Ramaprasad, Anastasios G. Malliaris, and Mary Malliaris. 2015. The impact of large-scale asset purchases on the S&P 500 index, long-term interest rates and unemployment. Applied Economics 47: 6010–18. [Google Scholar]
- BHP. 2023. Bitcoin Historical Data. Available online: https://www.investing.com/crypto/bitcoin/historical-data (accessed on 16 October 2023).
- Biardi, Lorenzo C., Massimo Costabile, Domenico De Giovanni, Fabio Lamantia, Arturo Leccadito, Ivar Massabo, Massimiliano Menzietti, Marco Pirra, Emilio Russo, and Alessandro Staino. 2020. The dynamics of the S&P 500 under a crisis context: Insights from a three-regime switching model. Risks 8: 71. [Google Scholar] [CrossRef]
- Billio, Monica, Roberto Casarin, Francesco Ravazzolo, and Herman K. van Dijk. 2013. Time-varying combinations of predictive densities using nonlinear filtering. Journal of Econometrics 177: 213–32. [Google Scholar] [CrossRef]
- Boateng, Ebenezer, Emmanuel Asafo Adjei, John G. Gatsi, Stefan C. Gherghina, and Liliana N. Simonescu. 2022. Multifrequency-based non-linear approach to analyzing implied volatility transmission across global financial markets. Oeconomia Copernicana 13: 699–743. [Google Scholar] [CrossRef]
- Campbell, John Y., and Robert J. Shiller. 1998. Stock prices, earnings, and expected dividends. Journal of Finance 43: 661–76. [Google Scholar] [CrossRef]
- Carverhill, Andrew, and Dan Luo. 2023. A Bayesian analysis of time-varying jump risk in S&P 500 returns and options. Journal of Financial Markets 64: 100786. [Google Scholar]
- CBOE (CBOE Volatility Index: VIX). 2023. Chicago Board Options Exchange. Available online: https://fred.stlouisfed.org/series/VIXCLS (accessed on 4 November 2023).
- CEAI (Coincident Economic Activity Index for the United States). 2023. Federal Reserve Bank of Philadelphia. Available online: https://fred.stlouisfed.org/series/USPHCI (accessed on 4 November 2023).
- Chan, Calvin, Han Wang, Ying Kong, and Jian W. Lin. 2021. An analysis of COVID-19 impacts on S&P 500 and FinTech index. International Journal of Financing Engineering 8: 2141003. [Google Scholar]
- Chebbi, Kaouther, Mohammed A. Ammer, and Affan Hameed. 2021. The COVID-19 pandemic and stock liquidity: Evidence from S&P 500. Quarterly Review of Economics and Finance 81: 134–42. [Google Scholar]
- Chen, Nai F., Richard Roll, and Stephen A. Ross. 1986. Economic forces and the stock market. Journal of Business 59: 383–403. [Google Scholar] [CrossRef]
- Chen, Siu S. 2009. Predicting the bear stock market: Macroeconomic variables as leading indicators. Journal of Banking & Finance 33: 211–23. [Google Scholar]
- Choi, Sun. Y. 2022. Dynamic volatility spillovers between industries in the US stock market: Evidence from the COVID-19 pandemic and Black Monday. North American Journal of Economics and Finance 59: 101614. [Google Scholar] [CrossRef]
- Chutka, Jan, and Ladislav Vagner. 2020. Efficiency of using technical indicators as a tool for predicting future price movements. Paper presented at the 9th International Scientific Symposium on Region Entrepreneurship Development, Osijek, Croatia, June 4–6; Osijek: Josip Juraj Strossmayer University Osijek, pp. 932–38. [Google Scholar]
- Cohen, Gil. 2023. Technical Analysis in Investing. Review of Pacific Basin Financial Markets and Policies 26: 12. [Google Scholar] [CrossRef]
- Corzo, Teresa, Laura Lazcano, Javier Márquez, Laura Gismera, and Sara Lumbreras. 2020. A common risk factor in global credit and equity markets: An exploratory analysis of the subprime and the sovereign-debt crises. Heliyon 6: e03980. [Google Scholar] [CrossRef]
- CPI (Consumer Price Index for All Urban Consumers: All Items in U.S. City Average). 2023. U.S. Bureau of Labor Statistics. Available online: https://fred.stlouisfed.org/series/CPIAUCSL (accessed on 26 October 2023).
- Dechow, Patricia M., Weili Ge, and Catherine Schrd. 2010. Understanding earnings quality: A review of the proxies, their determinants and their consequences. Journal of Accounting and Economics 50: 344–401. [Google Scholar] [CrossRef]
- Dias, Rui, Nuno Teixeira, Veronika Machova, Pedro Pardal, Jakub Horak, and Marek Vochozka. 2020. Random walks and market efficiency tests: Evidence on US, Chinese and European capital markets within the context of the global COVID-19 pandemic. Oeconomia Copernicana 11: 585–608. [Google Scholar] [CrossRef]
- Doumenis, Zanni, Javad Izadi, Pradeep Dhamdhere, Epameinondas Katsikas, and Dimitrios Koufopoulos. 2021. A critical analysis of volatility surprise in bitcoin cryptocurrency and other financial assets. Risks 9: 207. [Google Scholar] [CrossRef]
- Dvorsky, Jan, Maria Hudakova, Zuzana Petrakova, and Joanna Bednarz. 2023. National support and legislative change in the business environment of V4 countries: Business sectors view. Journal of Business Sectors 1: 42–52. [Google Scholar] [CrossRef]
- Ersan, Deniz, Chifumi Nishioka, and Ansgar Scherp. 2020. Comparison of machine learning methods for financial time series forecasting at the examples of over 10 years of daily and hourly data of DAX 30 and S&P 500. Journal of Computational Social Science 3: 103–33. [Google Scholar]
- Fama, Eugene F., and Kenneth R. French. 1992. The cross-section of expected stock returns. Journal of Finance 47: 427–65. [Google Scholar]
- FFR (Federal Funds Effective Rate). 2023. Board of Governors of the Federal Reserve System (US). Available online: https://fred.stlouisfed.org/series/FEDFUNDS (accessed on 26 October 2023).
- Fiszeder, Piotr, and Marta Malecka. 2022. Forecasting volatility during the outbreak of Russian invasion of Ukraine: Application to commodities, stock indices, currencies, and cryptocurrencies. Equilibrium-Quarterly Journal of Economics and Economic Policy 17: 939–67. [Google Scholar]
- Fougue, Jean P., and Yuri F. Saporito. 2018. Heston stochastic vol-of-vol model for joint calibration of VIX and S&P 500 options. Quantitative Finance 18: 1003–16. [Google Scholar]
- Frost, Jim. 2020. Regression Analysis: An Intuitive Guide for Using and Interpreting Linear Models. Costa Mesa: Jim Publishing. [Google Scholar]
- Fu, Chengbo. 2021. Time-varying risk and the relation between idiosyncratic risk and stock return. Journal of Risk and Financial Management 14: 432. [Google Scholar] [CrossRef]
- Gaspareniene, Ligita, Rita Remeikiene, Aleksejus Sosidko, and Vigita Vebraite. 2021. Modelling of S&P 500 Index Price Based on US Economic Indicators: Machine Learning Approach. Inzinerine Ekonomika—Engineering Economics 32: 362–75. [Google Scholar]
- Ghazali, Mohd F., Hooi H. Lean, and Zakaria Bahari. 2020. Does gold investment offer protection against stock market losses? Evidence from five countries. The Singapore Economic Review 65: 275–301. [Google Scholar] [CrossRef]
- Golitsis, Petros, Pavlos Gkasis, and Sotirios K. Bellos. 2022. Dynamic spillovers and linkages between gold, crude oil, S&P 500, and other economic and financial variables. Evidence from the USA. North American Journal of Economics and Finance 63: 101785. [Google Scholar]
- Grobys, Klaus. 2022. On Survivor Stocks in the S&P 500 Stock Index. Journal of Risk and Financial Management 15: 95. [Google Scholar]
- GSP (Gold Spot Prices). 2023. World Gold Council. Available online: https://www.gold.org/goldhub/data/gold (accessed on 4 November 2023).
- Handoyo, Rossanto D., Kabiru H. Ibrahim, and Frandy Indrawan. 2022. Stock returns response to internal and external shocks during the COVID-19 pandemic in Indonesia: A comparison study. Industrial Engineering and Management Systems 21: 85–109. [Google Scholar] [CrossRef]
- Harjoto, Maretno A., and Fabrizio Rossi. 2021. Market reaction to the COVID-19 pandemic: Evidence from emerging markets. International Journal of Emerging Markets 18: 173–99. [Google Scholar] [CrossRef]
- He, Bate, and Eisuke Kita. 2021. The Application of Sequential Generative Adversarial Networks for Stock Price Prediction. The Review of Socionetwork Strategies 15: 455–70. [Google Scholar] [CrossRef]
- Hu, John W. S., Yi C. Hu, and Amber C. H. Tsai. 2018. Multiple criteria decision making and general regression for determining influential factors on S&P 500 index futures. Symmetry 10: 5. [Google Scholar]
- Hyndman, Rob J., Anne B. Koehler, Keith Ord, and Ralph D. Snyder. 2008. Forecasting with Exponential Smoothing: The State Space Approach. Berlin: Springer. [Google Scholar]
- IP TI (Industrial Production: Total Index). 2023. Board of Governors of the Federal Reserve System. Available online: https://fred.stlouisfed.org/series/INDPRO (accessed on 4 November 2023).
- Jackwerth, Jens. 2021. What do index options teach us about COVID-19? Review of Asset Pricing Studies 10: 618–34. [Google Scholar] [CrossRef]
- Jamous, Razan, Hosam Alrahhal, and Mohamed El-Darieby. 2021. A New ANN-Particle Swarm Optimization with Center of Gravity Prediction Model for the Stock Market under the Effect of COVID-19. Scientific Programming 2021: 2. [Google Scholar] [CrossRef]
- Jiao, Shoukun, and Wuyi Ye. 2022. Dependence and Systemic Risk Analysis Between S&P 500 Index and Sector Indexes: A Conditional Value-at-Risk Approach. Computational Economics 59: 1203–29. [Google Scholar]
- John, Kose, and Jingrui R. Li. 2021. COVID-19, volatility dynamics, and sentiment trading. Journal of Banking & Finance 133: 106162. [Google Scholar]
- Kaeck, Andreas. 2013. Hedging surprises, jumps, and model misspecification: A risk management perspective on hedging S&P 500 Options. Review of Finance 17: 1535–69. [Google Scholar]
- Kahneman, Daniel, and Amos Tversky. 1979. Prospect theory: An analysis of decision under risk. Econometrica 47: 263–91. [Google Scholar] [CrossRef]
- Kamalov, Firuz, Linda Smail, and Ikhlaas Gurrib. 2020. Forecasting with Deep Learning: S&P 500 index. Paper presented at the 13th International Symposium on Computational Intelligence and Design, Hangzhou, China, December 12–13; Hangzhou: IEEE, pp. 422–25. [Google Scholar]
- Kang, Sang H., Seong M. Yoon, Stelios Bekiros, and Gazi S. Uddin. 2020. Bitcoin as hedge or safe haven: Evidence from stock, currency, bond and derivatives markets. Computational Economics 56: 529–45. [Google Scholar]
- Kartasova, Jana, and Daniel Venclauskiene. 2014. Valuation of fundamental analysis reliability in stock pricing: Theoretical approach. Paper presented at the 8th International Scientific Conference on Business and Management 2014, Vilnius, Lithuania, May 15–16; Vilnius: Vilnius Gediminas Technical University Press, pp. 255–62. [Google Scholar]
- Kim, Jihwan, Hiu-Sang Kim, and Sun-Yong Choi. 2023. Forecasting the S&P 500 Index Using Mathematical-Based Sentiment Analysis and Deep Learning Models: A FinBERT Transformer Model and LSTM. Axioms 12: 835. [Google Scholar] [CrossRef]
- Kliber, Agata. 2022. Looking for a safe haven against American stocks during COVID-19 pandemic. North American Journal of Economics and Finance 63: 101825. [Google Scholar] [CrossRef]
- Kotu, Vijay, and Bala Deshpande. 2019. Time series forecasting. Data Science 61: 395–445. [Google Scholar]
- Lee, Jinho, and Jaewoo Kang. 2020. Effectively training neural networks for stock index prediction: Predicting the S&P 500 index without using its index data. PLoS ONE 15: e0230635. [Google Scholar]
- Lento, Camillo, and Nikola Gradojevic. 2021. S&P 500 index price spillovers around the COVID-19 market meltdown. Journal of Risk and Financial Management 14: 330. [Google Scholar]
- Lin, Chien, Chun Chen, and An-Pin Chen. 2018. Using intelligent computing and data stream mining for behavioral finance associated with market profile and financial physics. Applied Soft Computing 68: 756–64. [Google Scholar] [CrossRef]
- Lucio, Francisco, and Jorge Caiado. 2022. COVID-19 and stock market volatility: A clustering approach for S&P 500 industry indices. Finance Research Letters 49: 103141. [Google Scholar]
- M2. 2023. Board of Governors of the Federal Reserve System. Available online: https://fred.stlouisfed.org/series/M2SL (accessed on 26 October 2023).
- Melina, Sukono, Herlina Napitupulu, and Norizan Mohamed. 2023. A conceptual model of investment-risk prediction in the stock market using extreme value theory with machine learning: A semisystematic literature review. Risks 11: 60. [Google Scholar] [CrossRef]
- Menkhoff, Lukas. 2010. The use of technical analysis by fund managers: International evidence. Journal of Banking & Finance 34: 2573–86. [Google Scholar]
- Musa, Hussam, Peter Kristofik, Juraj Medzihorsky, and Tomas Kliestik. 2024. The development of firmsize distribution—Evidence from four Central European countries. International Review of Economics and Finance 91: 98–110. [Google Scholar] [CrossRef]
- MY US (Market Yield on U.S. Treasury Securities at 30-Year Constant Maturity, Quoted on an Investment Basis). 2023. Board of Governors of the Federal Reserve System. Available online: https://fred.stlouisfed.org/series/DGS30 (accessed on 4 November 2023).
- NB US (Nominal Broad U.S. Dollar Index. Board of Governors of the Federal Reserve System). 2023. Available online: https://fred.stlouisfed.org/series/DTWEXBGS#0 (accessed on 4 November 2023).
- Orhun, Eda. 2021. The impact of COVID-19 global health crisis on stock markets and understanding the cross-country effects. Pacific Accounting Review 33: 142–59. [Google Scholar]
- Ozair, Merav. 2014. What does the VIX actually measure? An analysis of the causation of SPX and VIX. ACRN Journal of Finance and Risk Perspectives 3: 83–132. [Google Scholar]
- Paule-Vianez, Jessica, Raul Gomez-Martinez, and Camilo Prado-Roman. 2020. Effect of economic and monetary policy uncertainty on stock markets. Evidence on return, volatility and liquidity. Economic Bulletin 40: 1261–71. [Google Scholar]
- Pekar, Juraj, Ivan Brezina, and Mariana Reiff. 2022. Determining the investors’ strategy during the COVID-19 crisis based on the S&P 500 stock index. Strategic Management. early access. [Google Scholar]
- Petropoulos, Fotios, Yeal Grushka-Cockayne, Enno Siemsen, and Evangelos Wielding Spiliotis. 2022. Occam’s razor: Fast and frugal retail forecasting. arXiv arXiv:2102.13209. [Google Scholar]
- Pineiro-Chousa, Juan, Angeles M. Lopez-Cabarcos, Ada M. Perez-Pico, and Belen Ribeiro-Navarrete. 2018. Does social network sentiment influence the relationship between the S&P 500 and gold returns? International Review of Financial Analysis 58: 57–64. [Google Scholar]
- Rahman, Mohammad M., Guotai T. Chi, Anupam Das Gupta, Mahmud Hossain, and Mohammad Z. Abedin. 2021. Impact of early COVID-19 pandemic on the US and European stock markets and volatility forecasting. Economic Research—Ekonomska Istrazivanja 35: 3591–608. [Google Scholar] [CrossRef]
- Schmitt, Noemi, and Frank Westerhoff. 2017. Heterogeneity, spontaneous coordination and extreme events within large-scale and small-scale agent-based financial market models. Journal of Evolutionary Econmics 27: 1041–70. [Google Scholar] [CrossRef]
- Shah, Adil A., Arif B. Dar, and Noah R. Bhanumurthy. 2021. Are precious metals and equities immune to monetary and fiscal policy uncertainties? Resources Policy 74: 102260. [Google Scholar] [CrossRef]
- Shiller, Robert. J. 1981. Do stock prices move too much to be justified by subsequent changes in dividends? American Economic Review 71: 421–36. [Google Scholar]
- Simon, David P., and Roy A. Wiggins. 2001. S&P futures returns and contrary sentiment indicators. Journal of Future Markets 21: 447–62. [Google Scholar]
- Soydemir, Gokce, Rahul Verma, and Andrew Wagner. 2017. The asymmetric impact of rational and irrational components of fear index on S&P 500 index returns. Review of Behavioral Finance 9: 278–91. [Google Scholar]
- SP (S&P 500 Real Price by Month). 2023. Available online: https://data.nasdaq.com/data/MULTPL/SP500_REAL_PRICE_MONTH-sp-500-real-price-by-month (accessed on 26 October 2023).
- SPX NASDAQ (SPX Historical NASDAQ). 2023. Available online: https://www.nasdaq.com/market-activity/index/spx/historical (accessed on 26 October 2023).
- Stanley, Spencer T., and WilliamJ. Trainor. 2021. Forecasting volatility and market returns using the CBOE Volatility Index and its options. Journal of Investment Strategies 10: 65–77. [Google Scholar] [CrossRef]
- TB (Trade Balance: Goods and Services, Balance of Payments Basis). 2023. U.S. Census Bureau a U.S. Bureau of Economic Analysis. Available online: https://fred.stlouisfed.org/series/BOPGSTB (accessed on 4 November 2023).
- UR US (Unemployment Rate. U.S. Bureau of Labor Statistics). 2023. Available online: https://fred.stlouisfed.org/series/UNRATE (accessed on 4 November 2023).
- US GDP (US Monthly GDP Index). 2023. S&P Global Market Intelligence. Available online: https://www.spglobal.com/marketintelligence/en/mi/products/us-monthly-gdp-index.html (accessed on 26 October 2023).
- Usmani, Shazia, and Jawwad A. Shamsi. 2023. LSTM based stock prediction using weighted and categorized financial news. PLoS ONE Shamsi 8: e0282234. [Google Scholar] [CrossRef] [PubMed]
- Uyar, Umut, and Sinem G. K. Uyar. 2022. The Impact Of COVID-19 Pandemic on Systematic Risk Of S&P 500 Sectors: A Wavelet Power Spectrum Analysis. Ege Academic Review 22: e1064535. [Google Scholar]
- Wang, Chaojie, Yuanyuan Chen, Shuqi Zhang, and Quihui Zhang. 2022. Stock market index prediction using deep Transformer model. Expert Systems with Application 208: 118128. [Google Scholar] [CrossRef]
- Wang, Jiqian, Feng Ma, Elie Bouri, and Yangli L. Guo. 2023. Which factors drive Bitcoin volatility: Macroeconomic, technical, or both? Journal of Forecasting 42: 970–88. [Google Scholar] [CrossRef]
- Yao, Can Z., Min J. Li, and Xin Xu. 2023. How does bubble risk propagate among financial assets? A perspective from the BSADF-vine copula model. International Review of Economics & Finance 88: 347–64. [Google Scholar]
- Yilmazkuday, Hakan. 2023. COVID-19 effects on the S&P 500 index. Applied Economics Letters 30: 7–13. [Google Scholar]
- Zellner, Arnold. 2001. Keep it sophisticatedly simple. In Simplicity, Inference, and Modelling: Keeping It Sophisticatedly Simple. Edited by Hugo Keuzenkamp and Michael McAleer. Cambridge: Cambridge University Press. [Google Scholar]
- Zhang, Dayong Y., Min Hu, and Qiang Ji. 2020. Financial markets under the global pandemic of COVID-19. Finance Research Letters 36: 101528. [Google Scholar] [CrossRef]
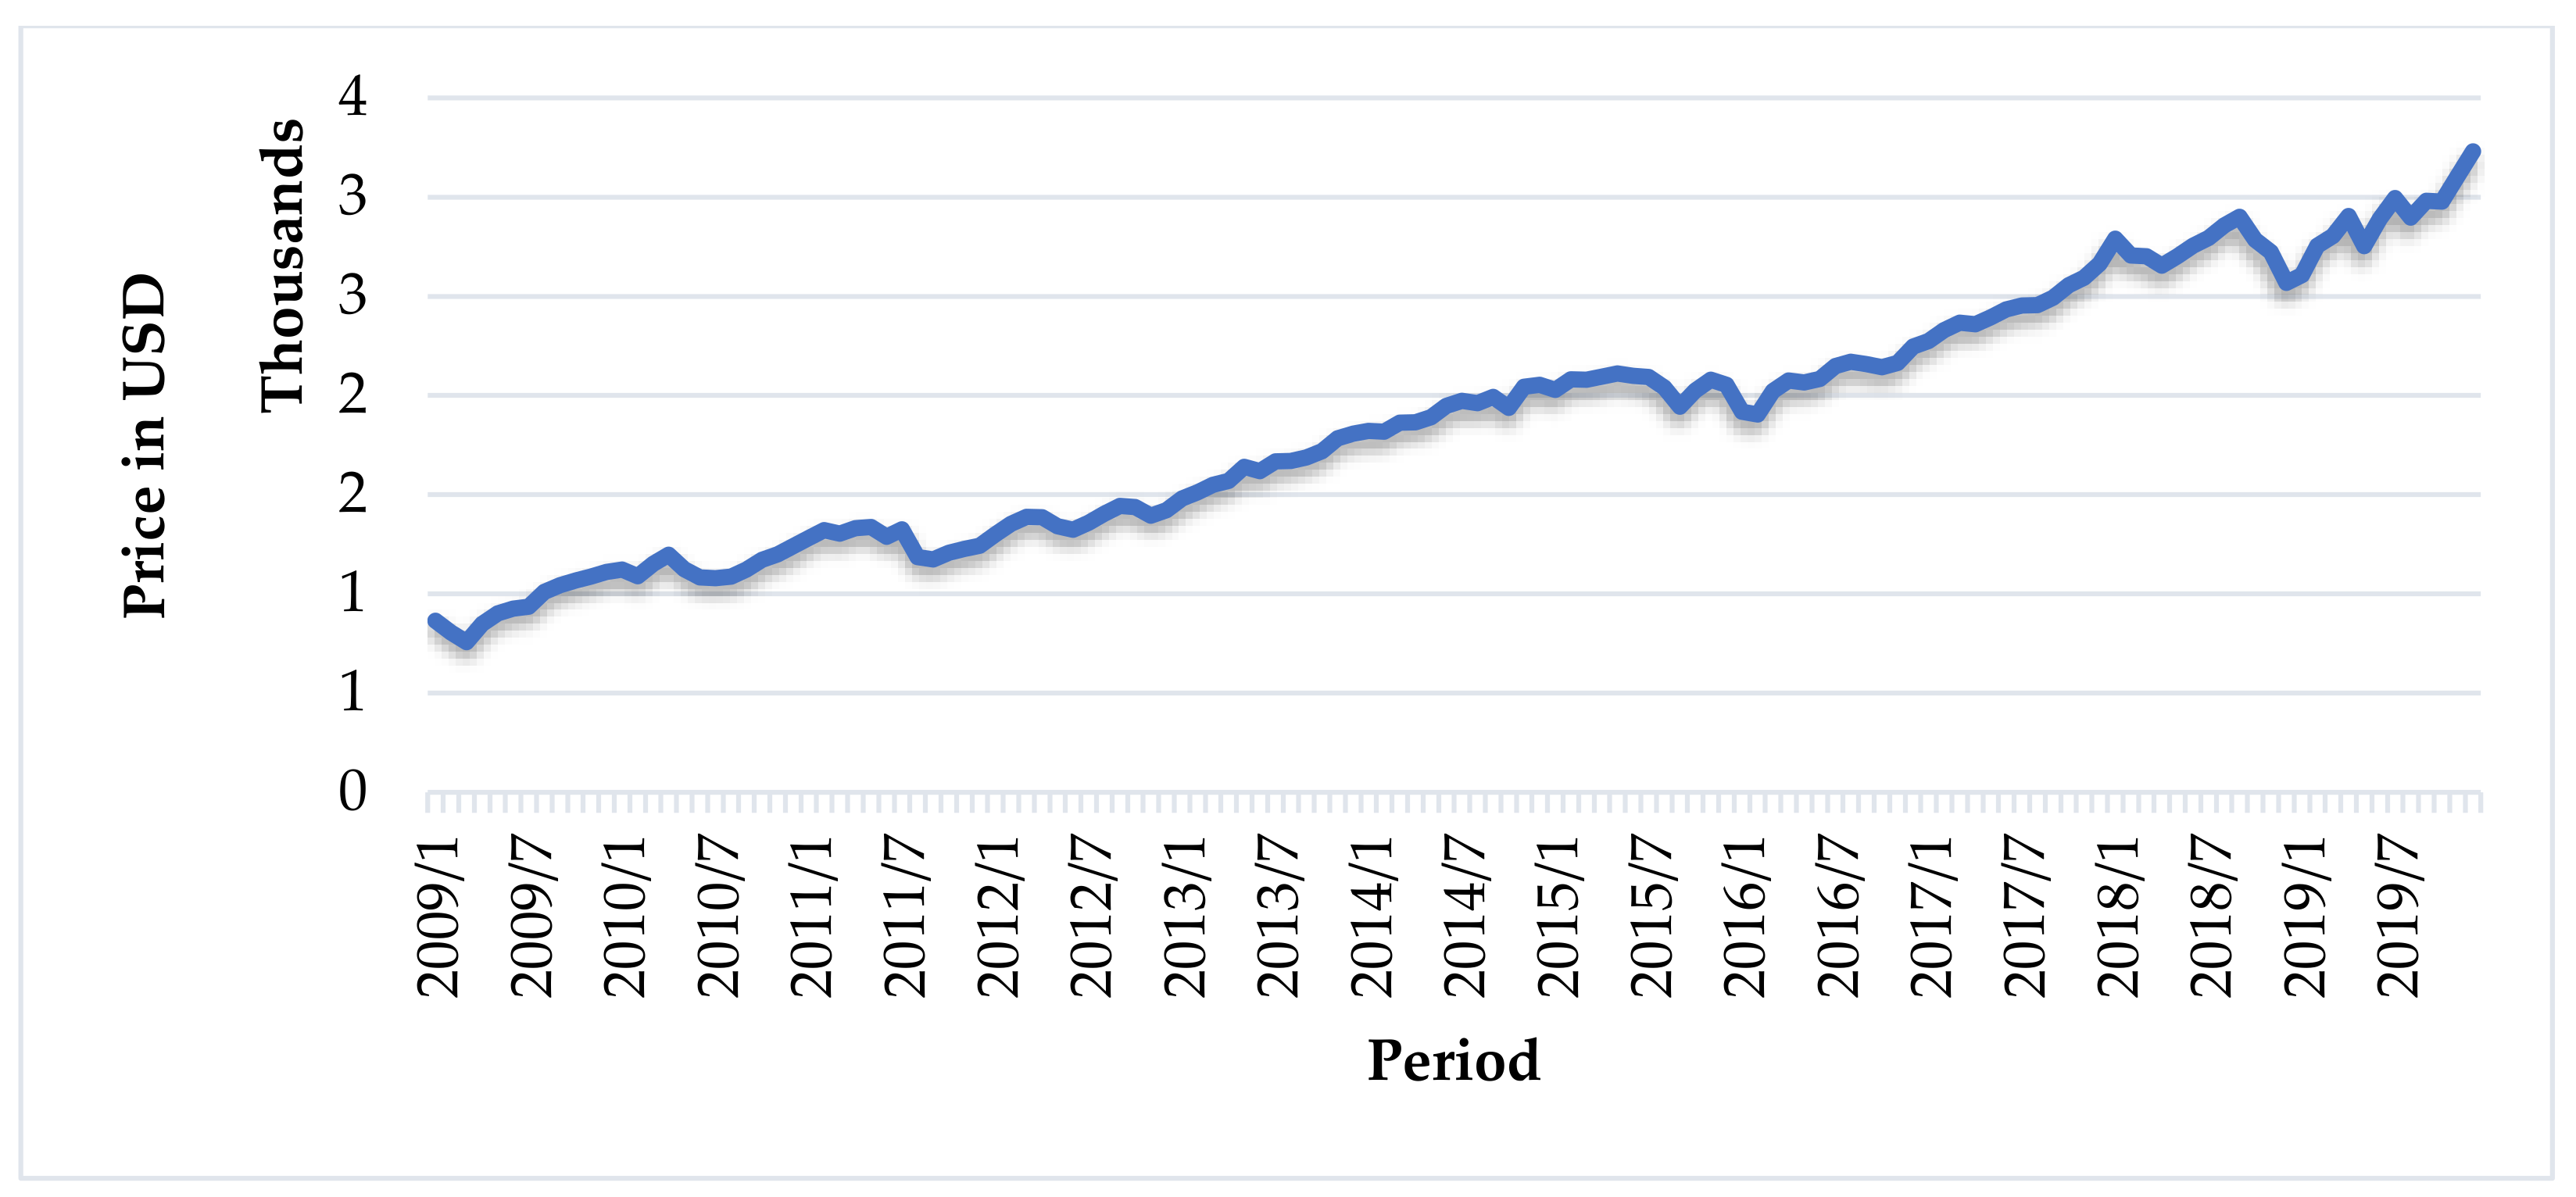
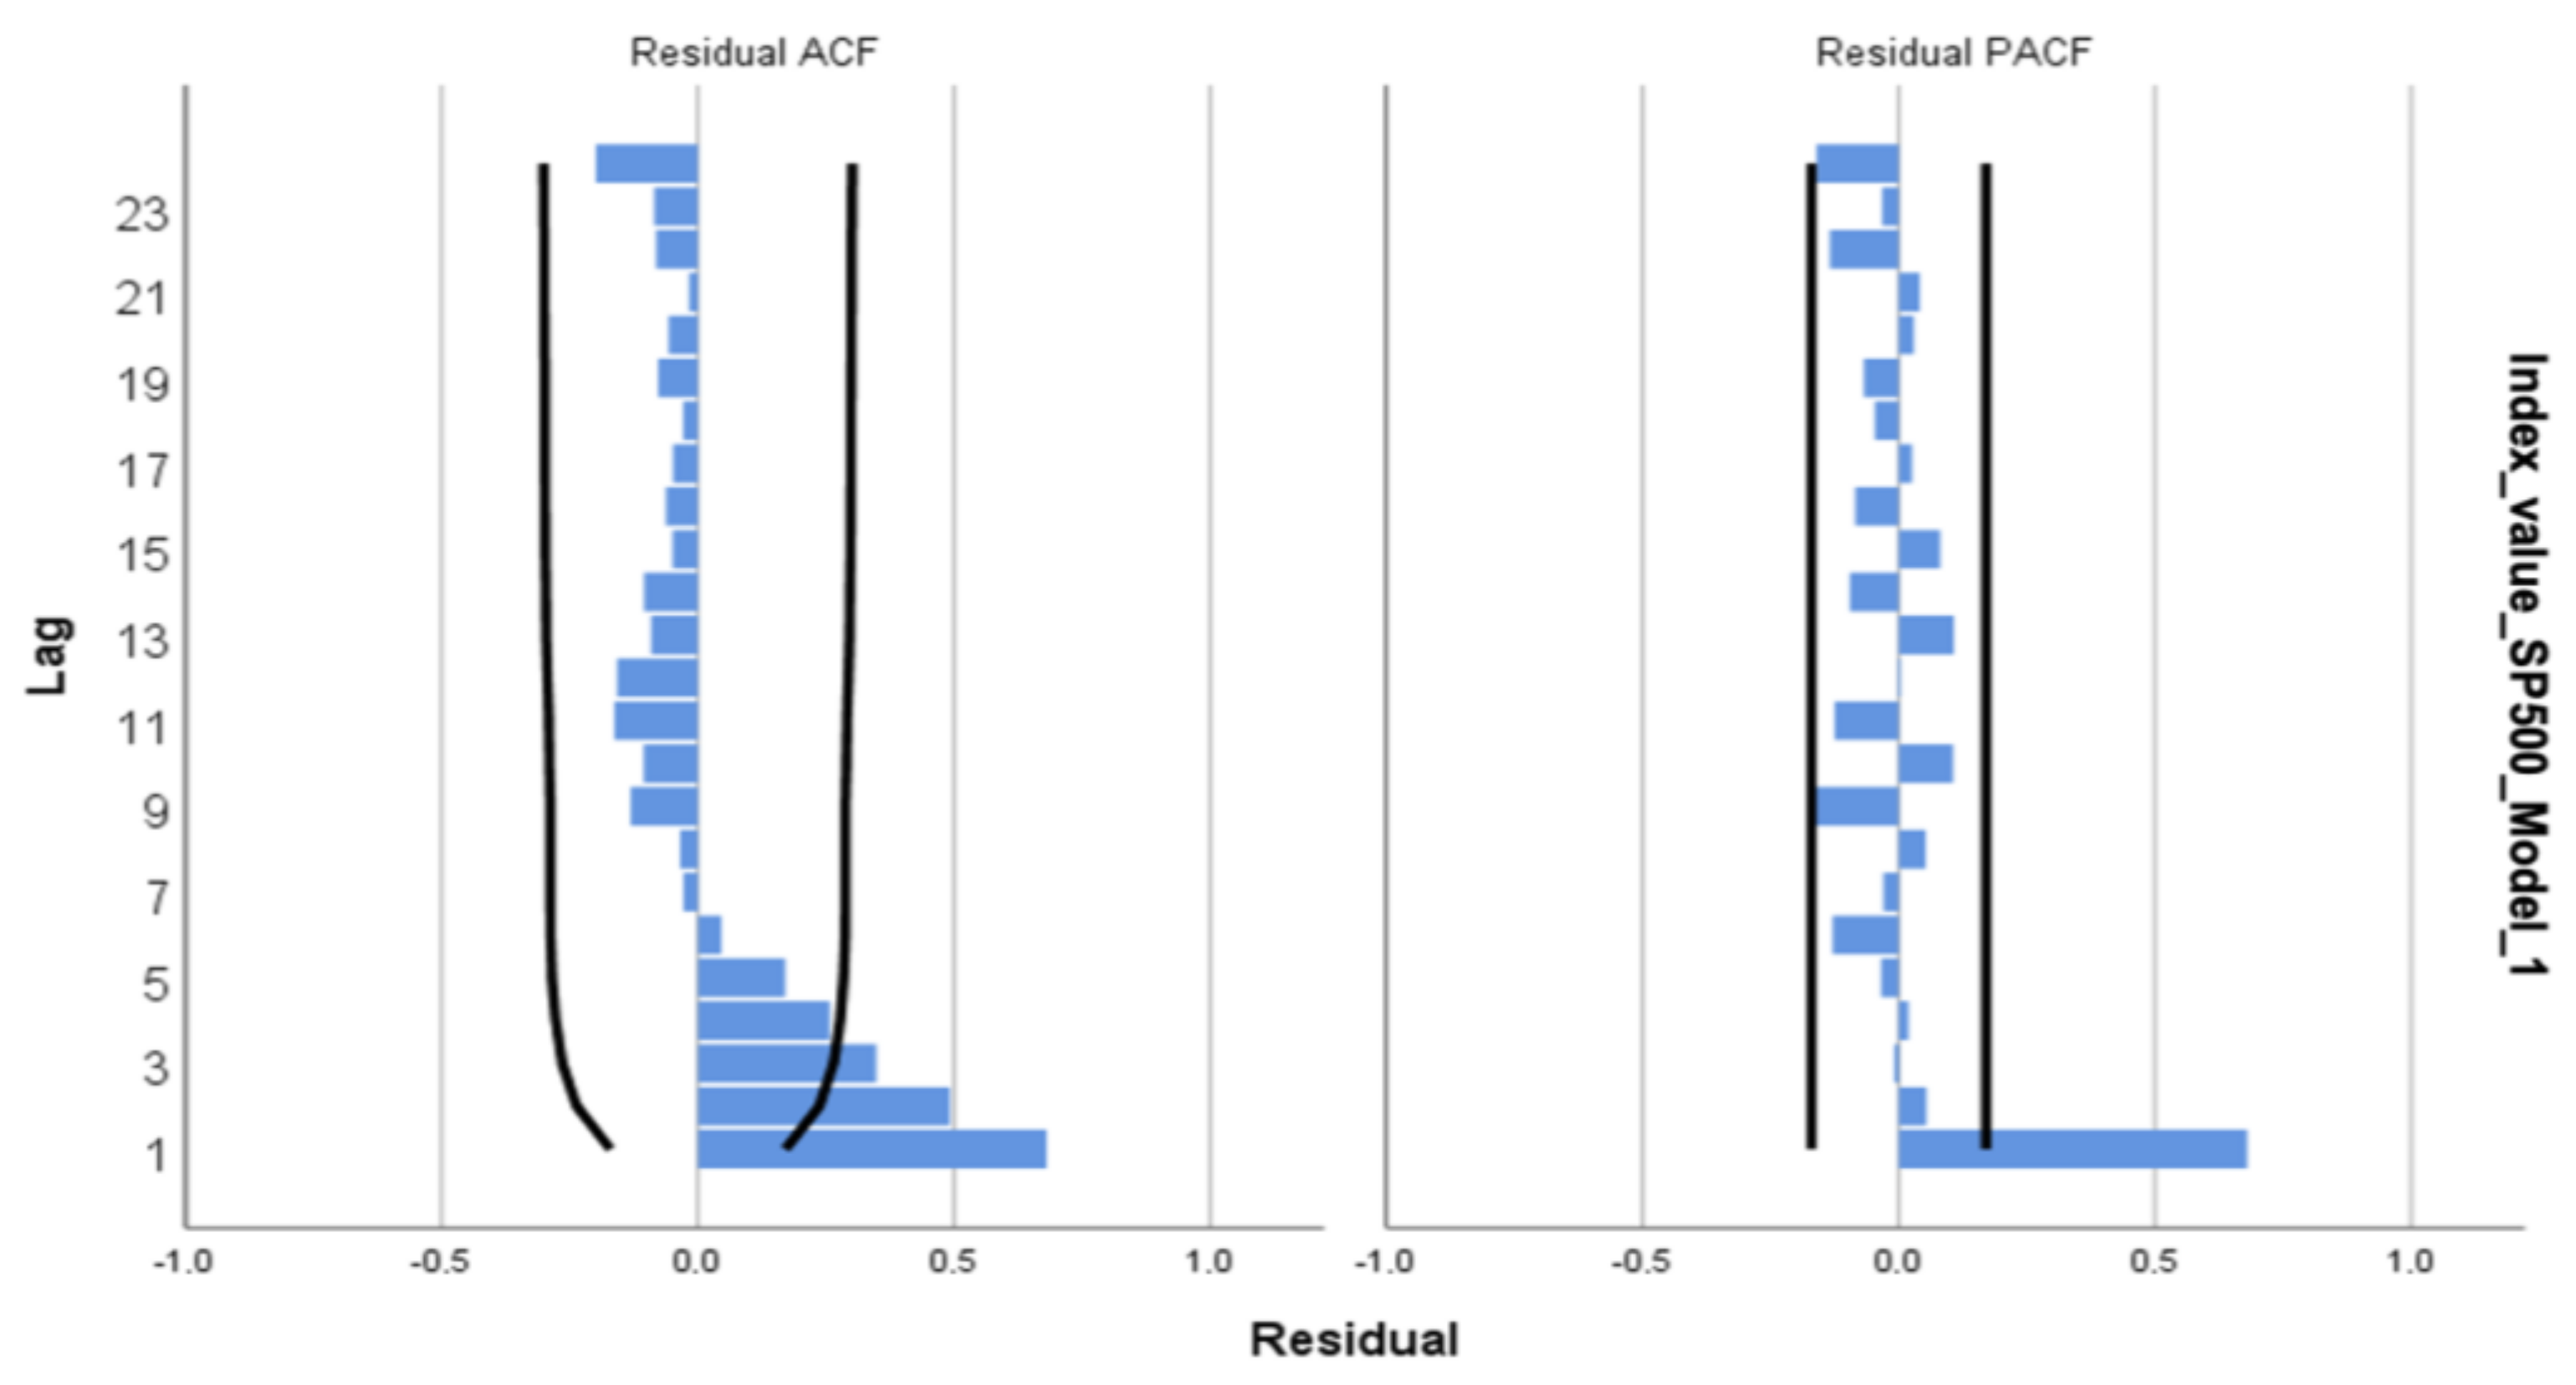
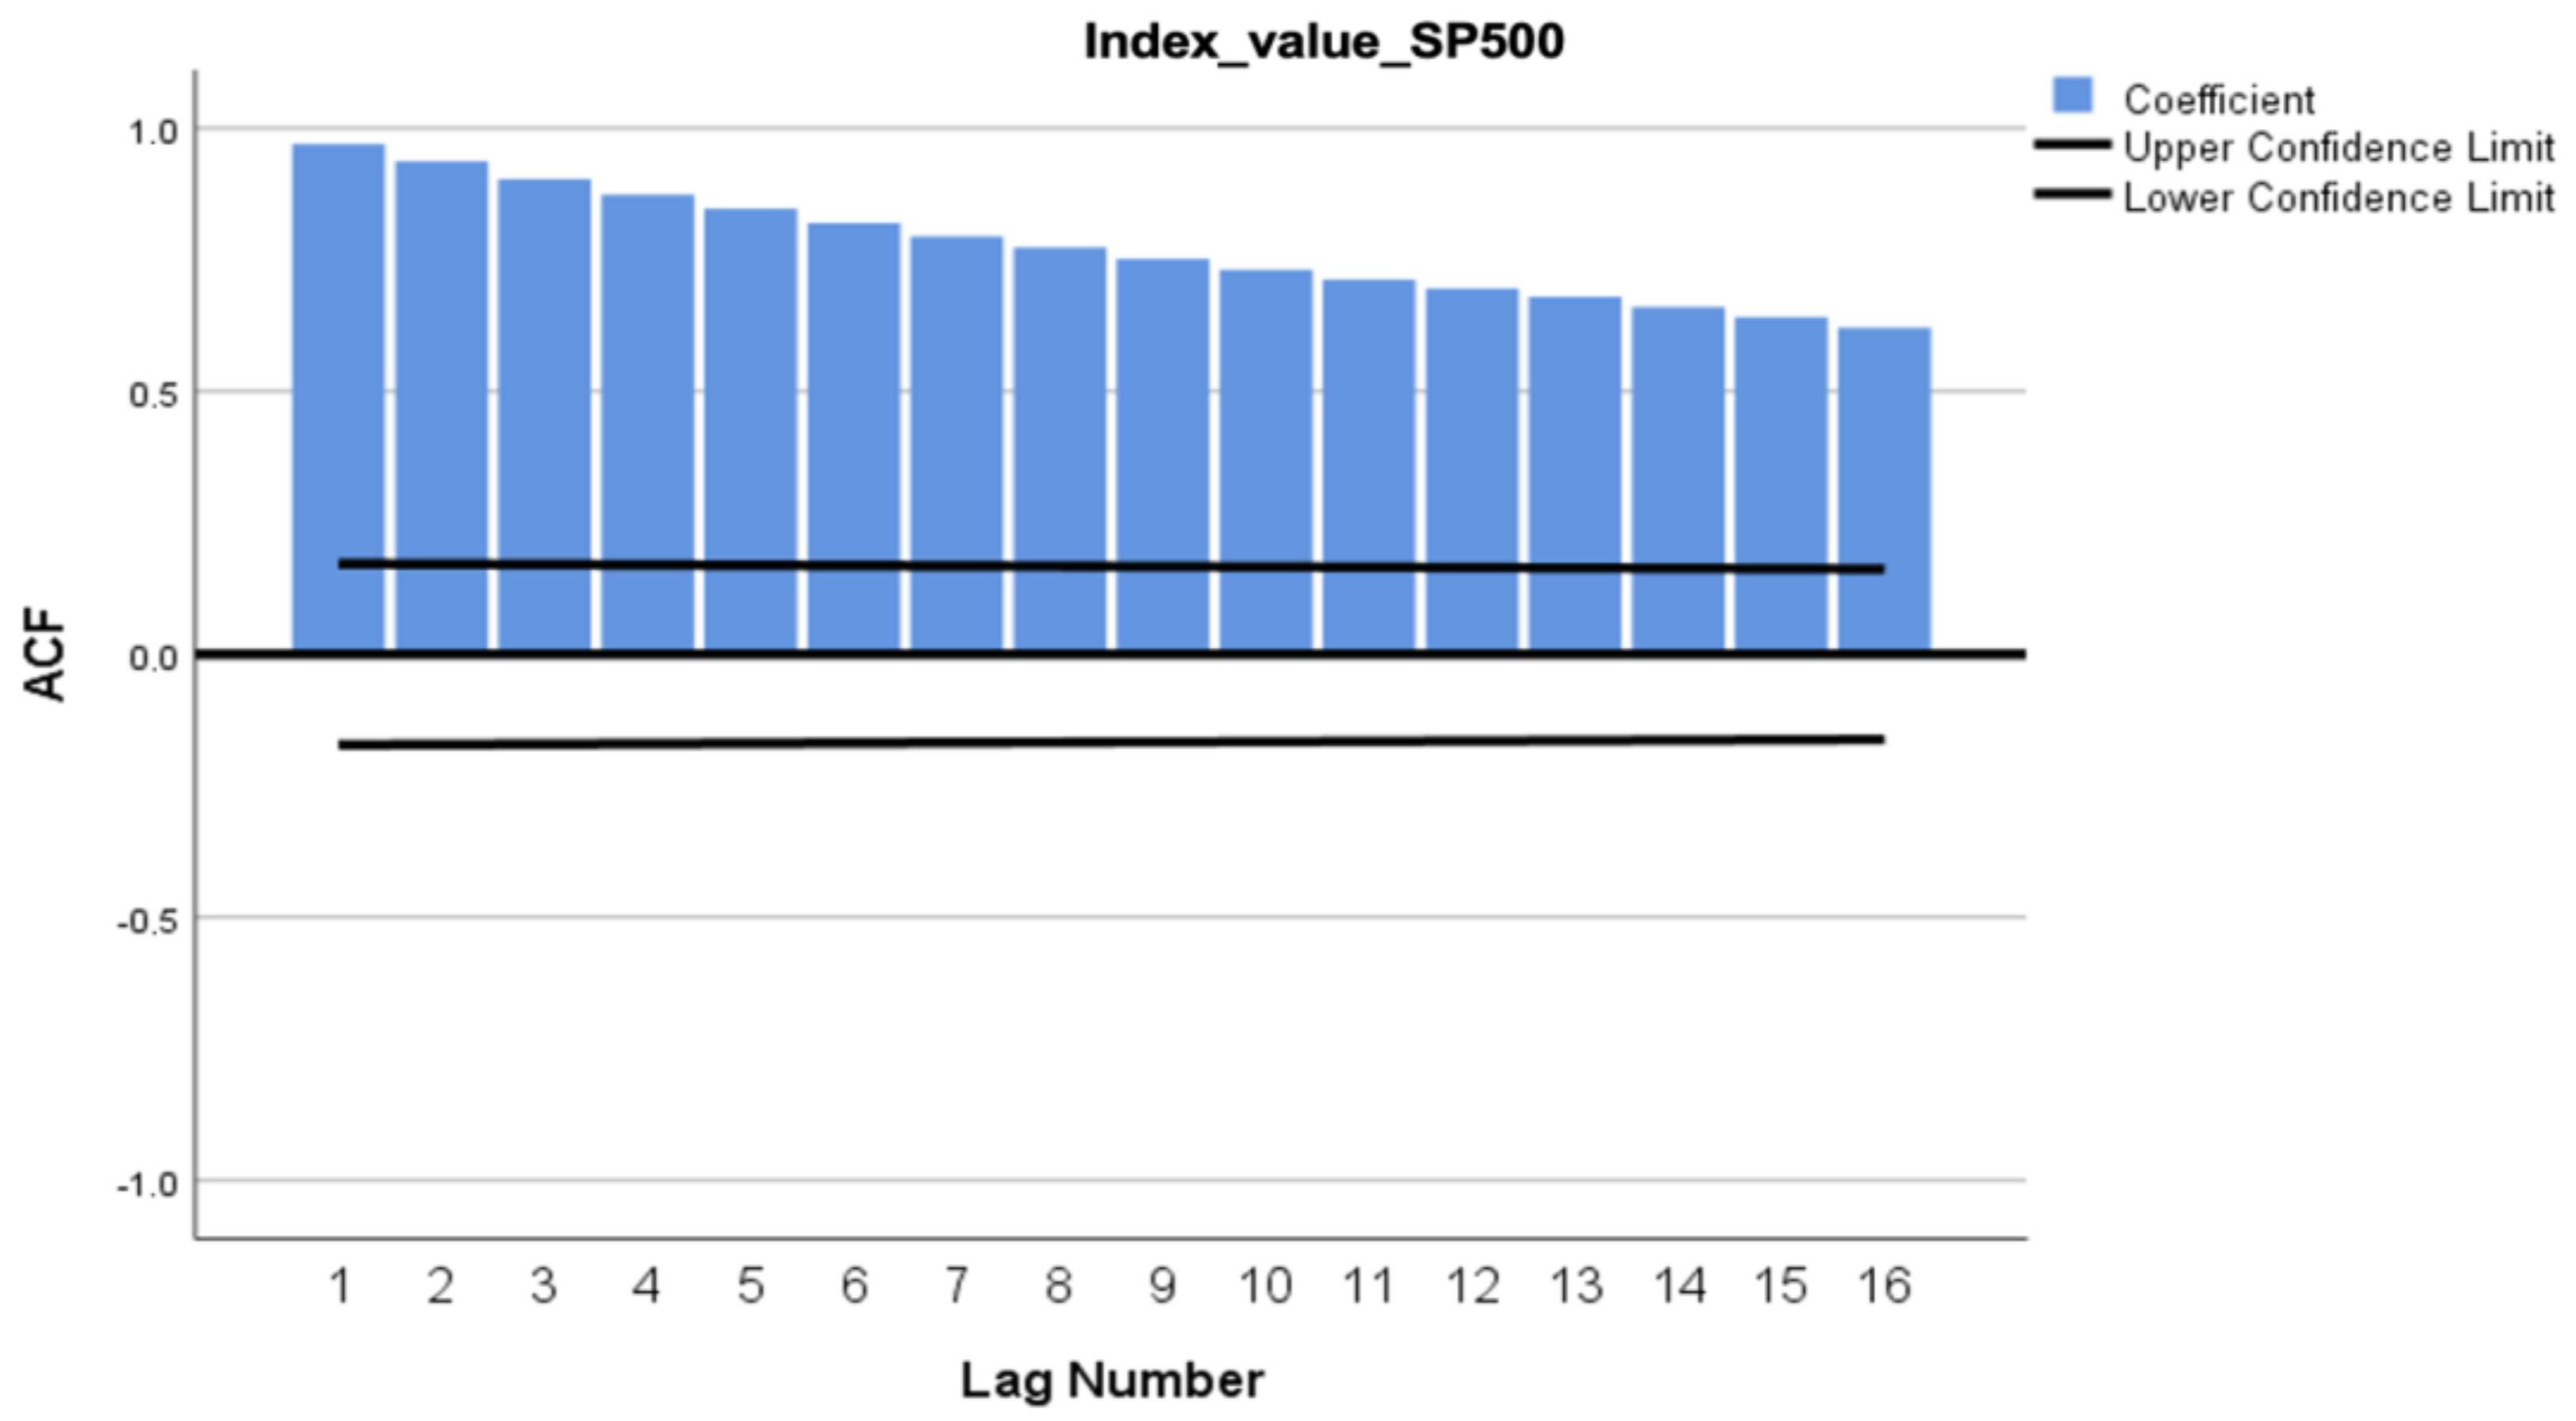
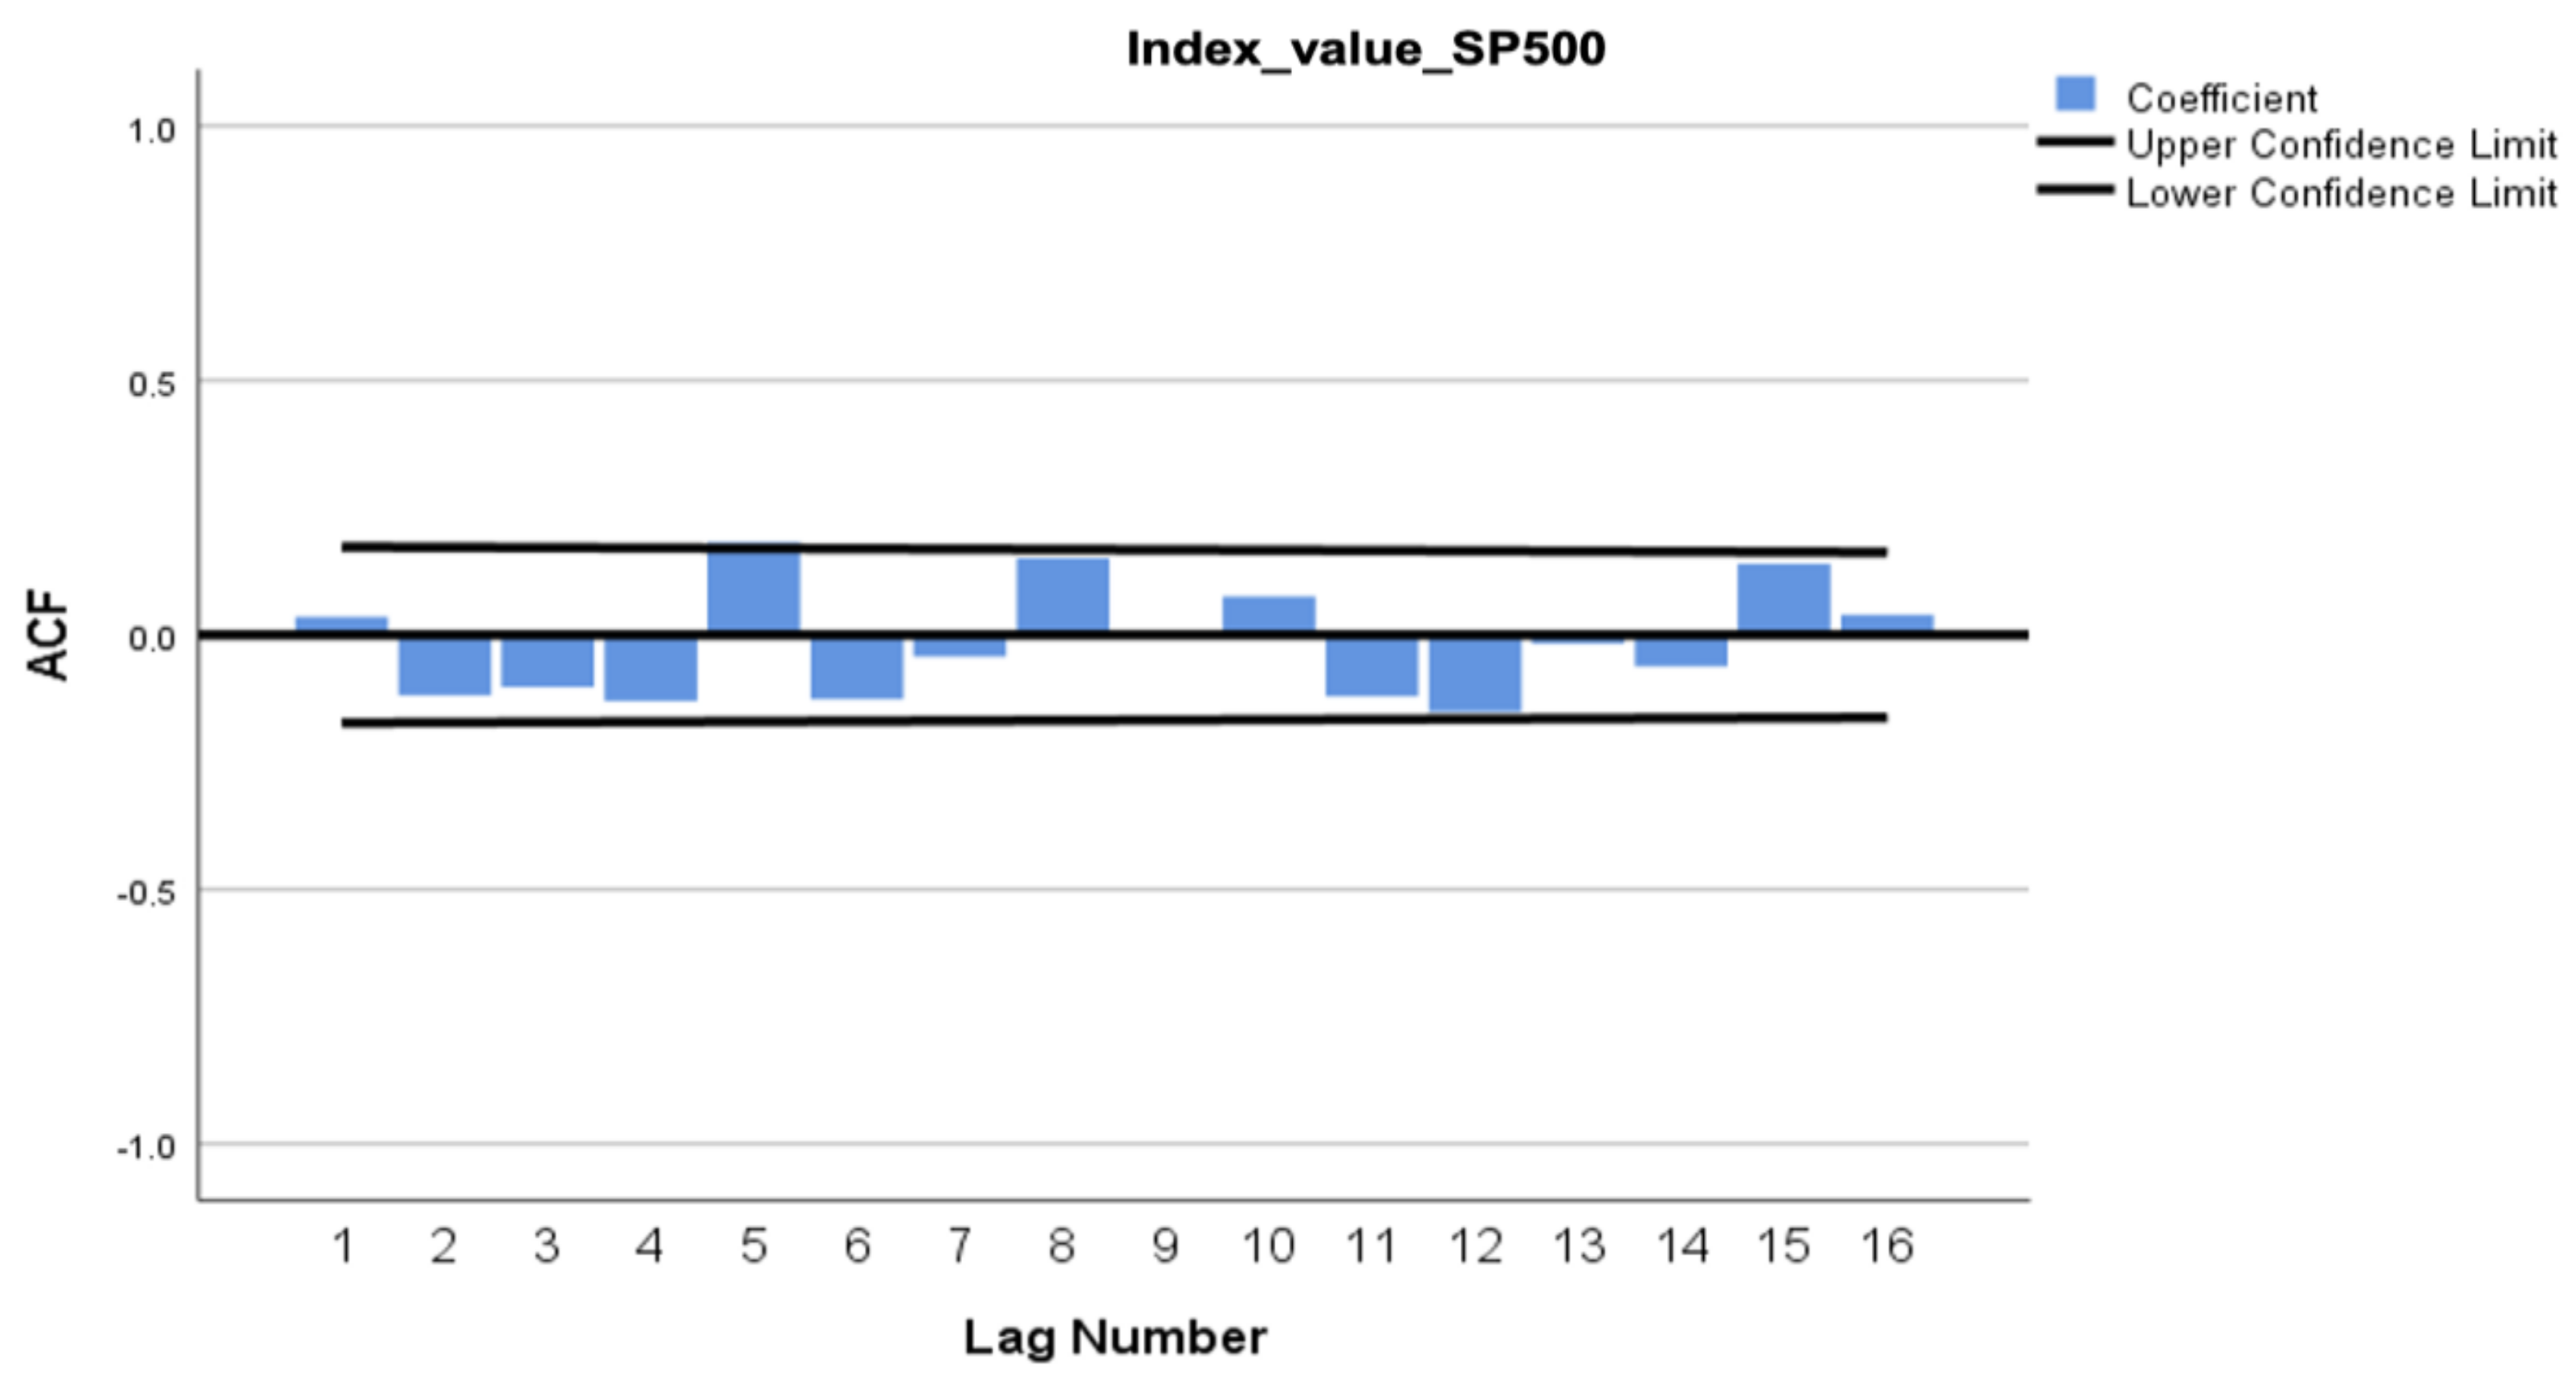
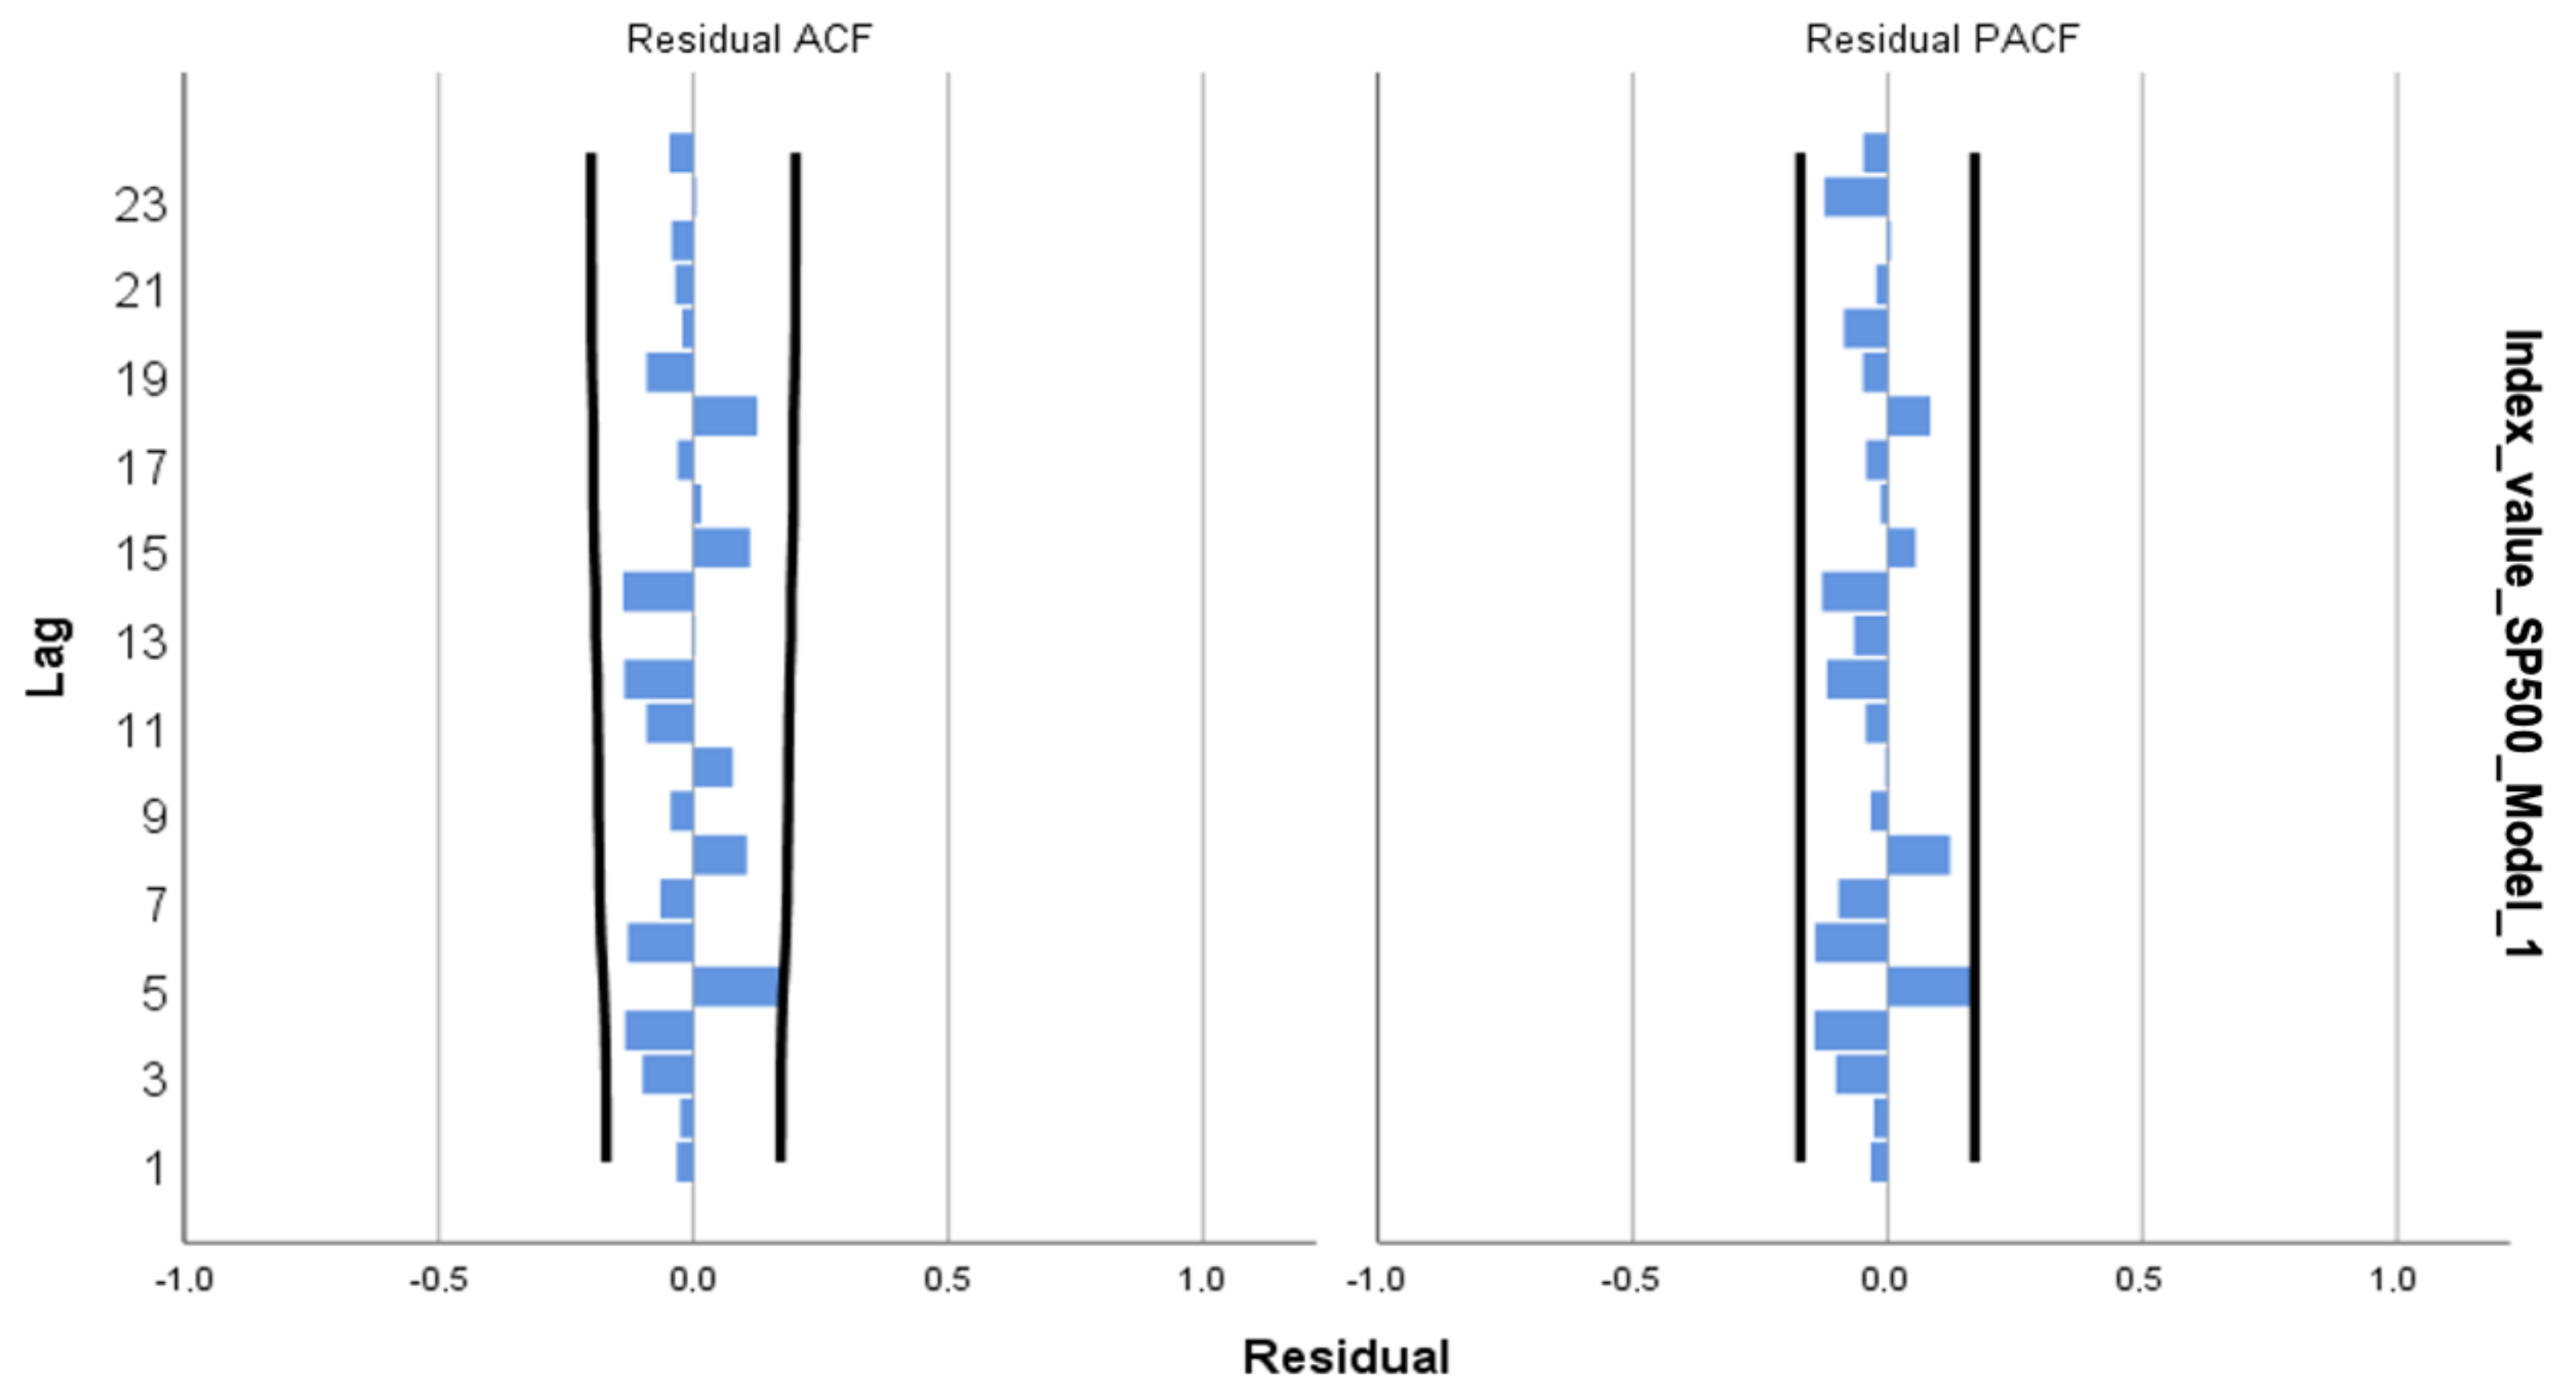
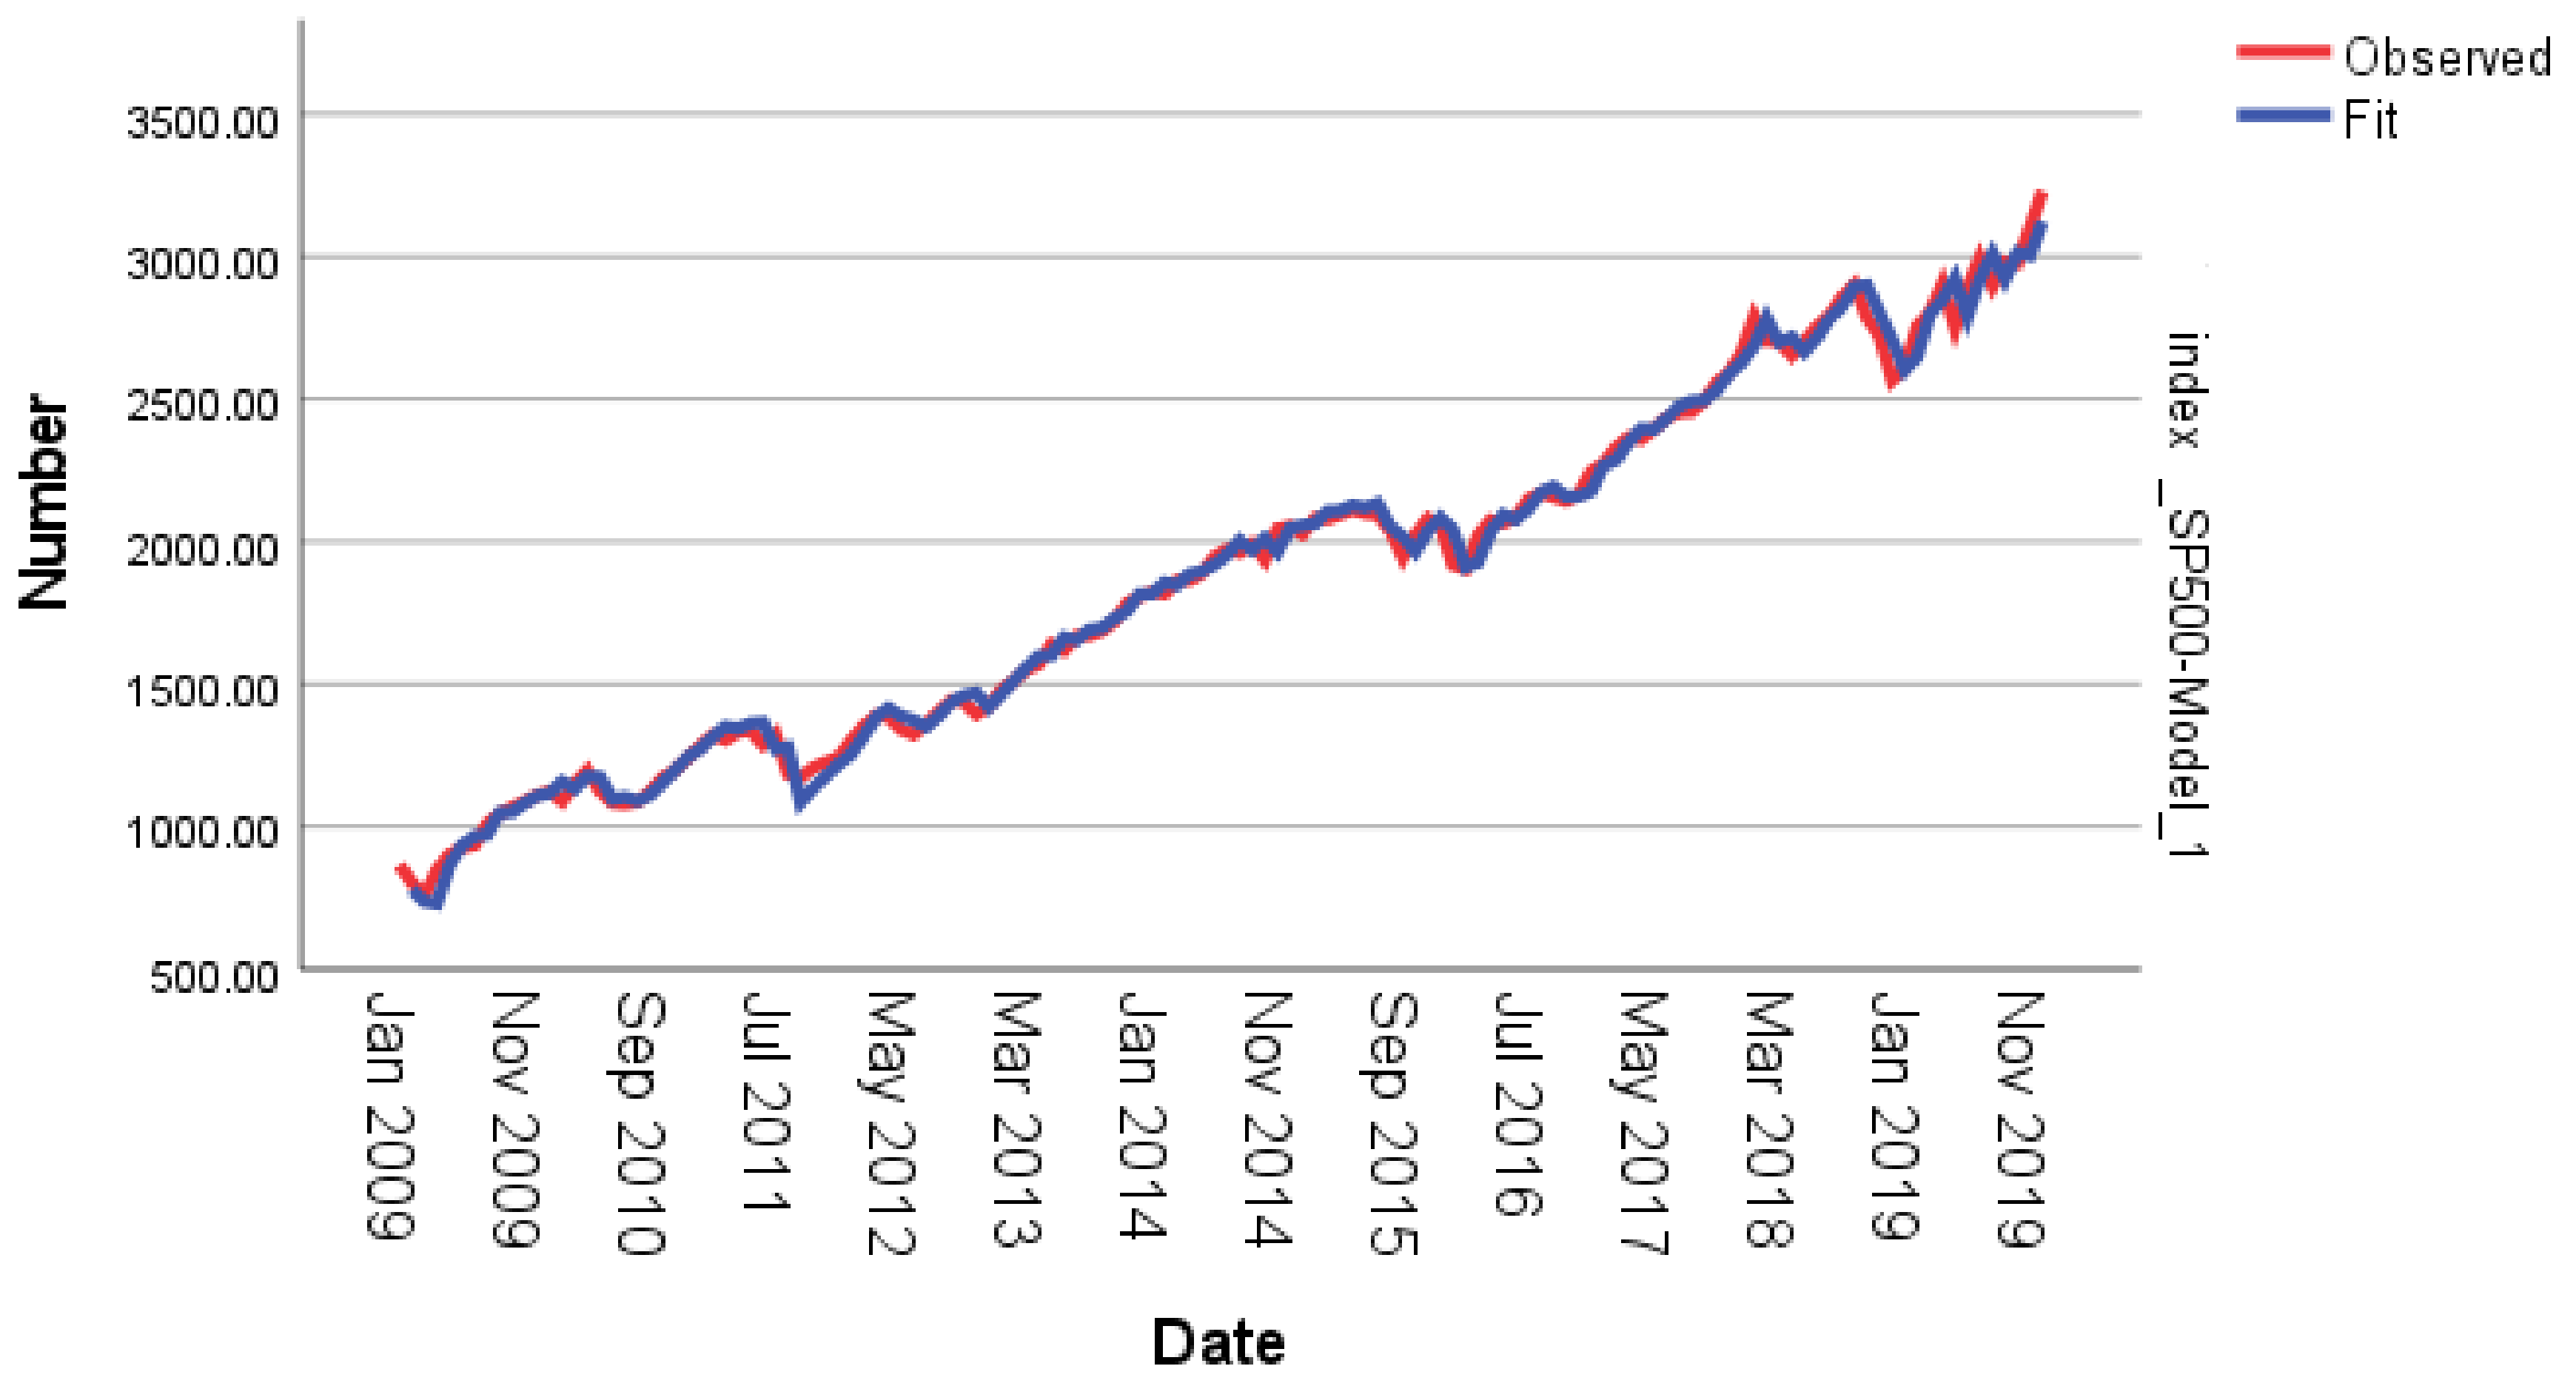
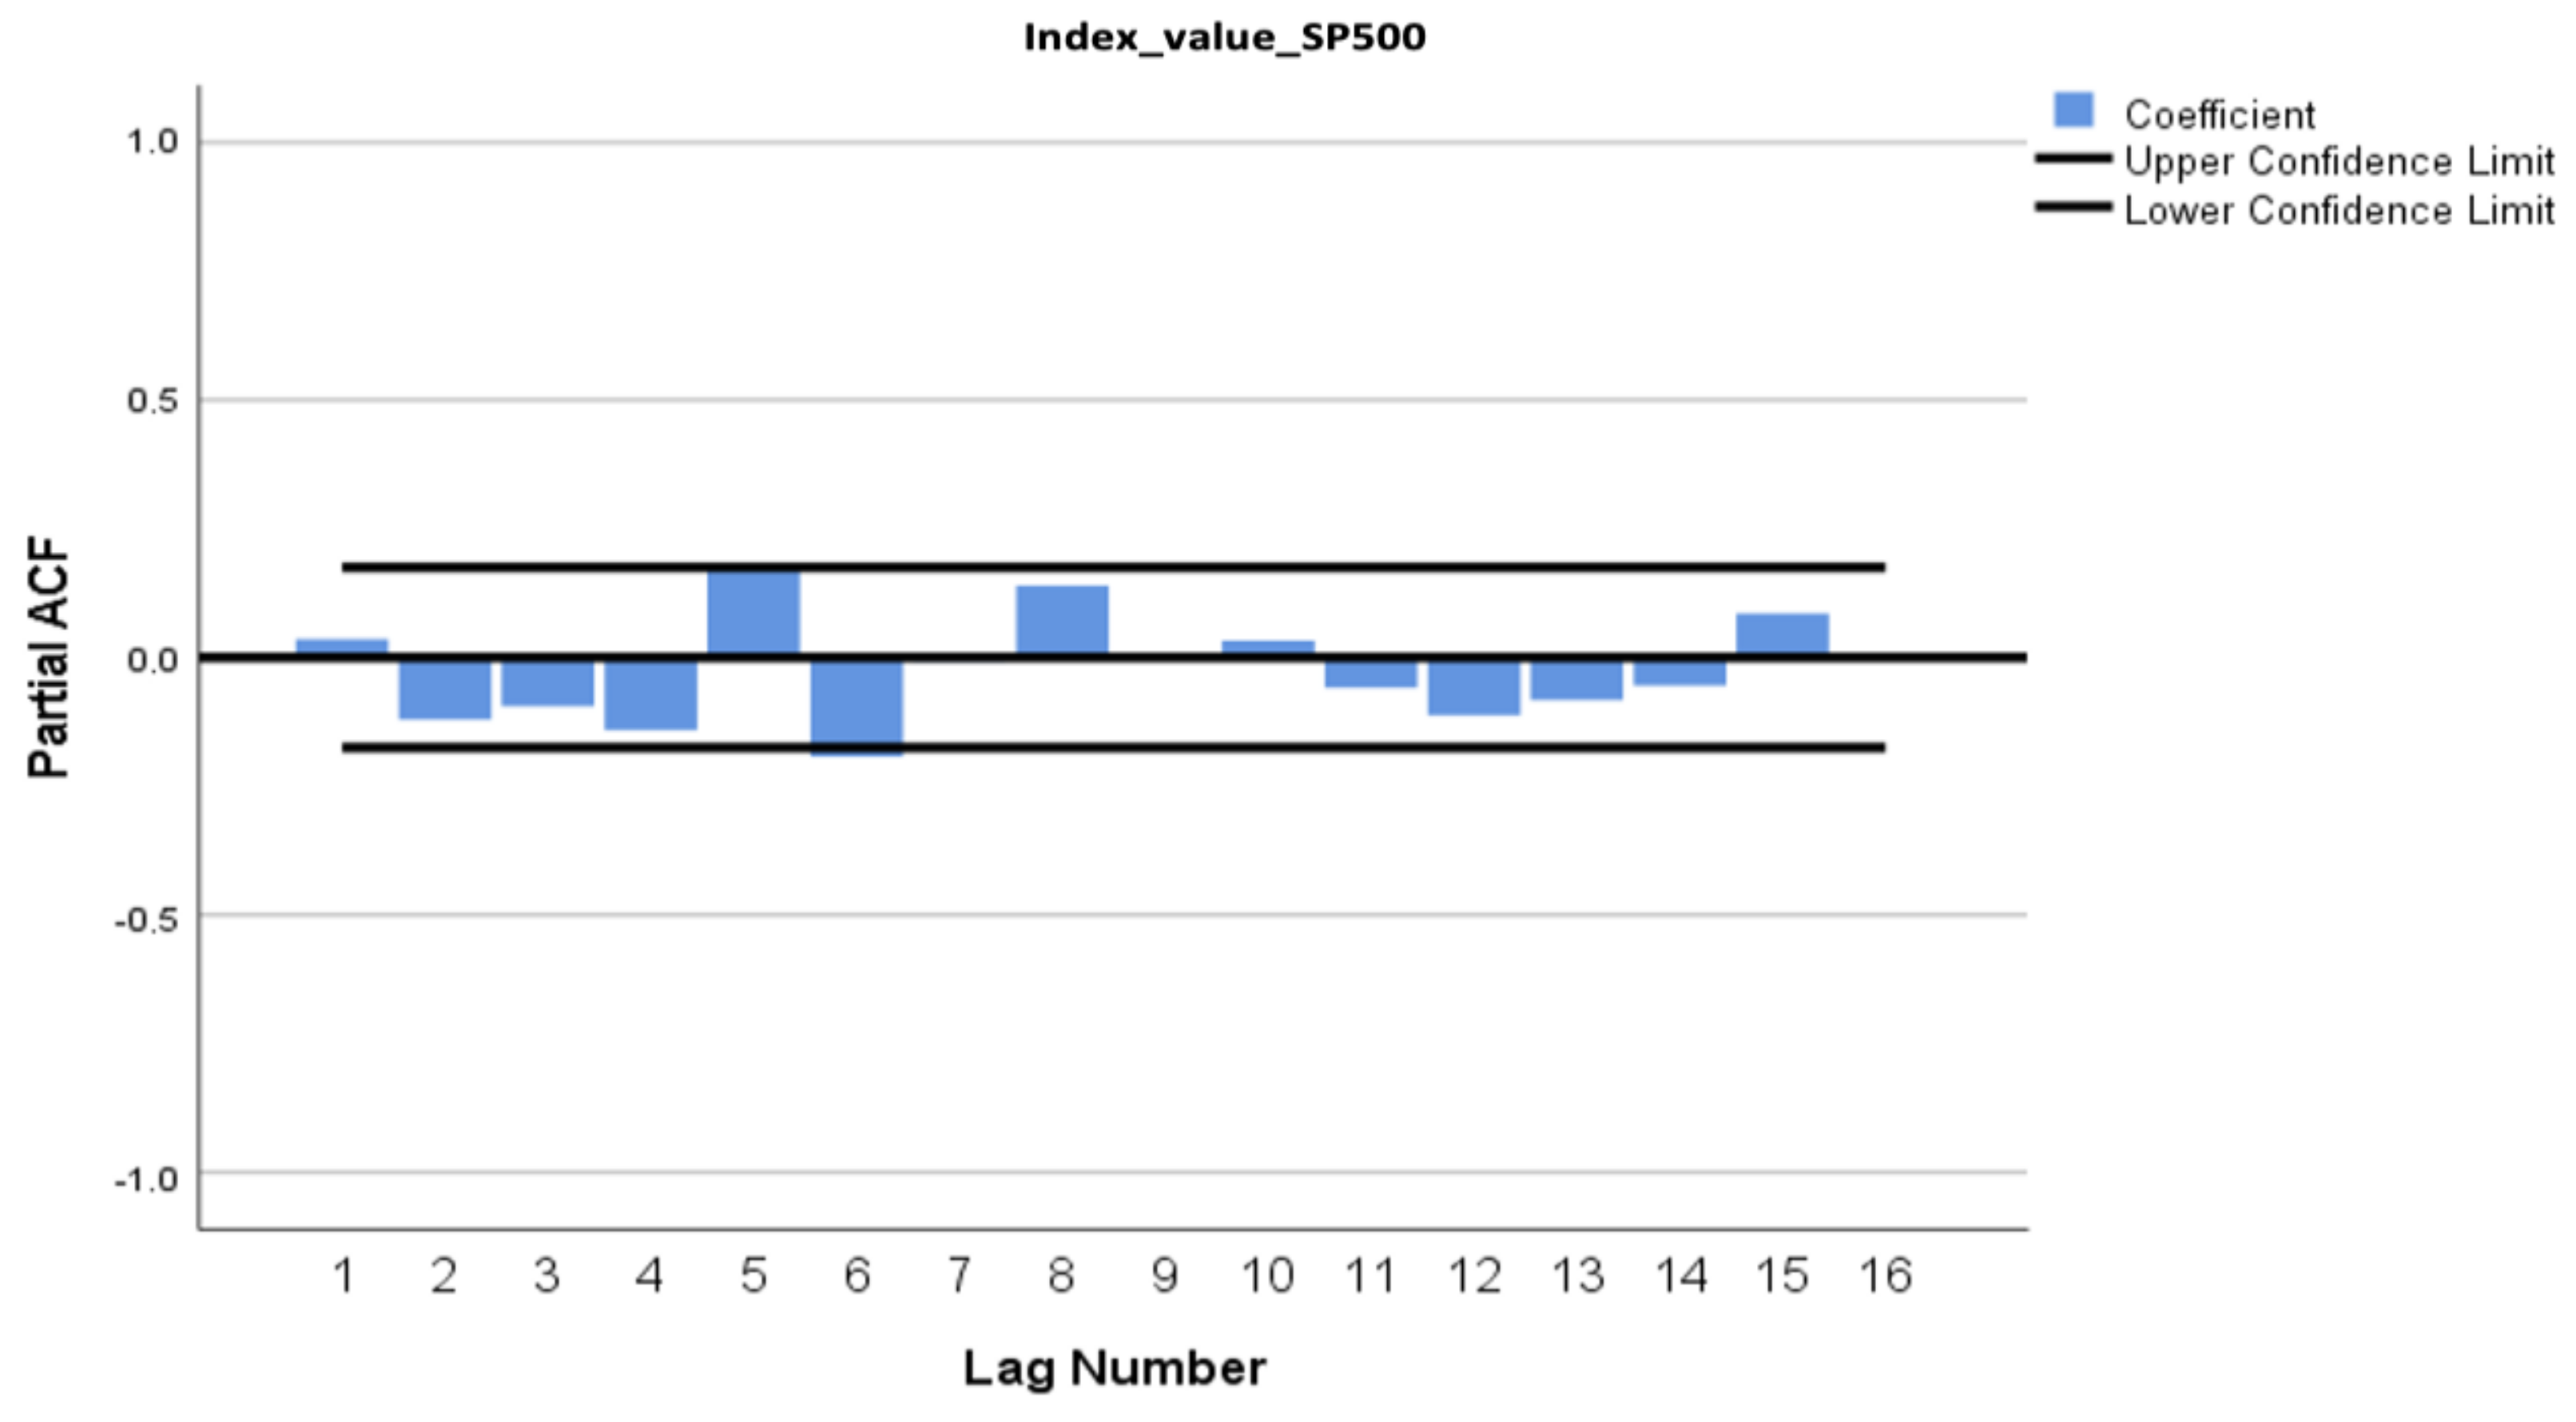
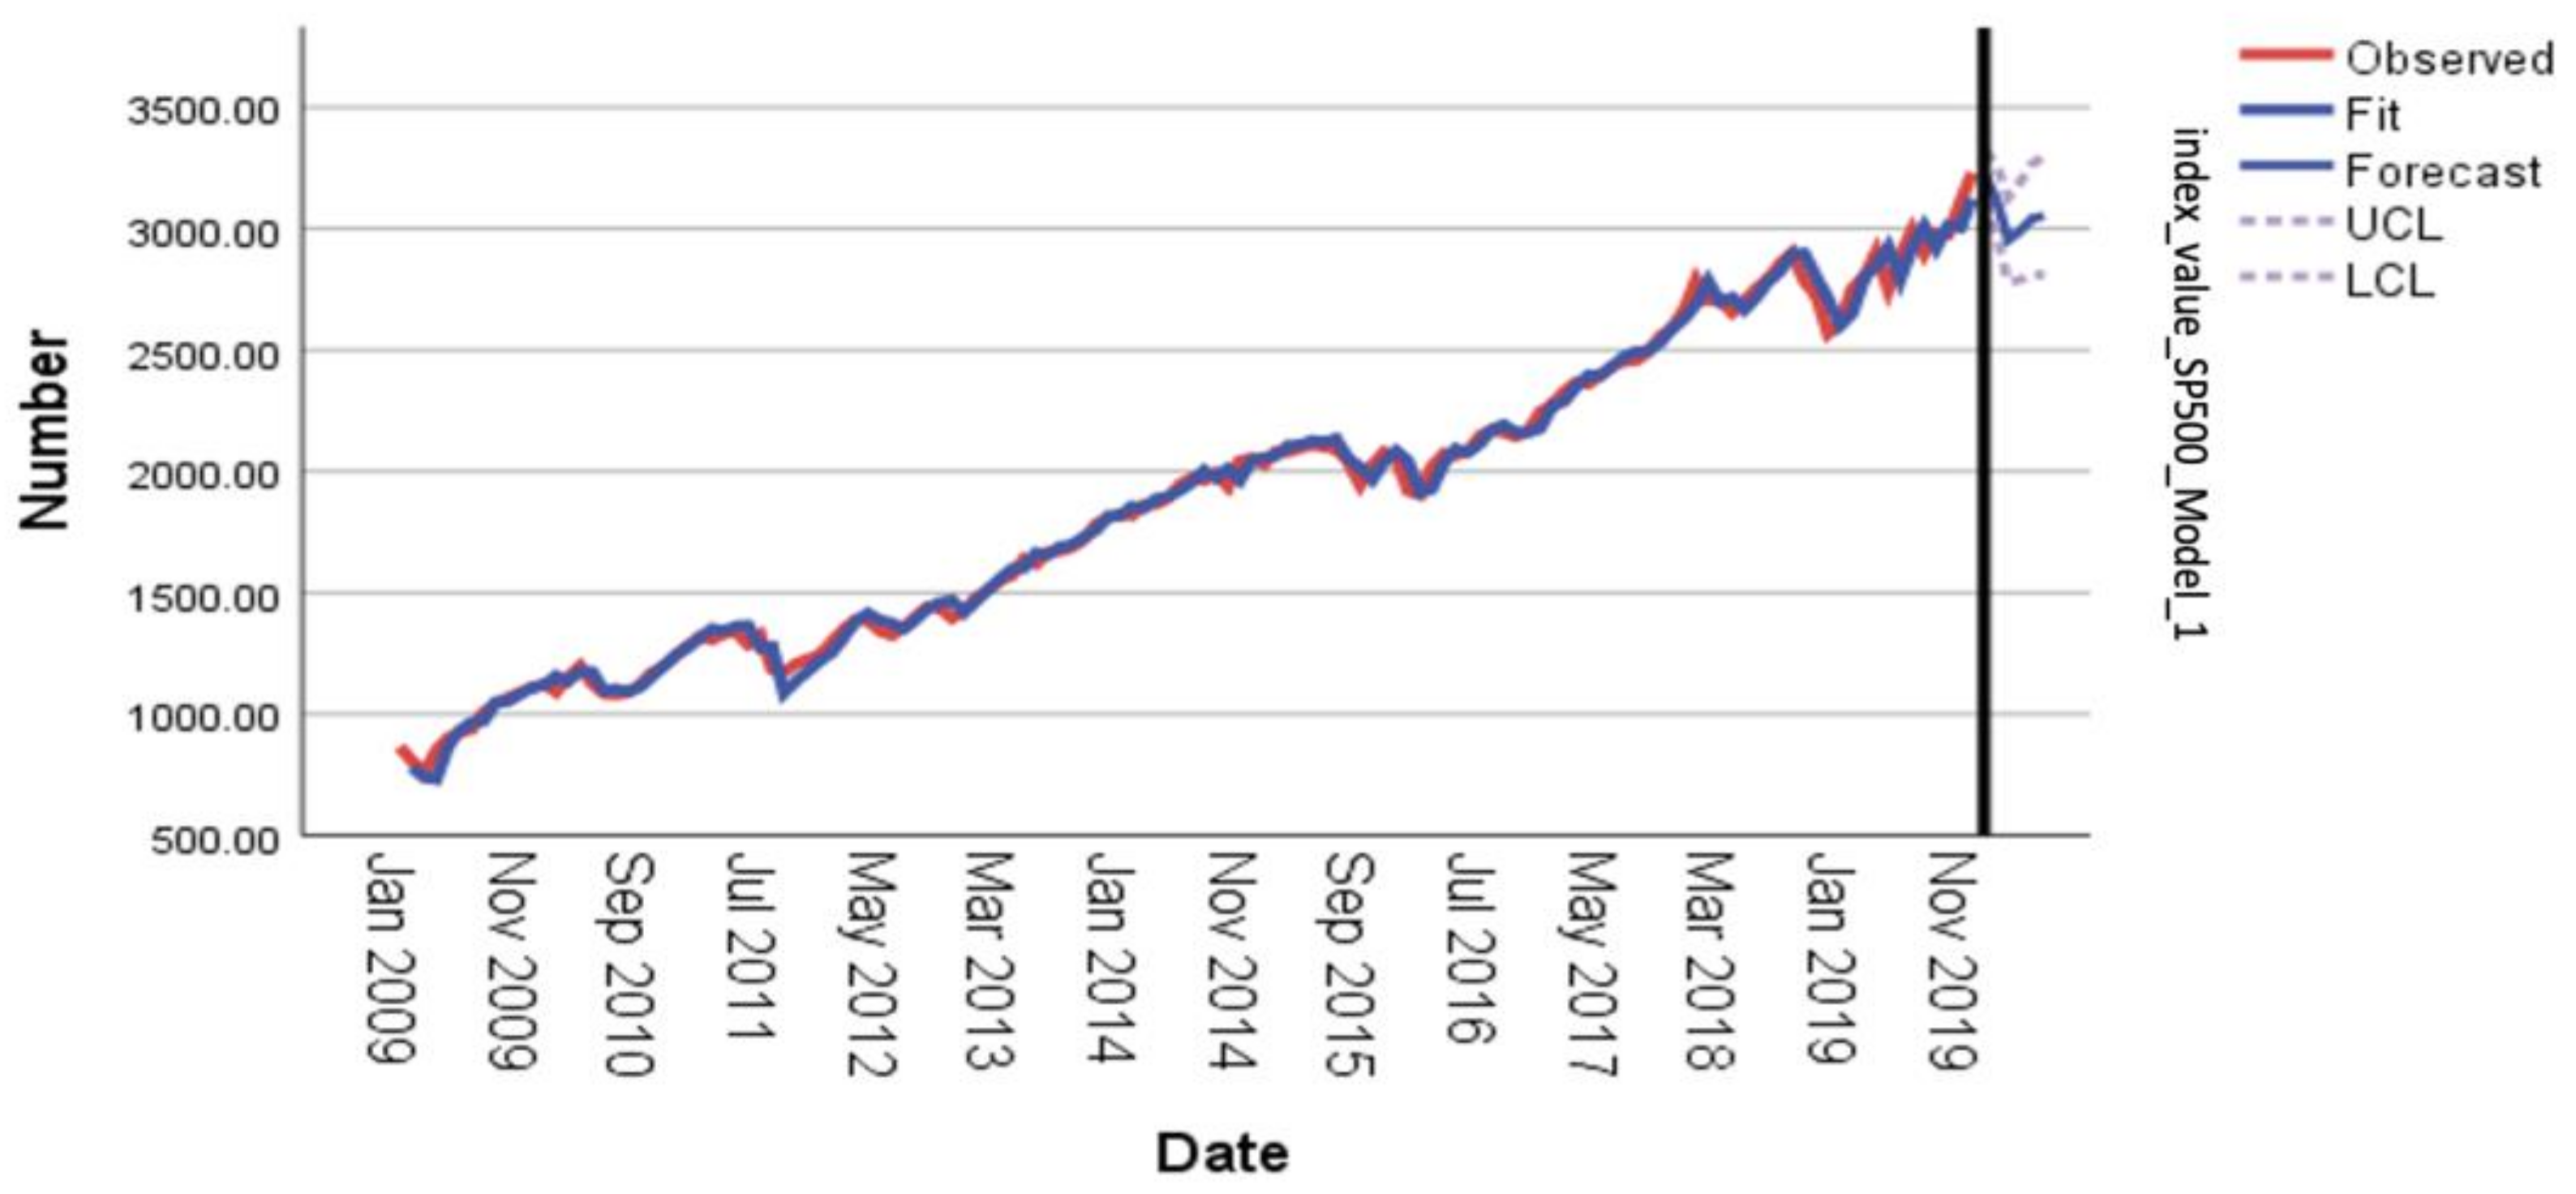
| Null Hypothesis | Test | p-Value | Result |
|---|---|---|---|
| The yield distribution is the same within all categories of months. | Kruskal-Wallis | 0.067 | Rejection of the null hypothesis. |
| Value | df | Asymptotic Significance | |
|---|---|---|---|
| Pearson’s χ2 test | 2.046 | 1 | 0.153 |
| Valid measurements | 100 |
| Variable | Coefficient | Std. Error | t-Statistics | p-Value | Coll. Stat. Tolerance | Coll. Stat. VIF |
|---|---|---|---|---|---|---|
| Constant | −2192.487 | 2948.861 | −0.744 | 0.459 | ||
| Unemployment rate | −48.108 | 52.203 | −0.922 | 0.359 | 0.003 | 366.744 |
| Inflation rate | −10.878 | 8.359 | −1.301 | 0.196 | 0.414 | 2.416 |
| Interest rate | −83.985 | 37.861 | −2.218 | 0.028 | 0.045 | 22.418 |
| GDP USA | 0.397 | 0.073 | 5.425 | 0.000 | 0.001 | 721.017 |
| Trade balance USA | −0.001 | 0.002 | −0.553 | 0.581 | 0.354 | 2.822 |
| Monetary aggregate M2 | −0.034 | 0.090 | −0.377 | 0.707 | 0.001 | 1061.71 |
| Dollar index | −6.108 | 2.602 | −2.348 | 0.021 | 0.048 | 20.700 |
| Volatility index | −3.200 | 1.484 | −2.156 | 0.033 | 0.306 | 3.272 |
| Index of US economic
activity | −6.806 | 37.419 | −0.182 | 0.856 | 0.000 | 4355.64 |
| US Industrial Production Index | −11.579 | 6.691 | −1.731 | 0.086 | 0.032 | 31.515 |
| Gold yield | −78.890 | 125.464 | −0.629 | 0.531 | 0.922 | 1.085 |
| The yield on 30-year US bonds | 10,786.255 | 1772.370 | 6.086 | 0.000 | 0.263 | 3.801 |
| R-squared | 0.990 | |||||
| Adjusted R-squared | 0.989 | |||||
| S. E. of regression | 67.476 | |||||
| SS total | 52,795,277.94 | |||||
| SS resid | 541,809.73 | |||||
| SS model | 52,253,468.22 | |||||
| F-stat | 956.388 | |||||
| p-value | 0.000 |
| Eigenvalue | Condition Index | Constant | Unemployment Rate | Inflation Rate | Interest Rate | GDP USA | US Trade Balance | Monetary Aggregate M2 | Dollar index | Volatility Index | Index of US Activity | USIP | Gold Yield | US Bonds | |
|---|---|---|---|---|---|---|---|---|---|---|---|---|---|---|---|
| 1 | 10.796 | 1.000 | 0.00 | 0.00 | 0.00 | 0.00 | 0.00 | 0.00 | 0.00 | 0.00 | 0.00 | 0.00 | 0.00 | 0.00 | 0.00 |
| 2 | 0.990 | 3.302 | 0.00 | 0.00 | 0.00 | 0.00 | 0.00 | 0.00 | 0.00 | 0.00 | 0.00 | 0.00 | 0.00 | 0.91 | 0.00 |
| 3 | 0.737 | 3.827 | 0.00 | 0.00 | 0.00 | 0.03 | 0.00 | 0.00 | 0.00 | 0.00 | 0.00 | 0.00 | 0.00 | 0.00 | 0,00 |
| 4 | 0.291 | 6.090 | 0.00 | 0.00 | 0.39 | 0.00 | 0.00 | 0.00 | 0.00 | 0.00 | 0.01 | 0.00 | 0,00 | 0.00 | 0.00 |
| 5 | 0.123 | 9.363 | 0.00 | 0.00 | 0.02 | 0.03 | 0.00 | 0.00 | 0.00 | 0.00 | 0.15 | 0.00 | 0.00 | 0.03 | 0.00 |
| 6 | 0.045 | 15.559 | 0.00 | 0.00 | 0.06 | 0.03 | 0.00 | 0.00 | 0.00 | 0.00 | 0.28 | 0.00 | 0.00 | 0.00 | 0.07 |
| 7 | 0.010 | 32.412 | 0.00 | 0.01 | 0.11 | 0.02 | 0.00 | 0.12 | 0.00 | 0.00 | 0.06 | 0.00 | 0.00 | 0.00 | 0.42 |
| 8 | 0.006 | 42.842 | 0.00 | 0.01 | 0.12 | 0.02 | 0.00 | 0.60 | 0.00 | 0.00 | 0.01 | 0.00 | 0.00 | 0.00 | 0.16 |
| 9 | 0.001 | 85.523 | 0.00 | 0.00 | 0.06 | 0.00 | 0.00 | 0.02 | 0,00 | 0.21 | 0.16 | 0.00 | 0.01 | 0.00 | 0.02 |
| 10 | 0.000 | 214.53 | 0.00 | 0.03 | 0.20 | 0.25 | 0.00 | 0.19 | 0.05 | 0.21 | 0.25 | 0.00 | 0.12 | 0.01 | 0.12 |
| 11 | <0 | 409.03 | 0.03 | 0.07 | 0.00 | 0.02 | 0.05 | 0.05 | 0.00 | 0.42 | 0.02 | 0.01 | 0.14 | 0.01 | 0.09 |
| 12 | <0 | 544.43 | 0.00 | 0.03 | 0.03 | 0.18 | 0.31 | 0.00 | 0.25 | 0.07 | 0.02 | 0.00 | 0.22 | 0.01 | 0.06 |
| 13 | <0 | 2945.6 | 0.97 | 0.86 | 0.00 | 0.41 | 0.63 | 0.01 | 0.69 | 0.09 | 0.03 | 0.99 | 0.50 | 0.01 | 0.05 |
| Variable | Coefficient | Std. Error | t-Statistics | p-Value | Coll. Stat. Tolerance | Coll. Stat. VIF |
|---|---|---|---|---|---|---|
| Constant | 3185.349 | 120.824 | 26.364 | 0.000 | ||
| Unemployment rate | −205.348 | 10.867 | −18.897 | 0.000 | 0.171 | 5.845 |
| Inflation rate | 27.273 | 11.665 | 2.338 | 0.021 | 0.578 | 1.731 |
| Interest rate | 224.424 | 22.972 | 9.769 | 0.000 | 0.329 | 3.036 |
| US trade balance | −0.001 | 0.003 | −0.233 | 0.816 | 0.472 | 2.117 |
| Volatility index | −13.684 | 1.773 | −7.720 | 0.000 | 0.583 | 1.717 |
| Gold yield | −51.499 | 202.308 | −0.255 | 0.799 | 0.964 | 1.037 |
| The yield on 30-year US bonds | 2254.055 | 2408.970 | 0.936 | 0.351 | 0.387 | 2.583 |
| R-square | 0.971 | |||||
| Adjusted R-square | 0.969 | |||||
| S. E. of regression | 111.257 | |||||
| SS total | 52,795,277.94 | |||||
| SS resid | 1,534,890.53 | |||||
| SS model | 51,260,387.41 | |||||
| F-stat | 591.600 | |||||
| p-value | 0.000 |
| Eigenvalue | Condition Index | Constant | Unemployment Rate | Inflation Rate | Interest Rate | US trade Balance | Volatility Index | Gold Yield | Yield of 30-Year Bonds | |
|---|---|---|---|---|---|---|---|---|---|---|
| 1 | 5.910 | 1.000 | 0.00 | 0.00 | 0.00 | 0.00 | 0.00 | 0.00 | 0.00 | 0.00 |
| 2 | 0.983 | 2.452 | 0.00 | 0.00 | 0.00 | 0.00 | 0.00 | 0.00 | 0.96 | 0.00 |
| 3 | 0.722 | 2.861 | 0.00 | 0.00 | 0.01 | 0.21 | 0.00 | 0.01 | 0.00 | 0.00 |
| 4 | 0.275 | 4.633 | 0.00 | 0.00 | 0.51 | 0.08 | 0.00 | 0.03 | 0.01 | 0.00 |
| 5 | 0.068 | 9.320 | 0.01 | 0.00 | 0.17 | 0.01 | 0.01 | 0.71 | 0.01 | 0.02 |
| 6 | 0.029 | 14.353 | 0.04 | 0.15 | 0.00 | 0.37 | 0.07 | 0.09 | 0.01 | 0.11 |
| 7 | 0.009 | 24.990 | 0.00 | 0.83 | 0.07 | 0.24 | 0.03 | 0.16 | 0.00 | 0.72 |
| 8 | 0.004 | 41.001 | 0.95 | 0.02 | 0.23 | 0.08 | 0.90 | 0.00 | 0.01 | 0.14 |
| Estimate | St. dev. | t | Sig. | ||||
|---|---|---|---|---|---|---|---|
| Value of S&P 500-Model 1 | The value of the S&P 500 index | No change | Con. | 3127.155 | 129.115 | 24.220 | 0.000 |
| Unemployment rate | No change | Lag 0 | −207.984 | 11.094 | −18.748 | 0.000 | |
| Inflation rate | No change | Lag 0 | 27.125 | 11.832 | 2.292 | 0.024 | |
| Interest rate | No change | Lag 0 | 221.383 | 23.342 | 9.484 | 0.000 | |
| US trade balance | No change | Lag 0 | −0.001 | 0.003 | −0.269 | 0.788 | |
| Volatility index | No change | Lag 0 | −13.770 | 1.812 | −7.600 | 0.000 | |
| Gold yield | No change | Lag 0 | −1.952 | 215.948 | −0.009 | 0.993 | |
| Bond yield | No change | Lag 0 | 3436.805 | 2476.101 | 1.388 | 0.168 | |
| April | No change | Lag 0 | 4.867 | 48.714 | 0.100 | 0.921 | |
| August | No change | Lag 0 | 70.672 | 48.220 | 1.466 | 0.146 | |
| December | No change | Lag 0 | 67.199 | 49.139 | 1.368 | 0.174 | |
| February | No change | Lag 0 | −2.518 | 48.056 | −0.052 | 0.958 | |
| July | No change | Lag 0 | 34.706 | 48.739 | 0.712 | 0.478 | |
| June | No change | Lag 0 | 24.788 | 48.696 | 0.509 | 0.612 | |
| March | No change | Lag 0 | −0.849 | 49.097 | −0.017 | 0.986 | |
| May | No change | Lag 0 | 20.030 | 48.881 | 0.410 | 0.683 | |
| November | No change | Lag 0 | 69.700 | 48.750 | 1.430 | 0.156 | |
| October | No change | Lag 0 | 61.090 | 48.432 | 1.261 | 0.210 | |
| September | No change | Lag 0 | 80.334 | 49.186 | 1.633 | 0.105 | |
| Estimate | St. dev. | t | Sig. | ||||
|---|---|---|---|---|---|---|---|
| Value of S&P 500-Model 1 | Value of S&P 500 | No change | Con. | 3239.894 | 50.653 | 63.962 | 0.000 |
| Unemployment rate | No change | Lag 0 | −198.580 | 7.797 | −25.468 | 0.000 | |
| Inflation rate | No change | Lag 0 | 28.117 | 9.598 | 2.929 | 0.004 | |
| Interest rate | No change | Lag 0 | 231.926 | 20.084 | 11.548 | 0.000 | |
| Volatility index | No change | Lag 0 | −13.953 | 1.734 | −8.048 | 0.000 | |
| Number of Predictors | Model Verification Statistics | Ljung-Box Q | Number of Outliers | |||
|---|---|---|---|---|---|---|
| Stationary R2 | Normalized BIC | Statistics | DF | Sig. | ||
| 4 | 0.971 | 9.592 | 141.949 | 18 | 0.000 | 0 |
| Number of Predictors | Model Verification Statistics | Ljung-Box Q | Number of Outliers | |||
|---|---|---|---|---|---|---|
| Stationary R2 | Normalized BIC | Statistics | DF | Sig. | ||
| 4 | 0.196 | 8.046 | 25.118 | 18 | 0.122 | 0 |
| Estimate | St. dev. | t | Sig. | ||||
|---|---|---|---|---|---|---|---|
| Value of S&P 500-Model 1 | The value of the S&P 500 index | No change | Constant | 33.241 | 23.363 | 1.423 | 0.157 |
| Differentiation | 1 | - | - | - | |||
| Unemployment rate | No change | Lag 0 | 11.147 | 3.652 | 3.053 | 0.003 | |
| Inflation rate | No change | Lag 0 | −9.141 | 4.428 | −2.065 | 0.041 | |
| Interest rate | No change | Lag 0 | 20.207 | 9.304 | 2.172 | 0.032 | |
| Volatility index | No change | Lag 0 | −4.641 | 0.852 | −5.449 | 0.000 | |
| Estimate | St. dev. | t | Sig. | |||||
|---|---|---|---|---|---|---|---|---|
| Value of S&P 500-Model 1 | The value of the S&P 500 index | No change | Constant | 173.822 | 41.662 | 4.172 | 0.000 | |
| AR | Lag 1 | −0.121 | 0.096 | −1.264 | 0.209 | |||
| Lag 2 | −0.236 | 0.097 | −2.419 | 0.017 | ||||
| Lag 3 | −0.241 | 0.098 | −2.452 | 0.016 | ||||
| Lag 4 | −0.247 | 0.100 | −2.481 | 0.015 | ||||
| Lag 5 | 0.085 | 0.099 | 0.859 | 0.392 | ||||
| Lag 6 | −0.224 | 0.102 | −2.193 | 0.031 | ||||
| Differentiation | 1 | - | - | - | ||||
| Estimate | St. dev. | t | Sig. | |||||
|---|---|---|---|---|---|---|---|---|
| Value of S&P 500-Model 1 | The value of the S&P 500 index | No change | Constant | 188.676 | 44.064 | 4.282 | 0.000 | |
| AR | Lag 1 | −0.158 | 0.096 | −1.646 | 0.103 | |||
| Lag 2 | −0.202 | 0.096 | −2.100 | 0.038 | ||||
| Lag 3 | −0.214 | 0.096 | −2.225 | 0.028 | ||||
| Lag 4 | −0.203 | 0.099 | −2.053 | 0.042 | ||||
| Differentiation | 1 | - | - | - | ||||
| January 2020 | February 2020 | March 2020 | April 2020 | May 2020 | June 2020 | |
|---|---|---|---|---|---|---|
| Real value | 3225.52 | 2954.22 | 2584.59 | 2912.43 | 3044.31 | 3100.29 |
| Predicted value | 3223.87 | 3120.87 | 2954.09 | 2990.97 | 3042.85 | 3052.69 |
| Difference | 1.65 | −166.65 | −369.50 | −78.54 | 1.46 | 47.60 |
| UCL | 3324.59 | 3263.31 | 3128.55 | 3192.41 | 3268.07 | 3299.41 |
| LCL | 3123.14 | 2978.43 | 2779.64 | 2789.52 | 2817.63 | 2805.97 |
Disclaimer/Publisher’s Note: The statements, opinions and data contained in all publications are solely those of the individual author(s) and contributor(s) and not of MDPI and/or the editor(s). MDPI and/or the editor(s) disclaim responsibility for any injury to people or property resulting from any ideas, methods, instructions or products referred to in the content. |
© 2024 by the authors. Licensee MDPI, Basel, Switzerland. This article is an open access article distributed under the terms and conditions of the Creative Commons Attribution (CC BY) license (https://creativecommons.org/licenses/by/4.0/).
Share and Cite
Nagy, M.; Valaskova, K.; Kovalova, E.; Macura, M. Drivers of S&P 500’s Profitability: Implications for Investment Strategy and Risk Management. Economies 2024, 12, 77. https://doi.org/10.3390/economies12040077
Nagy M, Valaskova K, Kovalova E, Macura M. Drivers of S&P 500’s Profitability: Implications for Investment Strategy and Risk Management. Economies. 2024; 12(4):77. https://doi.org/10.3390/economies12040077
Chicago/Turabian StyleNagy, Marek, Katarina Valaskova, Erika Kovalova, and Marcel Macura. 2024. "Drivers of S&P 500’s Profitability: Implications for Investment Strategy and Risk Management" Economies 12, no. 4: 77. https://doi.org/10.3390/economies12040077
APA StyleNagy, M., Valaskova, K., Kovalova, E., & Macura, M. (2024). Drivers of S&P 500’s Profitability: Implications for Investment Strategy and Risk Management. Economies, 12(4), 77. https://doi.org/10.3390/economies12040077


