1. Introduction
The final objective of the European Social Model is to simultaneously ensure economic growth and social cohesion. One of the central goals of the EU (European Union), stipulated in the Maastricht Treaty, is promoting social and economic progress by strengthening economic and social cohesion. It is widely recognized that the promotion of cohesion is one of the most prominent and important of the EU’s many political responsibilities; this importance is founded on several aspects, such as: (i) the fact that it has acquired increased importance over time with regard to the budgetary expenses of the European Union; (ii) cohesion policy is quite visible in its broad remit, covering a very wide range of EU policy activities, including infrastructure, telecommunications, research and development, competitiveness, vocational training, employment and social inclusion, as well as objectives to promote environmental sustainability and digitization—objectives that are in line with the perspectives of the green and digital transition; (iii) the contribution to the consolidation of the process of historical enlargement and the EU deepening; (iv) cohesion policy involves a large number of political actors at European level, also managing to include governmental and non-governmental decision-makers at regional and local levels.
With the emergence of the Europe 2020 Strategy, the objectives of the cohesion policy have acquired a multidimensional characteristic, paying increasing attention to social objectives. Thus, the analysis to be developed, as part of quantitative research, aims to expand the assessment of the cohesion policy on economic development by adding the social dimension to identify the effects in terms of achieving the two objectives that are complementary in the European model: economic growth and social cohesion.
This study explores the hypothesis that cohesion policy positively affects economic growth and social outcomes. The research probes into the impact of cohesion policy on economic performance and social progress by analyzing regional-level data from Central and Eastern European (CEE) countries during the 2007–2013 and 2014–2020 programming periods using panel data regression models. This choice stems from the EU’s financial allocation strategy based on regional GDP (gross domestic product) and the increasing recognition of the social dimension in both EU and global strategies, like the UN’s Sustainable Development Goals.
Central and Eastern European countries exhibit diverse economic performances and social landscapes. Before the COVID-19 pandemic, many countries like Poland, Hungary, Czech Republic, Slovakia, and Romania experienced GDP growth rates between 3% and 5% annually, reflecting relative economic robustness compared to Western Europe. However, varying levels of unemployment persist, with rates around 6.1% in Poland, 4.1% in Hungary, 3.6% in the Czech Republic, 7.7% in Slovakia, and 4.3% in Romania as of 2021. Income disparities remain a challenge, particularly between rural and urban areas, accentuating economic inequalities. While some countries have improved healthcare systems and social welfare, demographic shifts, including aging populations and the outward migration of skilled workers, pose ongoing concerns. EU funding has aided infrastructure development and education, and digital transformation efforts are underway to bolster innovation and competitiveness. The COVID-19 pandemic has brought varied economic impacts to CEE nations. Some experienced significant contractions due to lockdowns and disruptions in global supply chains, while others demonstrated resilience. These countries face ongoing challenges in managing income disparities, unemployment, and demographic shifts while striving to modernize infrastructure, improve healthcare, and enhance digital capabilities.
A defining feature of the CEE nations that justifies grouping them for analysis, anticipating relatively consistent outcomes, is their shared history as former communist states. These nations underwent challenging transitional phases, leaving them with various economic, social, and institutional vulnerabilities. Consequently, their administrative capabilities in securing external financial support and their methods of utilizing these funds have not achieved the anticipated progress levels. The ERDF (European Regional Development Fund) stands out as one of the most pivotal tools, championing goals like economic expansion and employment generation and fostering close territorial collaboration. Additionally, the ERDF lends support to regions facing inherent demographic or geographical challenges. This includes regions like thinly populated areas or those dominated by mountainous terrains where homes are widely dispersed from the main community. For the 2014–2020 programming duration, out of the total budget earmarked for the cohesion policy (around EUR 350 billion), the ERDF was allocated EUR 199 billion, earmarked for specific thematic goals.
This study aims to extend the assessment of cohesion policy’s impact on economic development by adding a social dimension, thus exploring the dual objectives of economic growth and social cohesion, which are complementary in the European model. Thus, the study aims to respond to several relevant research questions:
How does the EU’s cohesion policy impact economic growth and social outcomes in Central and Eastern European (CEE) countries? How effective are EU cohesion policies in reducing social inequities, specifically income disparity and poverty, in CEE regions?
Is there a measurable correlation between the implementation of EU cohesion policies and improvements in both economic performance and social progress at the regional level in CEE countries? How does the time-lagged nature of cohesion policy’s impact influence its effectiveness in achieving economic and social objectives?
However, it should be noted that (which is characterized by an alternation of starting and stopping the reforming processes) (
Dinu et al. 2005), which is why one of the methodological difficulties identified at the level of this analysis is that the effects of cohesion policy on economic performance and social progress cannot be observed immediately but with delays. Therefore, the effects of cohesion policy take time to become apparent as investments are spread over several years, and some of their results are then reinvested, which delays the expected effects. At the same time, some regions are more dynamic in economic activity, and others have a narrower concentration of activity, which determines different rhythms in terms of the emergence of results. Thus, the structure and implementation rules of the cohesion policy made it vulnerable to criticism (
Barca 2009). Hence, there is a need to identify the efficiency or inefficiency of the cohesion policy as a contribution to the discussions on its reformation. Thus, in the framework of the analysis, models with a dynamic structure were developed to capture the delays in the appearance of the results. In enhancing the discourse, this study pushes boundaries beyond traditional GDP-focused evaluations, advocating for more holistic indicators that encapsulate social progress. This endeavor augments the academic dialogue and informs policy decisions for upcoming programming periods. A review of the existing literature suggests a pressing need to explore cohesion policy’s dual impact on economic development and social progress. Moving beyond the traditional metric of GDP growth, there is a compelling case for incorporating broader indicators that offer a comprehensive insight into social dimensions. While GDP growth remains a vital benchmark, it is not the sole aim of cohesion policy. Evaluating its effects on diverse socio-economic markers deepens academic discourse and bolsters the underpinnings of policy decisions. Such a holistic approach could enhance the efficiency of cohesion fund allocations in upcoming programming periods. Cohesion funds are EU subsidies for the development of the social and industrial infrastructure of certain member nations.
Incorporating social indicators, such as the SPI (Social Progress Index), into the evaluation of cohesion policy is crucial as it provides a more comprehensive understanding of policy impacts; traditional economic metrics like GDP are limited in scope and fail to fully capture the nuances of societal advancement, especially in the realms of income inequality and poverty reduction.
The Opportunities pillar of the SPI, focusing on aspects like access to education, information, and advanced healthcare, serves as a vital complement to economic data, offering a deeper insight into how cohesion policies foster equitable opportunities and directly contribute to mitigating social disparities.
By integrating robust social indicators alongside economic metrics, we can gain a more holistic view of cohesion policy outcomes, ensuring that assessments are not just about economic efficiency but also about their effectiveness in creating inclusive, equitable societies where opportunities for advancement and poverty reduction are realistically appraised and addressed.
This study explores the hypothesis that cohesion policy positively affects economic growth and social outcomes. It examines the impact of cohesion policy on economic performance and social progress at the regional level in CEE countries during the 2007–2013 and 2014–2020 programming periods using panel data regression models. This approach is rooted in the EU’s financial allocation strategy based on regional GDP and acknowledges the increasing recognition of the social dimension in global strategies, such as the UN’s Sustainable Development Goals.
CEE countries present diverse economic performances and social landscapes, with various challenges and achievements in different sectors. The COVID-19 pandemic has further complicated these scenarios, having varied economic impacts on the nations. The shared history of these countries as former communist states provides a common thread for analysis, anticipating relatively consistent outcomes across the region. From this point of view, the paper makes several contributions to the literature. Firstly, a holistic evaluation of cohesion policy: While much of the existing literature focuses on the economic impacts of the cohesion policy, primarily gauging success through GDP growth, this study provides a more comprehensive assessment; by incorporating the social dimension, the research presents a multidimensional perspective on the policy’s outcomes. Secondly, an in-depth regional analysis of CEE countries: The study delves deep into the specific context of these countries. Given that the regions of CEE countries have traditionally been underrepresented in similar research, this work fills a significant gap. Thirdly, dynamic models: recognizing the time-lagged impacts of cohesion policies, the study employs dynamic models to account for the delays in outcomes. This approach ensures a more accurate depiction of the policy’s real-time and long-term effects. Fourthly, the study acknowledges and validates other significant indicators reflecting social progress by venturing beyond the conventional GDP metric. This broader approach offers a more rounded picture of the policy’s impacts and underscores the need for varied evaluation metrics in the future. Fifthly, implications for policy reformation: highlighting the cohesion policy’s efficiency or inefficiency contributes valuable insights that could shape discussions on policy reformation. Sixthly, bridging literature gaps: the research takes a bold step in analyzing and challenging the existing literature. It addresses the dearth of studies on the social impact of cohesion funds, further enriching academic discussions and offering fresh avenues for future research.
This paper contributes to the literature by providing a holistic evaluation of cohesion policy, delving into the specific context of CEE countries, employing dynamic models to capture time-lagged impacts, and advocating for a broader range of evaluation metrics. It addresses the need for policy reformation and aims to bridge literature gaps by analyzing the social impact of cohesion funds.
The paper unfolds as follows: Initially, we outline our core objectives and the rationale behind the impact analysis, grounding our research within the European landscape. Next, we provide a literature review, spotlighting the scant research on the effectiveness of cohesion policy, particularly in the context of CEE regions. In the subsequent section, we delve into our research methodology, detailing the data transformation processes to ensure accurate outcomes. Our findings highlight the correlation between cohesion funds, economic growth, and social progress indicators. We then evaluate the recent evolution of cohesion policy tools in CEE over the past two programming periods. The paper concludes with key takeaways and actionable recommendations for enhancing the efficacy of cohesion fund allocation.
2. Literature Review
Over time, cohesion policy has proven effective in helping many states reduce their regional gaps and gaps with other Member States. It substantially improved the economies of the states in the PIGS group (Portugal, Ireland, Greece and Spain), having a GDP per inhabitant value below 90% of the European Community average, thus being eligible for the granting of cohesion funds and subsequently enjoying a substantial catching-up effect. Through its actions, cohesion policy has significantly contributed to accelerating growth and prosperity in the EU, reducing certain economic, social and territorial disparities.
In the last few decades,
Fiaschi et al. (
2018) and similar studies have provided valuable insights into the economic dimensions of cohesion policy. They predominantly center on regional GDP, neglecting a comprehensive analysis of crucial social outcomes such as employment rates, poverty levels, and social inclusion measures, thereby leaving a notable gap in understanding the full spectrum of policy effects. The prevalent focus on economic indicators in the existing literature overlooks the multifaceted nature of social progress, failing to adequately evaluate how cohesion policies influence more nuanced social dimensions, including the effectiveness of these policies in directly reducing poverty, enhancing job opportunities, and fostering inclusive social environments. This oversight in the literature highlights a critical need for expanded research that goes beyond economic metrics, offering a more holistic view of cohesion policy impacts by incorporating assessments of direct social benefits, thereby providing a clearer picture of how these policies contribute to or fall short in addressing key societal challenges like income inequality and social exclusion.
In addition to the merits associated with cohesion policy, it has been subjected to a series of criticisms over time, such as: (i) failure to meet the objectives established by the EU Treaties, (ii) insufficient emphasis on economic growth (
Sapir 2003), and (iii) turned into a captivating policy without a clear mission, with complex and overly bureaucratic administration (
Manzella and Mendez 2009). Later, criticism narrowed down to the results, with studies identifying a positive impact on economic growth (
Crescenzi and Giua 2016;
Rodriguez-Pose and Novak 2013;
Tomova et al. 2013). In contrast, other studies identified a negative impact (
Dall’Erba and Le Gallo 2008) or no impact (
Boldrin and Canova 2001), and others suggested that there is no consensus regarding the effectiveness of cohesion policy (
Ederveen et al. 2003;
Darvas and Wolff 2018). There are divergent conclusions about the effectiveness of cohesion policy because the methods and hypothetical approaches used in determining the results are extremely different.
Analyses of the impact of cohesion policy on European regional performance mainly focus on the economic dimension, measured by GDP per capita and occasionally by the employment rate (
Becker et al. 2010;
Rodríguez Pose and Novak 2013;
Giua 2017;
Fiaschi et al. 2018;
Crescenzi and Giua 2020) or the level of education and health (
Calegari et al. 2021). Although there is a rich literature base on the effects of cohesion, especially on economic performance, it is inconclusive. Contrasting results derive from the choice of spatial and temporal considerations, variables used, and impact estimation methodologies.
Farrell (
2004) identifies a positive impact of structural funds on regional economic growth in Ireland and Spain. The results are supported by
Lolos (
2009), who analyzes the case of Greece. Some studies identify a positive impact on economic growth, with more pronounced effects for developed regions (
Crescenzi and Giua 2016;
Calegari 2020). The possible explanations for these results are, on the one hand, that the regions behind have less negotiation skills to attract more funds (
Charron 2016;
Fratesi and Wishlade 2017), and on the other hand, that these regions present a reduced capacity to absorb the allocated funds, which leads to the paradoxical situation where the regions entitled to receive considerable amounts from the structural funds cannot use them (
Becker et al. 2013;
Surubaru 2017;
Cerqua and Pellegrini 2018).
Also, some studies have not identified any effect of cohesion policy on economic growth performance (
Ederveen et al. 2006), which does not identify “conclusive agreements on the impact of EU cohesion policy in the existing literature”
Medeiros (
2014). Other studies suggest that significant transport and infrastructure investments supported by cohesion policy do not affect economic growth (
Crescenzi and Rodríguez-Pose 2012). Some conclude that there is no significant impact of the absorption rate of EU funds on growth in the EU countries in the short term. However, even a negative impact can be identified (
Albulescu and Goyeau 2013). Other studies identify a negative impact, such as
Dall’Erba and Le Gallo (
2008), who evaluated the impact of structural funds on the convergence process between 145 European regions from 1989 to 1999. They identified the convergence process, but the funds did not impact it. Although studies on the impact of cohesion funds have focused on the effects exerted on economic growth, with a limited contribution to the literature regarding the influence on other indicators that reflect the social dimension, recently, an increasingly significant wave of research explores the effect of cohesion policy on other types of non-economic outcomes as well (
Ferrara et al. 2022;
Albanese et al. 2021).
For example,
Calegari et al. (
2021) goes beyond GDP and analyzes the impact of cohesion policy on GDP per capita and societal well-being through a modified version of the adapted human development index. The results of the study indicate that cohesion policy has significantly increased overall well-being in low-performing regions that have used cohesion funds, with the results being particularly visible in improving the level of education. Attempts to overcome the GDP barrier were also approached by
Crescenzi and Giua (
2018), who found that the cohesion policy exerted a positive and significant impact at the EU level both on regional economic growth and on employment, suggesting that the positive effect on regional employment survived the Great Depression and supported less developed regions during the recovery.
Maucorps et al. (
2020) analyzed the effects of EU cohesion policy on the economic growth of 276 European NUTS-2 regions between 2008 and 2016, using a structural equation model consisting of a measurement component (with two latent variables) and a structural component. The study’s results support the existence and purpose of cohesion policy, where EU funding is essential for the economic development of European regions without other abundant sources of funding, focusing on mitigating structural deficiencies that prevent the effective use of convergence investments.
It is well known in the literature (
Acemoglu and Robinson 2012) that economic growth, often stimulated by effective cohesion policies, lays the foundation for social progress, as increased regional prosperity can lead to enhanced public services, better infrastructure, and improved living standards, all of which are crucial for comprehensive social development. While economic advancements under cohesion policy have the potential to yield significant social benefits, such as reduced poverty rates and greater income equality, there remains a conspicuous gap in the current research that explicitly links these economic gains to tangible improvements in these specific social conditions (
Stiglitz et al. 2010).
According to
Piketty (
2014), the assumption that economic growth automatically translates into social progress is overly simplistic; without deliberate measures and targeted policies, the benefits of increased regional GDP may not effectively trickle down to address core issues of poverty and income disparity. To truly understand the impact of cohesion policy, research must extend beyond economic indicators and rigorously examine how these economic improvements correlate with, and possibly contribute to, key social outcomes like enhanced employment opportunities, poverty alleviation, and narrowed income gaps (
Sen 1999).
This lack of explicit linkage in the current literature between economic growth and its potential social benefits underscores the need for a more integrated approach to policy evaluation—one that considers how economic advancements under cohesion policies are practically reflected in the daily lives of individuals, particularly those in economically disadvantaged segments (
Sachs 2015).
While the literature has established the economic effectiveness of cohesion policy, particularly for the PIGS countries, there is a discernible need to delve into the social impacts of such policies. The current research corpus, which predominantly centers on GDP growth, does not sufficiently address the broader social dimensions such as employment, poverty alleviation, and social inclusion, leaving a gap our research aims to fill. We propose a dual-focused analysis considering economic and social indicators to provide a more nuanced understanding of cohesion policy outcomes. The contrasting conclusions drawn from existing studies on the economic impact of cohesion policy, ranging from positive to non-significant effects, suggest a methodological divergence that our study seeks to reconcile. By employing a robust, integrative methodology, we aim to offer clarity to the debate and contribute a comprehensive perspective on the effectiveness of cohesion policy in both economic and social terms.
Furthermore, while some research points to the benefits of cohesion policy on regional development and growth, the social implications of such policies are not as well documented. Our study extends the scope of analysis beyond GDP, incorporating broader indicators of societal well-being, such as the modified HDI (Human Development Index), as examined by
Calegari et al. (
2021), and employment, as highlighted by
Crescenzi and Giua (
2018).
We acknowledge the literature’s call for an integrated evaluation approach that tracks economic progress under cohesion policy and critically examines how such advancements translate into social benefits. By doing so, we aim to bridge the gap identified by seminal thinkers like
Stiglitz et al. (
2010) and
Piketty (
2014) and provide a more holistic assessment of cohesion policy’s impact on improving living standards and reducing social disparities.
In essence, our research addresses the lacuna in the existing literature by exploring the direct linkage between economic growth facilitated by cohesion policy and its tangible social benefits, offering new insights into how increased regional prosperity under such policies can lead to substantial social improvements, particularly for those in less advantaged economic brackets.
To contextualize our study within the broader academic dialogue and to illustrate the contribution this research makes to existing scholarship,
Table 1 below presents a curated overview of major previous studies related to the impact of cohesion policy on economic growth and social outcomes.
The existing literature on cohesion policy in the EU has predominantly concentrated on economic indicators, such as regional GDP, neglecting crucial social dimensions like employment rates, poverty levels, and social inclusion. To address this gap, our proposed research takes a dual-focused approach, simultaneously considering economic and social indicators. In doing so, we aim to offer a more comprehensive and holistic understanding of the outcomes of cohesion policy. Additionally, there is a recognized methodological divergence in existing studies regarding the economic impact of cohesion policy. Our research contributes by proposing the use of a robust, integrative methodology to reconcile these differences, providing a comprehensive perspective on the effectiveness of cohesion policy in both economic and social terms. This approach aims to bridge the gap in the literature and enhance the understanding of the multifaceted impacts of cohesion policies in the European Union.
3. Data and Methodology
This research aims to assess the impact of cohesion on economic performance and social progress at the regional level in CEE countries using regression analysis on panel data. The study focuses on 54 regions of 10 CEE countries (Bulgaria, Czech, Estonia, Latvia, Lithuania, Hungary, Poland, Romania, Slovakia and Slovenia), for the period 2007–2018—this period was chosen according to the last two programming periods of the Multiannual Financial Framework (2007–2013–2014–2020). Still, data for cohesion funds at the regional level were available until 2018. Cohesion funds at the regional level were accumulated for the years in which the payments related to the two programming periods overlapped (according to the rules for the allocation of European funds and after the completion of the programming period. The variables related to the allocations of cohesion funds—ERDF, CF (Cohesion Fund), and ESF (European Social Fund)—were expressed according to the number of inhabitants for each region and deflated using the GDP deflator with the fixed base 2015 = 100. A detailed description of the variables used in the model and the source of the data is presented in
Appendix A,
Table A1.
To evaluate the impact of cohesion instruments on economic development and social progress, several specifications have been evaluated using two main result indicators: regional GDP and the social progress index and its pillars. To do that, a logarithmic regression model, represented in a log-log form, has been used, allowing for elasticity interpretation, meaning a percentage change in the independent variable results in a percentage change in the dependent variable, acknowledging four different specifications, one for each type of fund:
where
i = 1 … 54 represents the 54 regions of the 10 CEE countries;
t = 1, 2, …
T represents time (2007–2018), and
βi are the model parameters; real GDP/cap. was deflated using the GDP deflator with the base 2015 = 100; the ESIF investments/cap. from the previous period are expressed in comparable prices using the GDP deflator with the base 2015 = 100 and are calculated as the sum of investments from the ERDF, CF and ESF funds; and EQI is the governance quality index at the European level. The value of real GDP was taken from the National Accounts database of Eurostat, and the EQI was taken for three years from the surveys in 2010, 2013, and 2017 from the studies of
Charron et al. (
2014) and
Nistotskaya et al. (
2015). The initial value of real GDP per capita was determined by capturing the convergence effect. According to
Maucorps et al. (
2020), this variable refers to the phenomenon of spatial propagation, when a change in a region’s investment has effects not only on the region itself but also on the economic development of other regions. Developments from other regions (caused by the initial change of the first investment in the region) are fed back into the original region. Therefore, these spatial feedback loops should be integrated into assessing the effects of cohesion policy on regional economic development to capture both the investment’s direct and indirect (feedback) effects. In the present analysis, we use three specifications of the model—one model for each type of investment (ERDF, CF and ESF)—and another specification considering their aggregated value to decompose the impact into components.
It is important to mention that in all the models developed, the instruments of the cohesion policy—the funds—were introduced with a lag of a period, assuming that the effects of the cohesion policy manifest themselves with a delay.
Within this particular type of (log-log) model, the partial regression coefficients play the role of elasticities of the independent variable Xi concerning Y, that is, the percentage change in Y as a result of the percentage change in Xi, ceteris paribus.
To capture the impact of ESIF investments on social progress, we used a lin-log model, which allowed four different specifications, one for each type of fund:
where
i = 1 … 54 represents the 54 regions of the 10 CEE countries,
t = 1, 2, …,
T represents time (the period 2007–2018), and
βi are the model parameters; SPI is the social progress index, and (Basic Human Needs, Foundations of Well-being and Opportunities) are the components of SPI; the ESIF investments/cap. from the previous period are expressed in comparable prices using the GDP deflator with the base 2015 = 100 and are calculated as the sum of investments from the ERDF, CF and ESF funds; and the EQI is the governance quality index at the European level.
The SPI is the most comprehensive measure of social progress. Another attempt to assess social progress “going beyond GDP” was the HDI. Still, the consistency and coverage of the SPI are superior (it contains 54 indicators grouped into 3 dimensions). Moreover, economic indicators are excluded from the SPI to allow for comparison with indicators such as GDP per capita. Furthermore, for this type of model, several specifications (three in number) were estimated that depend, however, on the change of the dependent variable (the SPI and its components: Basic Human Needs, Basic Well-being and Opportunities).
The main methodological Constraints have been:
For the SPI, we utilized the 2011 figures for the 2007–2010 timeframe due to the data for this metric being only accessible for 2011–2020. Additionally, national SPI values were applied to regional levels, given that regional-level SPI data were only available for 2016 and 2020.
The EQI data for the analysis span consist of three distinct sets. In instances where specific years were not directly covered, we adopted the value from the closest available year.
Estimating panel data models involves a systematic approach. After model specification, the Hausman test is a popular diagnostic tool
(i.e., there is no individual-specific error variance)
The test statistic is given by
from the auxiliary regression of the squared residuals from a pooled OLS regression on the individual means of the independent variables. If the LM statistic is significant, then heteroscedasticity (and correlation) is present across the individual-specific errors.
The Modified Wald Test for Groupwise Heteroskedasticity checks for differences in the error variance across groups (or cross-sectional units). Given the model of Equation (4):
The null hypothesis is:
(i.e., the error variance is constant across groups)
Against the alternative:
H1. At least one is different.
The test statistic follows a chi-square distribution. If it is significant, it suggests heteroskedasticity across units.
Serial correlation or autocorrelation is the correlation of a variable with its past values. This is especially concerning in panel data because it can cause coefficient estimates to be inefficient. Serial correlation can also lead to underestimated standard errors, increasing the risk of Type I errors. Two tests are applied to test serial correlation: The Wooldridge and the Arellano–Bond tests. The first test is used for detecting first-order autocorrelation in panel data settings. Given the following model
the focus is on the residuals
from the fixed effects regression. The test regression is:
The null hypothesis is:
(i.e., there is no first-order autocorrelation)
The test statistic is t-statistic for in the test regression. If the test statistic significantly differs from zero, there is evidence of first-order auto-correlation.
This Arellano–Bond test is usually applied in the context of dynamic panel data models estimated using the Arellano–Bond GMM estimator. The test checks for autocorrelation in the first-differenced errors, which, if present, can indicate that the instruments used in the GMM estimation are not valid.
Cross-sectional dependence (CSD) in panel data refers to the likelihood that the errors associated with one entity (a country in a dataset of multiple countries) might be correlated with the errors of another entity. This phenomenon is especially prevalent in panels where entities might be influenced by unobserved common factors or where spillover effects between entities exist. Cross-sectional dependence can lead to biased and inconsistent coefficient estimates if not accounted for.
- 1.
Pesaran’s CD Test:
One common test for cross-sectional dependence is the Pesaran CD test. The test statistic is defined as:
where:
T is the number of periods.
N is the number of cross-sectional units.
is the sample correlation of the residuals from two cross-sectional units, i and j.
CD is asymptotically normally distributed under the null hypothesis of no cross-sectional dependence.
- 2.
Breusch–Pagan LM Test:
Another popular test is the Breusch–Pagan LM Test for cross-sectional dependence. The test statistic is:
where:
T is the number of periods.
is the estimated average of the squared pairwise sample correlation of the residuals.
is the average of the squared sample correlations under the null of no cross- sectional dependence.
The R2 value is a statistic that provides information about the goodness-of-fit of a model. In panel data regressions, we encounter three types of R2: within, between, and overall. Each of these offers different insights into the model’s fit at different data dimensions.
Within
indicates how well the model explains the variation of the dependent variable around its mean within each cross-sectional unit (e.g., each individual, each country):
is the sum of squared residuals from the within transformation, and is the total sum of squares from the within transformation.
Between
shows how well the model explains the variations of the dependent variable around its mean between the cross-sectional units, using the time-averaged values of the variables:
where
is the sum of squared residuals using time-averaged values, and
is the total sum of squares using time-averaged values.
Overall R
2 combines both within and between variations to measure how well the model explains the variation of the dependent variable around its grand mean:
where
SSRoverall is the total sum of squared residuals from the pooled regression (without any transformation), and
SSToverall is the total sum of squares without any transformation.
Each type of R2 provides a unique perspective on the model’s fit:
Within R2, it gives insights into how well our model explains variations over time for each entity.
Between R2 tells us how well our model explains differences between entities.
Overall, R2 provides a combined measure, reflecting the model’s ability to explain both time series and cross-sectional variations in the panel data.
4. Empirical Results
4.1. Analysis of the Main Developments of Cohesion Policy Instruments at the Level of CEE Countries from the Perspective of the Last Two Programming Periods
At the level of the CEE states, Poland has benefited from the largest allocation to date, approximately EUR 49 billion, followed by the Czech Republic (EUR 17 billion) and Romania (EUR 14 billion). It should be noted that Poland is the CEE country with the highest performance in attracting European financial resources for each instrument. This performance of Poland is due to the implementation a transition model based on shock therapy, which proved to be a success, and to other reforms, such as the administrative one, which involved a territorial division allowing regional self-governance.
The cohesion fund is one of the main pillars of the cohesion policy. For 2014–2020, it was allocated according to the GNI (Gross National Income) per capita criterion to the Member States with a GNI per capita lower than 90% of the EU average. All the states from the CEE group were in this category, plus Cyprus, Malta and Greece. The financial resources allocated through the CF were approximately EUR 63.4 billion, distributed to the member states to make investments in the environment, sustainable development of transport infrastructure, and technical assistance. Poland, the Czech Republic and Romania are among the main beneficiaries.
The ESF finances both objectives aimed at economic cohesion, but it mainly deals with the social dimension of cohesion. The more than EUR 80 billion from the ESF has been allocated to all EU regions to improve aspects related to human capital, such as education and professional training; reduce the risk of poverty; or protect vulnerable people, so the ESF aims to invest in increasing the level of employment on the labor market and improving the skills of employees.
The highest level of ESF allocation is recorded by Poland (EUR over 15 billion), followed by Hungary and Romania with EUR 6 and 5.67 billion, respectively. Given these considerable sums allocated to the CEE countries, the question of its use and benefits to the respective countries regarding economic development and social progress is inevitable.
The first attempt to measure well-being beyond GDP was the HDI. Pakistani economist Mahbub ul-Haq developed the HDI based on Amartya Sen’s considerations of human capabilities. According to
Klugman (
2011), the HDI was constructed to measure a country’s level of development to “shift the focus of economic development from national income accounting to people-centred policies”
1. It is a summary measure of average achievement in key dimensions of human development: a long and healthy life, knowledge, and a decent standard of living. The HDI is the geometric mean of the normalized indices for each of the three dimensions
2.
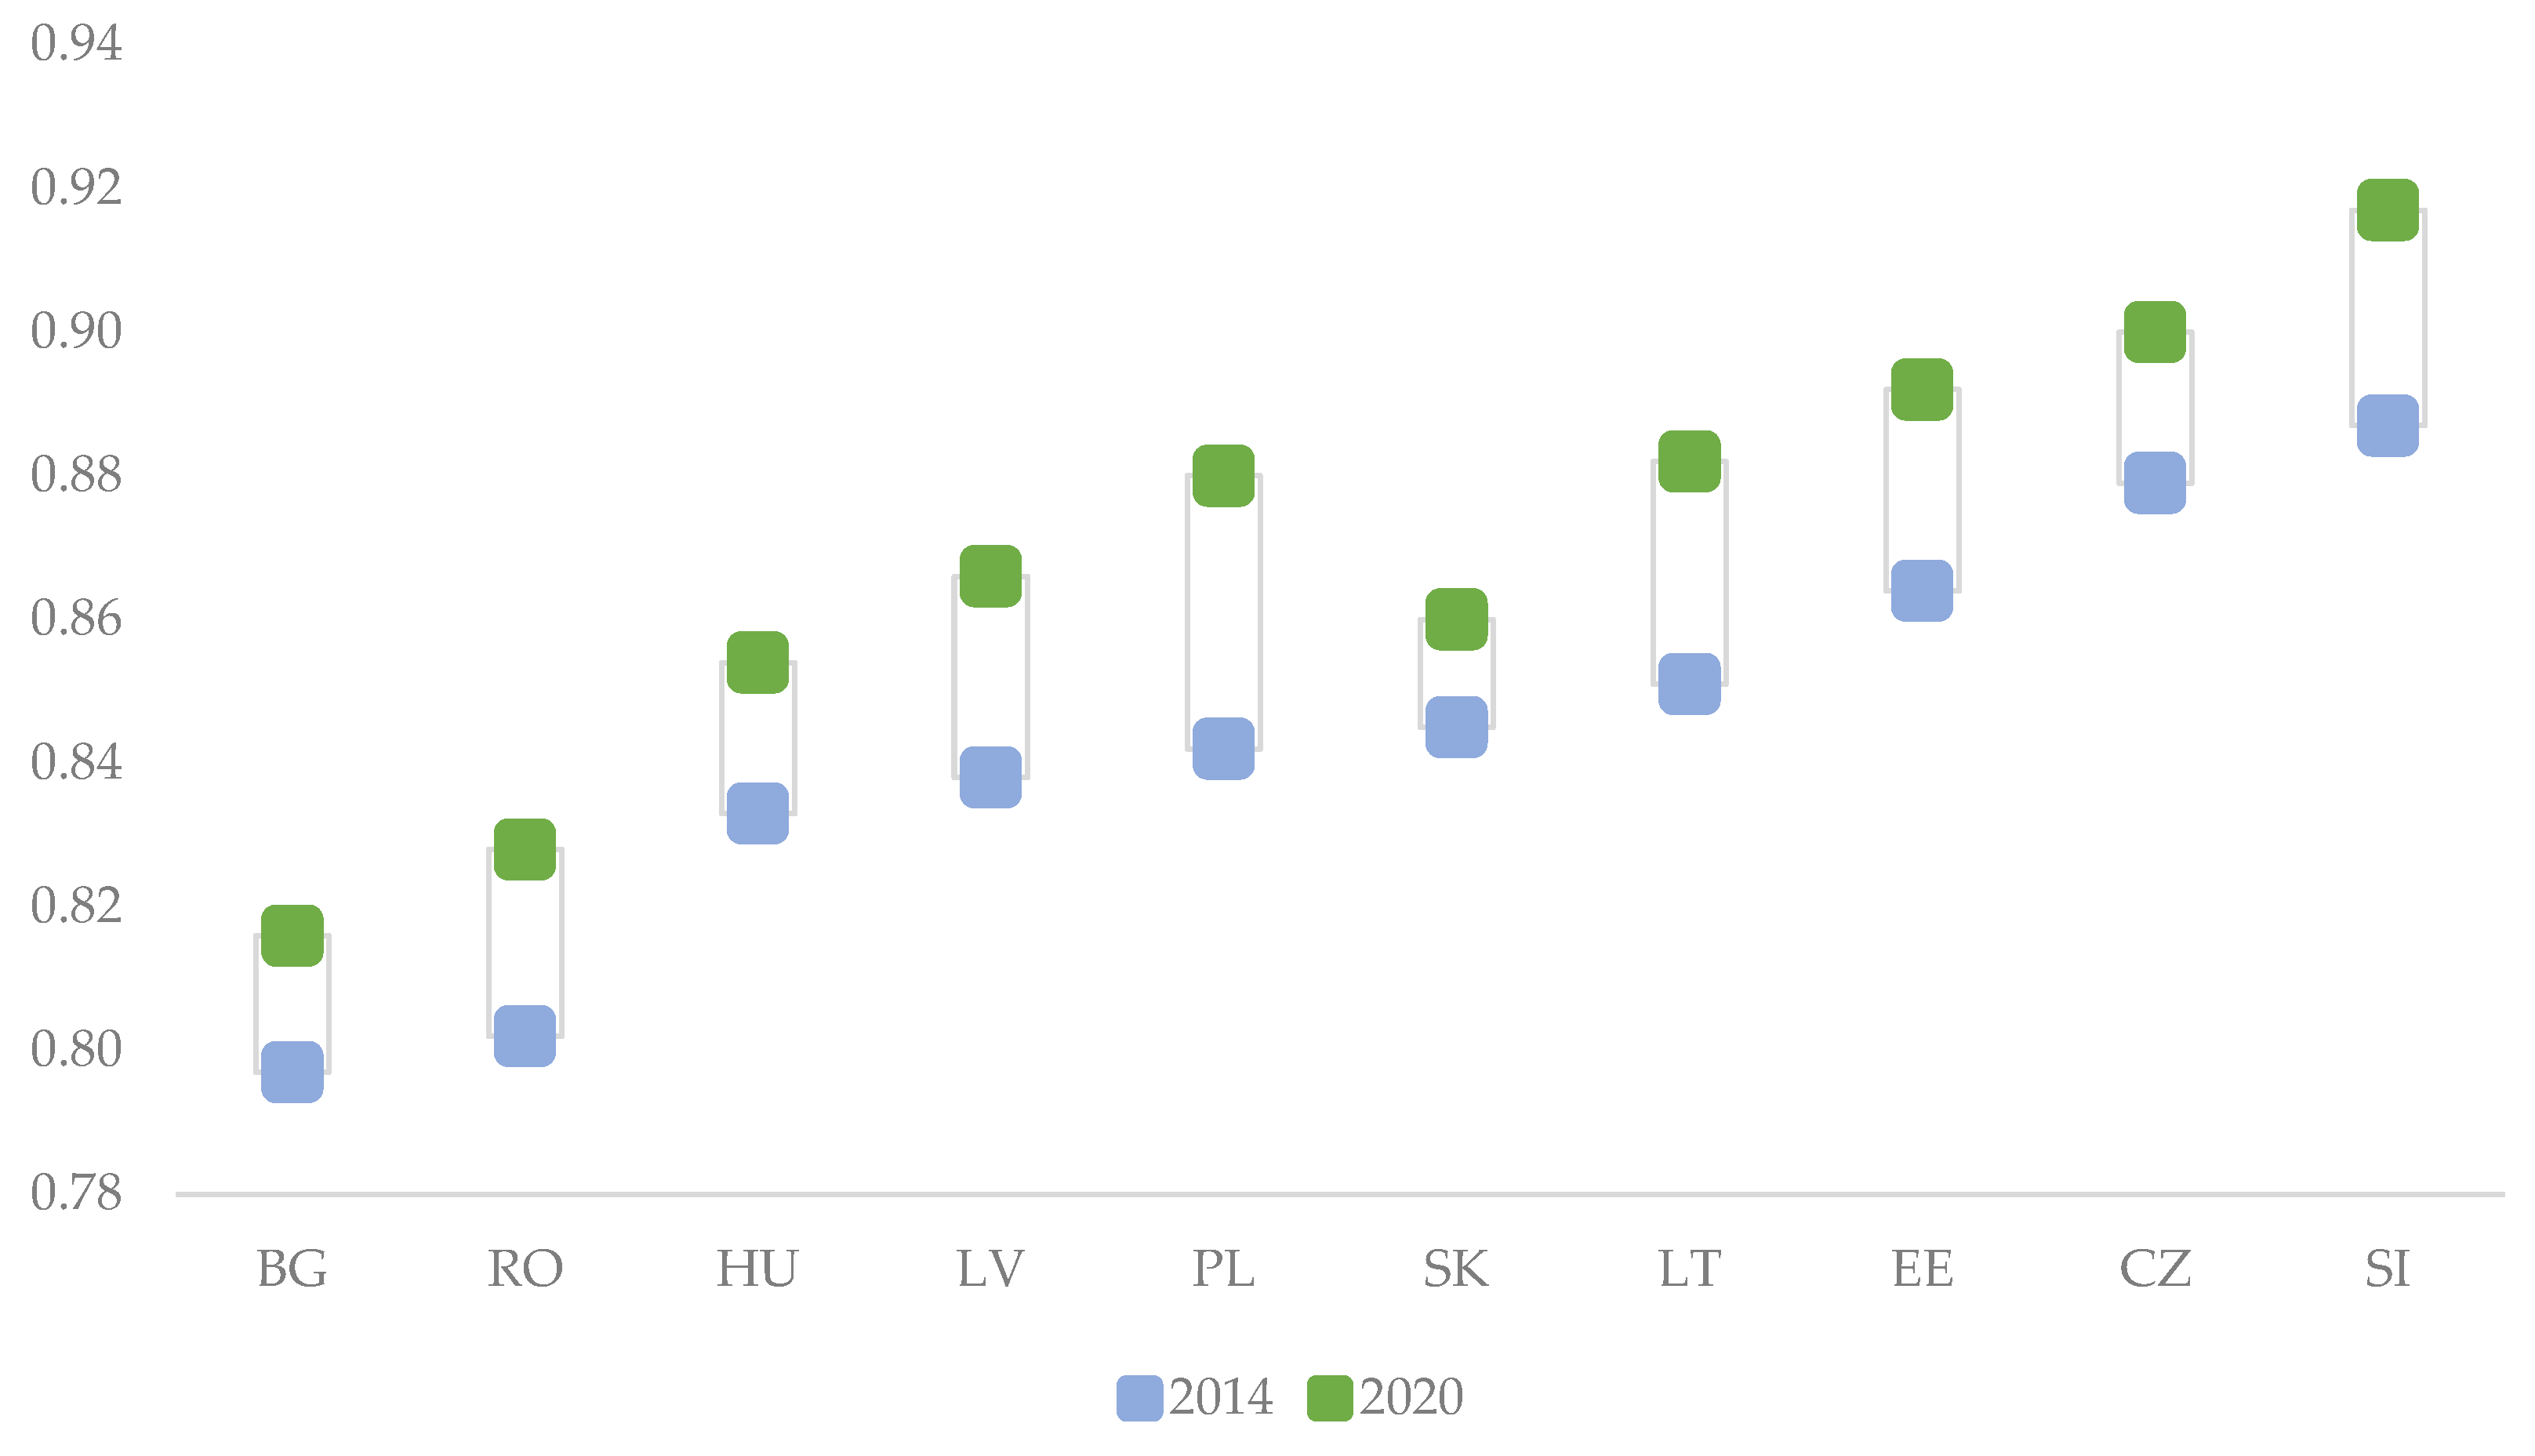
Regarding its evolution in the period 2014–2020, it can be observed that all CEE countries have registered progress, with the biggest jump being made by Poland. Poland also benefited from the largest amount of funding from cohesion funds during this period. We believe that the explanation for Poland’s progress can affect the effective use of cohesion funds.
According to
Figure 1, for Romania, the most recent HDI value is 0.828, a value that places Romania in the category of very high human development, being in 49th place out of the 189 countries for which the HDI is calculated.
The SPI was developed based on the theories of Amartya Sen, Douglass North and Joseph Stiglitz
3 and measures citizens’ quality of life and social well-being in 163 countries based on the analysis of 3 main dimensions consisting of 53 indicators. The methodology for its development consists of assigning a score for the items in the Basic Human Needs category (nutrition and basic health care, water and sanitation, shelter and personal safety), the Basic Well-being category (access to basic knowledge, access to information and communications, health and well-being, environmental quality), and the Opportunity category (personal rights, personal freedom and choice, inclusion, access to advanced education).
Going beyond GDP to reflect better societal development, the SPI 2020 shows that social disparities still vary widely between EU countries. Northern countries perform quite well, while Southeastern countries lag. Most EU regions perform well on Basic Human Needs such as nutrition and basic health care, water and sanitation, shelter and personal security.
Results vary regarding intermediate indicators of social development, such as access to basic knowledge, access to information and communication, health and well-being, and environmental quality. The biggest differences are related to indicators of opportunity, i.e., personal rights, personal freedom and choice, tolerance and inclusion, access to advanced education, and lifelong learning.
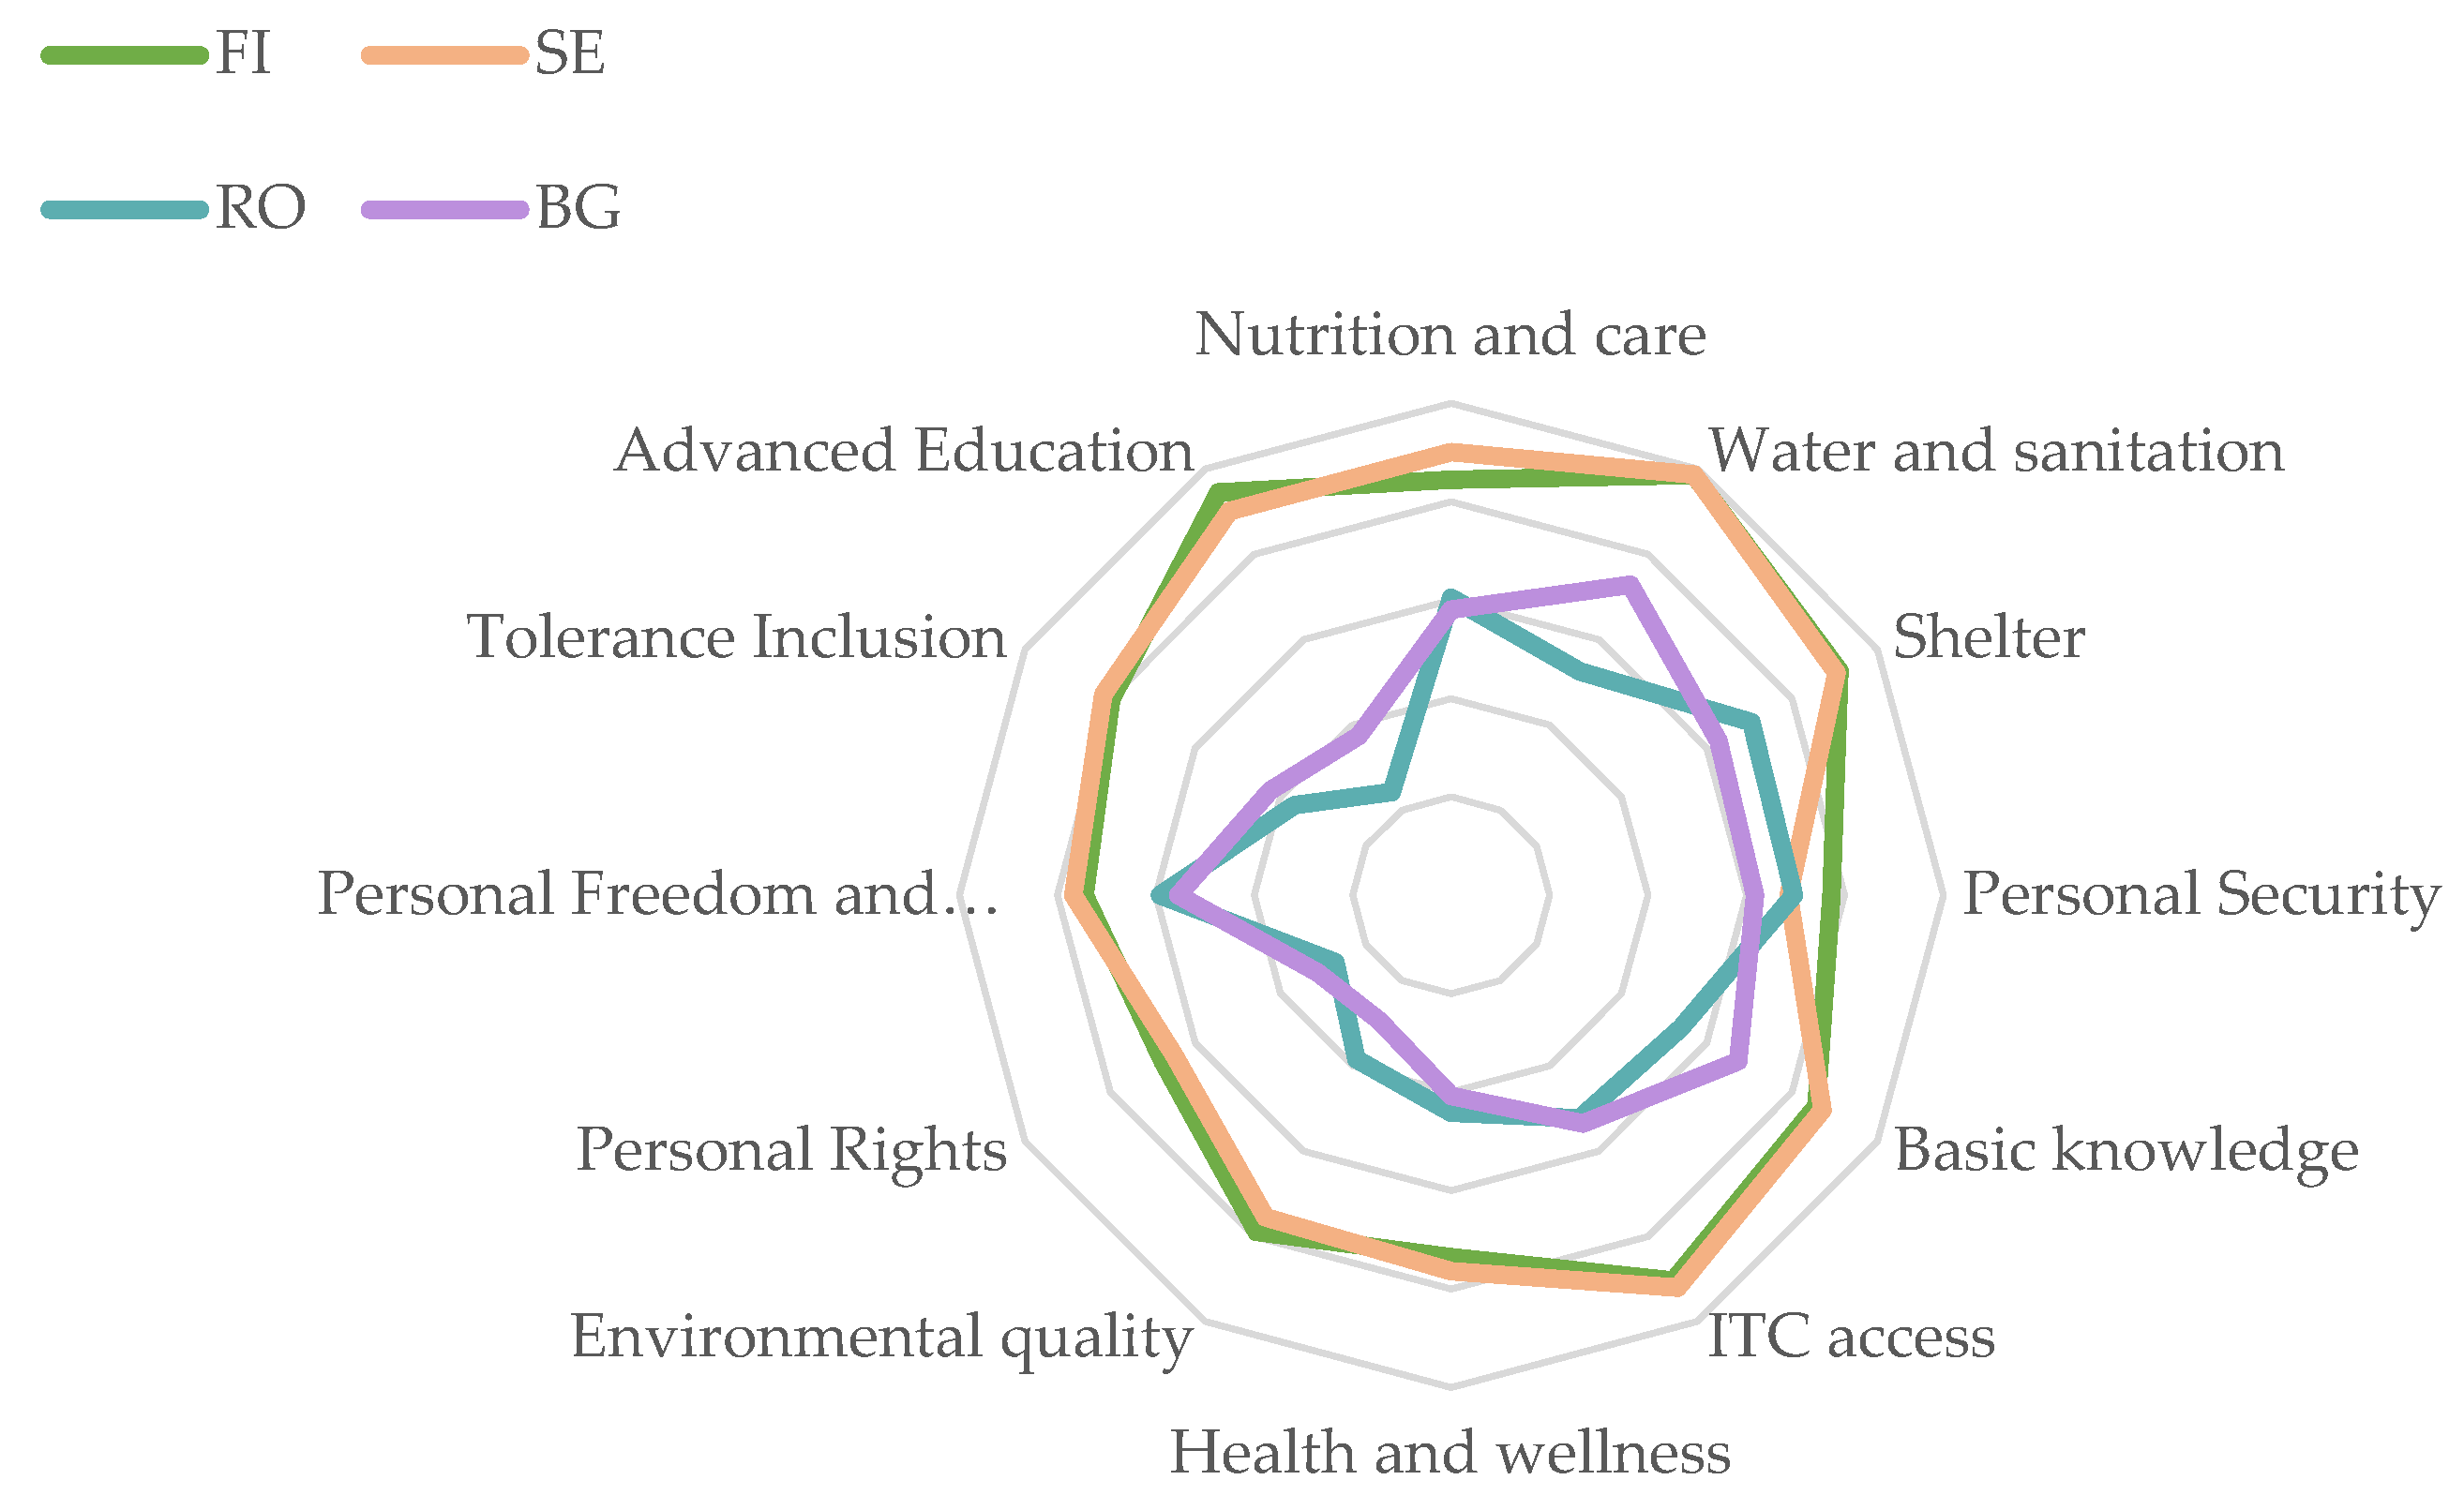
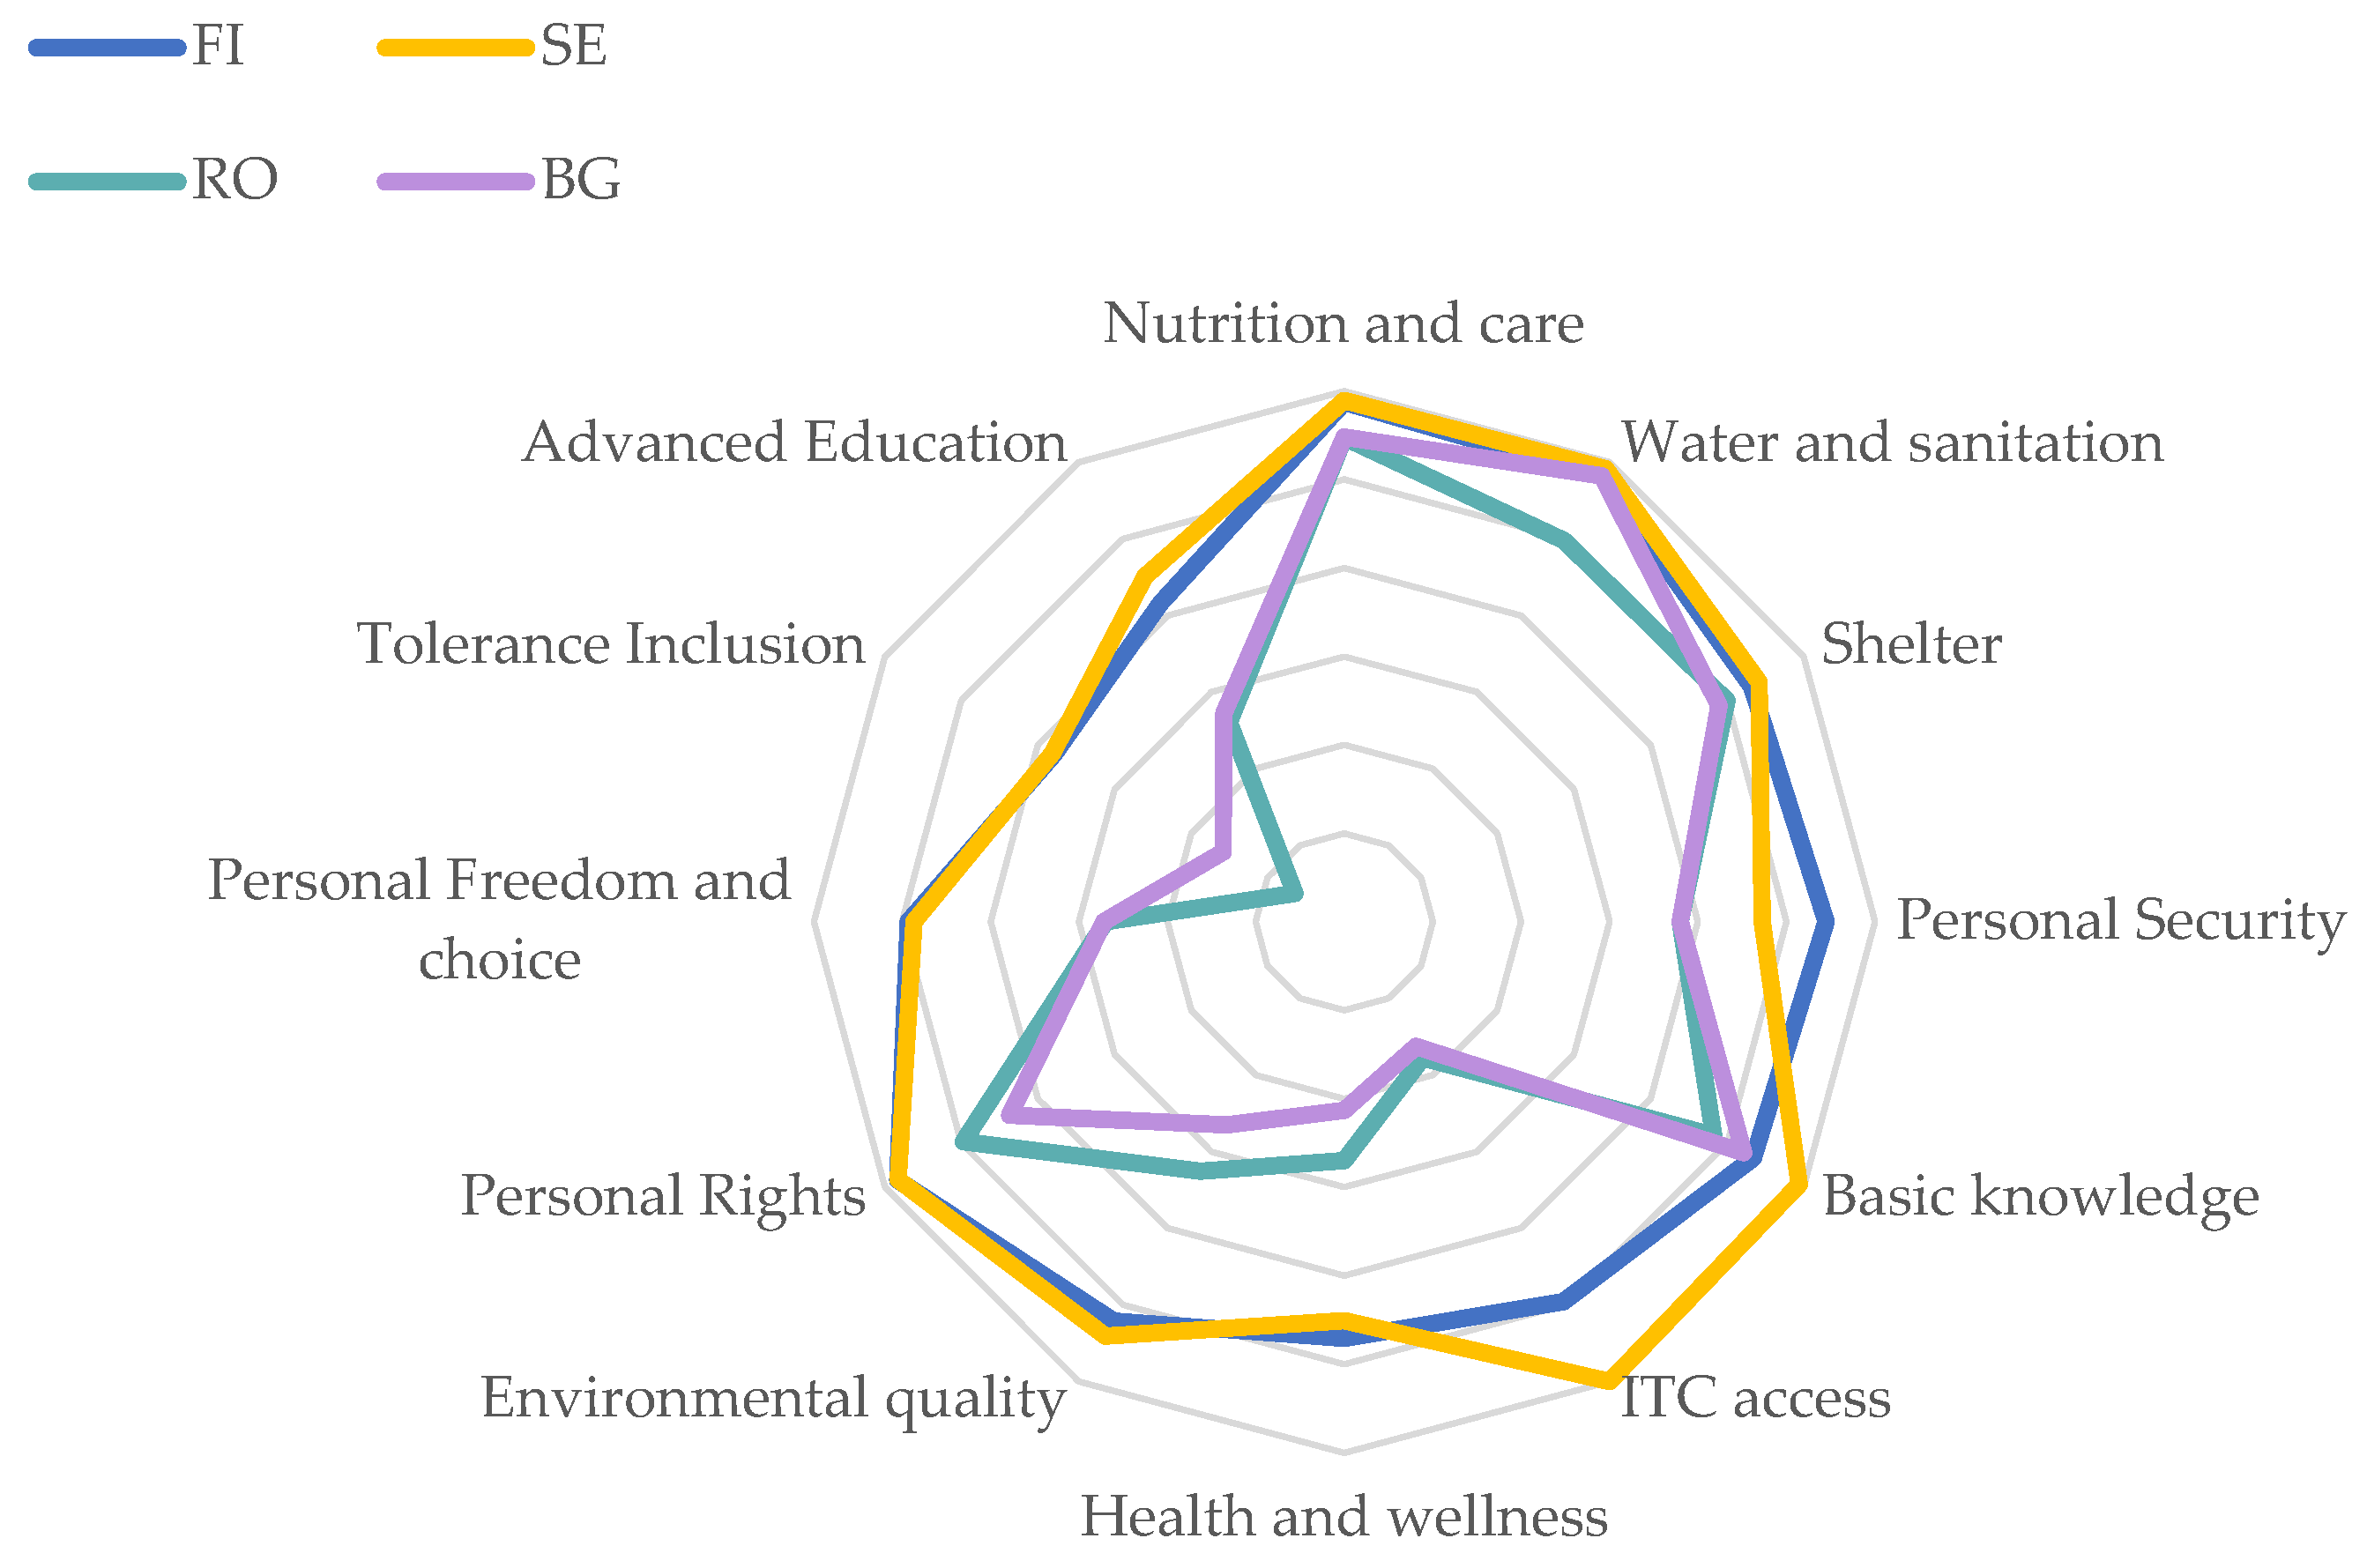
In
Figure 2, we analyzed the SPI at the national level, taking into account the two best-performing countries (Sweden—91.32 and Finland—92.11) and the two least-performing countries (Romania—77.67; Bulgaria—78.38) from EUR EU in terms of their SPI score for 2020. The Social Progress Index shows that countries with higher social progress have been more resilient to the wider social impact of the COVID-19 crisis. The pandemic has brought trauma and devastation to communities around the world beyond the number of illnesses and deaths. It has affected mental health, food security, education and more. According to data from the 2021 Social Progress Index Report, countries with higher social progress are also those that have been most resilient to the non-health stress caused by the pandemic. Higher levels of social progress across the board, not just investment in a particular area, can be an important factor in resisting the multidimensional effects of future shocks
4.
Regarding the evolution of the SPI for the analyzed period, some improvements can be observed for the least-performing countries analyzed in terms of access to basic knowledge, information and communications. Therefore, we can admit, ceteris paribus, that the absorption of cohesion funds positively influenced social progress, as measured by the SPI.
According to the latest SPI global data (
Figure 3), among the countries of Central and Eastern Europe, the best-performing country is Estonia, which ranks 21st globally, followed by the Czech Republic—22nd, Slovenia—26th, Lithuania—27th, Slovakia—33rd, Latvia—34th, Poland—35th, Croatia—36th, Hungary—42nd, Bulgaria—43rd, and Romania—44th.
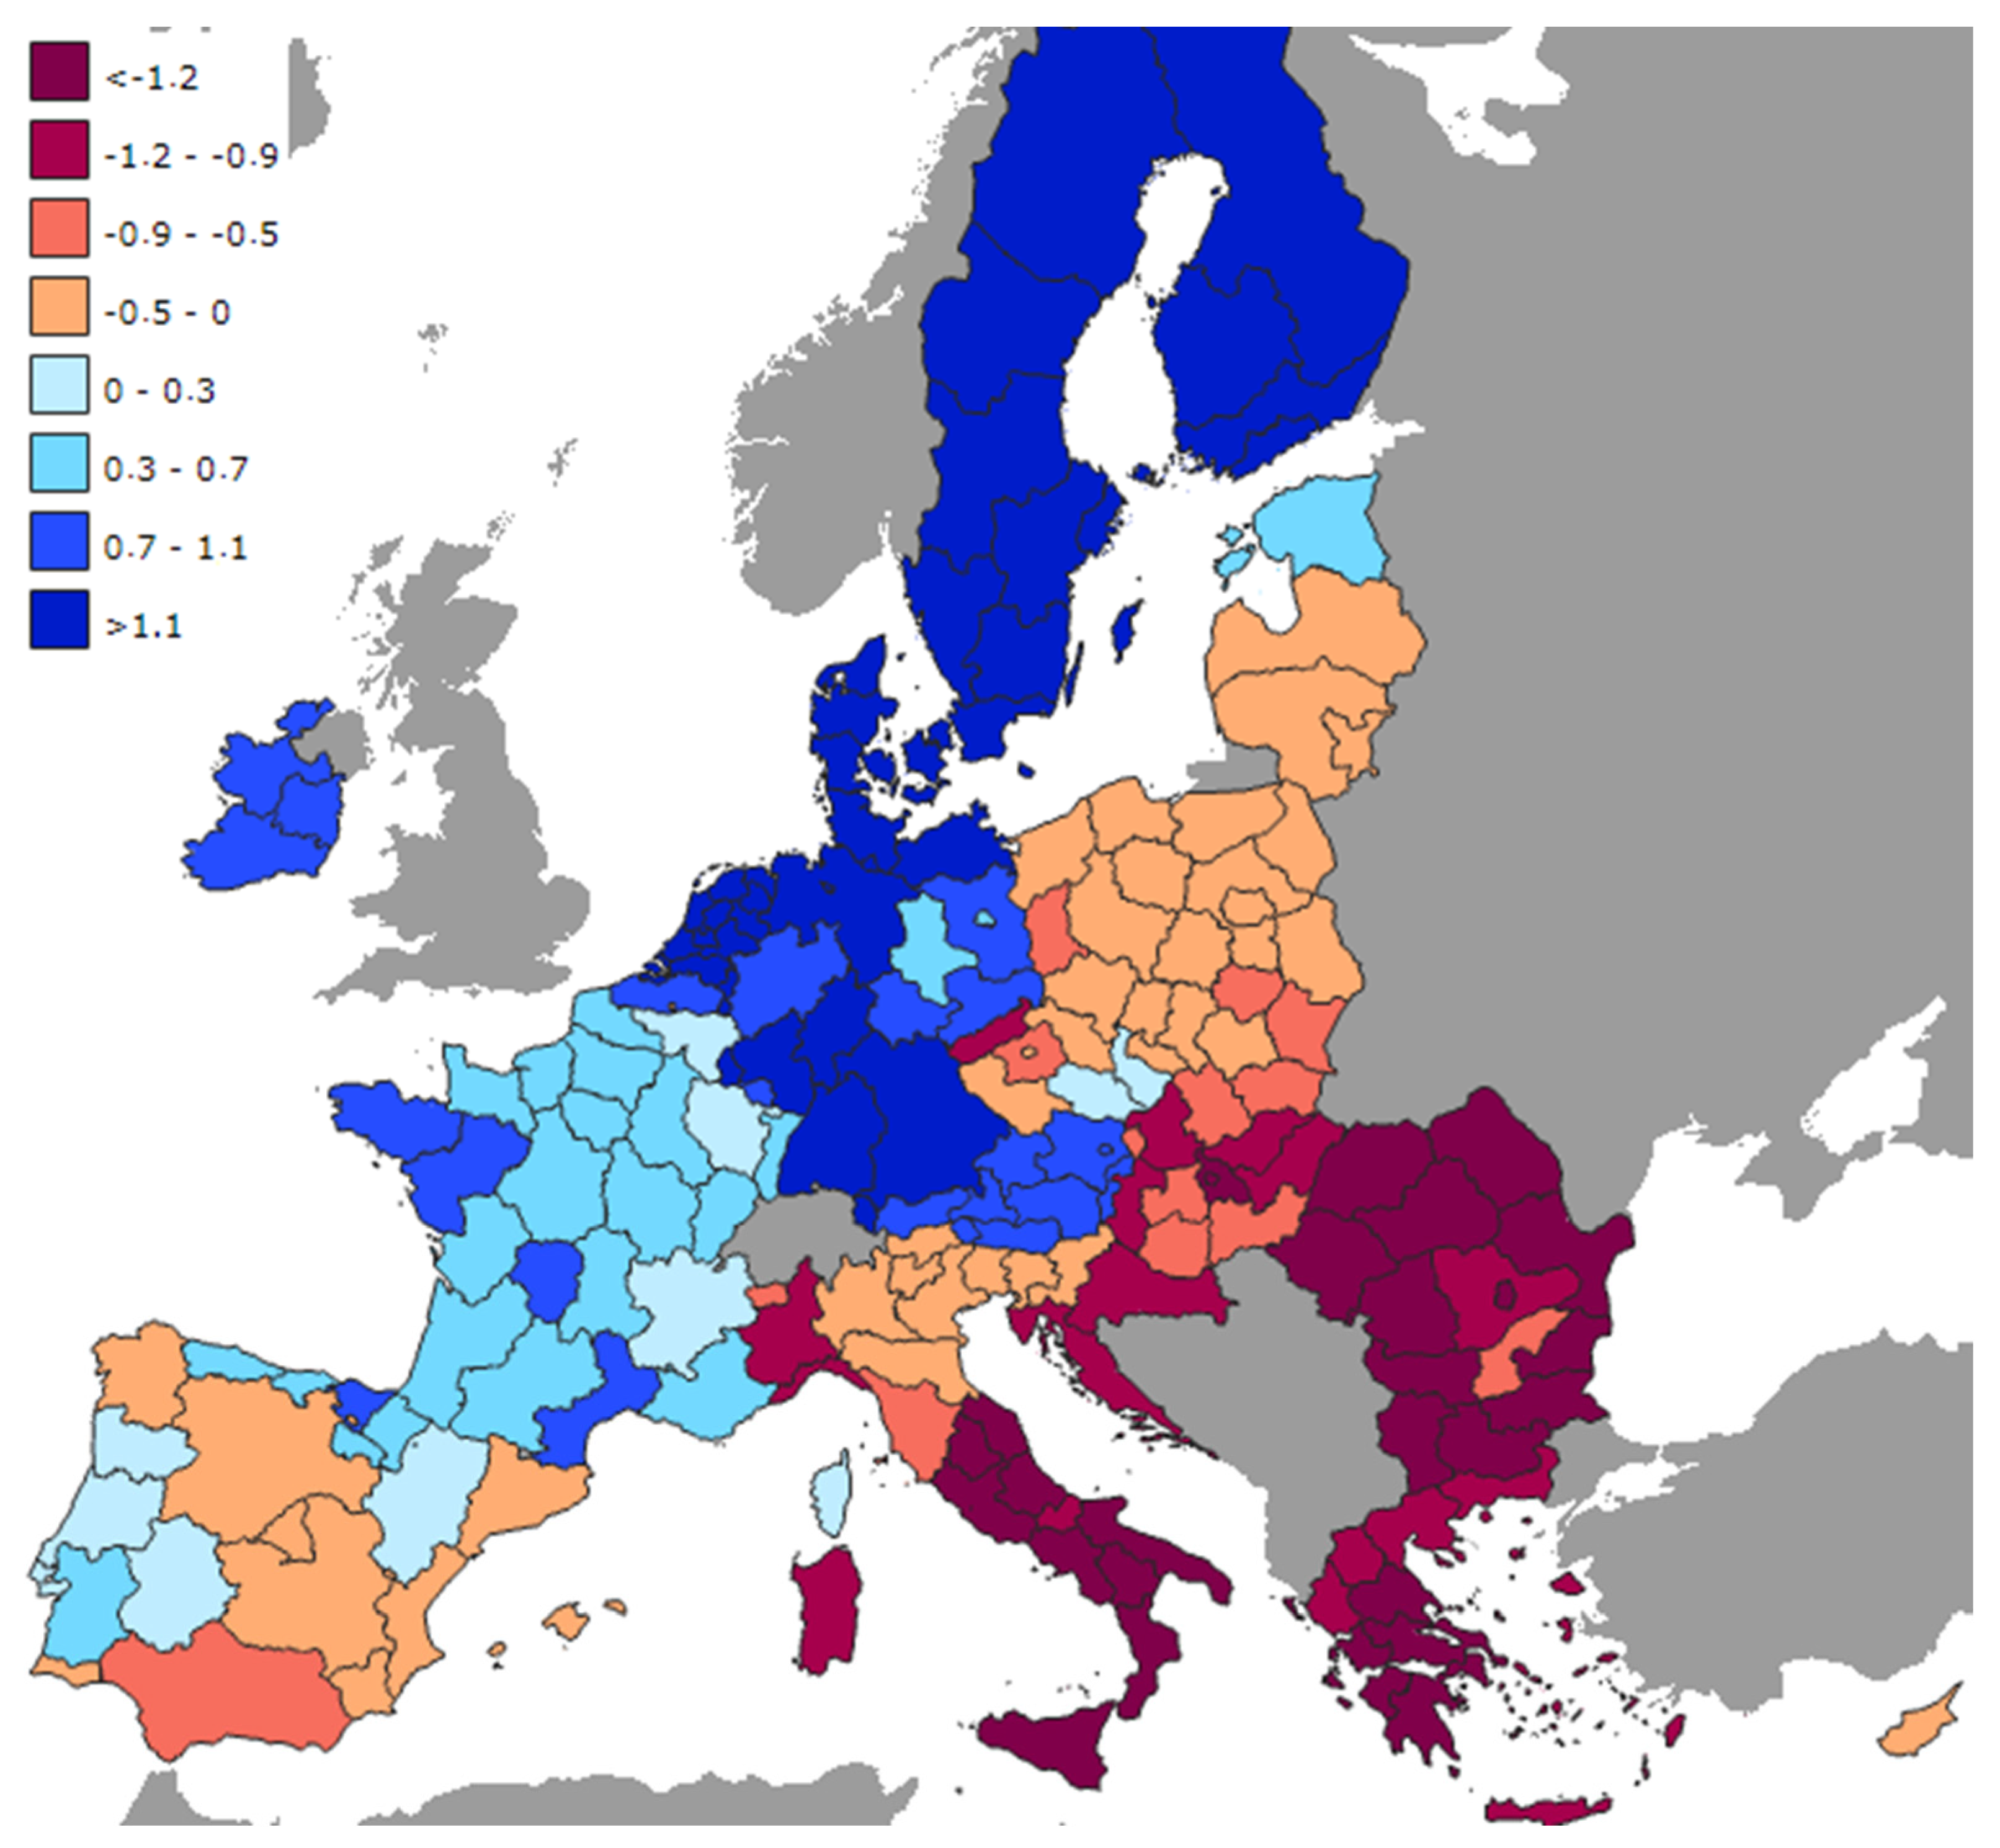
The EQI, as delineated by the European Commission, reflects citizens’ collective perceptions and encounters concerning corruption and the quality and fairness of pivotal public services—namely health, education, and law enforcement—within their residing regions. This index is constructed from the most expansive survey ever conducted to gauge the quality perception of governance within the EU. This monumental survey amassed insights and firsthand experiences in public health, education, and law enforcement from over 129,000 participants across 208 regions spanning all 27 EU Member States, assessed at either the NUTS1 or NUTS2 level. The survey’s inquiries are rooted in a comprehensive, multifaceted understanding of government quality, encompassing high standards of impartiality and public service delivery paired with minimal corruption.
Figure 4 provides an overview of the quality of public services in the EU regions, highlighting a segregation between South-East and North-West Europe that can be associated with the level of development of the regions as the South-East area is characterized by transition countries that are less developed. In contrast, the North-West area represents the hard core of the EU. The EQI level is of considerable importance in the context of the absorption and use of European funds, as a lower value of government quality can undermine the efficiency of the use of financial resources or even generate a deviation from the cohesion objective. The lower EQI values observed in the Southeastern regions, associated with transition countries, are supported by various studies, including those by
Acemoglu and Robinson (
2012), who emphasize the impact of governance quality on economic outcomes. Additionally, works by
Zaman and Georgescu (
2009),
Crescenzi and Giua (
2016), and
Calegari (
2020) reinforce the idea that government quality is instrumental in determining the success of regional development policies.
Furthermore, the discussion surrounding the segregation between South-East and North-West Europe is rooted in the historical context of EU expansion, with the Southeastern regions often facing challenges in catching up with their more developed counterparts. Empirical data from various studies, such as those by
Rodríguez-Pose and Hardy (
2015) and
Becker et al. (
2013), support the notion that the disparities in government quality contribute to variations in the absorption and effective utilization of European funds.
The future direction of the cohesion policy in 2021–2027 will focus mainly on the green and digital transition. The 2021–2027 multiannual financial framework was geared towards rapid recovery and resilience, strengthening convergence between EU regions, given the uneven territorial impact of the crisis. In this context, the legislative package on cohesion policy for the 2021–2027 programming period entered into force on July 1, 2021. The newly reformed rules were designed to increase the focus of cohesion policy on a “smarter” and “greener” Europe and to create favorable conditions for investment with simplified delivery mechanisms and closer links to structural reforms. Cohesion policy will thus contribute to implementing the EU political agenda, particularly promoting the green transition and digital transformation. The EU has committed to becoming the world’s first climate-neutral bloc by 2050. A Just Transition Fund has been set up under cohesion policy to ensure that the transition to a climate-neutral economy equitably takes place, leaving no region behind.
4.2. Evaluation of the Impact of Cohesion Policy Instruments on the Economic and Social Performance of CEE Countries
Different specifications have been tested in terms of components and total value to assess the impact of cohesion policy on economic growth and social progress. In every one of the ten models evaluated, we employed the Hausman test to determine the nature of the effects (be it fixed or random). The outcomes consistently pointed to the existence of random effects across all models. Additionally, even though the models were deemed valid, adjustments were made to account for heteroscedasticity.
In the case of economic growth, the empirical results highlighted in all four analyzed models the positive and significant impact of the investments of the funds specific to the cohesion policy (ERDF, CF and ESF) on economic growth, both in terms of components and in total value (
Appendix B,
Table A2).
Thus, if we refer to the total investment of cohesion policy funds per inhabitant, an increase in this indicator by 1% leads to an increase in economic performance, ceteris paribus, by 0.05%. CF investments have the most pronounced impact in terms of investment type, they lead to an increase in economic performance, ceteris paribus, by 0.04%.
The positive coefficients associated with the specific funds highlight the importance of European funds in driving regional economic growth. This implies that the strategic allocation of these funds can foster positive economic outcomes for regions that receive them. Each fund had a distinct impact on economic growth, as evidenced by the varying coefficients across models. This suggests that while all funds contribute positively, they have different areas of focus or effectiveness. While the ERDF primarily focuses on economic and social cohesion by correcting regional imbalances, the CF targets environmental and trans-European transport infrastructure in countries with a lower GDP.
Given that specific funds like the ERDF support regions with natural handicaps or those that are demographically disadvantaged, the positive impact on real GDP per capita underscores the importance of such funds in bridging regional disparities and ensuring more equitable growth across regions.
The positive impact of these funds on GDP per capita might reinforce the need for policymakers to continue prioritizing them. Moreover, understanding which funds have the most significant impact can guide future budgetary allocations. While the funds have a positive impact, the magnitude of the impact depends on how efficiently these funds are utilized. Efficient project implementation and fund utilization can maximize the economic benefits.
In essence, the observed positive impacts of specific European funds on real GDP per capita stress the pivotal role these funds play in regional economic development. It emphasizes the need for continued investment, effective utilization, and strategic allocation to maximize the desired economic outcomes.
The initial GDP per capita (from the previous period) has a positive and statistically significant impact on the current real GDP per capita. A 1% increase in the initial GDP per capita leads to increases in the current real GDP per capita, ranging from 0.34% to 0.4% across models. This suggests that regions with a higher initial GDP maintain economic strength over time.
The EQI has a consistently positive and statistically significant effect on the Real GDP per capita across all models. The influence of EQI ranges from 0.13% to 0.18% for a unit increase, highlighting the importance of governance quality in positively influencing economic performance. Higher values of the EQI, indicating better governance and public service delivery, are associated with higher real GDP per capita.
In summary, as measured by the EQI, good governance quality and investments from various European funds, especially when initiated in the previous period, have a positive and significant impact on the economic performance of regions. This highlights the importance of effective governance and strategic investment in economic growth.
In terms of capturing the impact of the ESIF (European Structural and Investment Fund) investments on social progress, the empirical results revealed a positive and statistically significant impact that was preserved in all four models (both in total and by components of ESIF investments). The greatest impact on social progress was manifested by CF investment, ceteris paribus. The results indicate that the investments made by the ESIF positively influence social progress in the regions. This means that as the funding from the ESIF increases or is efficiently utilized, there is a consequent improvement in social indicators like education, health, equality, and overall well-being. The statement emphasizes that this positive effect is consistent across all four models they analyzed. Whether looking at the total investments or breaking them down into specific components, the positive relationship holds. This consistency reinforces the reliability of the findings. Among the ESIF components, the CF has the most pronounced positive effect on social progress. This might be because the CF specifically targets areas like environmental projects and trans-European transport networks, which can have direct or trickle-down effects on the populace’s well-being.
Also, the initial value of real GDP/capita and the EQI value showed the same positive and statistically significant impact. So, the regions that registered a good economic start and benefited from high-quality institutions achieved increased social progress.
Regions that began the period with a higher GDP per capita (a general measure of economic well-being) also saw greater social progress. This suggests a positive feedback loop where regions with a good economic base can better leverage ESIF investments to further social advancement.
The quality of institutions, as measured by the EQI, also played a significant role. Regions with better governance, lower corruption, and higher quality public services (like health, education, and law enforcement) were more successful in translating ESIF investments into social progress. Good governance can ensure the efficient and effective use of funds, leading to tangible improvements in the lives of the citizens.
The findings underscore the importance of financial investments from funds like the ESIF and foundational factors like initial economic conditions and institutional quality in driving regional social progress.
This research conducted a thorough robustness assessment, further probing the effects of ESIF investments on the various facets of the social progress indicator (as seen in
Table A3,
Appendix C). The empirical results demonstrating a positive and significant influence on Basic Human Needs and Fundamental Well-being underscore the effectiveness of cohesion policies in enhancing aspects such as healthcare, education, and environmental quality, which are essential for the foundational welfare of individuals in CEE nations. Also, this positive impact reflects the direct benefits individuals in CEE regions experience in their daily lives, such as better access to basic services and improved living conditions, validating the targeted approach of cohesion policies towards addressing fundamental human necessities.
However, the lack of a significant impact on the Opportunities segment of the SPI, particularly in areas related to access to higher education and information technology, points to a potential disconnect between the economic growth facilitated by cohesion policies and the translation of this growth into real opportunities for individuals, especially in terms of advancing equity and reducing income disparities.
The consistently lower scoring of CEE nations in the SPI’s Opportunities dimension highlights a critical area for policy improvement, suggesting that while basic needs and well-being are being addressed, the policies are less effective in creating environments where individuals can capitalize on economic growth to improve their personal and professional prospects. This gap in policy impact, especially in the realm of reducing income inequality and tackling poverty, calls for a re-evaluation of the current policy frameworks and strategies, emphasizing the need to not only foster economic growth but to also ensure that such growth translates into equitable opportunities and tangible benefits for all segments of society, particularly the most vulnerable.
This observation echoes Atkinson’s assertion (
Atkinson 2015) that disparities in outcomes observed today pave the way for unequal opportunities in the future. This concept is particularly relevant in the context of income inequality and poverty. When current disparities in income and wealth are not addressed, they perpetuate a cycle of poverty and limit opportunities for upward social mobility for future generations. Therefore, the focus on enhancing interventions in the Opportunities sector of the SPI is crucial. By actively reducing income disparities and improving access to education, technology, and fair employment, we can create a more equitable foundation that supports the well-being and socio-economic advancement of upcoming generations. This approach is not just about reducing present inequalities; it is a strategic investment in preventing the entrenchment of poverty and ensuring fairer, more equitable opportunities for all, thereby breaking the cycle of poverty and income inequality that can otherwise persist across generations.
5. Discussions and Policy Implications
While evaluating the effects of cohesion policy is complex due to its multidimensional nature, targeting both economic and social goals, it is crucial to note that these varied interventions have historically emphasized economic development over direct social impacts, particularly in addressing income inequality and poverty. The challenge lies in distinguishing the nuanced effects on social outcomes, such as reducing income disparities and enhancing social welfare, often overshadowed by the primary focus on economic indicators like GDP.
Our study’s alignment with the literature, such as
Farrell (
2004) and
Lolos (
2009), confirming positive economic impacts, also highlights a need to deepen the understanding of how these economic benefits translate into tangible social progress. While economic development is a positive outcome, its success should also be measured by its ability to alleviate poverty and improve income equality. As with the study by
Maucorps et al. (
2020), our results, which took into account the impact of the three funds specific to the cohesion policy on economic development reflected through GDP per capita at the regional level (NUTS2) (elements that were taken into account in both studies), identify a positive impact.
Regarding the impact of cohesion policy on social progress, our study identified a positive impact on the aggregate SPI and the two pillars of the SPI (Basic Human Needs and Basic Well-being). Still, for the countries considered (CEE), an impact on the Opportunities pillar was not identified. This gap is particularly critical when considering income inequality and poverty, as the Opportunities pillar directly relates to aspects like access to higher education and personal rights, which are key in breaking the cycle of poverty and ensuring equitable growth.
It is difficult to compare the results with other studies as the literature relating to the impact on the SPI is limited. However, some studies have considered some of the variables included in the SPI. Most of the literature related to the impact of European funds on the employment rate (
Becker et al. 2010;
Rodríguez Pose and Novak 2013;
Giua 2017;
Fiaschi et al. 2018;
Crescenzi and Giua 2018;
Crescenzi and Giua 2020) predominantly identify a positive impact, considering that European funds contribute to increasing the employment rate. Other social aspects that the researchers focused on were the level of education and the modified version of the adapted human development index (
Calegari 2020), where a positive impact was also identified.
Therefore, the consistent positive impact associated with cohesion policy on economic growth emphasizes the crucial role of this policy in fostering regional development. Both economic growth and social progress have benefited from the funds, implying that well-structured policy interventions can produce positive outcomes in these areas.
Regarding the impact on economic growth and social outcomes, this study confirms a positive correlation between the EU’s cohesion policy and economic growth in CEE countries, aligning with the existing literature, such as
Farrell (
2004) and
Lolos (
2009). However, when it comes to the policy’s impact on social outcomes, particularly in reducing poverty and income disparity, the findings reveal a more complex scenario. While there is a positive impact on the aggregate Social Progress Index (SPI) and its components of Basic Human Needs and Well-being, the gap in the Opportunities pillar suggests that the policy’s effectiveness in addressing deeper social inequities needs more focus.
In terms of the correlation between policy implementation and regional improvements, the empirical results indicate that regions with a stronger economic foundation (higher initial GDP per capita) tend to leverage the benefits of cohesion funds more effectively, thereby amplifying their economic and social gains. This finding underscores the need for quality governance and efficient institutions, which are essential for optimizing fund utilization.
Concerning the time-lagged nature of policy impact, this study suggests that the impact of cohesion policy on social progress, especially in terms of improving personal rights and access to higher education, is not immediate but evolves over time. This highlights the need for a long-term strategic vision in policy implementation and assessment.
The CF significantly impacts economic performance among the funds examined. This underscores the CF’s pivotal role in addressing disparities and promoting convergence among EU regions, especially in environmental projects and trans-European transport networks.
Regions with a good economic start (higher initial GDP per capita) tend to maintain and amplify their economic strengths. Further, the consistent positive impact of the EQI underscores the importance of quality governance in driving economic outcomes. Efficient institutions that maintain low corruption levels and provide high-quality public services pave the way for the better utilization of funds and stronger economic growth.
The results indicate that regions effectively utilizing ESIF investments witness marked social progress. A holistic approach, combining financial investments from funds like ESIF with a solid initial economic base and high institutional quality, can catalyze substantial social advancements.
The research findings carry substantial significance for shaping the trajectories of social and economic progress in CEE economies. By confirming the consistent positive impact of EU cohesion policy on economic growth in the region, this study underscores the pivotal role of targeted interventions and continued support in fostering regional development. This insight is particularly crucial for policymakers as it provides evidence of the effectiveness of cohesion policy in narrowing economic disparities and promoting overall economic advancement in CEE countries.
The research shows a gap in the Opportunities segment of the social progress indicator for CEE countries. This suggests a need for targeted interventions in these regions, particularly focusing on personal rights, electoral choices, tolerance, and access to higher education. As emphasized by Atkinson’s observation (
Atkinson 2015), addressing today’s inequalities is crucial for ensuring equal opportunities for future generations.
Taking into account the results of the study, we consider it important that, for CEE countries and regions, the following aspects are taken into account in the management of the cohesion policy:
Increase Absorption of European Funds for Economic and Social Welfare: This research emphasizes the need for greater efforts to increase the absorption degree of European funds. This recommendation aligns with the findings that regions effectively utilizing ESIF allocations witness marked social progress. The suggestion to augment absorption aims to leverage these funds more effectively to contribute to both economic development and social welfare.
Enhance Institutional Quality and Transparency: The study acknowledges the positive impact of efficient institutions on economic outcomes. Therefore, the recommendation to focus on measures and reforms to enhance institutional quality aligns with the research findings. It emphasizes the importance of quality governance in driving economic growth and ensuring better utilization of funds.
Streamline Bureaucratic Procedures: The suggestion to streamline public administration processes and reduce bureaucratic barriers resonates with the research findings calling for de-bureaucratization. Simplifying access to European funds can facilitate their efficient utilization, which, as the research indicates, contributes to regional economic and social progress.
Concentrate Investments in Social Areas with Poor Infrastructure: The research highlights a gap in the Opportunities segment of the SPI for CEE countries, particularly in areas like access to higher education and personal rights. The recommendation to concentrate investments in social areas with poor infrastructure aligns with this finding, aiming to reduce regional economic and social discrepancies and ultimately promote increased cohesion.
Targeted Interventions to Address Inequalities: The research underscores the need for targeted interventions in specific aspects such as personal rights, tolerance, and access to higher education. The policy recommendation advocating for a more nuanced approach to cohesion policy in CEE countries aligns with the findings, emphasizing the necessity of targeted interventions to directly address social disparities and ensure equal opportunities.
Given these findings, our research advocates for a more nuanced approach to cohesion policy in CEE countries, emphasizing the need for targeted interventions that boost economic development and directly address social disparities. This includes improving institutional quality and transparency, reducing bureaucratic barriers to fund access, and prioritizing investments in social infrastructure. Such a comprehensive strategy is essential for bridging economic and social gaps, leading to a more cohesive society where economic growth translates into reduced poverty and greater income equality.
6. General Conclusions
The empirical analysis supports the notion that well-structured EU cohesion policy interventions can produce positive outcomes in both economic and social domains. The significant impact of funds like the European Regional Development Fund (ERDF) on regional economic performance points to their crucial role in promoting convergence and addressing disparities, particularly in environmental and transport projects.
From this study’s analysis, it is evident that cohesion policy positively influences both economic growth and social progress. However, it is crucial to acknowledge that the impacts of this policy are gradual, often manifesting over several years. Investments like creating new job opportunities take time to generate economic benefits, and their effectiveness is closely tied to addressing income inequality and poverty reduction.
To maximize the benefits of cohesion policy, policymakers should consider strategic allocations, emphasizing funds that have shown pronounced impacts, like the CF, which has shown considerable potential in promoting regional development, including reducing the risk of poverty.
However, this study also identifies a notable gap in the Opportunities segment of the SPI for CEE countries. This gap is critical as it directly relates to aspects such as access to higher education and personal rights, which are vital for breaking the cycle of poverty and ensuring equitable growth. Addressing this gap requires targeted interventions focusing on enhancing personal rights, electoral choices, tolerance, and access to higher education.
Further, addressing the gap in the Opportunities dimension within CEE countries is essential. This is not just about economic development but also about ensuring equitable access to opportunities, which is crucial for long-term poverty alleviation and narrowing income gaps. The findings highlight the need for a cohesive approach, combining strategic financial investments with solid economic fundamentals and effective governance, to ensure regional development, social equity, and reduced income disparities.
Regarding research limitations, one of the foremost challenges faced during the research was the accessibility and completeness of data. Both data sets related to the cohesion funds and social indicators were limited. Also, the limited number of existing studies exploring the social impact of cohesion funds is a significant constraint that curtails the ability to juxtapose current research findings with previous work. The time it takes for the effects of the cohesion funds to become visible can be prolonged. Determining this lag between investment and observable impact can be complex, especially when it intertwines with other external factors. This makes attributing specific outcomes to cohesion funds difficult without considering potential interactions with other initiatives.
The research findings have substantial implications for policymakers, highlighting the effectiveness of cohesion policy in narrowing economic disparities and promoting overall economic advancement in CEE countries. However, they also call for an enhanced focus on social dimensions, particularly in areas where progress has been limited.
In conclusion, our study reinforces the importance of a comprehensive approach to assessing cohesion policy, one that goes beyond traditional economic metrics to include a broader spectrum of social indicators. This approach is vital for accurately gauging the policy’s impact and for informing future policy decisions aimed at promoting balanced and inclusive growth across the CEE region.
As future directions of research, given the European Commission’s efforts to simplify the cohesion policy, it would be valuable to investigate the impacts of such simplifications. Specifically, examining the consequences of reducing the number of objectives and focusing on digitization and greening can provide insights into the policy’s efficacy under this streamlined approach.
Investigating the relationship between administrative capacity and the efficiency of fund utilization is also crucial, particularly in how it relates to the equitable distribution of economic gains and poverty reduction.
Given that the quality of institutions plays a pivotal role in the effective use of financial resources and in addressing inequalities, future research can explore strategies to bolster institutional quality.
Another research direction, given the importance of the Opportunities pillar in reducing income inequalities, is for researchers to focus on understanding its components better. For instance, which aspects of “Opportunities” (like access to advanced education or respect for personal rights) have the most pronounced effect on income inequalities? Such insights can guide targeted interventions.
This study has hinted at the potential of cohesion policies to address income inequalities for future generations. A logical extension would be to analyze the long-term impact of these policies on income distribution.


