1. Introduction
Climate change has emerged as one of the most pressing challenges of this century (
Steffen et al. 2020;
Štreimikienė 2021). In recent years, climate change has posed unprecedented threats in terms of economic and human life losses (
Mumtaz 2018). Various governance and institutional-arrangement initiatives have been launched on local to global scales, and many actions are still being proposed to address the threat of climate change (
Bisaro et al. 2018;
Buchner et al. 2021;
Mahat et al. 2019;
Mumtaz 2021;
Persson 2019). However, dealing with climate change is a complex phenomenon that requires innovative and proactive measures. Climate change is a global issue, and it needs global action (
Bellezoni et al. 2022;
Farazmand 2023;
UNICEF 2020). Countries around the world, particularly developing countries, are struggling to manage the effects of climate change. At the international level, international frameworks and legal obligations have been established to face the common threat of climate change.
For instance, since the enactment of the Paris Agreement (PA), governments of various countries have committed to minimizing greenhouse gas (GHG) emissions responsible for rising global temperatures. The PA emphasizes that developed countries should provide financial support, hereafter referred to as climate finance, to enable developing economies to adapt to and mitigate the adverse impacts of the changing climate (
Chowdhury and Jomo 2022;
Khalatur and Dubovych 2022;
Pauw 2017;
Puig et al. 2016;
Weiler et al. 2018). While countries have, under the ambit of the PA, embarked on developing and putting in place frameworks to enable the transition to a zero-emissions society, there is no empirical evidence to serve as a benchmark (
CAT 2022;
Duwe et al. 2017). As an example of the commitments within the PA framework, a loss and damage fund was recently created to compensate developing and vulnerable nations that are severely impacted due to the changing climatic conditions (
Dahiya and Okitasari 2022;
Serdeczny and Lissner 2023;
Wyns 2023).
Buchner et al. (
2021) and the database of the Organization for Economic Cooperation and Development’s (OECD) Development Assistance Committee (DAC) indicate that, on average, over USD 5193 million was spent on climate-related development commitments between 2015 and 2020. Although the mutually agreed-upon climate change goals need an annual increase in climate finance of at least 590% by 2030 (
Lyeonov et al. 2023), there is limited evidence on how a country’s governance framework influences climate financing (
Meadowcroft 2010). Understanding how a country is governed is important, especially since several countries have been updating their respective climate change targets; i.e., nationally determined contributions (NDCs). For the most recent NDC updates in 2022, only Australia submitted a stronger NDC target when compared to the 2020/2021 updates, while Brazil, India, and Egypt did not increase their respective ambitions (
CAT 2023). Countries that did not increase their ambitions are defined by the Climate Action Tracker (
CAT 2023) as those whose NDC updates either did not increase at all, increased by only a marginal amount, or may appear strong on paper but will not drive additional reductions because current policies are already below the target level. Although
Isopi and Mavrotas (
2009) reckon that donor motivations for financial aid can be both self-serving and charitable, it is clear from the wide-ranging empirical studies focusing on factors influencing financial aid allocation that donors prioritize their political, economic, and strategic goals when allocating help across national borders (for example, see
Canavire et al. (
2006),
Gilder andRumble (
2020), and
McGillivray (
2004), among others).
In this article, we assess the relationship between the amount of climate finance received and institutional governance indicators in countries that submitted stronger NDC targets compared to countries that did not increase their NDCs.
Amran et al. (
2016) argue that institutional governance is fundamental in influencing the ability of governments, industries, and enterprises to adapt and modify their actions in response to climate change-related issues. Various institutional governance indicators influence climate financing in different ways, including by affecting institutional frameworks and policy formulations, spurring adaptation and mitigation capacities, and impacting the pace of adaptation and mitigation. This work contributes to the limited literature on the factors influencing climate finance flows, which are a form of official development assistance (ODA), as indicated by
Han and Cheng (
2023). Despite the fast-growing empirical literature on determinants of financial aid to developing countries, most of the analysis considers institutional governance indicators in isolation (e.g., for the corruption indicator, see
Acht et al. (
2015);
Alesina and Dollar (
2000);
Canavire et al. (
2006);
Isopi and Mavrotas (
2009);
Lyeonov et al. (
2023);
Neumayer (
2003);
Nunnenkamp and Öhler (
2011)) and broadly aggregate financial aid.
The major limitation of empirical studies based on aggregate data is that major effects on climate finance are obscured, and this might be attributable to the divergent views present in the literature. According to
Banerjee et al. (
2020) and
Han and Cheng (
2023), existing empirical research on institutional governance and climate financing mostly concentrates on the issue of corruption while paying little attention to other institutional governance aspects. For instance,
Acht et al. (
2015),
Alesina and Dollar (
2000), and
Neumayer (
2003) argued that less corrupt countries do not necessarily receive more financial aid, yet
Habib and Zurawicki (
2002) posited that corruption negatively impacts climate financing. Moreover, the few empirical studies that focus on climate finance while taking cognizance of more than one institutional governance indicator do not consider the NDCs. For instance,
Doku et al. (
2021) assessed determinants of climate finance among 43 recipients in Sub-Saharan Africa (SSA), including institutional governance indicators such as government effectiveness, rule of law, corruption, and regulatory quality. However, their analysis was limited to the 2006–2017 period while the PA was only enacted in 2015.
Thus, their work did not keep track of countries that are committed to increasing their NDCs. Other closely related studies that focus on developing countries include those by
Barrett (
2014) and
Robertsen et al. (
2015), while the studies by
Halimanjaya (
2015),
Samuwai and Hills (
2018), and
Nakhooda et al. (
2016) exemplify research on developed economies. Another strand of the climate financing literature that is beyond the scope of this paper draws on financial institutions (
Boissinot et al. 2016;
Elliott and Löfgren 2022;
Kawabata 2019). Therefore, we seek to bridge the knowledge gap in how climate financing is affected by institutional governance indicators. This work aims to improve upon the existing work (for example, that of
Clist (
2011)) by identifying which institutional governance indicators impact the amount of climate finance received by countries that have increased their NDCs in comparison to those that have not increased their NDCs, irrespective of whether a country is categorized as developing or developed. For robustness, we also estimate other models showing (i) the overall effect and (ii) the effect by income category group, irrespective of whether the countries’ increased their NDCs or not.
The rest of the paper is organized as follows.
Section 2 describes the data used, as well as the empirical model.
Section 3 presents the empirical results, while the discussion of the results features in
Section 4. The study is concluded in
Section 5 with some policy recommendations, and the limitations of this research and areas for further research are presented in
Section 6.
2. Methodology
This section draws on 21 of the 37 nations (see
Table 1) for whom the Climate Action Tracker (CAT) measures progress toward the internationally agreed-upon target of limiting global warming to 1.5 °C, as stated in the PA commitment. The CAT is a scientific analytical tool that assesses and analyses governments’ climate change mitigation objectives, policies, and activities with respect to the PA target. Furthermore, the CAT aggregates national actions to the global level and computes projected temperature increases throughout the 21st century using the MAGICC climate model (
CAT 2022).
The 21 climate finance-receiving countries were drawn from different geographical regions but categorized as either low-middle-income countries (LMICs), upper-middle-income countries (UMICs), low developing countries (LDCs), or more advanced developing countries and territories (MADCTs) based on the Organization for Economic Cooperation and Development’s (OECD) classification. While the CAT measures progress for 37 countries, 13 of these do not receive climate financing (see
Table 1). Therefore, given that this study focuses on the amount of climate finance received, these 13 countries were not considered in the analysis. Furthermore, even though the European Union (EU) is analyzed in the CAT as a single region, it is not classified into any of the OECD income groups among the climate finance-receiving countries. Moreover, institutional governance indicators for EU countries are also not aggregated at the regional level. Thus, the EU was also not considered in our analysis.
According to the analytical framework presented by
CAT (
2023), all countries’ targets are incompatible with the 1.5 °C PA target. Therefore, if countries considered in this paper continue implementing the current policies and actions, domestic targets, fair-share targets, and net-zero targets, zero-emission societies will not be achieved.
2.1. Data and Variables
Following
Halimanjaya (
2015), we used the institutional governance indicators presented by
Kaufmann et al. (
2011), as described below.
Corruption is a type of dishonesty or a criminal offense committed by a person or organization in a position of authority to obtain unlawful advantages or misuse power for personal gain (
Chaisse 2023;
Denolf 2008;
Philp 2016).
Voice and accountability refer to viewpoints on free media, elections, and the liberty for free speech, association, and assembly, while
regulatory quality is the ability of the government to formulate and then enforce legislation and regulations that allow for and promote the development of the business community.
Political stability gauges perceptions concerning the probable occurrence of instability in politics and/or violence rooted in political goals, such as terrorist activities.
Government effectiveness refers to the expected quality of services provided by the civil service, the formulation and implementation of policies, and the devotion of the government to accomplishing these targets, while
rule of law measures the public’s perception of the legal system, police, ownership rights, and compliance with contracts. The index values of all these indicators range from −2.5 to 2.5, where 2.5 implies better institutional governance and vice versa (
Al-Faryan and Shil 2023). The indicators span from 2002 to 2020 and were extracted from the World Governance Indicators (WGI) database. However, due to data limitations, the indicator for rule of law was not considered in this analysis.
The amount of climate finance received by countries per year in United States dollars (USD 2020 values) was used as a proxy for climate governance. Climate finance is the foundation of the PA in that it allows a government that is having difficulty meeting its fair-share obligations on its territory to meet them internationally through direct financial resources, such as funding and supporting emission reduction-related activities in other countries. Whereas the CAT calculation only uses climate mitigation-related finance contributions (i.e., it does not analyze the progress in climate change adaptation or progress related to non-state and sub-national actors
CAT (
n.d.), this study used the total amount of funds committed for climate mitigation- and adaptation-related activities. The data were extracted from the Organization for Economic Cooperation and Development’s (OECD) Development Assistance Committee (DAC) database. The data span 19 years (2002–2020). Unlike other countries considered in this study, Ukraine’s climate finance data start from 2005.
2.2. Model Specification
First, we used Pearson’s correlation test to assess the nexus between the amount of climate finance received and each institutional governance indicator. Pearson’s correlation is one of the most popular correlation methods (
Berman 2016), and it measures the strength of the relationship between any two variables. Correlation values range from −1 to +1, with a value of −1 implying that there is a perfect negative correlation between the two variables, while a value of +1 denotes a perfect positive correlation (
Walker et al. 2008). If there is no linear relationship between the variables, the correlation values are equal to 0. Mathematically, Pearson’s correlation coefficient is expressed as follows:
where
r = correlation coefficient,
= values of the variable
x in the sample,
= values of the variable
y in the sample,
= mean value of y, and
= mean value of
x.
Furthermore, we used panel data to empirically estimate the effect of each of the five institutional governance indicators on the amount of climate finance received by the countries considered in the analysis. We executed two estimation techniques: (
i) a fixed-effect ordinary least squares (OLS) estimator and (
ii) the feasible generalized least squares (FGLS) estimator with heteroscedastic adjusted panels, taking note of the dataset’s short panels. The OLS estimator is unable to handle heteroscedasticity and has an unorthodox distribution of OLS estimations (
Addis and Cheng 2023;
Ugrinowitsch et al. 2004). Hence, OLS results were cross-checked with the estimates of the FGLS estimator. According to
Stata (
2020), the FGLS estimator can effectively address the autocorrelation concern and is sufficient for considering the existence of nonspherical innovations when the covariance matrix is not known. The specified empirical model (Equation (
2)) takes into consideration the recipient’s macroeconomic, environmental, and time-invariant factors. The natural log of the amount of climate finance received by country
i in year
t is denoted as
, while
is the one-year-lagged value of the amount of climate finance received:
Following
Robertsen et al. (
2015), other covariates used in the analysis were per capita gross domestic product (PGDP) at constant 2017 international USD values obtained from Our World in Data (
Roser et al. 2023), trade openness (Open), a dummy for the income group category (IncDummy), and the vulnerability index (Vul). The Vul is based on data from six fundamental sectors of life: water, health, food, ecosystem services, infrastructure, and human habitat. The index assesses a nation’s capacity to adapt to the detrimental consequences of climate change (
NDGAIN 2023) and it ranges from 0 to 1; the higher the index, the worse off a country is in adapting to climate change. Data for trade openness (Open) and value added in the agricultural sector (measured as a percentage of the GDP) (VAgr) were obtained from the World Bank’s World Development Indicators (WDIs). The variable for the value added in the agricultural sector (VAgr) captures the view of
Barrett (
2014) that funding goes to agricultural economies. For robustness, we estimated other models—(
i) the overall effect and (
ii) the effect by income group—irrespective of whether a country increased its NDCs or not.
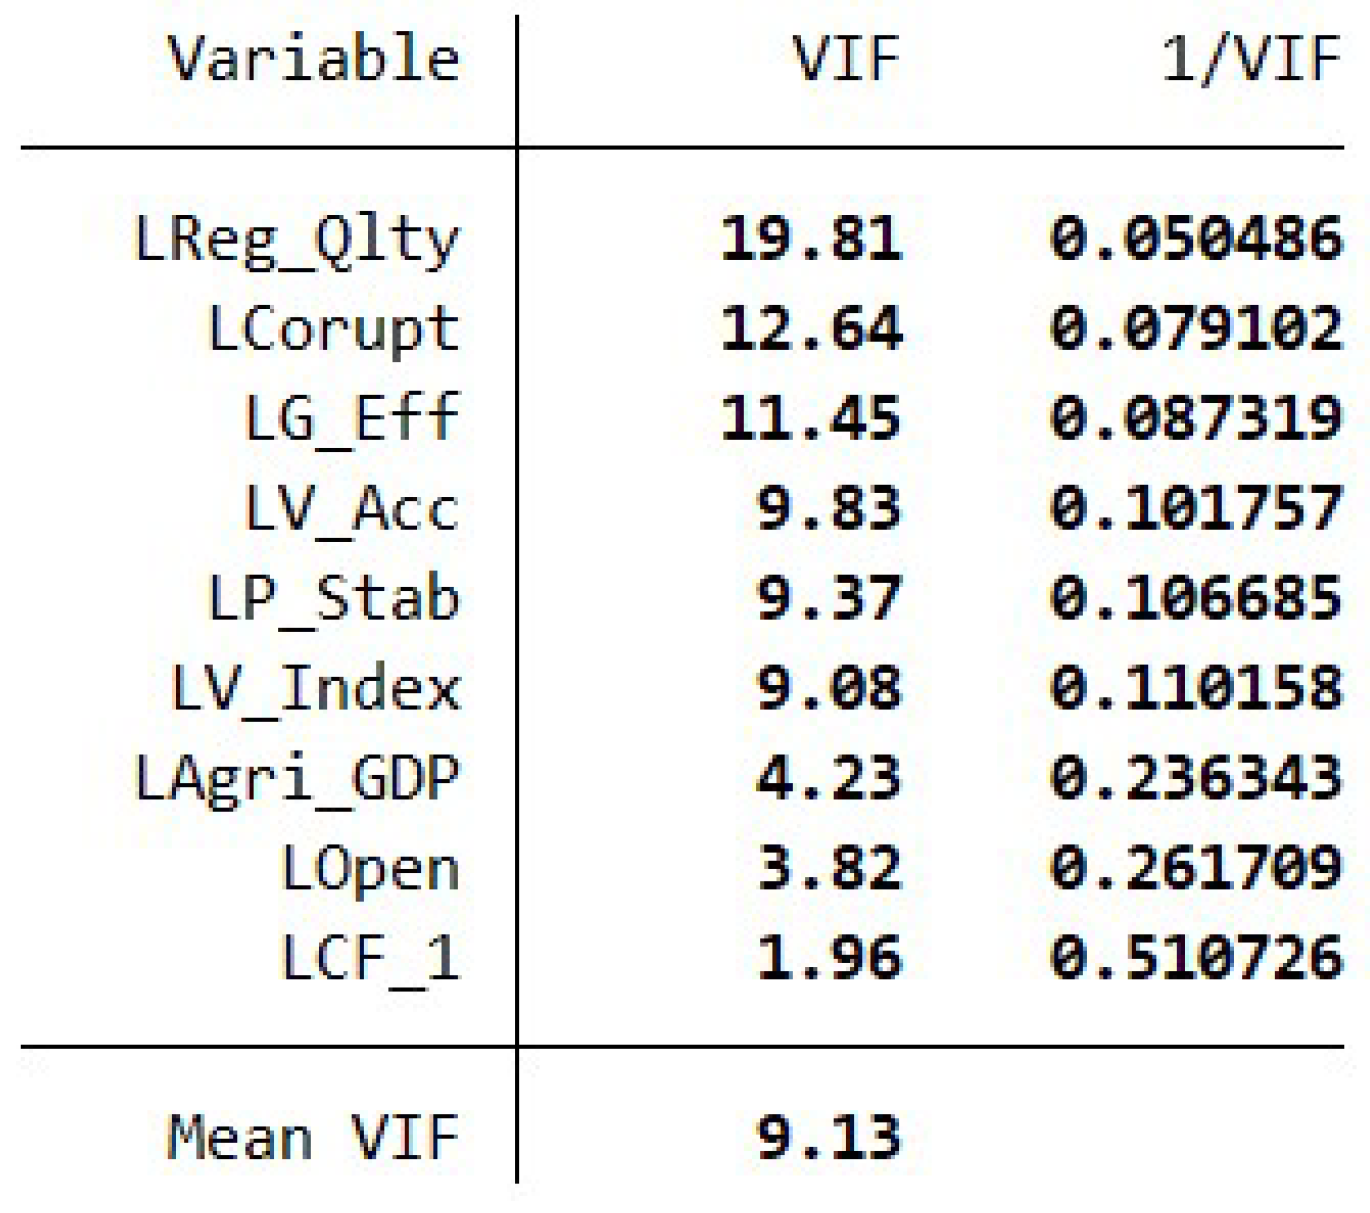
Before the empirical estimation of the described models, multicollinearity was tested to ascertain the severity correlation between the covariates (see
Appendix B for details). Due to the limitations of Pearson’s correlation test, as elaborated by
Demeusy (
2023) and
Janse et al. (
2021), a variance inflation factor (VIF) test was also used at this stage.
Belsley et al. (
1980,
2005) report that the VIF test determines the degree to which the variance of the standardized regression statistic is inflated as a consequence of collinearity. Multicollinearity is present when the VIF value is greater than 10, and this has been noted to cause difficulties when conducting regression analyses (
Belsley et al. 2005;
Lubinga 2014). Furthermore, for the OLS estimator, a Hausman test was used to establish the similarity between estimates of the random- and fixed-effects models. However, given that the test was significant (
p-value less than 0.05) (
Table 2), a fixed-effects model was the preferred estimator.
3. Results
This section presents the results of the study. First, a descriptive summary of the study variables is provided, followed by the correlation analysis and, lastly, the empirical findings for the effect of institutional governance indicators on climate finance received.
3.1. Descriptive Summary
Descriptive summary statistics presented in
Table 3 show the amount of climate finance (CF) received by countries based on income group categorization and NDC targets in millions of US dollars (USD). Low- and middle-income countries (LMICs) received the most climate finance on average, valued at around USD 1259 million, followed by upper-middle-income countries with slightly more than USD 500 million. MADCTs received the least amount (USD 79.7 million), while LDCs received approximately USD 210 million. The variation in the average amounts of climate finance received might be attributable to the variation in the numbers of years for the countries considered in this study. Moreover, some income group categories had greater numbers of countries than others; e.g., UMICs included nine countries, followed by LMICs with seven and LDCs with four, while the MADCT category included only one.
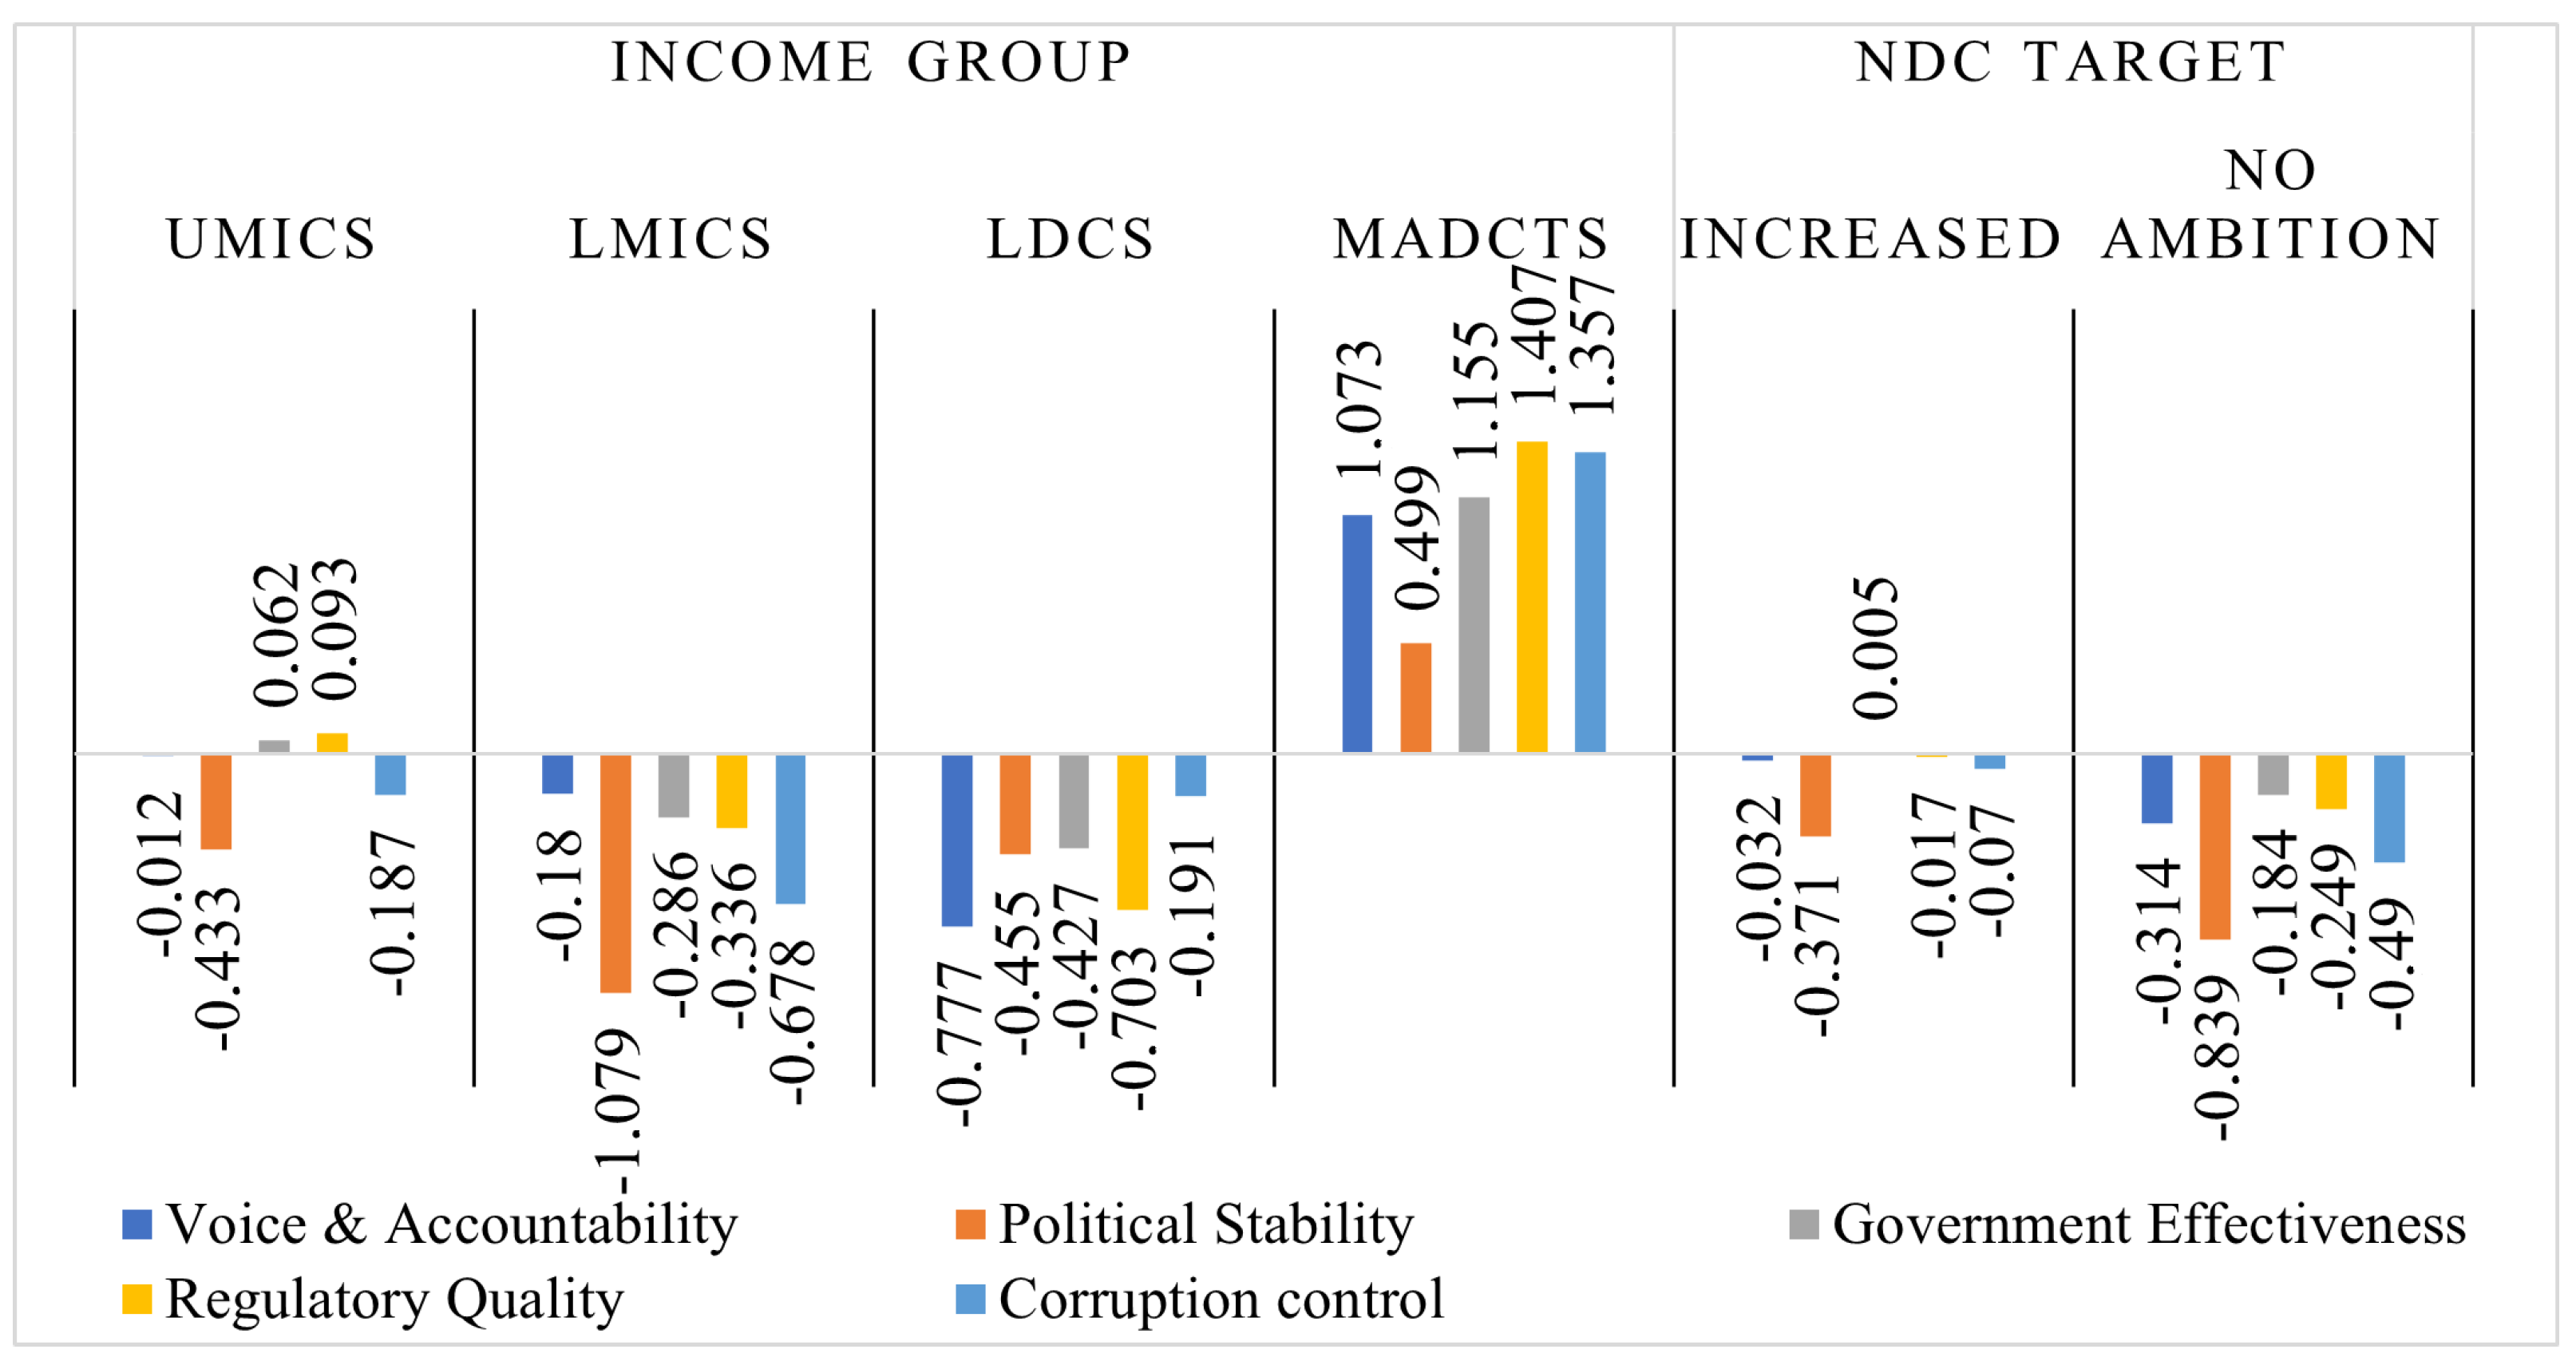
Comparing countries that increased their NDC targets in 2022 to those considered unambitious, non-ambitious countries received more than twice as much climate finance (USD 938 million) as countries that increased their NDCs. Moreover, there were more countries (13) that increased their NDCs than non-ambitious ones (9). While it would be expected that countries that received more climate finance would easily increase their NDCs, the observed ambiguity might be attributable to the influence of the income group within which some less ambitious countries fell. For instance, out of the nine non-ambitious countries, four were categorized as LMICs, a category that received the highest amount of climate finance. Moreover, the average values of institutional governance indicators based on income groups (
Figure 1) show that LMICs and LDCs had negative values for all five governance indicators, while MADCTs exhibited positive values. For the UMICs, two institutional governance indicators (government effectiveness and regulatory quality) were positive, and the rest were negative.
From the NDC target perspective, both countries that increased NDC targets and those that did not had negative values for all the indicators, except government effectiveness (0.005) for countries that increased their targets. This suggests that government effectiveness is a key driver for climate finance received.
3.2. Correlation Results Based on Nationally Determined Contribution (NDC) Targets
Among countries that increased their NDC targets (
Table 4), correlation coefficients for voice and accountability, political stability, and corruption control suggest that there is a negative and significant relationship with the amount of climate finance received. For instance, the coefficient of −0.336 (
p < 0.1) associated with the indicator for voice and accountability indicates that a poor perception of citizens’ ability to express their voices per the law was linked to a 33.6% decline in the amount of climate finance received among countries that increased their respective NDCs. Thus, poor institutional governance, especially for the voice and accountability and corruption control indicators, was associated with reduced climate finance inflows in these countries.
For countries with “no ambition”, three institutional governance indicators (i.e., voice and accountability, government effectiveness, and corruption control) showed a significantly positive correlation with the amount of climate finance received (
Table 5).
3.3. Empirical Effect of Institutional Governance Indicators on Climate Finance Received
The main results of this study for both estimation techniques (that is, the OLS (fixed-effect) and the FGLS) are presented in columns two and three of
Table 6. Although the estimates from the two estimators are comparable,
Kao and Chiang (
2001) emphasize that OLS estimates cannot be used to derive accurate deductions. Therefore, we focus on the FGLS results. Furthermore, since none of the institutional governance indicators were log-transformed, the interpretation of each significant coefficient estimate was based on the following exponential function:
Results based on NDC targets indicate that institutional governance only influences the amount of climate finance received among countries that have stronger NDC targets (see FGLS data in column two in
Table 6). A good perception that a country is politically stable (0.548,
p < 0.05) has significant positive impacts on the amount of climate finance received. However, perceived corruption in a country was found to have a statistically significant negative effect (−1.330,
p < 0.001) on climate financing inflows. The positive result implies that a unit improvement in political stability among countries that substantially increased their NDC targets led to a 72.98% rise in the amount of climate finance received. Conversely, a unit deterioration in the perceived ability of a country to control corruption among these countries was associated with a 73.55% reduction in the amount of climate finance received.
Robustness test results based on the overall estimates presented in column one of
Table 6 reveal that political stability had a statistically significant positive effect on the amount of climate finance received, while the perception that a country is corrupt exhibited a significant negative effect on the amount of climate finance received by the countries considered in the study. Thus, for a unit increase in political stability (0.331,
p < 0.001) among the countries considered in this study, the amount of climate finance received increased by 39.24%. On the other hand, a unit increase in perceived corruption (−0.805,
p < 0.001) was associated with a 55.29% reduction in the climate finance destined for these countries. In general, our robustness results confirm that political stability and a country’s perceived corruption tendencies are the key institutional governance indicators influencing climate finance inflows. While those indicators were statistically significant for the non-ambitious countries when the fixed-effect OLS estimator was employed, neither were found to be significant with the FGLS estimator.
Other than the institutional governance indicators, the amount of climate finance received was found to be positively influenced by the climate finance received in the previous year (0.675, p < 0.001) and the value added in the agricultural sector (0.51, p < 0.01). This suggests that a unit change in the amount of climate finance received in the previous year was associated with a 67.5% change in the amount received in the next year, while a 1% increase in value addition in the agricultural sector was bound to spur a 51% rise in climate financing received. However, growth in trade openness (−1.053, p < 0.001) and the dummy variable for income group classification (−0.195, p < 0.01) were found to limit the amount of climate finance received by 105.3% and 17.72%, respectively. Unlike for the non-ambitious countries, the coefficient for income group classification for countries that increased their NDC targets (−0.244, p < 0.1) suggested that the income group of countries was associated with a 21.65% reduction in climate finance inflows.
Furthermore, the test results for robustness by income group category, presented in
Table 7, also reveal that political stability and the perceived ability of a country to control corruption influence climate finance inflows among UMICs and LMICs. An improved perception that a country is politically stable had a more positive effect on the amount of climate finance received among LMICs (0.868,
p < 0.001) than among UMICs (0.615,
p < 0.05). This implies that perceived political stability is associated with 138.21% and 84.97% increases in climate finance inflows into UMICs and LMICs, respectively. However, perceived corruption control has more negative effects on the amount of climate finance received among LMICs (−2.322,
p < 0.001) than UMICs (−1.194,
p < 0.001). This implies that a unit deterioration in the level of perceived corruption control hinders the transfer of climate finance by 90.19% among LMICs and 69.70% for UMICs. The findings were insignificant for LDCs since we focused on FGLS estimates.
Results further revealed that a one percent improvement in accountability among UMICs (0.694,
p < 0.05) increased climate finance inflows among UMICs by 100.17%, while, in contrast, government effectiveness (−3.603,
p < 0.05) negatively affected the amount received by LDCs by 97.28%. At the income-group level, it was evident that the previous year’s climate finance inflows positively enhanced the next year’s inflows by 63.1%, 47.1%, and 42.9% among UMICs, LDCs, and LMICs, respectively. The significant positive results also relate to the findings in
Table 6. Similarly, trade openness was also found to negatively impact climate finance inflows across all the income groups. Concerning the vulnerability index, results showed that a unit increase in LDCs’ capacity to adapt to the detrimental effects of climate was associated with a 21.23% reduction in the climate financing received.
4. Discussion
On average, the statistics presented in
Table 3 reveal that LMICs received the highest amounts of climate finance, worth about USD 1259 million, followed by UMICs with USD 500 million. LDCs and MADCTs received USD 210 million and USD 79.7 million, respectively. Notably, LMICs received climate finance throughout the 21 years considered in this study with a minimum value of USD 210 million. When compared to other income groups for which the minimum amount received was zero, it is plausible to contend that the data concur with
Robertsen et al. (
2015), who noted that lower-middle-income nations received the majority of climate finance, followed by high-income, upper-middle-income, and low-income countries. Correlation results based on nationally determined contribution (NDC) targets showed that, among countries that increased their NDC targets (
Table 4), the correlation coefficients for voice and accountability, political stability, and corruption control suggested a negative and significant relationship with the amount of climate finance received. For countries with “no ambition”, three institutional governance indicators (i.e., voice and accountability, government effectiveness, and corruption control) positively and significantly correlated with the amount of climate finance received (
Table 5).
Whereas both the fixed-effects OLS and FGLS estimators were utilized to ascertain the effect of institutional governance indicators on climate finance inflows for the selected countries, only FGLS results were used to deduce actionable recommendations. FGLS findings on the effect of institutional governance indicators on climate finance received for countries with stronger NDC targets (column two in
Table 6) showed that only a good perception that a country is politically stable had a significant positive impact on the amount of climate finance inflows, while the perception that a country is highly corrupt had a negative impact. The study findings entail that perceived political stability is associated with increased climate finance. This is supported by
Cao et al. (
2021), who argue that citizens in politically unstable countries lack access to climate funding because local and regional instability might render it challenging to prioritize actions aimed at mitigating and adapting to climate change. Findings based on the income-group level also show that there was a significant positive effect associated with perceived voice and accountability in UMICs, indicating that when citizens and civil society are at the center of equitable climate action and countries exhibit the capability to co-create accountable climate finance, funding will increase (
Jarvis et al. 2023). According to
Chitsa et al. (
2022), a bottom-up approach to citizen participation through education, awareness, and inclusive climate policy formulation procedures will result in positive attitudes toward citizen participation
Conversely, an increase in corruption leads to a decline in climate finance. Our results on the effect of corruption concur with the findings of
Lyeonov et al. (
2023),
Sovacool (
2021), and
Habib and Zurawicki (
2002), who argue that corruption deters climate finance flows to recipients. Perceived corruption hinders the transfer of climate finance, as confirmed by
Habib and Zurawicki (
2002).
Chaisse (
2023) and
Denolf (
2008) regret that, in part because the OECD Convention and the United Nations Convention against Corruption (UNCAC) are unenforceable, investment tribunals have not been able to tackle allegations of corruption effectively, even after anti-corruption principles were established and integrated into bilateral investment treaties. The major limitation of bilateral investment treaties is that they are used as tools to safeguard the rights and interests of foreign investors in the host countries (
Chaisse 2023;
Yan 2020), and
Denolf (
2008) posits that UNCAC’s failure lies in the fact that it only recommends legislation to governments, with limited provision of technical support. This poses a risk for any government in implementing legislation in the way it deems fitting.
However, for better sustainable development outcomes,
Qian (
2022) emphasizes that international investment agreements must be strengthened against any loopholes regarding corruption tendencies and include provisions for technical capacity-building in host countries where deemed necessary.
In contrast,
Nest et al. (
2022) observed that top receivers of climate finance are among the countries with the highest corruption risk globally, with the least corrupt recipient listed 66th on the Corruption Perceptions Index (CPI) 2019. The authors further highlighted that this is especially true for the top ten LDC beneficiaries, considering that half are included in the CPI 2019’s bottom quintile, and the least corrupt LDC in the top ten is also ranked at number 66. Studies by
Nakhooda et al. (
2016) and
Halimanjaya (
2015) have also highlighted that more climate financing is obtained by nations with higher levels of corruption and superior institutions. This may suggest that other factors determine climate finance apart from institutions.
At the income-group level, results also revealed that perceived government effectiveness negatively affects climate finance inflows among LDCs. Therefore, a bad perception of government efficiency in delivering services compromises the chances of receiving climate finance. This could be attributed to donor confidence, which relies on decision-making and the capacity to make adequate and efficient decisions that further influence continued funding (
Sheriffdeen et al. 2020). The cited authors further highlighted that developing countries are commonly associated with a lack of financial power, in addition to deficits in institutional capacity and skills. Moreover,
Halimanjaya (
2015) explained that nations lacking sound governance practices may encounter challenges in meeting the legal and accountability requirements to access climate financing.
Nakhooda et al. (
2016) postulated that the flow of climate financing should be correlated with the institutional strength of receiving countries, allowing higher-income countries to handle their climate funds more effectively due to stronger institutions and greater levels of development.
No institutional governance indicator was found to be statistically significant for the “non-ambitious” countries, possibly due to the aggregation of countries falling under various income group tiers. This finding is plausible since it would be expected that countries that have stronger NDC targets would receive more climate finance. The finding generates more clarity regarding the ambiguity presented by
Dolšak and Crandall (
2013) concerning the fact that economies that provided their NDC targets to the United Nations Framework Convention on Climate Change (UNFCC) secretariat were most likely to receive more funding; however, the authors did not specify the nature of the NDC targets (increased or no ambition).
5. Conclusions and Policy Recommendations
Since the Paris Agreement was signed, governments from across the world have pledged to reduce greenhouse gas emissions causing global temperatures to rise. The study analyzed the link between climate financing received and five institutional governance indicators and how the indicators affect the amount of climate finance received. We considered 21 nations that track their progress towards the globally agreed-upon goal of limiting global warming to 1.5 °C as per the Paris Agreement commitment, which is measured using the Climate Action Tracker (CAT). Pearson’s correlation, fixed-effect OLS, and the feasible generalized least squares (FGLS) analytical techniques were executed.
Based on the analytical findings, it is prudent to conclude that the nexus between institutional governance and climate finance varies depending on the recipient country’s income group. The indicator for the extent to which a country’s citizens can participate in selecting their government (voice and accountability) had a very strong linkage to the amount of climate finance received in any country, irrespective of the categorization. From the NDC target perspective, there was a negative linkage between institutional governance and the amount of climate finance received by countries that increased their NDC targets, while for the non-ambitious countries, the positive linkage was weak due to the small but statistically significant coefficients.
While the existence of linkages between climate finance and institutional governance indicators is evident, empirical analysis suggested that a country’s perceived control of corruption and perceived political stability were the most significant institutional governance indicators affecting climate finance inflows among countries considered in this study. Specifically, perceived government effectiveness in rendering services to the people was the most important institutional governance indicator among LDCs.
The following recommendations require urgent attention to spur increased climate finance inflows:
LDCs need to improve the standard of public services provided to the populace while retaining a respectable level of autonomy from political influences;
LDCs also need to do a better job of developing policies, keeping in mind the pertinent challenges that affect people, and putting such policies into practice. Authorities can support the effective implementation of policies by providing both the required technical assistance and financial resources;
All countries must strengthen interventions put in place to curb corruption tendencies.
Chaisse (
2023) has proposed various pathways to obliquely include prohibitions on corrupt dealings. For instance, countries should include in bilateral investment treaties a duty for investors to act in “good faith” towards the host country. This is well exemplified by the Plama Consortium Ltd. v. Republic of Bulgaria
Antonietti (
2005). Good institutional governance is bound to encourage profitable investment and bring private climate financial flows to complement the limited resources available from government-backed development banks that comply with the Paris Agreement;
Concerning political stability, all countries must strive to avoid practices and alliances that lead to any form of violence, including terrorism and civil war.
Above all, as countries work towards strengthening institutional governance, there is an urgent need for developed economies to assist developing economies in overcoming debt stress.
Kozul-Wright (
2023) reckons that the likelihood of future resilience and prosperity is undermined by the fact that 60% of countries with low incomes are in or near debt crises and spend almost five times as much annually on repayment of debt as they allocate to climate adaptation.


