Article

Development Aid and Export Resilience in Developing Countries: A Reference to Aid for Trade

by
Sèna Kimm Gnangnon
World Trade Organisation, Rue Lausanne 154, CH-1211 Geneva 21, Switzerland
Economies 2022, 10(7), 161; https://doi.org/10.3390/economies10070161
Submission received: 4 April 2022 / Revised: 8 June 2022 / Accepted: 13 June 2022 / Published: 4 July 2022
(This article belongs to the Special Issue Foreign Direct Investment and Investment Policy)

Abstract

:
The COVID-19 pandemic, as with previous major crises, such as the 2008 financial crisis, has had a severe negative impact on international trade flows. The present paper aims to contribute to the debate concerning how to foster resilience against future crises, in terms of countries’ aggregate exports, by examining the effect of development aid (i.e., so-called official development assistance), particularly the impact of the Aid for Trade (AfT) component, upon export resilience. The resilience of exports refers to the ability of countries’ aggregate exports to resist shocks, regardless of whether they are environmental or external shocks. The core argument of the analysis is that development aid would affect export resilience through its impact upon productive capacities. The analysis covers 93 developing countries over the period 2002–2018. The findings indicate that the total development aid flows, including both AfT flows and NonAfT flows, exert a positive effect upon export resilience. Among AfT components, AfT for productive capacities appears to exert a greater positive effect upon export resilience than AfT for economic infrastructure and AfT for trade policy and regulation. In addition, development aid (regardless of which aid variable is considered) exerts the greatest positive effect upon export resilience in countries (such as the least developed countries—LDCs) that have the lowest productive capacities. These findings highlight the need for donor countries to supply higher development aid flows, in particular, AfT flows, to countries such as LDCs that have low productive capacities.
JEL Classification:
D24; F35; O1

1. Introduction

The COVID-19 pandemic, which is the second major crisis faced by the world after the 2008 financial crisis, has revived the interest of the international community in finding ways (e.g., policies) and means to strengthen the resilience of economies against future shocks. The adverse effects of the COVID-19 health crisis upon international trade flows, particularly exports (e.g., Barlow et al. 2021; Chiah and Zhong 2020; Hayakawa and Mukunoki 2021; Li and Lin 2021), highlight the need to explore factors that are essential for fostering the resilience of countries’ trade performances, notably in terms of how their export performance manages future shocks. National policymakers, notably in developing countries, are contemplating policies that could be deployed to recover from the COVID-19 health crisis, including ones that can be put in place after stemming the spread of the coronavirus. To help them with this challenging task, researchers and international institutions have been exploring how to help inform policymakers’ decisions, within their respective areas of expertise, by investigating how to further help nations recover from the current COVID-19 pandemic and build economies that are resilient against future shocks (e.g., Bacchetta et al. 2021; Barkas et al. 2020; Davies et al. 2021; Evenett et al. 2022; OECD 2020, 2021; IMF 2021; Wu and Khazin 2020).
The United Nations Conference on Trade and Development (UNCTAD) launched a comprehensive index of productive capacities in February1 2021, with a view to helping researchers assess countries’ performances in terms of productive capacities, and to inform policymaking decisions (UNCTAD 2020). According to UNCTAD (2006, p. 61), ‘productive capacities’ refers to “the productive resources, entrepreneurial capabilities and production linkages which together determine the capacity of a country to produce goods and services, and enable it to grow and develop”. This indicator of productive capacities has been constructed on the grounds that enhancing productive capacities, particularly in developing countries and the least developed countries (LDCs2), would help build economic resilience against future shocks, and concurrently promote economic growth and sustainable development. Some papers have used this indicator of productive capacities to provide empirical support for international policy discourse which argues that enhancing productive capacities in developing countries, particularly the LDCs, contributes to improving economic complexity (Gnangnon 2021a), promoting economic growth, reducing output volatility (Gnangnon 2021b), and building countries’ resilience against shocks (Gnangnon 2021c). In addition, Gnangnon (2021d) empirically discovered that development aid, in particular, Aid for Trade flows, plays a strong role in building productive capacities in developing countries, including the LDCs.
The current paper aims to contribute to the debate concerning the possible factors that underpin economic resilience in developing countries by shedding light on the export resilience effect of development aid, particularly Aid for Trade (AfT) flows. Thus, the paper questions whether development aid, particularly Aid for Trade (AfT) flows, helps recipient countries strengthen their export resilience against shocks.
To the best of our knowledge, this issue has received very little attention in the literature—not even from a macroeconomic perspective. Works that engage with similar topics have focused on the resilience of global value chains, either through empirical analysis or non-evidence-based analysis (e.g., Bacchetta et al. 2021; Baldwin and Tomiura 2020; Belhadi et al. 2021; Coveri et al. 2020; Li and Zobel 2020; Meyer et al. 2020; Miroudot 2020; National Board of Trade Sweden 2020; Nordhagen et al. 2021; Rose et al. 2018).
In light of the literature on resilience, including economic resilience (e.g., Briguglio et al. 2009; Gnangnon 2021c; Guillaumont 2009, 2017; Hundt and Holtermann 2020; Jolles et al. 2018; Martin and Sunley 2015; Sondermann 2018), we define the concept of “export resilience” as the level of resilience that countries’ aggregate exports have against shocks. Development aid, also referred to as official development aid (ODA), is government aid3 that promotes and specifically targets the economic development and welfare of developing countries. AfT flows are part of the ODA composite, and they aim to help recipient countries, notably LDCs, “to build the supply-side capacity and trade-related infrastructure that they need to assist them to implement and benefit from WTO Agreements and more broadly to expand their trade” (WTO 2005, para. 57). This type of aid arose from the realization made by WTO Members that developing countries were suffering from structural impediments4 (that prevented them from benefiting from WTO Agreements, including those related to trade promotion), which led to the subsequent launch of the AfT Initiative at the 2005 WTO Hong Kong Ministerial Conference. Through this initiative, the WTO advocates for securing greater financial flows in order to promote the trade sector in its developing member-states.
The analysis of whether development aid, particularly AfT, helps recipient countries strengthen their export resilience, essentially builds on two recent papers. The first paper is by Gnangnon (2021c), which investigates the effect of productive capacities (as defined by the UNCTAD) upon economic resilience in developing countries. The second paper is by Gnangnon (2021d), which explores the effect of development aid upon productive capacities. Both papers used the abovementioned indicator of productive capacities to perform the empirical analyses. Gnangnon (2021c) utilized a panel dataset of 118 developing countries, using data from the period 2000–2018, to develop a regression-based indicator of economic resilience. The author shows that the developing productive capacities not only help to enhance economic resilience, but that development aid is instrumental for achieving a positive effect of economic resilience on productive capacities. Moreover, countries that obtain higher AfT flows enjoy productive capacities that have a more positive effect on economic resilience. At the same time, NonAfT (i.e., the part of ODA not allocated to the trade-related sector) flows hinder the possible positive effect of productive capacities on economic resilience.
Gnangnon (2021d) used a set of 111 aid recipient countries, utilizing data from the period 2002–2018, to demonstrate that development aid, including AfT and NonAfT, contributes to fostering productive capacities in recipient countries. Additionally, the positive effect of AfT flows on productive capacities has not only been higher than that of NonAfT flows, but both types of development contribute to enhancing productive capacities in the LDCs. In contrast, regarding the other countries in the full sample (NonLDCs), only AfT flows matter (including positively) for productive capacities.
The theoretical argument underpinning the analysis of the effect of development aid upon recipient countries’ export resilience is that this effect works through the productive capacities channel. Thus, development aid, notably AfT flows, could contribute to enhancing export resilience by helping recipient countries to develop their productive capacities.
The current paper is, therefore, essentially empirical. First, it relies upon the first paper (i.e., Gnangnon (2021c)) to build an indicator of export resilience. Here, we avoid reproducing the literature review on the concept of ‘resilience’, including ‘economic resilience’, upon which this paper builds in order to develop an indicator of export resilience. Readers can find such a literature review in Gnangnon (2021c), as well as in Martin and Sunley (2015). Second, in this paper, we do not repeat the theoretical discussion on how development aid (including both AfT and NonAfT flows) can affect productive capacities, as such a discussion is provided by Gnangnon (2021c).
Against this background, the current analysis moves directly to the issue at hand by assuming that development aid exerts a positive effect upon productive capacities in recipient countries. Nonetheless, in the empirical part of the paper, we re-estimate the model specification presented in Gnangnon (2021d), concerning the effect of development aid upon productive capacities, in order to confirm the empirical findings of Gnangnon (2021d).
The empirical exercise is conducted using an unbalanced panel dataset that contains 93 aid recipient countries, using data from the period 2002–2018. First, this exercise confirms the findings in Gnangnon (2021d), in that development aid positively influences productive capacities in recipient countries, with AfT flows exerting a greater positive effect in terms of productive capacities than NonAfT flows on productive capacities. Second, and more importantly, the findings indicate that development aid (including both AfT flows and NonAfT flows), as well as all components of total AfT flows, positively influence export resilience in recipient countries.
The rest of the paper is organized into six sections. Section 2 briefly discusses how development aid can theoretically affect export resilience through the enhancement of productive capacities. Section 3 presents the export resilience indicator as a form of measurement, and Section 4 lays out the model specification that helps to examine the effect of development aid upon export resilience. Section 5 discusses an econometric approach that enables the empirical analysis to be performed. Section 6 interprets the empirical outcomes, and Section 7 concludes the paper.

2. Theoretical Motivation

This section discusses how development aid can theoretically affect export resilience through the productive capacities channel. Our definition of export resilience is derived from the definition of economic resilience in the literature, notably, the definition given by Guillaumont (2009) (see Gnangnon 2021c). In fact, the concept of ‘economic resilience’ is closely related to that of economic vulnerability at the aggregate macroeconomic level (e.g., Briguglio et al. 2009), and in particular, to that of structural economic vulnerability (e.g., Guillaumont 2009). According to Briguglio et al. (2009), the concept of “economic vulnerability” refers to “the inherent permanent (or quasi-permanent) economic features that further expose a country to external shocks, and over which it has almost no control”. At the same time, the authors define the concept of “economic resilience” as “the policy-induced ability of an economy to recover from or adjust to the negative impacts of adverse exogenous shocks, and to benefit from positive shocks”. The definition of “economic vulnerability” given by Guillaumont (2009) is more nuanced. The author defines economic vulnerability as “the risk of a (poor) country seeing its development hampered by the environmental or natural shocks as well as external shocks”. He considers “economic vulnerability” to be the combination of a structural component, referred to as “structural economic vulnerability”, and a conjunctural component, referred to as “economic resilience”.
The concept of “structural economic vulnerability” refers to the extent to which a country is exposed to exogenous shocks, and the size and frequency of those shocks, whereas “economic resilience” indicates the capacity of the concerned country to react to shocks, with such capacity being dependent on recent policy choices that are easily reversible. Here, it is important to note that the definition of structural economic vulnerability by Guillaumont (2009) follows the definition given by the United Nations. The latter has, indeed, used the concept of “structural economic vulnerability” as one of the criteria to identify countries that are to be included in the category of LDCs. The dataset on the index of structural economic vulnerability has been developed on a retrospective basis by the ‘Fondation pour les Etudes et Recherches sur le Développement International (FERDI)’ (e.g., Feindouno and Goujon 2016).
Against this backdrop, we define the concept of “export resilience” in terms of the capacity of countries’ aggregate exports to resist shocks. The resilience of aggregate exports, therefore, depends on measures and policies implemented by countries to enable their exports to resist adverse shocks.
We postulate that the effect of development aid on export resilience works through the channel of productive capacities. Thus, if development aid were to influence export resilience through the productive capacities channel, then we would need to discuss how productive capacities can theoretically affect export resilience, given that Gnangnon (2021d) has already provided the theoretical discussion and empirical work on the effect of development aid upon productive capacities in recipient countries.
It is noteworthy that productive capacities are defined here as “the productive resources, entrepreneurial capabilities and production linkages which together determine the capacity of a country to produce goods and services and enable it to grow and develop” (UNCTAD 2006, p. 61, 2020). The index of overall productive capacities developed by the UNCTAD (see UNCTAD 2020) on the basis of this definition comprises eight components, which are: physical capital (energy infrastructure; transport infrastructure; information and communication technology, i.e., ICT); human capital; private sector; institutional and governance quality; structural change in production; and natural resources. Hence, the discussion of the effect of productive capacities upon export resilience revolves around considering how each of these factors can theoretically affect export resilience.
The literature has firmly established that investment in hard infrastructure (e.g., telephone lines and other ICT, ports, and roads) and soft infrastructure (e.g., border and transport efficiency, and the business and regulatory environment) helps to reduce trade costs (e.g., Deardorff 2014; Olarreaga 2016) and boost export flows (e.g., Dennis and Shepherd 2011; Hendy and Zaki 2021). At the same time, higher trade costs are associated with the expansion of the non-tradable sector, which, in turn, results in the real exchange rate becoming more volatile (e.g., Bravo-Ortega and Di Giovanni 2006). As the volatility of the real exchange rate can enhance trade volatility (including export volatility), we infer that trade costs can ultimately lead to exports having a lower resilience to shocks. In other words, reducing trade costs through the build-up of hard and soft infrastructure can contribute to fostering export resilience.
Some studies have also underlined that good quality hard infrastructure (such as energy infrastructure, including electricity and transport) is essential for bolstering countries’ resilience to economic and financial shocks, as well as natural disasters (e.g., Di Caro and Fratesi 2018; Hallegatte 2014; Taghizadeh-Hesar et al. 2021; United Nations 2016). In light of the potential adverse effects of natural disasters on international trade flows, including exports (e.g., Gassebner et al. 2010; Oh and Reuveny 2010), we expect the development of hard infrastructure to be associated with greater export resilience.
Incidentally, the promotion of ICT is associated with better innovation performance (e.g., Bas 2020; Paunov and Rollo 2016). In turn, innovation can help to strengthen countries’ resilience to climate shocks (e.g., Tambo and Wünscher 2017), economic and financial shocks (e.g., Bristow and Healy 2018; Cappelli et al. 2021), or even health shocks such as the COVID-19 pandemic (e.g., Farrugia and Plutowski 2021; Paunov and Planes-Satorra 2021); therefore, we can expect the promotion of ICT to help enhance export resilience through its positive effect on innovation. Overall, the development of hard and soft infrastructure can significantly contribute to the enhancement of export resilience.
Human capital accumulation is also critical for export development, as high skilled workers are likely to innovate, produce differentiated goods, and thus improve a country’s competitiveness in the international market (e.g., Andersson and Johansson 2010; Munch and Skaksen 2008). According to Briguglio et al. (2009), the development of human capital can ensure better educational advancement and better health, and in this regard, it could be instrumental in improving a country’s ability to withstand external shocks. This is especially the case when human capital development helps to sustain a region’s technological resilience against adverse shocks (i.e., its level of knowledge creation) (e.g., Cappelli et al. 2021). This is also the case when human capital accumulation helps to dampen a country’s vulnerability to climate change (e.g., Bowen et al. 2012), or when it enhances a country’s capacity to develop and implement an effective risk reduction strategy (e.g., Mayunga 2007). In light of the foregoing, we postulate that human capital accumulation is associated with exports having greater resilience against shocks, as it could help dampen the adverse effects of shocks on exports.
Moreover, natural resource dependence can affect export resilience. Bahar and Santos (2018) found that countries that export larger shares of natural resources tend to concentrate their export baskets more acutely on non-resource products. Such countries usually experience significant fluctuations in terms of their export product prices (e.g., Asheghian and Saidi 2002; Gnangnon 2021d), and consequently, export earnings also become volatile (e.g., Ghosh and Ostry 1994; Bleaney and Greenaway 2001). In turn, the volatility of export earnings reduces firms’ investments, thus making them vulnerable to shocks. This can ultimately lead to their exports having a lower resilience. In addition, for the concerned economy, a high dependence on natural resources can be a curse, as such dependence may not only hinder economic development, but it may also force out human capital formation (e.g., Wang et al. 2021), which, as shown above, could play an essential role in enhancing export resilience. Overall, it is likely that a country which exports a high share of natural resources is likely to experience lower levels of export resilience.
The development of the private sector is exemplified by the development of entrepreneurial activities, the flexibility of product and labor markets, and the development of the domestic financial market. The removal of barriers to entrepreneurship, such as licenses, permit systems, and administrative burdens (e.g., Jolles et al. 2018; Seidu and Maciej 2020), can help improve the capacity of trading firms to cope with shocks that affect their trade activities (e.g., Andrews and Saia 2017), and thus, it can also improve the resilience of exports (at the aggregate, i.e., national level) against shocks. Similarly, the flexibility of product markets can influence the speed of the pace at which firms adjust to shocks by helping to improve the functioning of the labor market (e.g., Bassanini and Duval 2007), and more generally, by promoting the development of business (e.g., Anderton et al. 2020). Additionally, greater competition in the product market contributes to easing the transmission of monetary and fiscal impulses, including those that take place after adverse shocks (e.g., Aghion et al. 2019; Duval and Furceri 2018). This can strengthen export resilience by facilitating trading firms’ access to funding (both of which are provided by the financial sector or the government), consequently enhancing their ability to address any repercussions stemming from adverse shocks, and the impact those shocks may have had upon their activities. The literature has shown that the lack of funding during adverse shocks reduces consumption and particularly investment (e.g., Kinnan and Townsend 2012; Somville and Vandewalle 2019), which can reduce countries’ levels of export resilience. Moreover, we expect that if a country has a strong private sector, it would help strengthen its export resilience.
Institutional and governance quality can also be instrumental in promoting greater export resilience. According to the existing literature (e.g., Acemoglu et al. 2003; Caldera Sánchez and Röhn 2016), countries with low quality institutions and governance have a limited ability to withstand external economic shocks. Stronger public administrations improve countries’ abilities to implement good quality policies and solve coordination failures across different parts of the administration (e.g., OECD 2017). Moreover, Zeev and Ifergane (2021) have shown that stringent firing restrictions reduce the capacity of the labor market to respond to adverse shocks. Thus, improving institutional and governance quality would likely help firms, including firms that trade, deal appropriately with shocks. Against this background, we expect stronger institutions and governance to help foster export resilience.
Finally, structural changes to production matters for export resilience. According to Herrendorf et al. (2014, p. 857), a structural change to production is defined as a change in the sectoral composition of an economy (i.e., “a reallocation of economic activity across three broad sectors (agriculture, manufacturing, and services) that accompanies the process of modern economic growth”). We hypothesize that greater structural changes to production are likely to result in greater export resilience. This is because, on the one hand, Saltarelli et al. (2020) have empirically demonstrated that exports of goods reflect strongly on domestic production in terms of manufacturing sectors or sectors related to physical goods; however, the link between the export of services and the production of services is less tenous. This means that greater structural changes to production are likely to be strongly associated with greater export diversification, at least for goods exports. On the other hand, export diversification helps countries dampen output volatility (see above) and reduce firms’ output volatility (e.g., Kramarz et al. 2020; Vannoorenberghe et al. 2016), which, in turn, can help firms improve investment and sustain their exports, even after adverse shocks.
Building upon the aforementioned theoretical discussion, we can expect greater productive capacities to be associated with greater export resilience.
Beyond its effect upon export resilience via the productive capacities avenue, development aid can also influence export resilience, given that it has an effect upon on the volatility of the real exchange rate; however, there may be a strong relationship between a country’s productive capacities and the level of volatility of the real exchange rate in that country. In fact, Gnangnon (2020) empirically discovered that higher AfT flows cause the real exchange rate to become less volatile, whereas higher NonAfT flows are associated with an increase in the volatility of the real exchange rate. In light of the possible adverse effects that real exchange rate volatility could have on the volatility of export earnings (i.e., higher real exchange rate volatility would result export earnings fluctuating), one can assume that if the real exchange rate experiences strong fluctuations, then it will reduce the resilience of countries’ exports against shocks. In this context, we can expect that AfT flows would result in lower levels of export resilience, given their effects on the volatility of the real exchange rate. In contrast, NonAfT flows result in lower export resilience due to their positive effect upon the volatility of the real exchange rate. Nevertheless, the present paper will not test the real exchange rate volatility channel, and will leave it for future research.
Beyond all arguments mentioned above, Gnangnon (2021b) empirically discovered that productive capacities help reduce economic growth volatility by acting as an absorber of shocks. In this sense, greater productive capacities can contribute to enhancing export resilience.
Overall, we posit that development aid could help strengthen export resilience, particularly in countries with low levels of productive capacities.

3. Measurement of Export Resilience

Building upon the abovementioned definition concerning export resilience, and drawing from Gnangnon (2021b), we measure export resilience in terms of the residual regression of the variable that captures a country’s aggregate exports on the structural economic vulnerability indicator (denoted “EVI”). The latter measures countries’ exposure to both shocks and size of shocks. Thus, the EVI has two main components: a sub-index of the level of exposure to shocks (exposure sub-index) and a sub-index measuring the intensity of exogenous shocks (shocks sub-index). These two sub-indexes have been computed as a weighted average of different component indexes, with the sum of components’ weights being equal to 1 so that the values of the EVI range between 0 and 100 (see Feindouno and Goujon 2016). The exposure sub-index has five component indexes (with their weights in brackets), which are: population size (25%); remoteness from world markets (25%); export concentration (12.5%); share of agriculture, forestry, and fishery in GDP (12.5%); and the share of the population living in a low elevated coastal zone (25%). The shocks sub-index has three components (with their weights in brackets), which are: victims of natural disasters (25%); instability in agricultural production (25%); and instability in exports of goods and services (50%). An increase in the values of the EVI indicates greater structural economic vulnerability.
Hence, by regressing the indicator of a country’s aggregate exports on the EVI, we are not only capturing the effect that the magnitude of shocks, faced by the country (i.e., the shock sub-index), can have upon exports, but also the effect that other structural factors can have upon the development of the country’s aggregate exports. These factors are: the population size; the remoteness from world markets; the export concentration; the share of agriculture, forestry, and fishery in GDP; and the share of the population living in a low elevated coastal zone. Below, we discuss how each of these factors can affect exports.
It is logical to expect that an increase in the size of shocks would lead to fluctuations in exports. This is particularly the case when adverse shocks result in banks, and more generally, the financial sector, tightening financial conditions, both in domestic financial markets and international financial markets (e.g., Amiti and Weinstein 2011; Feng and Lin 2013; De Nicola and Tan 2017; Spatareanu et al. 2018). For example, during a global financial crisis (e.g., the 2008 financial crisis), liquidity tightens in the international financial markets, and this raises the costs of trade finance (e.g., Auboin and Meier-Ewert 2003; Hwang and Im 2013). Hwang and Im (2013) empirically discovered that in Korea, financial shocks generally have a negative effect upon credit availability, and this negative effect lasts for at least three months, which implies significant delays and losses for traders.
As for the effect that exposure to shocks has upon exports, we argue that remoteness from the world market increases the costs of participating in international trade, including exporting goods and services (e.g., Anderson and van Wincoop 2001; Coe et al. 2002; Kristjánsdóttir 2012). Population size is expected to be negatively associated with exports given that countries with a large population enjoy relatively lower costs when trading in the domestic market, and they benefit from increasing returns (e.g., Esfahani and Ramirez 2003; Vijil and Wagner 2012). According to Brun et al. (2005), the population size variable can also be an indicator proxy for relative factor endowments.
Export product concentration can also affect export performance. For example, Camanho and Romeu (2011) empirically discovered that export product diversification increases export performance. This finding has been confirmed by Funke and Ruhwedel (2001, 2002), East Asian countries, and countries that are members of the Organization for Economic Co-operation and Development (OECD); however, del Rosal (2019) notes that for Spain, export product concentration positively influences export performance in destination countries. At the same time, a country with a large share of agriculture, forestry, and fishery in GDP is likely to essentially export low value-added products, which, as noted above, would result in fewer exports. Nevertheless, given that the majority of developing countries rely on the export of low value-added products (compared with developed countries), we can argue here that a greater export product concentration would be associated with lower export performance, whereas greater export product diversification is likely to be associated with higher export performance.
Finally, countries with a high exposure to natural disasters (measured by the share of the population living in a low elevated coastal zone) are likely to experience a lower export performance because of the higher trade costs induced by the adverse effect of natural disasters on infrastructure (e.g., Kadri et al. 2014; Marto et al. 2018) and human capital (the latter can potentially reduce workers’ productivity) (e.g., Paudel and Ryu 2018).
Overall, in light of the previous discussion, we expect greater structural economic vulnerability to be associated with lower exports (at least aggregate exports).
Having provided a brief theoretical discussion on the effect of structural economic vulnerability on exports, now we need to consider which indicator of export (e.g., real exports versus export volumes) can be used to extract the measure of economic resilience. In the present analysis, we use the real export values (constant USD, 2010 prices), rather than the volume of exports, given that structural economic vulnerability would likely affect both the volume and prices of exports. The regression has been performed using a panel dataset of 93 aid recipient countries, using data from the period5 2002–2018. This is the panel dataset used in the empirical analysis below. The choice of the dataset was dictated by data availability.
Given the limited time dimension of the panel dataset, we do not estimate the export resilience indicator per country, but rather, we use the panel approach; therefore, the regression of total real exports (constant USD, 2010 prices), denoted “EXPORT” in the indicator of structural economic vulnerability (EVI) (both variables are expressed as natural logarithms), is estimated using the random effects estimator. In fact, the random effects estimator attributes only part of the unobserved heterogeneity to structural factors, whereas the fixed effects estimator attributes the unobserved heterogeneity to structural factors.
The outcome of this regression is as follows:
Log(EXPORT) = −1.658 × Log(EVI) + 28.5
(0.308)     (1.053)
Within R2 = 0.12; between R2 = 0.544; overall R2 = 0.523; number of countries = 93; number of observations = 519. The coefficients in brackets are robust standard errors.
These results show, as expected, that higher structural economic vulnerability is significantly associated (at the 1% level) with lower real exports.
The indicator of export resilience denoted "RESIL" is computed as the residual of the regression (1). It represents a measure of ‘relative’ export resilience across countries in the full sample, given that the mean of the residuals amounts to zero. As reported in Appendix B, values of the indicator of export resilience in the full sample range between −0.87 and 1.44, with the mean being 0.11, and the standard deviation amounting to 0.25. An increase in the value of this indicator reflects greater export resilience, whereas lower values indicate lower level of export resilience.
Figure 1 displays a graphical representation of the development of several key indicators in the panel dataset of 93 countries, with data covering the period 2002–2018. These indicators include the indicator of export resilience, the indicator of overall productive capacities (denoted “PCI”), the aid variables (namely total development aid, denoted “ODA”), and its two components, which are total AfT flows (denoted “AfT”) and NonAfT flows (denoted “NonAfT”). The last indicator is the share of total AfT flows in terms of total ODA flows, denoted “ShAfT”. All aid variables are real gross disbursements of aid, and are expressed in constant USD, 2018 prices.
Figure 2 shows the correlation pattern in the form of a cross-plot between the indicator of overall productive capacities and total development aid flows, on the one hand, and between the index of export resilience and total development aid flows on the other hand.
Figure 3 provides the correlation pattern between the indicator of export resilience and each of the two components of the total ODA flows, namely, total AfT flows and total NonAfT flows.
Figure 1 suggests that developing countries improved their level of productive capacities over time, from 23.6 in 2002–2004 to 27.72 in 2017–2018. Likewise, their level of export resilience steadily increased over time, from −0.33 in 2002–2004 to 0.23 in 2017–2018. Total development aid flows fluctuated over the full period. It increased from USD 0.684 billion in 2002–2004 to USD 0.926 billion in 2005–2007, and then declined to reach USD 0.812 billion in 2008–2010. From 2008–2010 onwards, it experienced a steady increase, reaching USD 1.05 billion in 2017–2018. This progression of the total development aid flows is reflected in the development of the NonAfT flows across the full period and sample. Notably, NonAfT flows experienced an increase from USD 0.584 billion in 2002–2004 to USD 0.798 billion in 2005–2007, before falling to USD 0.62 billion in 2008–2010. NonAfT flows then steadily increased to reach USD 0.703 billion in 2017–2018. On the other hand, the level of AfT that accrued in developing countries remained lower than the level of NonAfT. In contrast with the fluctuating movements of the NonAfT flows, AfT flows constantly increased from USD 0.106 billion in 2002–2004 to USD 0.342 billion in 2017–2018. The movement of total AfT flows is reflected in the share (%) of AfT flows in the total ODA. Moreover, this share rose from 13.9% in 2002–2004 to 28.6% in 2017–2018. The set-up of the AfT initiative in 2005 certainly contributes to the increase of AfT flows over time (see Gnangnon 2019a).
Figure 2 suggests a negative correlation between total development aid and the overall productive capacities, whereas there is no clear correlation pattern between export resilience and total development aid.
Figure 3 also indicates that the correlation pattern between export resilience and total NonAfT flows is unclear. In contrast, we find a strong positive correlation pattern between export resilience and total AfT flows.

4. Model Specification

There is no specific theoretical framework on the macroeconomic determinants of export resilience. Nevertheless, as the indicator of export resilience is derived from a regression of the indicator of real export values over the indicator of structural economic vulnerability, we build on the literature on the determinants of export performance to determine our model specification (e.g., Calì and te Velde 2011; Gnangnon 2019b; Gradeva and Martínez-Zarzoso 2015; Ju et al. 2010; Santos-Paulino 2007; Vijil and Wagner 2012). Given that, theoretically speaking, we expect development aid will influence export resilience due to its effect upon the overall productive capacities (including the eight components of the latter), we consider a baseline model where aid recipient countries’ export resilience depends on development aid flows, as well as other structural factors, such as their level of real per capita income, trade policy, and financial openness. All these variables are described in Appendix A.
The baseline model considered takes the following form:
RESIL it = β 0 + β 1 RESIL it 1 + β 2 Log ( AID ) it + β 3 Log ( GDPC ) it + β 4 Log ( TP ) it + β 5 FINPOL it + β 6 FINPOL i t 2 + μ i + γ t + ω it
where i and t are the subscripts for a country and the time-period, respectively. As noted above, the panel dataset used contains 93 countries, using data from the period 2002–2018, with data averaged over non-overlapping, three-year sub-periods to smooth out the effect of business cycles on the variables at hand. The sub-periods are: 2002–2004; 2005–2007; 2008–2010; 2011–2013; 2014–2016; and 2017–2018 (the last sub-period covers two years). β 0 to β 6 are coefficients that will be estimated. μ i are countries’ specific effects. γ t represent time dummies (i.e., global shocks that affect simultaneously all countries’ export resilience). ω it are random error terms.
To recall the dependent variable “RESIL”, which is the indicator of export resilience, the one period lag of this variable has been introduced as a regressor in model (1), with a view to address the eventual problem of omitted variables in model (1). In addition, this variable helps to account for the possible inertia of export resilience (i.e., a possible state of dependence in terms of export resilience).
The variable “AID” is the development aid variable. It could be the total development aid (“ODA”) or its two components (i.e., AfT flows (“AfT”), and NonAfT flows (“NonAfT”)). In light of the close (direct) link between AfT flows and the development of productive capacities, and given the importance of productive capacities (through their trade cost reduction effect) for export performance in aid recipient countries, we additionally examine how each of the three components of total AfT flows—as defined by the Organization for Economic Co-operation and Development (OECD)—affects export resilience. These three components of total AfT flows are: AfT flows for the build-up of economic infrastructure, denoted “AfTINFRA”; AfT flows for building productive capacities, denoted “AfTPROD”; and AfT flows related to trade policy and regulation, denoted “AfTPOL”. As with other aid variables, all three AfT components are real gross disbursements, and are expressed in constant USD, 2018 prices.
The variables “GDPC”, “TP”, and “FINPOL” represent the real per capita income, trade policy, and financial openness, respectively (i.e., capital account openness). The descriptive statistics of all variables in model (2) are provided in Appendix B.
All regressors, except for the variable measuring the level of capital account openness (denoted “FINPOL”), are transformed using the natural logarithm. This is because the variable “RESIL” is extracted as a residual of a regression (1) where the dependent variable and the regressor have been transformed using the natural logarithm. The variable “FINPOL” cannot be transformed into a natural logarithm because its values range between 0 and 1, and additionally, it does not have a skewed distribution.
The coefficients of all regressors (excluding “FINPOL”) in model (2) will be interpreted in terms of elasticity. It is also important to stress that the introduction of the squared term of the financial openness variable in model (2) is not guided by a theoretical framework6, but rather by intuition, in particular, the realization that when running regressions, there is a non-linear effect of financial openness upon export resilience. This relationship between financial openness and export resilience needs to be deeply investigated in future research. For the time being, we consider this variable to be a control variable in model (2).
As for the effect of control variables upon export resilience, we expect that aid recipient countries that have a high real per capita income are likely to experience a greater level of export resilience than those with a lower real per capita income. This is because such countries are not only likely to have a greater trade capacity than less advanced countries, but they are also likely to have many more resources (e.g., financial and human capital resources) to cope with shocks that would affect their exports, compared with countries that have lower income levels (e.g., poorest countries). Thus, we expect countries with a greater real per capita income to be associated with greater export resilience.
Trade policy can affect export resilience. In the wake of the COVID-19 pandemic, there have been calls for countries to refrain from adopting restrictive trade policies. This is because restrictive trade policies would further depress economies (by adding to the effect of the health crisis) by severely restricting trade flows, thus preventing exports of products needed to fight the pandemic (e.g., Bacchetta et al. 2021; Baldwin and Evenett 2020). Restrictive trade measures would also shrink the insurance role of GVCs, as well as their capacity to foster the resilience of economies during the pandemic (e.g., National Board of Trade Sweden 2020).
Trade policy liberalization can expose countries to shocks (e.g., Montalbano 2011), enhance countries’ vulnerability to shocks, and may consequently reduce their level of export resilience. In such a case, greater trade policy liberalization would be associated with lower export resilience. At the same time, trade policy liberalization can also help countries improve their innovation performance by allowing for knowledge diffusion and the transfer of technology (e.g., Aghion et al. 2015; Coelli et al. 2016; Grossman and Helpman 2015), enhancing export product diversification (e.g., Aditya and Acharyya 2015; Osakwe et al. 2018), or improving the complexity of economies (e.g., Sepehrdoust et al. 2019). In turn, greater export diversification can lead to lower output volatility, and thus, increase countries’ capacity to withstand external shocks (e.g., Balavac and Pugh 2016; Haddad et al. 2013). Similarly, greater economic complexity is associated with lower economic growth volatility (e.g., Maggioni et al. 2016; Miranda-Pinto 2021) as well as fewer economic growth cycles (e.g., Canh and Thanh 2020). Given that export resilience could be greater in the context of lower output volatility, we infer that trade policy liberalization would ultimately be associated with greater export resilience through its positive effect on innovation and export product diversification (or economic complexity). Overall, the net effect of trade policy liberalization on export resilience is unknown from an a priori perspective and would need to be determined empirically. This effect will be particularly negative if such liberalization does not lead countries to diversify their exports by including higher value-added products (and services), and subsequently positioning them alongside exports of low value-added products (which is the case with the LDCs, where export diversification is very limited).
Moreover, greater financial openness allows firms to have access to a wide range of financial instruments, at lower costs, and hence, it enhances their capacity to better diversify risks, and improve efficiency in terms of resource allocation (e.g., Acemoglu and Zilibotti 1997; Ariss 2016; Obstfeld 1994; Schmukler and Vesperoni 2006; Stulz 1999). In this context, greater financial openness can be associated with greater export resilience. Similarly, higher inflows of foreign direct investment (FDI) (due to greater financial openness) can result in lower real exchange rate volatility (e.g., Al-Abri 2013; Al-Abri and Baghestani 2015). This is because higher FDI inflows can improve factor productivity, they can stabilize both domestic consumption and investment spending through international risk-sharing (e.g., Agenor 2003), and they encourage greater competition and integration in both product and factor markets (e.g., Markusen and Venables 1999). As the volatility of the real exchange rate could induce a greater volatility of exports, we expect that higher FDI inflows (due to greater financial openness) could ultimately result in improved levels of export resilience. On the other hand, if greater financial openness amplifies financial distortions (e.g., Eichengreen and Leblang 2003), then it will not help enhance countries’ export resilience. Overall, the theoretical net effect of financial openness on export resilience is undetermined from an a priori perspective. Only an empirical exercise would provide a clear answer to this issue.

5. Econometric Approach

Given that we hypothesized that the effect of development aid on export resilience would work through the productive capacities channel, here, it is useful to start the empirical analysis by replicating the empirical work by Gnangnon (2021d). Recalling that Gnangnon (2021d) investigated the effect of development aid on the overall productive capacities, we used the model specification defined by the author, whereby the indicator of the overall productive capacities is regressed over its lags (one-period lag and two-period lag), the development aid variable, and a set of control variables. The latter includes trade openness (“OPEN”), the share of total revenue (excluding grants and social contributions) in GDP (denoted “TOTREV”), the real per capita income “GDPC”, and the indicator of financial openness. Note that for the sake of the analysis, the variables “OPEN” and “TOTREV” are not expressed as a percentage. The aid variables include total development aid, its components (AfT flows and NonAfT flows), as well as the components of the total AfT flows, with each aid variable being added one at a time during the regression. We refer the readers to Gnangnon (2021d) for the theoretical effects of these regressors. The description of all these variables, as well as their respective sources, are provided in Appendix A, whereas the descriptive statistics concerning them are displayed in Appendix B.
As in Gnangnon (2021d), all model specifications concerning the effect of development aid on the overall productive capacities, including the effect of each aid variable, are estimated using the two-step Generalized Method of Moments (GMM) estimator system by Blundell and Bond (1998). This involves estimating a system of equations that contains an equation in the first differences and an equation in the levels. Lagged first differences of variables are used as instruments for the level equation, and lagged levels of variables are used as instruments for the first-difference equation. Similarly, following Gnangnon (2021d), aid variables, and the variables “OPEN”, “TOTREV”, “FINPOL”, and “GDPC”, have been treated as endogenous. The estimates arising from these regressions are reported in Table 1. Three lags of the dependent variables, and two lags of endogenous variables, have been used as instruments in the regressions in order to meet the requirements of the two-step GMM technique, while avoiding over-instrumentation. These requirements include the presence of a first-order serial correlation in the residuals of the equations in the level, which was tested using the Arellano–Bond test (i.e., AR(1) test); the absence of a second-order autocorrelation in the residual of the differenced equation, tested using the Arellano–Bond test (i.e., AR(2) test); and the Sargan–Hansen test of over-identifying restrictions, which tests the null hypothesis of the joint validity of the instruments used in the system of equations.
Model (2), which includes specifications pertaining to this model with each aid variable, is also primarily estimated using the two-step GMM estimator system. Aid variables, and the variables “TP”, “FINPOL”, the squared term of the latter, and the variable “GDPC, have been treated as endogenous because of the possible bi-directional causality between the dependent variable and each of these regressors. This can be justified by the fact that even though we expect development aid flows to influence export resilience in recipient countries, we cannot rule out the possibility that countries with low export resilience (for example, countries where firms have little access to funding because of shallow domestic financial markets, or because access to international markets is very hard) might receive high amounts of development aid, including AfT flows from donor countries. Low levels of export resilience may also motivate countries to further liberalize their trade policies if they believe that the possible transfer of technologies, and the innovation arising from greater trade policy liberalization, could be instrumental in developing high quality export products, thus strengthening their export resilience. The same reasoning applies to the financial openness variable. For example, countries vulnerable to shocks, that concurrently have low levels of export resilience and a low degree of financial openness, may opt to further open up their capital account, insofar as the latter could help firms have access to funding at low costs during crises. Finally, strengthening export resilience can contribute to improving trading firms’ income and promote exports, which can, in turn, improve countries’ levels of real per capita income (in light of the possible positive relationship between export performance and real per capita income).
The estimation of model (2), as well as several of its variants presented below, also uses three lags for the dependent variables and two lags for endogenous variables as instruments. Even though the two-step GMM system facilitates our main technique to estimate model (2) and its different variants, it might be useful to start the analysis of the effect of development aid on export resilience by estimating several specifications of model (2) (i.e., with each of the aid variables described above) without the lagged dependent variable as regressor. In these specifications, all regressors have been considered with a one-period lag, with a view to mitigating the endogeneity concerns relating to these variables. The specifications of model (2) are estimated using the within fixed effects estimator, where standard errors have been corrected using the approach formulated by Driscoll and Kraay (1998). This approach helps take into account the heteroscedasticity, autocorrelation, and cross-sectional dependence in the dataset. The results of the estimation of these different specifications, of the static version of model (2) (i.e., with different aid variables), are presented in Table 2.
Next, we move to the different variants of dynamic model (2), which was estimated using the two-step GMM approach. Here, it is important to underline that when estimating all specifications of dynamic model (2), we noticed that only using the one-period lag of the dependent variable as a regressor was not sufficient to meet the conditions set out above for the validity of the two-step GMM system technique. Rather, the use of both the one-period and the two-period lag of the dependent variable as regressors in dynamic model (2) helped to meet these conditions for the validity of the two-step GMM estimator system. This was likely due to the strong state-dependence nature of the export resilience indicator.
Noting the results in Table 2 (results based on the fixed effects approach), we obtain that at the 5% level, all development aid variables positively and significantly influence export resilience. Moreover, total development aid flows positively drive export resilience, and this finding reflects a higher positive effect of NonAfT flows than that of AfT flows on export resilience. Within the category of AfT flows, we note that all three components of total AfT flows positively influence export resilience at almost the same magnitude. Thus, later in the analysis, we can examine whether the effect of development aid on productive capacities works through the avenue of overall productive capacities. Regarding control variables, it appears that an improvement in real per capita income and greater trade policy liberalization are associated with greater export resilience. Finally, at the 1% level, there is a non-linear effect of financial openness on export resilience in the form of an inverted-U curve; a low degree of financial openness is associated with low levels of export resilience, and export resilience becomes stronger with higher levels of financial openness. Table 3 contains the outcomes obtained by estimating the dynamic model (2) where the variable “AID” is measured using each of the three aid variables (i.e., total development aid, AfT flows, NonAfT flows, and each of the three components for AfT flows). These outcomes serve to examine the effect of development aid on export resilience.
Columns (3) to (8) of Table 4 contain the estimates arising from the estimation of many other variants of dynamic model (2), in which we introduce the indicator of overall productive capacities, and where each aid variable has interacted with the indicator of the overall productive capacities. These outcomes serve to examine whether the effect of development aid upon export resilience works through the productive capacities channel. In column (1) of Table 4, we present the results arising from the estimation of a specification of model (2), where the variable “AID” has been replaced with the indicator of the overall productive capacities. In doing so, it is possible to examine the effect of the overall productive capacities on export resilience in the absence of the aid variable in the model. Column (2) of Table 4 reports the outcomes of the estimation of another variant of model (2) in which we include both the total development aid variable and the indicator of productive capacities (expressed in natural logarithm). If both variables hold significant coefficients (particularly if these coefficients are positive), we can deduce that there are likely other channels (in addition to the productive capacities) through which development aid can affect export resilience. In contrast, if one variable (for example, the index “PCI”) has a statistically significant coefficient, and the other variable does not have a significant coefficient, then we can infer that the effect of development aid upon export resilience essentially translates through the productive capacities channel.
Table 5 and Table 6 report outcomes that allow checking the robustness of results reported in Table 3 and Table 4, respectively. In fact, we observed the presence of some outliers in the right-hand side of the graph in Figure 2, and in the two graphs of Figure 3. These outliers notably concern countries where values of the indicator of export resilience are higher than 1 and lower than −1. Four outlier countries (Burkina Faso; Guinea; Malawi; Sierra Leone) meet these conditions; therefore, we excluded these four countries from the sample, and re-ran two sets of regressions. The first set concerns the different specifications of model (2), the results of which are reported in Table 3, and the second set of regressions concerns the different specifications of model (2), the results of which are reported in Table 4. The outcomes of the first set of regressions are presented in Table 5, whereas the results of the second set of regressions are displayed in Table 6.

6. Interpretation of Empirical Outcomes

At the outset, we would like to note that the results of the diagnostic tests used to test the validity of the two-step GMM estimator system (see the bottom of Table 1 and Table 3, Table 4, Table 5 and Table 6) confirm that this estimator can be appropriately used to perform empirical analysis. As noted by Gnangnon (2021d), the two lags of the dependent variable in Table 1 have statistically significant coefficients (at the 1% level). These results suggest that the indicator of overall productive capacities displays a strong state dependence path. Likewise, the indicator of export resilience also shows a strong state dependence path, whereby export resilience in period t − 1 and export resilience in period t − 2 positively and negatively (at the 1% level) influence export resilience in period t, respectively. In Table 1, and Table 3, Table 4, Table 5 and Table 6, the p-values of the AR(1) and AR(2) tests are lower than 0.10 (i.e., the 10% level of statistical significance) and higher than 0.10, respectively. Additionally, the p-values of the over-identifying restrictions test are always higher than 10%, thereby indicating the joint validity of instruments used in the regressions.
The results in Table 1 confirm the findings by Gnangnon (2021d), in that higher development aid flows exert a positive effect upon productive capacities. In fact, here, we find (as in Gnangnon 2021d) that the coefficients of all aid variables are positive and significant at the 1% level, thereby suggesting that all aid variables, including total development aid, its two components (namely, total AfT flows and NonAfT flows), as well as the three components of total AfT flows positively and significantly influence productive capacities. It appears that total AfT flows exert a slightly higher positive effect (in terms of the magnitude of the effect) than NonAfT flows on the overall productive capacities. Additionally, among AfT components, AfT interventions for building productive capacities exert the highest positive effect (in terms of magnitude, which is 0.252) on productive capacities. This is followed by AfT interventions for economic infrastructure (the magnitude of the effect being 0.161) and AfT interventions for trade policy and regulation (the magnitude of the effect being 0.096). With regard to control variables, we observe that the rise in real per capita income and greater financial openness are positively associated with the development of productive capacities. At conventional significance levels, trade openness and public revenue do not affect the overall productive capacities.
Results in Table 3 confirm the findings in Table 2, concerning the effect of development aid variables upon export resilience. We find that at the 1% level, all aid variables hold positive and significant coefficients. NonAfT flows appear to exert a higher positive effect on export resilience than AfT flows. Among AfT components, AfT for productive capacities exert, in terms of magnitude, the highest positive effect upon export resilience. This is followed by AfT for economic infrastructure, then AfT for trade policy and regulation. A one percent increase in total development aid flows generates an increase in export resilience by 0.1%. A one percent increase in total AfT flows induces a 0.07 percentage increase in the values of the index of export resilience. An increase in NonAfT flows by one percent is associated with a rise in the index of export resilience by 0.126. The magnitude of the effect of each of the three components of total AfT flows on export resilience amounts to 0.083 for AfT for productive capacities, 0.054 for AfT for economic infrastructure, and 0.027 for AfT related to trade policy and regulation, respectively. Moreover, across all columns of Table 3, real per capita income does not significantly affect export resilience at the 10% level. In column (1) of Table 3, trade policy liberalization does not significantly influence export resilience at the 10% level, whereas in other columns of Table 3, the indicator of trade policy displays alternate non-significant coefficients (see column (6)), and negative and significant coefficients (at least at the 10% level). Financial openness exerts a non-linear effect—in the form of a U-curve—on export resilience. In particular, financial openness reduces export resilience when its level is lower than 0.56 = 0.557/(2 × 0.496), and it enhances export resilience at higher levels of financial openness. This finding confirms the fact that high levels of financial openness generate greater export resilience.
Turning to the estimates in Table 4, we note from column (1) that at the 5% level, the development of the overall productive capacities exerts a positive effect on export resilience (the coefficient of “PCI” is positive and significant at the 5% level). A one percent increase in the index of productive capacities is associated with a 0.27 percent increase in the values of the index of export resilience. From column (2), we note that both total development aid and the index of overall productive capacities variables have significant coefficients at the 1% level; however, the coefficient of the variable “PCI” (in Logs) becomes negative, whereas the coefficient of “ODA” (in Logs) remains positive. These results in columns (1) and (2) of Table 4 suggest the existence of an interaction between these two variables in influencing export resilience. This can also signify that the effect of total development aid on export resilience does not only work through the channel of productive capacities. There are likely channels other than the productive capacities channel (such as the real exchange rate volatility channel—as mentioned in Section 2) through which development aid can influence export resilience. These channels would need to be investigated in future research.
We now consider the results in the other columns (i.e., from column (3) to (8)) of Table 4. Starting with estimates in column (8), we observe that neither the coefficient of the variable “AfTPOL”, nor the coefficient of the interaction variable (“[Log(AfTPOL)]*[Log(PCI)]”), are significant at the conventional significance levels; therefore, we conclude that AfT interventions for trade policy and regulation, as well as productive capacities, do not jointly influence export resilience. Moreover, we obtain from estimates in columns (3) to (7), that development aid variables hold positive and significant coefficients (at the 1% level), whereas the interaction terms of the interaction between each aid variable and the indicator of overall productive capacities are all negative and significant at the 1% level. Taking the estimates concerning the relevant aid variable and the interaction term in the columns (3) to (7) together, we can conclude that the magnitude of the effect of development aid (either total development aid, its two components, or AfT for economic infrastructure and AfT for productive capacities) upon export resilience decreases as countries’ levels of productive capacities increases, and it may eventually become negative for countries with a high level of productive capacities. In other words, these five development aid variables exert their highest (in terms of magnitude) positive effect upon export resilience in countries with the lowest degree of productive capacities (e.g., poor countries). Hence, there is a turning point for the variable “PCI”, beyond which the total effect of the relevant aid variable upon export resilience becomes negative. The values of the turning point for “PCI” are computed and reported at the bottom of Table 4. These values are 33.74, 35.55, 36.2, 35.8, and 35, when the relevant aid variable is total development aid, AfT, NonAfT, AfT for economic infrastructure, and AfT for productive capacities, respectively. As per Appendix B, values of “PCI” range between the 15.4 and 37.3, interval that contains all values of turning points of “PCI” reported in Table 4. On the basis of these outcomes, we conclude that development aid enhances export resilience in countries that have low levels of productive capacities, and the lower the degree of productive capacities, the greater the magnitude of the positive effect of development aid variables upon export resilience (development aid variables measured here by total development aid, its two components, or AfT for economic infrastructure and AfT for productive capacities).
Results related to control variables in Table 4 show that at the 5% level, the real per capita income tends to be positively associated with export resilience, whereas there is no significant effect of trade policy on export resilience. The estimates also confirm the existence of a non-linear effect of financial openness on export resilience.
Outcomes in Table 5 and Table 6 (based on the sample without outliers) help check the robustness of findings reported in Table 3 and Table 4, respectively. We note that outcomes reported in Table 5 are similar to those in Table 3, including in terms of statistical significance of estimates. In particular, coefficients of aid variables in Table 5 are similar to the estimates of aid variables reported in Table 3. Thus, we conclude that all aid variables, including total development aid flows, AfT flows (including its three components) and NonAfT flows exert a positive effect on export resilience, with the effect of NonAfT flows on export resilience being slightly higher than that of AfT flows. Additionally, among the components of AfT flows, AfT for productive capacities appears to exert the highest positive effect on export resilience, followed by AfT for economic infrastructure and AfT for trade policy and regulations.
Findings in Table 6 are in line with those in Table 4, with the exception of the effect of AfT related to trade policy and regulation. Moreover, in all columns of Table 6, the coefficient of all aid variables are positive and significant at the 1% level, and the interaction variable between each aid variable and the indicator of overall productive capacities always holds a negative and significant (at the 1% level) coefficient. We conclude that the magnitude of the positive effect of development aid (whatever the aid variable considered) upon export resilience decreases as the level of productive capacities increases, and may decline for very high levels of productive capacities. The turning point of “PCI”, above which this effect may become negative is given by 34.53; 37.21; 38.23; 36.16; 33.82; and 40.5 when the relevant aid variable is total development aid, AfT, NonAfT, AfT for economic infrastructure, AfT for productive capacities, and AfT for trade policy and regulation, respectively. It is noteworthy that values of “PCI” in the full sample excluding the four country outliers mentioned above, still range from 15.4 to 37.3. The only value among the turning points of “PCI” reported in Table 6 that exceeds the maximum value of “PCI” in the sample (including excluding outlier countries) is 40.5. We conclude that for all aid variables, the lower the level of productive capacities, the higher is the magnitude of the positive effect of a relevant aid variable on export resilience. In other words, countries with low levels of overall productive capacities enjoy a higher positive effect of development aid (regardless of the aid variable considered) upon export resilience than countries with relatively higher levels of productive capacities. This positive effect of development aid on export resilience may turn out to be negative for very high levels of productive capacities, notably for the following aid variables: total development aid, AfT, NonAfT, AfT for economic infrastructure, and AfT for productive capacities. The effect of AfT for trade policy and regulation on export resilience is always positive for every level of productive capacities, but its magnitude falls as the level of productive capacities increases.
Results associated with control variables in Table 6 are consistent with those in Table 5.

7. Conclusions

The COVID-19 health crisis, as with other major crises (e.g., the 2008 financial crisis) has severely impacted trade flows, in particular countries’ exports. With the assistance of international organizations, countries have been exploring ways and means to recover from the pandemic, including strengthening the resilience of value chains and trade flows against future shocks. For example, in that context, the theme of the 2021 WTO Public Forum, which is expected to take place from 28–30 September 2021, is “Trade Beyond COVID-19: Building Resilience”. The current paper aims to contribute to this debate by shedding light on the relationship between development aid flows, in particular, AfT flows and export resilience. The paper argues that productive capacities represent the main channel through which development aid can influence export resilience.
The analysis has relied on a sample of 93 aid recipient countries, using data from the period 2000–2018. First, the results confirmed that development aid, including both AfT flows and NonAfT flows, fosters productive capacities in recipient countries. Second, through their positive effect upon productive capacities, total development aid flows (including AfT flows and NonAfT flows) contribute to enhancing export resilience in recipient countries, with the effect of NonAfT flows being higher than that of AfT flows. Additionally, all components of AfT flows, including AfT flows for economic infrastructure, AfT flows for productive capacities, and AfT flows for trade policy and regulation influence, positively export resilience, with AfT flows for productive capacities exerting the highest positive effect upon export resilience, followed by AfT for economic infrastructure, and AfT for trade policy and regulation.
These findings show that if donor countries were to help developing countries to build the resilience of their exports, donor countries should allocate higher aid flows to countries with low levels of productive capacities. These countries include less advanced developing countries, notably the poorest among them (i.e., the LDCs), because they are not only those in most need of aid flows (given their limited financial resources to address their huge development challenges), but they are also those that experience the lowest levels of productive capacities.
In the wake of the COVID-19 pandemic, both developing countries and advanced economies are exploring ways to build the resilience of their economies to mitigate the effects of future shocks, including economic, financial, environmental, and health-related shocks. At the same time, it is well established in the literature that developing economies (particularly the poorest among them) are more vulnerable to shocks than advanced economies, and are additionally constrained by a lack of resources (in terms of financial, human capital, and technology). These resource constraints do not only limit their capacity to cope with shocks (if the latter does occur), but they also prevent these countries from strengthening their productive capacities and developing strong resilient economies against future shocks. Thus, they need greater support (e.g., financial, technological, technical assistance) from the international community, including support from wealthier (advanced) economies, in their efforts to enhance their productive capacities (considered in a larger sense), with a view to strengthening the resilience of their economies against future adverse events.
An avenue for future research could be to develop other measures of export resilience, and to explore other possible channels (apart from the productive capacities channel), through which development aid can influence export resilience.

Funding

This research received no external funding.

Data Availability Statement

Data used in the present analysis could be obtained upon request.

Conflicts of Interest

This article represents the personal opinions of individual staff members and is not meant to represent the position or opinions of the WTO or its Members, nor the official position of any staff members. The author thanks the three anonymous Reviewers for their comments that help improve the quality of the paper. Any errors or omissions are the fault of the author.

Appendix A

Table A1. Definition and source of variables.
VariablesDefinitionSource
RESILIndicator of Export ResilienceAuthor’s computation—see Section 3
PCIThe overall Productive Capacity Index. It measures the level of productive capacities along three pillars: “the productive resources, entrepreneurial capabilities and production linkages which together determine the capacity of a country to produce goods and services and enable it to grow and develop” (UNCTAD 2006).
It is computed as a geometric average of eight domains or categories, namely: information communication and technologies (ICTs), structural change, natural capital, human capital, energy, transport, the private sector, and institutions. Each category index is obtained from the principal components extracted from the underlying indicators, weighted by their capacity to explain the variance of the original data. The category indices are normalized into 0–100 intervals.
United Nations Conference on Trade and Development (UNCTAD) Statistics portal: https://unctadstat.unctad.org/wds/ReportFolders/reportFolders.aspx (accessed on 10 March 2021)
See UNCTAD (2020) for a complete description of the methodology used to compute the indicator “PCI”.
ODA,
AfTTOT, AfTINFRA, AfTPROD, AfTPOL
“ODA” is the real gross disbursements of the total Official Development Assistance (ODA), expressed in constant USD, 2018 prices.
“AfTTOT” is the total real gross disbursements of Aid for Trade. “AfTINFRA” is the real gross disbursements of Aid for Trade allocated to the build-up of economic infrastructure. “AfTPROD” is the real gross disbursements of Aid for Trade for building productive capacities.
“AfTPOL” is the real gross disbursements of Aid allocated for trade policies and regulation. All four AfT variables are expressed in constant USD, 2018 prices.
Author’s calculation based on data extracted from the OECD statistical database on development, in particular, the OECD/DAC-CRS (Organization for Economic Cooperation and Development/Donor Assistance Committee)-Credit Reporting System (CRS). Aid for Trade data cover the following three main categories (the CRS Codes are in brackets):
Aid for Trade for Economic Infrastructure (“AfTINFRA”), which includes transport and storage (210), communications (220), and energy generation and supply (230);
Aid for Trade for Building Productive Capacity (“AfTPROD”), which includes banking and financial services (240), business and other services (250), agriculture (311), forestry (312), fishing (313), industry (321), mineral resources and mining (322), and tourism (332); and
Aid for Trade policy and regulations (“AfTPOL”), which includes trade policy and regulations and trade-related adjustment (331).
NonAfTTOTThis is the measure of the development aid allocated to sectors in the economy other than the trade sector. It has been computed as the difference between the gross disbursements of total ODA and the gross disbursements of total Aid for Trade (both being expressed in constant prices 2018, USD).Author’s calculation based on data extracting from the OECD/DAC-CRS database.
EXPORTExports of goods and services (constant 2010 USD)World Bank Indicators (WDI)
EVIThis is indicator of structural economic vulnerability, also referred to as the Economic Vulnerability Index. It has been set up by the United Nations, specifically, the Committee for Development Policy (CDP), and has been used by the latter as one of the criteria for identifying LDCs. It has been computed on a retrospective basis for 145 developing countries (including 48 LDCs) by the “Fondation pour les Etudes et Recherches sur le Developpement International (FERDI)”. The EVI has been computed as the simple arithmetic average of two sub-indexes, namely, the intensity of exposure to shocks (exposure sub-index) and the intensity of exogenous shocks (shocks sub-index). These two sub-indexes have been calculated using a weighted average of different component indexes, with the sum of the components’ weights equalling one so that the values of EVI range between 0 and 100. For further details on the computation of the EVI, see for example Feindouno and Goujon (2016). Data on EVI is extracted from the database of the Fondation pour les Etudes et Recherches sur le Developpement International (FERDI)—see online at: https://ferdi.fr/donnees/un-indicateur-de-vulnerabilite-economique-evi-retrospectif (accessed on 10 March 2021)
TOTREVThis is the share of total public revenue (excluding grants and social contributions) in GDP. This variable is not expressed as a percentage. Public Revenue Dataset developed by the United Nations University World Institute for Development Economics Research (UNU-WIDER). See online: https://www.wider.unu.edu/project/government-revenue-dataset (accessed on 10 March 2021)
OPENThis is the indicator of trade openness, measured by the share of the sum of exports and imports of goods and services in GDP. This variable is not expressed as a percentage.Authors’ calculation based on data extracted from the WDI.
GDPCPer capita Gross Domestic Product (constant 2010 USD).WDI
TPThis is the indicator of trade policy, measured by the trade freedom score. The latter is a component of the Economic Freedom Index. It is a composite measure of the absence of tariff and non-tariff barriers that affect imports and exports of goods and services. The trade freedom score is graded on a scale of 0 to 100, with an increase in value indicating lower trade barriers (i.e., higher trade liberalization, whereas a decrease in value reflects increasing trade protectionism).Heritage Foundation (see Miller et al. 2021)
FINPOLThis is the measure of financial policy (i.e., de jure financial openness).This index has been computed by Chinn and Ito (2006) and was updated in July 2020. Its value ranges between 0 and 1. See: http://web.pdx.edu/~ito/Chinn-Ito_website.htm (accessed on 10 March 2021).
For the purpose of the present study, we have transformed this index by multiplying its values by 100; thus, here, its values range between 0 and 100.

Appendix B

Table A2. Descriptive statistics on variables used in the analysis.
VariableObservationsMeanStandard DeviationMinimumMaximum
RESIL3270.1080.252−0.8681.443
EXPORT327442008710076559000
EVI32731.4410.8069.224270.045
ODA3279671060116090
AfTTOT3272944750.0547623650
AfTINFRA3271823310.011763110
AfTPROD3271071790.0167981890
AfTPOL3255.035215.20.001103248
NonAfTTOT327673680113610
PCI32526.9354.78715.42837.281
TOTREV2890.1930.0880.0620.776
OPEN3270.7290.3190.1992.043
TP32771.0949.69132.73389.000
FINPOL3270.3960.3270.0001.000
GDPC3273960.7013889.988212.47219,111.660
Note: The variables “EXPORT”, “ODA”, “AfTTOT”, “AfTINFRA”, “AfTPROD”, “AfTPOL”, and “NonAfTTOT” are expressed in USD million.

Appendix C

Table A3. List of countries contained in the full sample.
Full Sample
AlgeriaGabonMozambique
AngolaGambia, TheMyanmar
ArgentinaGeorgiaNamibia
ArmeniaGhanaNepal
BangladeshGuatemalaNicaragua
BelizeGuineaNiger
BeninGuinea-BissauNigeria
BhutanHaitiOman
BoliviaHondurasPakistan
Bosnia and HerzegovinaIndiaPanama
BrazilIndonesiaParaguay
Burkina FasoIran, Islamic Rep.Peru
BurundiJamaicaPhilippines
Cabo VerdeJordanRwanda
CambodiaKazakhstanSenegal
CameroonKenyaSierra Leone
Central African RepublicKyrgyz RepublicSouth Africa
ChadLao PDRSri Lanka
ChileLebanonSudan
ColombiaLesothoTanzania
ComorosLiberiaThailand
Congo, Dem. Rep.LibyaTogo
Congo, Rep.MadagascarTunisia
Costa RicaMalawiTurkey
Cote d’IvoireMalaysiaUganda
Dominican RepublicMaliUruguay
EcuadorMauritaniaUzbekistan
Egypt, Arab Rep.MauritiusVenezuela, RB
El SalvadorMexicoVietnam
Equatorial GuineaMongoliaZambia
EswatiniMroccoZimbabwe

Notes

1
Information on the launch of this indicator can be found online at: https://unctad.org/fr/node/32056 (accessed on 10 March 2021).
2
The category of LDCs has been designated as such by the United Nations, and is used to refer to the poorest and most vulnerable countries to external and environmental shocks (for further information on LDCs, see online at: https://www.un.org/ohrlls/content/least-developed-countries (accessed on 10 March 2021)).
3
4
These included, for example, the insufficient development of hard and soft infrastructure that increases trade costs and erodes countries’ competitiveness in the international trade market.
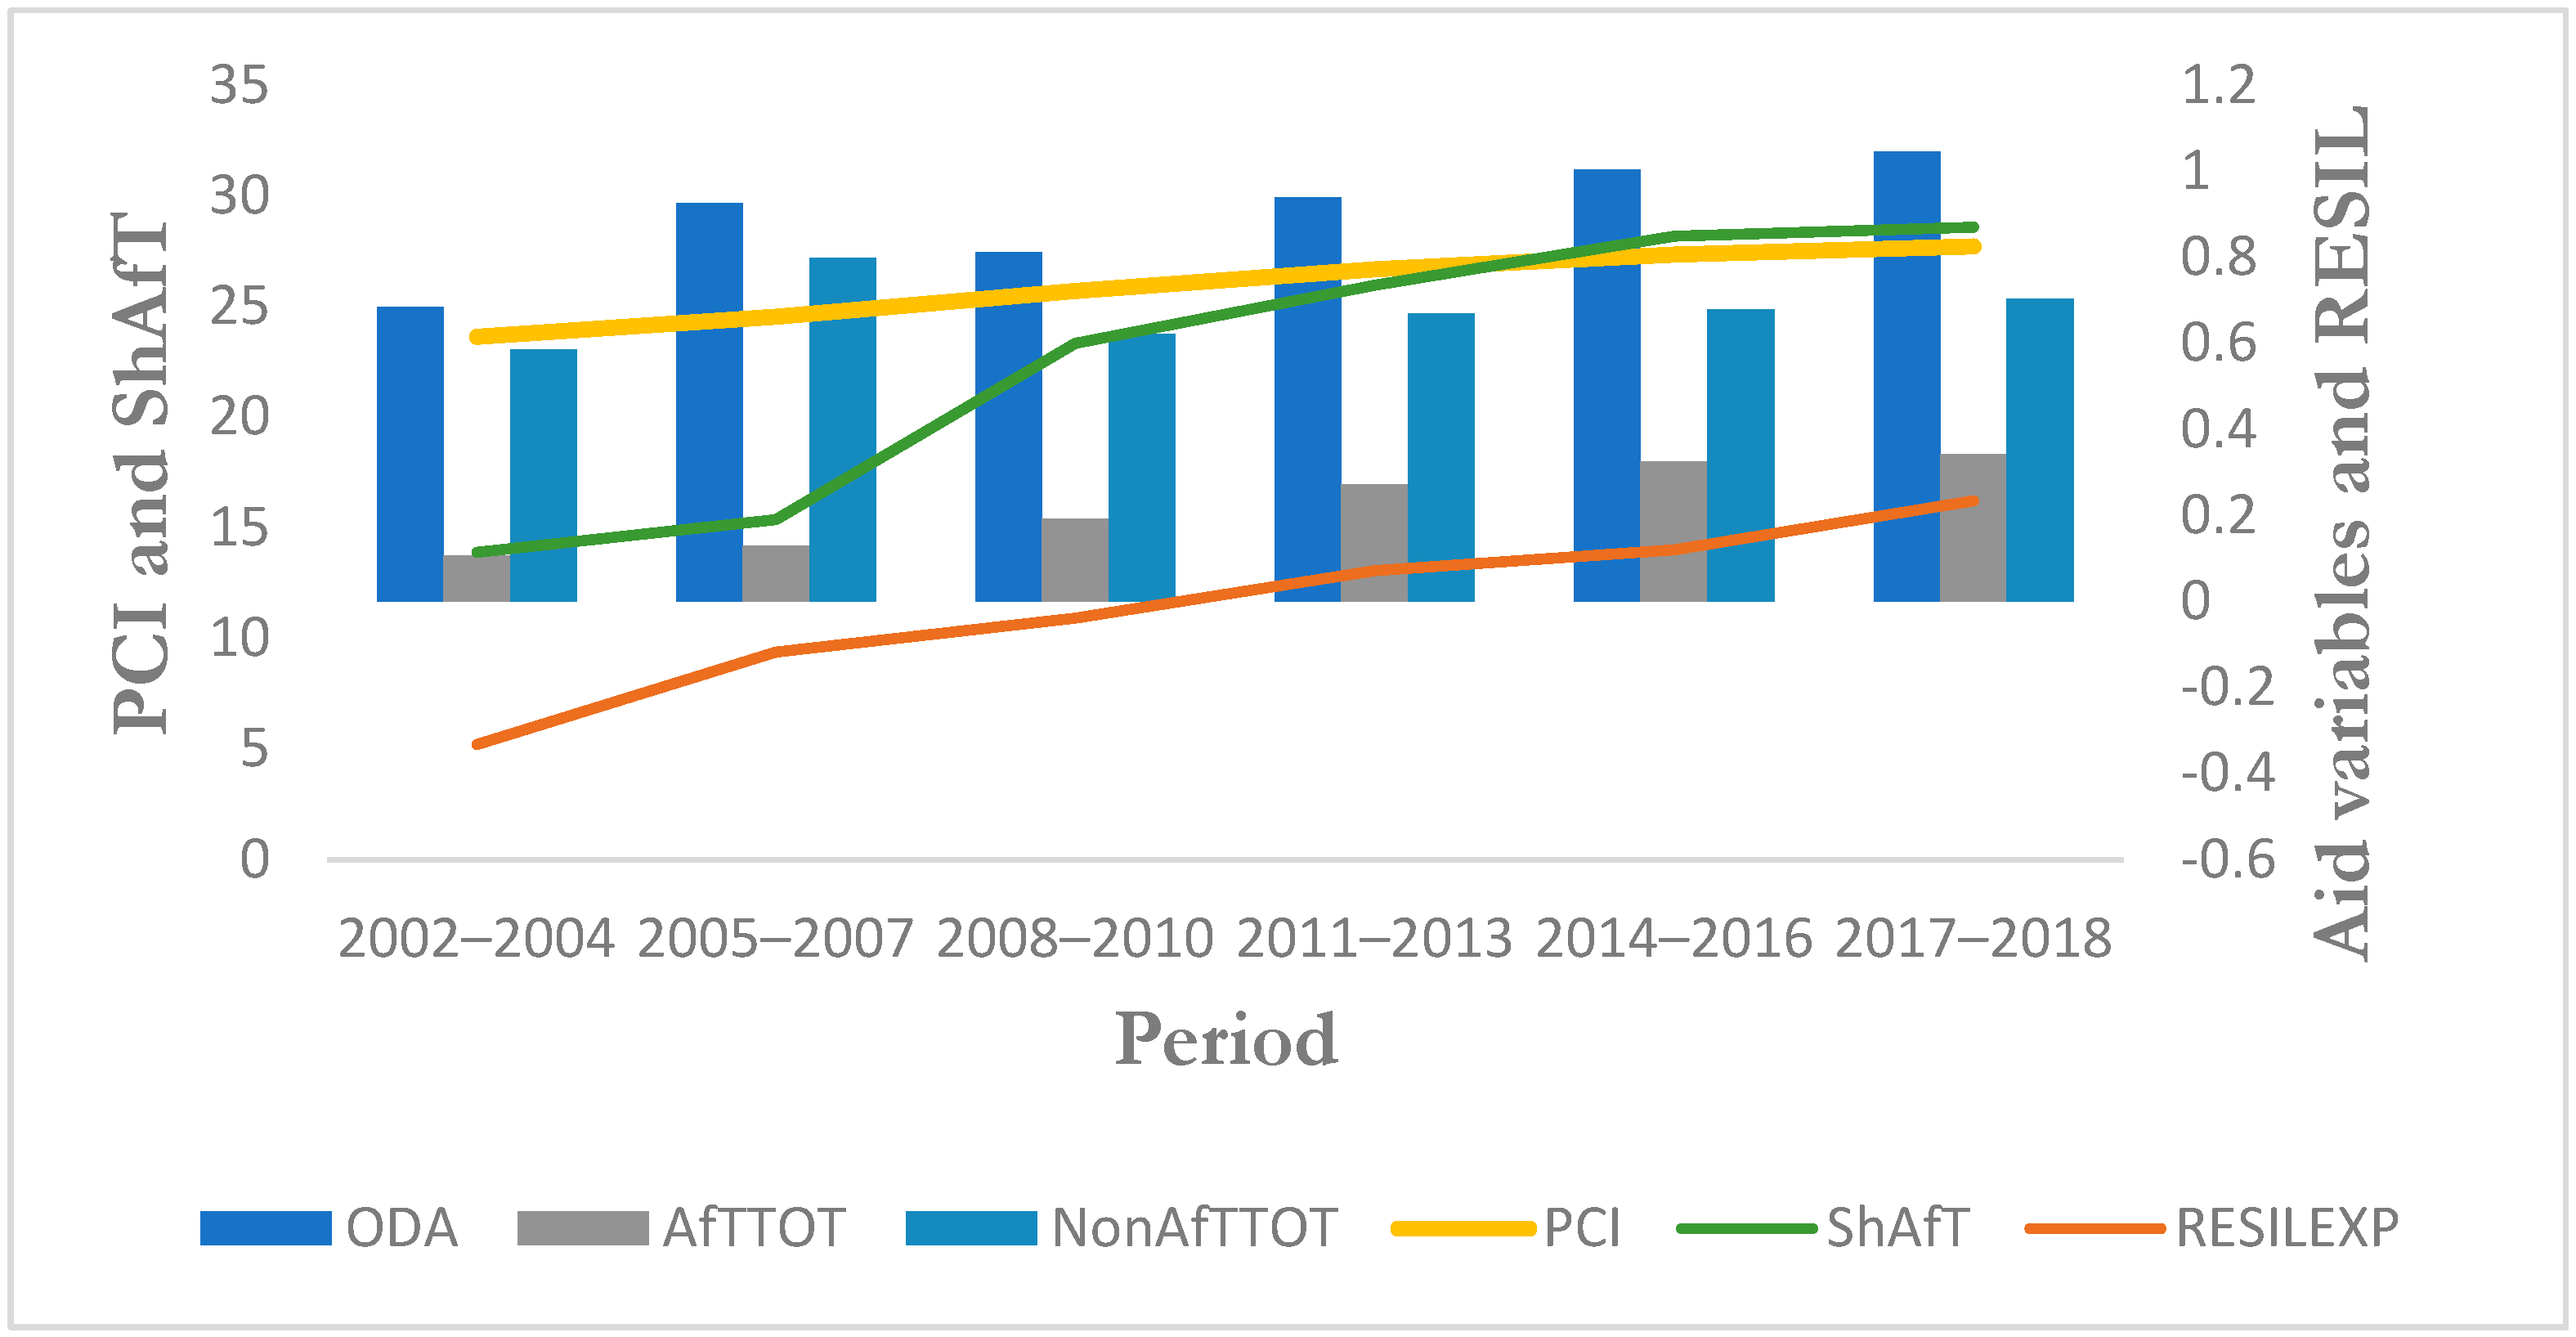
5
As used in the empirical analysis, data has been averaged over non-overlapping sub-periods of three years. These sub-periods are: 2002–2004; 2005–2007; 2008–2010; 2011–2013; 2014–2016; and 2017–2018.
6
As mentioned earlier, there is no theoretical framework on the determinants of export resilience.

References

  1. Acemoglu, Daron, and Fabrizio Zilibotti. 1997. Was prometheus unbound by chance? Risk, diversification, and growth. Journal of Political Economy 105: 709–51. [Google Scholar] [CrossRef] [Green Version]
  2. Acemoglu, Daron, Simon Johnson, James Robinson, and Yunyong Taicharoen. 2003. Institutional causes, macroeconomic symptoms: Volatility, crises and growth. Journal of Monetary Economics 50: 49–123. [Google Scholar] [CrossRef] [Green Version]
  3. Aditya, Anwesha, and Rajat Acharyya. 2015. Trade liberalization and export diversification. International Review of Economics & Finance 39: 390–410. [Google Scholar]
  4. Agenor, Pierre-Richard. 2003. Benefits and costs of international financial integration: Theory and facts. The World Economy 26: 1089–118. [Google Scholar] [CrossRef]
  5. Aghion, Philippe, Akcigit Ufuk, and Howitt Peter. 2015. The Schumpeterian Growth Paradigm. Annual Review of Economics 7: 557–75. [Google Scholar] [CrossRef] [Green Version]
  6. Aghion, Philippe, Emmanuel Farhi, and Kharroubi Enisse. 2019. Monetary Policy, Product Market Competition and Growth. Economica 86: 431–70. [Google Scholar] [CrossRef] [Green Version]
  7. Al-Abri, Almukhtar. 2013. Real exchange rate volatility, terms-of-trade shocks, and financial integration in primary-commodity exporting economies. Economics Letters 120: 126–29. [Google Scholar] [CrossRef]
  8. Al-Abri, Almukhtar, and Baghestani Hamid. 2015. Foreign investment and real exchange rate volatility in emerging Asian countries. Journal of Asian Economics 37: 34–47. [Google Scholar] [CrossRef]
  9. Amiti, Mary, and Weinstein David E. 2011. Exports and Financial Shocks. The Quarterly Journal of Economics 126: 1841–77. [Google Scholar] [CrossRef]
  10. Anderson, James E., and Eric van Wincoop. 2001. Gravity with Gravitas: A Solution to the Border Puzzleí. National Bureau of Economic Research Working Paper 8079. Cambridge: NBER. [Google Scholar]
  11. Andersson, Martin, and Johansson Sara. 2010. Human capital and the structure of regional export flows. Technology in Society 32: 230–40. [Google Scholar] [CrossRef]
  12. Anderton, Robert, Benedetta Di Lupidio, and Jarmulska Barbara. 2020. The impact of product market regulation on productivity through firm churning: Evidence from European countries. Economic Modelling 91: 487–501. [Google Scholar] [CrossRef]
  13. Andrews, Dan, and Saia Alessandro. 2017. Coping with Creative Destruction: Reducing the Costs of Firm Exit. OECD Economics Department Working Papers No. 1353. Paris: OECD Publishing. [Google Scholar]
  14. Ariss, Rima Turk. 2016. Legal Systems, Capital Structure, and Debt Maturity in Developing Countries. Corporate Governance 24: 130–44. [Google Scholar] [CrossRef]
  15. Asheghian, Parviz, and Saidi Reza. 2002. Commodity Concentration and Export Earning Instability: The Case of Venezuela. Development Policy Review 17: 419–27. [Google Scholar] [CrossRef]
  16. Auboin, Marc, and Meier-Ewert Moritz. 2003. Improving the Availability of Trade Finance during Financial Crises. WTO Discussion Paper. Geneva: World Trade Organization, Available online: https://www.wto.org/english/res_e/booksp_e/discussion_papers2_e.pdf (accessed on 10 March 2021).
  17. Bacchetta, Marc, Bekkers Eddy, Piermartini Roberta, Rubinova Stela, Stolzenburg Victor, and Xu Ankai. 2021. COVID-19 and Global Value Chains—A Discussion of Arguments on Value Chain Organization and the Role of the WTO. WTO Staff Working Paper ERSD-2021-3. Geneva: World Trade Organization. [Google Scholar]
  18. Bahar, Dany, and Santos Miguel A. 2018. One more resource curse: Dutch disease and export concentration. Journal of Development Economics 132: 102–14. [Google Scholar] [CrossRef] [Green Version]
  19. Balavac, Merima, and Pugh Geoff. 2016. The link between trade openness, export diversification, institutions and output volatility in transition countries. Economic Systems 40: 273–87. [Google Scholar] [CrossRef]
  20. Baldwin, Richard, and Evenett Simon. 2020. Introduction. In COVID-10 and Trade Policy: Why Turning Inward Won’t Work. Edited by Richard Baldwin and Simon J. Evenett. A VoxEU.org eBook. London: CEPR Press. [Google Scholar]
  21. Baldwin, Richard, and Tomiura Eiichi. 2020. Thinking ahead about the trade impact of COVID-19. In Economics in the Time of COVID-19. Edited by Baldwin and Weder di Mauro. A VoxEU.org eBook. London: CEPR Press, chp. 5. [Google Scholar]
  22. Barkas, Panagiotis, Honeck Dale, and Colomer Ester Rubio. 2020. International Trade in Travel and Tourism Services: Economic Impact and Policy Responses during the COVID-19 Crisis. Staff Working Paper ERSD-2020-11. Geneva: World Trade Organization (WTO). [Google Scholar]
  23. Barlow, Pepita, May van Schalkwyk, McKee Martin, Labonté Ron, and Stuckler David. 2021. COVID-19 and the collapse of global trade: Building an effective public health response. The Lancet Planetary Health 5: e102–e107. [Google Scholar] [CrossRef]
  24. Bas, Maria. 2020. The effect of communication and energy services reform on manufacturing firms’ innovation. Journal of Comparative Economics 48: 339–62. [Google Scholar] [CrossRef]
  25. Bassanini, Andrea, and Romain Duval. 2007. The determinants of unemployment across OECD countries: Reassessing the role of policies and institutions. OECD Economic Studies 2007: 7–86. [Google Scholar] [CrossRef] [Green Version]
  26. Belhadi, Amine, Kamble Sachin, Chiappetta Jose Charbel Jabbour, Gunasekaran Angappa, Ndubisi Nelson Oly, and Venkatesh Mani. 2021. Manufacturing and service supply chain resilience to the COVID-19 outbreak: Lessons learned from the automobile and airline industries. Technological Forecasting & Social Change 163: 120447. [Google Scholar]
  27. Bleaney, Michael, and David Greenaway. 2001. The Impact of Terms of Trade and Real Exchange Volatility on Investment and Growth in Sub-Saharan Africa. Journal of Development Economics 65: 491–500. [Google Scholar] [CrossRef]
  28. Blundell, Richard, and Stephen Bond. 1998. Initial Conditions and Moment Restrictions in Dynamic Panel Data Models. Journal of Econometrics 87: 115–43. [Google Scholar] [CrossRef] [Green Version]
  29. Bowen, Alex, Cochrane Sarah, and Fankhauser Sameul. 2012. Climate change, adaptation and economic growth. Climatic Change 113: 95–106. [Google Scholar] [CrossRef] [Green Version]
  30. Bravo-Ortega, Claudio, and Julian Di Giovanni. 2006. Remoteness and Real Exchange Rate Volatility. IMF Economic Review 53: 115–32. [Google Scholar]
  31. Briguglio, Lino, Cordina Gordon, Farrugia Nadia, and Vella Stephanie. 2009. Economic Vulnerability and Resilience: Concepts and Measurements. Oxford Development Studies 37: 229–47. [Google Scholar] [CrossRef]
  32. Bristow, Gillian, and Healy Adrian. 2018. Innovation and regional economic resilience: An exploratory analysis. The Annals of Regional Science 60: 265–84. [Google Scholar] [CrossRef] [Green Version]
  33. Brun, Jean-François, Carrère Celine, Guillaumont Patrick, and Jaime de Melo. 2005. Has Distance Died? Evidence from a Panel Gravity Model. World Bank Economic Review 19: 99–120. [Google Scholar] [CrossRef] [Green Version]
  34. Calì, Massimiliano, and Dirk Willem te Velde. 2011. Does Aid for Trade Really Improve Trade Performance? World Development 39: 725–40. [Google Scholar] [CrossRef]
  35. Camanho, da Costa Neto N., and Romeu Rafael. 2011. Did Export Diversification Soften the Impact of the Global Financial Crisis? IMF Working Paper WP/11/99. Washington, DC: International Monetary Fund. [Google Scholar]
  36. Canh, Nguyen Phuc, and Thanh Su Dinh. 2020. The Dynamics of Export Diversification, Economic Complexity and Economic Growth Cycles: Global Evidence. Foreign Trade Review 57: 234–60. [Google Scholar] [CrossRef]
  37. Cappelli, Riccardo, Montobbio Fabio, and Morrison Andrea. 2021. Unemployment resistance across EU regions: The role of technological and human capital. Journal of Evolutionary Economics 31: 147–78. [Google Scholar] [CrossRef]
  38. Chiah, Mardy, and Zhong Angel. 2020. Trading from home: The impact of COVID-19 on trading volume around the world. Finance Research Letters 37: 101784. [Google Scholar] [CrossRef]
  39. Chinn, Menzie, and Ito Hiro. 2006. What Matters for Financial Development? Capital Controls, Institutions, and Interactions. Journal of Development Economics 81: 163–92. [Google Scholar] [CrossRef] [Green Version]
  40. Coe, David, Subramanian Arvin, Natalia Tamirisa, and Bhavnani Rikhil. 2002. The Missing Globalisation Puzzle. IMF Working Paper WP/02/171. Washington, DC: International Monetary Fund. [Google Scholar]
  41. Coelli, Federica, Moxnes Andreas, and Ulltveit-Moe Karen Helene. 2016. Better, Faster, Stronger: Global Innovation and Trade Liberalization. The Review of Economics and Statistics 104: 205–16. [Google Scholar] [CrossRef]
  42. Coveri, Andrea, Cozza Claudio, Nascia Leopoldo, and Zanfei Antonello. 2020. Supply chain contagion and the role of industrial policy. Journal of Industrial and Business Economics 47: 467–82. [Google Scholar] [CrossRef]
  43. Davies, Rob, Kozul-Wright Richard, Banga Rashmi, Capaldo Jeronim, and Gallogly-Swan Katie. 2021. Reforming the International Trading System for Recovery, Resilience and Inclusive Development. UNCTAD Research Paper No. 65-UNCTAD/SER.RP/2021/8. Geneva, Switzerland: United Nations Conference on Trade and Development (UNCTAD). [Google Scholar]
  44. De Nicola, Francesca, and Tan Shawn. 2017. Firms’ Export Decisions: Demand Trumps Financial Shocks. Policy Research Working Paper Series 7953; Washington, DC: The World Bank. [Google Scholar]
  45. Deardorff, Alan V. 2014. Local comparative advantage: Trade costs and the pattern of trade. International Journal of Economic Theory 10: 9–35. [Google Scholar] [CrossRef] [Green Version]
  46. del Rosal, Ignacio. 2019. Export diversification and export performance by destination country. Bulletin of Economic Research 71: 58–74. [Google Scholar] [CrossRef] [Green Version]
  47. Dennis, Allen, and Shepherd Ben. 2011. Trade Facilitation and Export Diversification. The World Economy 34: 101–22. [Google Scholar] [CrossRef]
  48. Di Caro, Paolo, and Fratesi Ugo. 2018. Regional determinants of economic resilience. Annals of Regional Science 60: 235–40. [Google Scholar] [CrossRef] [Green Version]
  49. Driscoll, John C., and Kraay Aart C. 1998. Consistent Covariance Matrix Estimation with Spatially Dependent Panel Data. Review of Economics and Statistics 80: 549–60. [Google Scholar] [CrossRef]
  50. Duval, Romain, and Furceri David. 2018. The Effects of Labor and Product Market Reforms: The Role of Macroeconomic Conditions and Policies. IMF Economic Review 66: 31–69. [Google Scholar] [CrossRef]
  51. Eichengreen, Barry, and Leblang David. 2003. Capital Account Liberalization and Growth: Was Mr. Mahathir Right? International Journal of Finance and Economics 8: 205–24. [Google Scholar] [CrossRef] [Green Version]
  52. Esfahani, Hadi Salehi, and Ramirez María Teresa. 2003. Institutions, Infrastructure, and Economic Growth. Journal of Development Economics 70: 443–47. [Google Scholar] [CrossRef]
  53. Evenett, Simon, Fiorini Matteo, Fritz Johannes, Hoekman Bernard, Lukaszuk Piotr, Rocha Nadia, Ruta Michele, Santi Filippo, and Shingal Anirudh. 2022. Trade Policy Responses to the COVID-19 Pandemic Crisis. Evidence from a New Data Set. The World Economy 45: 342–64. [Google Scholar] [CrossRef] [PubMed]
  54. Farrugia, Gianrico, and Roshelle W. Plutowski. 2021. Innovation Lessons From the COVID-19 Pandemic. Perspective and Controversy 95: 1574–77. [Google Scholar] [CrossRef] [PubMed]
  55. Feindouno, Sosso, and Goujon Michaël. 2016. The Retrospective Economic Vulnerability Index, 2015 Update. Working Paper n°147. Clermont-Ferrand: Fondation pour les Etudes et Recherches sur le Developpement International (FERDI). [Google Scholar]
  56. Feng, Ling, and Lin Ching-Yi. 2013. Financial shocks and exports. International Review of Economics & Finance 26: 39–55. [Google Scholar]
  57. Funke, Michael, and Ruhwedel Ralf. 2001. Export variety and export performance: Empirical evidence from East Asia. Journal of Asian Economics 12: 493–505. [Google Scholar] [CrossRef]
  58. Funke, Michael, and Ruhwedel Ralf. 2002. Export variety and export performance: Empirical evidence for the OECD Countries. Review of World Economics 138: 97–114. [Google Scholar] [CrossRef]
  59. Gassebner, Martin, Keck Alexander, and The Robert. 2010. Shaken, not stirred: The impact of disasters on international trade. Review of International Economics 18: 351–68. [Google Scholar] [CrossRef]
  60. Ghosh, Atish, and Ostry Jonathan. 1994. Export Instability and the External Balance in Developing Countries. IMF Staff Papers 41: 214–35. [Google Scholar] [CrossRef]
  61. Gnangnon, Sèna Kimm. 2019a. Has the WTO’s Aid for Trade Initiative Delivered on Its Promise of Greater Mobilization of Development Aid in Favor of the Trade Sector in Developing Countries? International Trade Journal 33: 519–41. [Google Scholar] [CrossRef]
  62. Gnangnon, Sèna Kimm. 2019b. Aid for Trade and Recipient-Countries’ Export Structure: Does Trade Policy Liberalization Matter? Arthaniti: Journal of Economic Theory and Practice 18: 56–85. [Google Scholar] [CrossRef]
  63. Gnangnon, Sèna Kimm. 2020. Aid for Trade flows and Real Exchange Rate Volatility in Recipient-Countries. Journal of International Commerce, Economics and Policy 13: 2250001. [Google Scholar] [CrossRef]
  64. Gnangnon, Sèna Kimm. 2021a. Effect of Productive Capacities on Economic Complexity: Do Aid for Trade flows Matter? Journal of Economic Integration 36: 626–88. [Google Scholar] [CrossRef]
  65. Gnangnon, Sèna Kimm. 2021b. Productive Capacities, Economic Growth and Economic Growth Volatility in Developing Countries: Does Structural Economic Vulnerability Matter? Journal of International Commerce, Economics and Policy. Available online: https://doi/10.1142/S1793993325500012 (accessed on 10 March 2021). [CrossRef]
  66. Gnangnon, Sèna Kimm. 2021c. Effect of Productive Capacities on Economic Resilience in Developing Countries. Preprints Paper. [Google Scholar] [CrossRef]
  67. Gnangnon, Sèna Kimm. 2021d. Effect of Development Aid on Productive Capacities. Kiel and Hamburg: ZBW—Leibniz Information Centre for Economics. [Google Scholar]
  68. Gradeva, Katerina, and Martínez-Zarzoso Inmaculada. 2015. Are Trade Preferences more Effective than Aid in Supporting Exports? Evidence from the ‘Everything But Arms’ Preference Scheme. The World Economy 39: 1146–71. [Google Scholar] [CrossRef]
  69. Grossman, Gene M., and Helpman Elhanan. 2015. Globalization and growth. American Economic Review 105: 100–4. [Google Scholar] [CrossRef]
  70. Guillaumont, Patrick. 2009. An Economic Vulnerability Index: Its Design and Use for International Development Policy. Oxford Development Studies 37: 193–228. [Google Scholar] [CrossRef] [Green Version]
  71. Guillaumont, Patrick. 2017. Vulnerability and Resilience: A Conceptual Framework Applied to Three Asian Countries—Bhutan, Maldives, and Nepal. ADB South Asia Working Paper No. 53. Mandaluyong: Asian Development Bank. [Google Scholar]
  72. Haddad, Mona, Lim Jamus Jerome, Pancaro Cosimo, and Saborowski Christian. 2013. Trade openness reduces growth volatility when countries are well diversified. Canadian Journal of Economics 46: 765–90. [Google Scholar] [CrossRef]
  73. Hallegatte, Stephane. 2014. Economic Resilience—Definition and Measurement. World Bank Policy Research Working Paper, WPS6852. Washington, DC: The World Bank. [Google Scholar]
  74. Hayakawa, Kazunobu, and Mukunoki Hiroshi. 2021. The impact of COVID-19 on international trade: Evidence from the first shock. Journal of the Japanese and International Economies 60: 101135. [Google Scholar] [CrossRef]
  75. Hendy, Rana, and Zaki Chahir. 2021. Trade facilitation and firms exports: Evidence from customs data. International Review of Economics & Finance 75: 197–209. [Google Scholar]
  76. Herrendorf, Berthold, Richard Rogerson, and Ákos Valentinyi. 2014. Chapter 6—Growth and Structural Transformation. In Handbook of Economic Growth. Amsterdam: Elsevier, vol. 2, pp. 855–941. [Google Scholar]
  77. Hundt, Christian, and Holtermann Linus. 2020. The role of national settings in the economic resilience of regions—Evidence from recessionary shocks in Europe from 1990 to 2014. Growth and Change 51: 180–206. [Google Scholar] [CrossRef] [Green Version]
  78. Hwang, Sangyeon, and Im Hyejoon. 2013. Financial shocks and trade finance: Evidence from Korea. Economics Letters 120: 104–7. [Google Scholar] [CrossRef]
  79. IMF. 2021. World Economic Outlook: Managing Divergent Recoveries. Washington, DC: International Monetary Fund. [Google Scholar]
  80. Jolles, Maya, Meyermans Eric, and Vasicek Borek. 2018. Determinants of Economic Resilience in the Euro Area: An empirical Assessment of Policy Levers. Quarterly Report on the Euro Area (QREA). Brussels: Directorate General Economic and Financial Affairs (DG ECFIN), European Commission, vol. 17, pp. 27–46. [Google Scholar]
  81. Ju, Jiandong, Yi Wu, and Zeng Li. 2010. The Impact of Trade Liberalization on the Trade Balance in Developing Countries. IMF Staff Papers 57: 427–49. [Google Scholar] [CrossRef]
  82. Kadri, Farid, Birregah Babiga, and Châtelet Eric. 2014. The Impact of Natural Disasters on Critical Infrastructures: A Domino Effect-based Study. Journal of Homeland Security and Emergency Management 11: 217–41. [Google Scholar] [CrossRef]
  83. Kinnan, Cynthia, and Townsend Robert. 2012. Kinship and financial networks, formal financial access, and risk reduction. The American Economic Review: Papers & Proceedings 102: 289–93. [Google Scholar]
  84. Kramarz, Francis, Martin Julien, and Mejean Isabelle. 2020. Volatility in the small and in the large: The lack of diversification in international trade. Journal of International Economics 122: 103276. [Google Scholar] [CrossRef]
  85. Kristjánsdóttir, Helga. 2012. Exports from a remote developed region: Analysed by an inverse hyperbolic sine transformation of the gravity model. The World Economy 35: 953–66. [Google Scholar] [CrossRef]
  86. Li, Chunding, and Lin Xin. 2021. COVID-19 and trade: Simulated asymmetric loss. Journal of Asian Economics 75: 101327. [Google Scholar] [CrossRef]
  87. Li, Yuhong, and Zobel Christopher W. 2020. Exploring supply chain network resilience in the presence of the ripple effect. International Journal of Production Economics 228: 107693. [Google Scholar] [CrossRef]
  88. Maggioni, Daniela, Lo Turco Alessia, and Gallegati Mauro. 2016. Does product complexity matter for firms’ output volatility? Journal of Development Economics 121: 94–109. [Google Scholar] [CrossRef] [Green Version]
  89. Markusen, James R., and Venables Anthony J. 1999. Foreign direct investment as a catalyst for industrial development. European Economic Review 43: 335–56. [Google Scholar] [CrossRef] [Green Version]
  90. Martin, Ron, and Sunley Peter. 2015. On the notion of regional economic resilience: Conceptualization and explanation. Journal of Economic Geography 15: 1–42. [Google Scholar] [CrossRef] [Green Version]
  91. Marto, Ricardo, Papageorgiou Chris, and Klyuev Vladimir. 2018. Building resilience to natural disasters: An application to small developing states. Journal of Development Economics 135: 574–86. [Google Scholar] [CrossRef] [Green Version]
  92. Mayunga, Joseph. 2007. Understanding and Applying the Concept of Community Disaster Resilience: A Capital-Based Approach’, Draft Working Paper Prepared for the Summer Academy, Megacities as Hotspots of Risk: Social Vulnerability and Resilience Building. College Station: Texas A&M University. [Google Scholar]
  93. Meyer, Birgit, Mösle Saskia, and Windisch Michael. 2020. Lessons from Past Disruptions to Global Value Chains. UNIDO Industrial Analytics Platform. Available online: https://iap.unido.org/articles/lessons-past-disruptions-global-value-chains (accessed on 10 March 2021).
  94. Miller, Terry, Kim B. Anthony, James M. Roberts, and Tyrrell Patrick. 2021. 2021 Index of Economic Freedom. Washington, DC: Institute for Economic Freedom, The Heritage Foundation, Available online: https://www.heritage.org/index/pdf/2021/book/index_2021.pdf (accessed on 10 March 2021).
  95. Miranda-Pinto, Jorge. 2021. Production network structure, service share, and aggregate volatility. Review of Economic Dynamics 39: 146–73. [Google Scholar] [CrossRef]
  96. Miroudot, Sébastien. 2020. Reshaping the policy debate on the implications of COVID-19 for global supply chains. Journal of International Business Policy 3: 430–42. [Google Scholar] [CrossRef]
  97. Montalbano, Pierluigi. 2011. Trade Openness and Developing Countries’ Vulnerability: Concepts, Misconceptions, and Directions for Research. World Development 39: 1489–502. [Google Scholar] [CrossRef]
  98. Munch, Jakob Roland, and Skaksen Jan Rose. 2008. Human capital and wages in exporting firms. Journal of International Economics 75: 363–72. [Google Scholar] [CrossRef] [Green Version]
  99. National Board of Trade Sweden. 2020. Improving Economic Resilience through Trade—Should We Rely on Our Own Supply? Stockholm: The National Board of Trade Sweden, 51p, Available online: https://www.wita.org/atp-research/improving-economic-resilience/ (accessed on 10 March 2021).
  100. Nordhagen, Stella, Igbeka Uduak, Rowlands Hannah, Shine Ritta Sabbas, Heneghan Emily, and Tench Jonathan. 2021. COVID-19 and small enterprises in the food supply chain: Early impacts and implications for longer-term food system resilience in low-and middle-income countries. World Development 141: 105405. [Google Scholar] [CrossRef]
  101. Obstfeld, Maurice. 1994. Risk-taking, global diversification and growth. American Economic Review 84: 1310–29. [Google Scholar]
  102. OECD. 2017. OECD G20 Policy Paper on Economic Resilience and Structural Policies. Paris: OECD. [Google Scholar]
  103. OECD. 2020. Development Co-operation Report 2020: Learning from Crises, Building Resilience. Paris: OECD Publishing. [Google Scholar] [CrossRef]
  104. OECD. 2021. Fostering Economic Resilience in a World of Open and Integrated Markets—Risks, Vulnerabilities and Areas for Policy Action. UK Presidency of the G7. Paris: OECD Publishing. [Google Scholar]
  105. Oh, Chang Hoon, and Reuveny Rafael. 2010. Climatic natural disasters, political risk, and international trade. Global Environmental Change 20: 243–54. [Google Scholar] [CrossRef]
  106. Olarreaga, Marcelo. 2016. Trade, Infrastructure and Development. FERDI Working Paper Development Policies n° 177. Clermont-Ferrand: Fondation pour les Etudes et Recherches sur le Développement International (FERDI). [Google Scholar]
  107. Osakwe, Patrick, Santos-Paulino Amelia, and Dogan Berna. 2018. Trade dependence, liberalization, and exports diversification in developing countries. Journal of African Trade 5: 19–34. [Google Scholar] [CrossRef]
  108. Paudel, Jayash, and Ryu Hanbyul. 2018. Natural disasters and human capital: The case of Nepal’s earthquake. World Development 111: 1–12. [Google Scholar] [CrossRef]
  109. Paunov, Caroline, and Planes-Satorra Sandra. 2021. Science, Technology and Innovation in the Time of COVID-19. OECD Science, Technology and Industry Policy Papers, No. 99. Paris: OECD. [Google Scholar]
  110. Paunov Caroline, Rollo Valentina. 2016. Has the internet fostered inclusive innovation in the Developing World? World Development 78: 587–609. [Google Scholar] [CrossRef] [Green Version]
  111. Rose, Adam, Wei Dan, and Paul Donald. 2018. Economic consequences of and resilience to a disruption of petroleum trade: The role of seaports in U.S. energy security. Energy Policy 115: 584–615. [Google Scholar] [CrossRef]
  112. Sánchez, Aida Caldera, and Röhn Oliver. 2016. How Do Policies Influence GDP Tail Risks? OECD Economics Department Working Papers ECO/WKP (2016) 63. Paris: OECD Publishing. [Google Scholar]
  113. Saltarelli, Francesco, Cimini Valeria, Tacchella Andrea, Zaccaria Andrea, and Cristelli Matthieu. 2020. Is Export a Probe for Domestic Production? Frontiers in Physics 8: 180. [Google Scholar] [CrossRef]
  114. Santos-Paulino, Amelia U. 2007. Aid and Trade Sustainability under Liberalisation in Least Developed Countries. The World Economy 30: 972–98. [Google Scholar] [CrossRef]
  115. Schmukler, Sergio L., and Vesperoni Esteban. 2006. Financial Globalization and Debt Maturity in Emerging Economies. Journal of Development Economics 79: 183–207. [Google Scholar] [CrossRef]
  116. Seidu, Dauda, and Maciej Drozd. 2020. Barriers to Competition in Product Market Regulation: New Insights on Emerging Market and Developing Economies. Washington, DC: World Bank. [Google Scholar]
  117. Sepehrdoust, Hamid, Davarikish Razieh, and Setarehie Maryam. 2019. The knowledge-based products and economic complexity in developing countries. Heliyon 5: e02979. [Google Scholar] [CrossRef] [Green Version]
  118. Somville, Vincent, and Vandewalle Lore. 2019. Access to Banking, Savings and Consumption Smoothing in Rural India. Graduate Institute of International and Development Studies Working Paper No. HEIDWP09-2019. Geneva: Graduatie Institute. [Google Scholar]
  119. Sondermann, David. 2018. Towards more resilient economies: The role of well-functioning economic structures. Journal of Policy Modeling 40: 97–117. [Google Scholar] [CrossRef] [Green Version]
  120. Spatareanu, Mariana, Manole Vlad, and Kabiri Ali. 2018. Exports and bank shocks: Evidence from matched firm-bank data. Structural Change and Economic Dynamics 47: 46–56. [Google Scholar] [CrossRef]
  121. Stulz, René. 1999. Globalization, Corporate Finance and the Cost of Capital. Journal of Applied Corporate Finance 12: 8–25. [Google Scholar] [CrossRef]
  122. Taghizadeh-Hesar, Farhad, Sarker Tapan, Yoshino Naoyuki, Mortha Aline, and Vo Xuan Vinh. 2021. Quality infrastructure and natural disaster resiliency: A panel analysis of Asia and the Pacific. Economic Analysis and Policy 60: 394–406. [Google Scholar] [CrossRef]
  123. Tambo, Justice A., and Wünscher Tobias. 2017. Enhancing resilience to climate shocks through farmer innovation: Evidence from northern Ghana. Regional Environmental Change 17: 1505–14. [Google Scholar] [CrossRef]
  124. UNCTAD. 2006. The Least Developed Countries Report 2006: Developing Productive Capacities. Sales No. E.06.II.D.9. New York and Geneva: United Nations Publication. [Google Scholar]
  125. UNCTAD. 2020. The Least Developed Countries Report 2020: Productive Capacities for the New Decade. Sales No. E.21.II.D.2. New York and Geneva: United Nations publication. [Google Scholar]
  126. United Nations. 2016. Global Sustainable Development Report 2016. New York: Department of Economic and Social Affairs. [Google Scholar]
  127. Vannoorenberghe, Gonzague, Wang Zheng, and Yu Zhihong. 2016. Volatility and diversification of exports: Firm-level theory and evidence. European Economic Review 89: 216–47. [Google Scholar] [CrossRef] [Green Version]
  128. Vijil, Mariana, and Wagner Laurent. 2012. Does Aid for Trade Enhance Export Performance? Investigating the Infrastructure Channel. The World Economy 37: 838–68. [Google Scholar] [CrossRef]
  129. Wang, Rong, Tan Junlan, and Yao Shuangliang. 2021. Are natural resources a blessing or a curse for economic development? The importance of energy innovations. Resources Policy 72: 102042. [Google Scholar] [CrossRef]
  130. WTO (World Trade Organization). 2005. Ministerial Declaration on Doha Work Programme’, WT/MIN(05)/DEC. Paper presented at 18 December 2005 at the Sixth Session of Trade Ministers Conference, Ministerial Conference, Hong Kong, China, December 13–18. [Google Scholar]
  131. Wu, Xiaoping, and Khazin Bassam Peter. 2020. Patent-Related Actions Taken in WTO Members in Response to the COVID-19 Pandemic. WTO Staff Working Paper ERSD-2020-12. Geneva: World Trade Organization. [Google Scholar]
  132. Zeev, Nadav Ben, and Ifergane Tomer. 2021. Firing restrictions and economic resilience: Protect and survive? Review of Economic Dynamics. [Google Scholar] [CrossRef]
Figure 1. Development aid, productive capacities, and export resilience across the full sample. Source: Author. Note: The variables “ODA”, “AfTTOT”, and “NonAfTTOT” are the gross disbursement of total ODA flows, AfT flows, and Other Aid flows, respectively, and are all expressed in constant USD billion, 2018 prices. The variable “ShAfT” is the share (%) of gross disbursements of total AfT flows in gross disbursements of total ODA—both aid variables are expressed in constant USD, 2018 prices.
Economies 10 00161 g001
Figure 2. Cross plot between total ODA, productive capacity, and export resilience across the full sample. Source: Author.
Economies 10 00161 g002
Figure 3. Cross plot between AfT flows, NonAfT flows, and export resilience across the full sample. Source: Author.
Economies 10 00161 g003
Table 1. Effect of development aid on productive capacities. Estimator: Two-Step System GMM.
VariablesPCIPCIPCIPCIPCIPCI
(1)(2)(3)(4)(5)(6)
PCIt−11.112 ***
(0.0423)
1.036 ***
(0.0449)
1.121 ***
(0.0426)
1.065 ***
(0.0474)
1.040 ***
(0.0495)
1.048 ***
(0.0425)
PCIt−2−0.188 ***
(0.0345)
−0.188 ***
(0.0377)
−0.187 ***
(0.0348)
−0.213 ***
(0.0407)
−0.173 ***
(0.0426)
−0.156 ***
(0.0397)
Log(ODA)0.241 ***
(0.0556)
Log(AfTTOT) 0.239 ***
(0.0271)
Log(NonAfTTOT) 0.216 ***
(0.0631)
Log(AfTINFRA) 0.161 ***
(0.0276)
Log(AfTPROD) 0.252 ***
(0.0439)
Log(AfTPOL) 0.0956 ***
(0.0234)
OPEN0.104
(0.212)
0.256
(0.172)
0.0712
(0.204)
0.204
(0.200)
0.101
(0.198)
0.240
(0.189)
TOTREV0.360
(0.539)
0.0516
(0.527)
0.732
(0.563)
0.0496
(0.515)
1.008 *
(0.588)
0.0336
(0.716)
FINPOL0.972 ***
(0.158)
0.996 ***
(0.153)
0.940 ***
(0.170)
0.866 ***
(0.159)
1.383 ***
(0.151)
1.047 ***
(0.150)
Log(GDPC)0.402 ***
(0.0945)
0.626 ***
(0.110)
0.367 ***
(0.0933)
0.610 ***
(0.106)
0.538 ***
(0.0776)
0.431 ***
(0.0832)
Constant−5.909 ***
(1.413)
−5.354 ***
(0.781)
−5.374 ***
(1.579)
−3.704 ***
(0.752)
−5.357 ***
(0.967)
−1.906 ***
(0.472)
Observations-Countries321-87321-87321-87321-87321-87319-87
Number of Instruments515151515151
AR1 (p-Value)0.00090.00100.00120.00110.00210.0054
AR2 (p-Value)0.96130.91890.98260.96520.95300.8480
OID (p-Value)0.35180.66640.33160.50590.70170.6199
Note: * p-value < 0.1; *** p-value < 0.01. Robust standard errors are in parenthesis. The aid variables and the variables “OPEN”, “TOTREV”, “FINPOL”, and “GDPC” have been treated as endogenous. Time dummies have been included in the regressions. The latter have used a maximum of three lags of the dependent variable as instruments, and two lags of endogenous variables as instruments.
Table 2. Effect of development aid on export resilience. Estimator: Within Fixed Effects.
VariablesRESILRESILRESILRESILRESILRESIL
(1)(2)(3)(4)(5)(6)
Log(ODA)t−10.0974 ***
(0.0351)
Log(AfTTOT)t−1 0.0433 ***
(0.00253)
Log(NonAfTTOT)t−1 0.0814 **
(0.0377)
Log(AfTINFRA)t−1 0.0201 ***
(0.00629)
Log(AfTPROD)t−1 0.0264 **
(0.0106)
Log(AfTPOL)t−1 0.0235 ***
(0.00324)
Log(GDPC)t−10.777 ***
(0.0255)
0.714 ***
(0.0280)
0.817 ***
(0.0301)
0.745 ***
(0.0306)
0.760 ***
(0.0269)
0.786 ***
(0.0391)
Log(TP)t−10.182 ***
(0.0514)
0.195 ***
(0.0569)
0.210 ***
(0.0475)
0.207 ***
(0.0674)
0.230 ***
(0.0534)
0.179 ***
(0.0588)
FINPOLt−1−0.368 ***
(0.107)
−0.396 ***
(0.0900)
−0.306 ***
(0.102)
−0.320 ***
(0.0958)
−0.330 ***
(0.0923)
−0.360 ***
(0.115)
[FINPOLt−1]20.381 ***
(0.109)
0.423 ***
(0.111)
0.326 ***
(0.114)
0.371 ***
(0.128)
0.367 ***
(0.0991)
0.347 **
(0.137)
Constant−8.595 ***
(0.742)
−7.004 ***
(0.326)
−8.683 ***
(0.932)
−6.869 ***
(0.357)
−7.187 ***
(0.359)
−7.012 ***
(0.359)
Observations-Countries427-93426-93426-93426-93426-93420-93
Within R20.25880.24930.25380.24550.24380.2670
Note: ** p-value < 0.05; *** p-value < 0.01. Robust standard errors are in parenthesis.
Table 3. Effect of development aid upon export resilience. Estimator: Two-Step System GMM.
VariablesRESILRESILRESILRESILRESILRESIL
(1)(2)(3)(4)(5)(6)
RESILt−11.094 ***
(0.0558)
1.046 ***
(0.0535)
1.091 ***
(0.0550)
0.999 ***
(0.0484)
1.094 ***
(0.0574)
1.057 ***
(0.0504)
RESILt−2−0.334 ***
(0.0396)
−0.260 ***
(0.0319)
−0.335 ***
(0.0395)
−0.246 ***
(0.0325)
−0.276 ***
(0.0360)
−0.349 ***
(0.0369)
Log(ODA)0.0999 ***
(0.0175)
Log(AfTTOT) 0.0736 ***
(0.0103)
Log(NonAfTTOT) 0.126 ***
(0.0201)
Log(AfTINFRA) 0.0542 ***
(0.00695)
Log(AfTPROD) 0.0830 ***
(0.00925)
Log(AfTPOL) 0.0265 ***
(0.00766)
Log(TP)−0.267
(0.183)
−0.366 **
(0.152)
−0.354 *
(0.191)
−0.253 **
(0.124)
−0.524 ***
(0.152)
−0.110
(0.131)
FINPOL−0.557 ***
(0.182)
−0.843 ***
(0.170)
−0.509 ***
(0.185)
−0.700 ***
(0.156)
−0.652 ***
(0.173)
−0.426 **
(0.212)
[FINPOL]20.496 ***
(0.178)
0.864 ***
(0.157)
0.444 **
(0.180)
0.730 ***
(0.147)
0.568 ***
(0.179)
0.442 **
(0.209)
Log(GDPC)0.0224
(0.0233)
−0.000571
(0.0176)
0.0449 *
(0.0244)
0.00205
(0.0143)
0.00947
(0.0170)
−0.00980
(0.0157)
Constant−0.876 *
(0.501)
0.310
(0.520)
−1.168 **
(0.544)
0.264
(0.446)
0.886
(0.559)
0.198
(0.492)
Observations-Countries327-93327-93327-93327-93327-93325-93
Number of Instruments515151515151
AR1 (p-Value)0.00070.00490.00050.00470.00140.0028
AR2 (p-Value)0.33390.63750.24800.61010.39820.5768
OID (p-Value)0.67880.85760.84690.68530.91890.7071
Note: * p-value < 0.1; ** p-value < 0.05; *** p-value < 0.01. Robust standard errors are in parenthesis. The aid variables, and the variables “OPEN”, “TOTREV”, “FINPOL”, the squared of the latter, and “GDPC” have been treated as endogenous. Time dummies have been included in the regressions. The latter have used a maximum of three lags of the dependent variable as instruments, and two lags of endogenous variables as instruments.
Table 4. Effect of development aid upon export resilience through the productive capacities channel. Estimator: Two-Step System GMM.
VariablesRESILRESILRESILRESILRESILRESILRESILRESIL
(1)(2)(3)(4)(5)(6)(7)(8)
RESILt−11.015 ***
(0.0450)
1.032 ***
(0.0450)
0.992 ***
(0.0403)
0.883 ***0.994 ***0.883 ***0.924 ***1.023 ***
RESILt−2−0.326 ***
(0.0318)
−0.348 ***
(0.0341)
−0.344 ***
(0.0291)
−0.234 ***
(0.0238)
−0.347 ***
(0.0268)
−0.231 ***
(0.0249)
−0.252 ***
(0.0275)
−0.342 ***
(0.0284)
Log(ODA) 0.119 ***
(0.0193)
1.133 ***
(0.182)
Log(PCI)0.270 **
(0.129)
−0.525 ***
(0.160)
6.144 ***
(1.073)
4.833 ***
(0.904)
4.700 ***
(1.144)
3.272 ***
(0.835)
3.473 ***
(0.658)
0.118
(0.294)
[Log(ODA)] × [Log(PCI)] −0.322 ***
(0.0544)
Log(AfTTOT) 1.107 ***
(0.157)
[Log(AfTTOT)] × [Log(PCI)] −0.310 ***
(0.0480)
Log(NonAfTTOT) 0.890 ***
(0.189)
[Log(NonAfTTOT)] × [Log(PCI)] −0.248 ***
(0.0574)
Log(AfTINFRA) 0.780 ***
(0.157)
[Log(AfTINFRA)] × [Log(PCI)] −0.218 ***
(0.0469)
Log(AfTPROD) 0.839 ***
(0.122)
[Log(AfTPROD)] × [Log(PCI)] −0.236***
(0.0367)
Log(AfTPOL) 0.0816
(0.0671)
[Log(AfTPOL)] × [Log(PCI)] −0.0178
(0.0204)
Log(GDPC)−0.0414 *
(0.0239)
0.114 ***
(0.0307)
0.0820 ***
(0.0201)
0.130 ***
(0.0248)
0.0730 ***
(0.0179)
0.0762 ***
(0.0226)
0.100 ***
(0.0214)
0.0154
(0.0156)
Log(TP)−0.0424
(0.109)
−0.0635
(0.127)
−0.0636
(0.0980)
−0.0722
(0.0774)
−0.0282
(0.0903)
−0.107
(0.0786)
−0.0811
(0.0980)
0.0314
(0.0808)
FINPOL−0.574 ***
(0.187)
−0.147
(0.200)
−0.643 ***
(0.153)
−0.692 ***
(0.150)
−0.665 ***
(0.152)
−0.584 ***
(0.134)
−0.600 ***
(0.165)
−0.511 ***
(0.173)
[FINPOL]20.590 ***
(0.169)
0.193
(0.184)
0.615 ***
(0.146)
0.603 ***
(0.143)
0.633 ***
(0.148)
0.563 ***
(0.122)
0.530 ***
(0.155)
0.524 ***
(0.149)
Constant−0.331
(0.383)
−1.335***
(0.413)
−22.05 ***
(3.547)
−18.02 ***
(2.864)
−17.26 ***
(3.695)
−11.98 ***
(2.737)
−12.90 ***
(2.092)
−0.825
(1.025)
Turning point of “PCI”n.a.n.a.Exponential (1.133/0.322) = 33.74Exponential (1.107/0.310) = 35.55Exponential (0.890/0.248) = 36.19Exponential (0.780/0.218) = 35.8Exponential (0.839/0.236) = 35n.a.
Observations-Countries328-93325-93325-93325-93325-93325-93325-93323-93
Number of Instruments6558656565656565
AR1 (p-Value)0.00290.00110.00150.00550.00140.00650.00240.0032
AR2 (p-Value)0.52610.19240.45150.48720.38460.53510.29090.5062
OID (p-Value)0.12590.65730.23120.46640.23540.66450.29990.3264
Note: * p-value < 0.1; ** p-value < 0.05; *** p-value < 0.01. Robust standard errors are in parenthesis. The aid variables, and the variables “PCI”, “OPEN”, “TOTREV”, “FINPOL”, the squared of the latter, and “GDPC” have been treated as endogenous. Time dummies have been included in the regressions. The latter have used a maximum of three lags of the dependent variable as instruments, and two lags of endogenous variables as instruments.
Table 5. Robustness check analysis on the effect of development aid upon export resilience. Estimator: Two-Step System GMM.
VariablesRESILRESILRESILRESILRESILRESIL
(1)(2)(3)(4)(5)(6)
RESILt−10.861 ***
(0.0559)
0.761 ***
(0.0553)
0.854 ***
(0.0581)
0.773 ***
(0.0535)
0.756 ***
(0.0534)
0.816 ***
(0.0591)
RESILt−2−0.273 ***
(0.0419)
−0.182 ***
(0.0350)
−0.279 ***
(0.0434)
−0.179 ***
(0.0357)
−0.198 ***
(0.0359)
−0.283 ***
(0.0373)
Log(ODA)0.0844 ***
(0.0178)
Log(AfTTOT) 0.0742 ***
(0.00921)
Log(NonAfTTOT) 0.107 ***
(0.0221)
Log(AfTINFRA) 0.0552 ***
(0.00620)
Log(AfTPROD) 0.0736 ***
(0.00832)
Log(AfTPOL) 0.0358 ***
(0.00805)
Log(TP)−0.122
(0.184)
−0.261 *
(0.149)
−0.239
(0.190)
−0.212 *
(0.118)
−0.374 ***
(0.138)
−0.149
(0.129)
FINPOL−0.471 **
(0.188)
−0.913 ***
(0.153)
−0.411 **
(0.196)
−0.622 ***
(0.143)
−0.794 ***
(0.148)
−0.610 ***
(0.186)
[FINPOL]20.442 **
(0.176)
0.922 ***
(0.144)
0.369 **
(0.181)
0.652 ***
(0.135)
0.754 ***
(0.157)
0.599 ***
(0.186)
Log(GDPC)0.0210
(0.0238)
0.0122
(0.0197)
0.0516 **
(0.0248)
0.0102
(0.0153)
0.0252
(0.0172)
0.00747
(0.0158)
Constant−1.285 ***
(0.472)
−0.154
(0.490)
−1.457 ***
(0.476)
−0.0738
(0.403)
0.209
(0.491)
0.125
(0.483)
Observations-Countries312-89312-89312-89312-89312-89310-89
Number of Instruments515151515151
AR1 (p-Value)0.00130.00930.00090.00760.00430.0050
AR2 (p-Value)0.69230.79550.56840.85340.95970.5893
OID (p-Value)0.60740.62930.81380.56690.49750.5671
Note: * p-value < 0.1; ** p-value < 0.05; *** p-value < 0.01. Robust standard errors are in parenthesis. The aid variables, and the variables “OPEN”, “TOTREV”, “FINPOL”, the squared of the latter, and “GDPC” have been treated as endogenous. Time dummies have been included in the regressions. The latter have used a maximum of three lags of the dependent variable as instruments, and two lags of endogenous variables as instruments.
Table 6. Robustness check analysis on the effect of development aid upon export resilience through the productive capacities channel. Estimator: Two-Step System GMM.
VariablesRESILRESILRESILRESILRESILRESIL
(1)(2)(3)(4)(5)(6)
RESILt−10.824 ***
(0.0381)
0.687 ***
(0.0299)
0.820 ***
(0.0360)
0.697 ***
(0.0338)
0.718 ***
(0.0430)
0.811 ***
(0.0392)
RESILt−2−0.301 ***
(0.0316)
−0.195 ***
(0.0247)
−0.312 ***
(0.0282)
−0.176 ***
(0.0266)
−0.218 ***
(0.0278)
−0.274 ***
(0.0256)
Log(ODA)0.974 ***
(0.147)
[Log(ODA)] × [Log(PCI)]−0.275 ***
(0.0444)
Log(AfTTOT) 0.962 ***
(0.159)
[Log(AfTTOT)] × [Log(PCI)] −0.266 ***
(0.0487)
Log(NonAfTTOT) 0.736 ***
(0.153)
[Log(NonAfTTOT)] × [Log(PCI)] −0.202 ***
(0.0464)
Log(AfTINFRA) 0.775 ***
(0.131)
[Log(AfTINFRA)] × [Log(PCI)] −0.216 ***
(0.0388)
Log(AfTPROD) 0.926 ***
(0.122)
[Log(AfTPROD)] × [Log(PCI)] −0.263 ***
(0.0361)
Log(AfTPOL) 0.191 ***
(0.0383)
[Log(AfTPOL)] × [Log(PCI)] −0.0516 ***
(0.0125)
Log(PCI)5.380 ***
(0.886)
4.152 ***
(0.922)
3.926 ***
(0.932)
3.384 ***
(0.686)
4.094 ***
(0.629)
0.646 ***
(0.194)
Log(TP)−0.112
(0.0854)
−0.107
(0.0796)
−0.0589
(0.0842)
−0.194 **
(0.0786)
−0.117
(0.0961)
0.0453
(0.0895)
FINPOL−0.786 ***
(0.132)
−0.666 ***
(0.135)
−0.772 ***
(0.126)
−0.562 ***
(0.118)
−0.599 ***
(0.144)
−0.428 ***
(0.120)
[FINPOL]20.736 ***
(0.128)
0.587 ***
(0.130)
0.702 ***
(0.125)
0.567 ***
(0.103)
0.528 ***
(0.135)
0.408 ***
(0.112)
Log(GDPC)0.0759 ***
(0.0192)
0.132 ***
(0.0233)
0.0692 ***
(0.0173)
0.0705 ***
(0.0171)
0.0974 ***
(0.0201)
0.00759
(0.0121)
Constant−19.04 ***
(2.821)
−15.65 ***
(2.890)
−14.57 ***
(2.937)
−11.88 ***
(2.195)
−14.79 ***
(2.004)
−2.548 ***
(0.677)
Turning point of “PCI”Exponential (0.974/0.275) = 34.53Exponential (0.962/0.266) = 37.21Exponential (0.736/0.202) = 38.23Exponential (0.775/0.216) = 36.16Exponential (0.926/0.263) = 33.82Exponential (0.191/0.0516) = 40.5
Observations-Countries310-89310-89310-89310-89310-89308-89
Number of Instruments656565656565
AR1 (p-Value)0.00180.00850.00150.00840.00390.0056
AR2 (p-Value)0.93350.96640.96630.90460.80290.9186
OID (p-Value)0.24170.45100.22340.53100.36930.2752
Note: ** p-value < 0.05; *** p-value < 0.01. Robust standard errors are in parenthesis. The aid variables, and the variables “PCI”, “OPEN”, “TOTREV”, “FINPOL”, the squared of the latter, and “GDPC” have been treated as endogenous. Time dummies have been included in the regressions. The latter have used a maximum of three lags of the dependent variable as instruments, and two lags of endogenous variables as instruments.
Publisher’s Note: MDPI stays neutral with regard to jurisdictional claims in published maps and institutional affiliations.

