Abstract
This study analyzes whether ongoing liberalization has resulted in more profound trade expansion for Indonesia versus regional partner countries. A gravity model is first employed to find whether regional trade agreements resulted in more significant intra-regional exports or diverted trade. This study applies the generalized method of moment (GMM-sys) and the Poisson pseudo-maximum likelihood (PPML) estimator. Four groups of manufactured products are aggregated according to technology intensity, and two nature-based groups of products are estimated in the dynamic panel model. Additionally, revealed comparative advantage (RCA) and a trade balance index (TBI) for 5120 products are used to map goods based on specialization–advantage patterns. The gravity model indicates that regional trade agreements supported trade in manufactured and naturally sourced goods but not in high-tech and primary goods. Additionally, export expansion took place in goods that revealed comparative advantage and export specialization. Competition has increased between Indonesia and four regional trade partners: China, India, Thailand, and Vietnam. Indonesia gained from trading primary materials while losing in some low-cost manufacturing sectors. The potential for trade expansion remains large, as trade patterns differ among regional partners.
1. Introduction
Although a relative latecomer to free trade agreements (FTAs), for the last 25 years, Indonesia has engaged in a significant number of multilateral, regional, and bilateral agreements. In 2018, Indonesia was engaged in FTAs with 19 countries, and it currently has 23 other regional and bilateral agreements either proposed or under consultation or negotiation. Additionally, efforts to liberalize trade and diversify economic activity include lowering tariffs in line with commitments under WTO 1990 agreements, reducing export taxes and subsidies, removing non-tariff barriers (NTBs), and applying trade facilitation measures. As a result, average tariffs in Indonesia declined from 27% in 1986 to 2.0% in 2020.
Indonesia is a member of the Association of Southeast Asian Countries (ASEAN) Free Trade Area (AFTA), together with the nine other member countries. ASEAN also signed up with six other partners: China (ACFTA), South Korea (AKFTA), India (AIFTA), Australia-New Zealand (AANZFTA), and Japan CEPA (AJCEPA). Indonesia also signed with Japan, Pakistan, Chile, Iran, and Australia at the bilateral level.
The increased implementation of trade agreements has stimulated empirical and theoretical studies on the effect of FTAs on trade flows. The signing of trade deals is accompanied by trade creation and trade diversion effects, as noted by Viner (1950). Trade creation involves substituting goods initially sourced from non-free trade partners with products sourced from regional members. On the other hand, FTAs can lead to trade diversion in which goods from outside the region substitute products from intra-bloc members. Commonly, both trade creation and diversion effects follow the realization of a free trade agreement. The question is: which effect is larger and are free trade regions valuable or not (Taguchi 2015)?
The empirical analysis of trade integration was initiated by Pöyhönen (1963) and Tinbergen (1962), embracing the gravity approach to explore the creation or diversion of trade deriving from trade agreements. Anderson (1979) expanded the theoretical foundation for gravity models and was later followed by other scholars (Anderson and Van Wincoop 2003; Baier and Bergstrand 2004, 2007). The gravity model rose as a powerful method to assess the effect of trade integration in an ex post way (Head and Mayer 2014).
This paper questions whether Indonesia’s implementation of FTAs with sixteen regional partners has supported trade creation or diversion and whether the FTAs might be changing patterns of comparative advantage and export specialization for Indonesia over time.
To solve the first question, we apply the gravity trade model to estimate the effect of FTA agreements on trade flows for Indonesia and ASEAN Plus Six regional partners (Australia, China, India, Japan, New Zealand, and South Korea). We investigate the trade creation effects across three sub-groups of manufactured goods (low, medium, and high technology) based on Lall’s (2000) classification and two natural-resource-related groups (naturally sourced products and primary products). We cover the period from 2007 to 2017, employing a generalized method of moment (GMM-sys) to estimate the gravity equation. As a robustness test, we use the Poisson pseudo-maximum likelihood (PPML) estimator.
Second, we compute an adjusted revealed symmetric comparative advantage (RSCA) indicator and a trade balance index (TBI) at six-digit level (HS data) for all Indonesian free trade partners for 2005, 2010, and 2016. By mapping goods based on comparative advantage and specialization, competition patterns and prospects for regional trade expansion are revealed. Although RCA has limitations, it is a reliable and consistent tool to reveal specialization patterns across countries (Kitetu et al. 2021; Laursen 2015). Advantage–specialization patterns allow assessment of the area’s trade performance and discovery of its strength, vulnerabilities, and prospects for deeper regional trade.
We contribute to the debate on the effect of trade agreements by empirically testing whether the implementation of trade agreements has led to wider regional trade in a dynamic region of Asia, that is, among the ASEAN Plus Six (now changing to the Regional Comprehensive Economic Partnership, RCEP). Contrary to other studies where the gravity model is applied to highly aggregated data, we provide empirical evidence for more homogenous groupings of products to avoid aggregation bias of unrelated goods (Okabe and Urata 2014). Previous studies carrying out gravity models supported the positive effect of ASEAN regional partners, as for China (Yang and Martinez-Zarzoso 2014), India (Khurana and Nauriyal 2017), ASEAN in agricultural goods (Sugiharti et al. 2020b), or other Asian partners (Handoyo et al. 2021; Taguchi 2015). We explore a broader scope of regional country members (ASEAN plus China, Japan, India, Australia, New Zealand, and South Korea) and offer empirical evidence of trade agreements for different groups of products that are rarely covered.
The second contribution of this paper is that, to our knowledge, no previous study on trade specialization covering all Indonesian free trade partners has been carried out. While the liberalization process is deep, a hypothetical shift of specialization patterns is highly possible (Balassa 1965; Fanelli and Giglio 2020; Widodo 2009), as many barriers have been removed, tariffs reduced, and increasing demand is supportive of trade flows. Besides, competition has increased drastically in the Asia-Pacific region (Mattoo et al. 2017; Purwono et al. 2020), suggesting that dynamic changes occur. Combining the estimates from the gravity model and the competitive–specialization mapping offers a unique approach.
The case of Indonesia is appealing for different reasons. First, Indonesia is the largest country by population, economy, and territory among ASEAN members. Second, earlier studies pointed out that increasing trade liberalization in Indonesia is accompanied by increasing competition in regional (ASEAN and Asia) partners, i.e., Thailand, Vietnam, China, and India (Esquivias 2017; Padilla et al. 2019). This begs the question as to whether broadening agreements results in larger trade and easier access to markets for Indonesia or whether it makes the competition fiercer. Third, Indonesia produces plenty of naturally sourced goods and has a lot of labor-intensive manufacturing (Sugiharti et al. 2020b) but lags in advanced manufacturing (Purwono et al. 2020). Therefore, it is worth exploring whether integration leads to trade creation or trade diversion that impacts Indonesia’s regional value chains.
2. Literature Review
This paper aims at filling two gaps in the literature. First, the trade creation/diversion effects for sub-groups of products in the ASEAN Plus Six region remain open to empirical evidence. While the effects of liberalization in manufacturing and agricultural trade are commonly studied (Handoyo et al. 2021; Sugiharti et al. 2020a), there is a research gap in the impact of liberalization on disaggregated product groups. We aim to look at the effects across production related to countries’ technological capabilities and factor endowments. Second, although some studies give valuable insights into factors promoting trade, mainly through gravity models (Kohl 2014; Shepherd 2019), they often miss portraying where the comparative advantages and specializations of specific countries lie and what changes they experience after engaging in liberalization–integration efforts.
FTAs are frequently presented as supporting trade expansion by reducing tariffs and adopting non-tariff measures and trade facilitation, among other mechanisms, which are channels for export expansion (Heo and Doanh 2020; Shepherd 2019). Still, the extent of the impact of trade agreements on trade promotion remains unsettled. Baier et al. (2019) and Kohl (2014) systematically looked at many empirical studies on the effect of trade agreements on trade flows based on gravity models, showing mixed empirical results across regions, agreements, and time. While a large amount of evidence supported trade creation (Taguchi 2015; Yang and Martinez-Zarzoso 2014), effects could also be adverse (trade diversion), as noted by Khurana and Nauriyal (2017) in ASEAN–India trade.
There is substantial evidence of FTAs supporting trade expansion. Kohl (2014) noted that most agreements supported trade by nearly 50%. However, only a quarter of trade agreements could be identified as clearly trade promoting. In ASEAN, lowering tariffs supported intra-ASEAN trade, although more substantial benefits (trade expansion) could be achieved by implementing non-tariff measures (Okabe and Urata 2014). Trade agreements’ effects on larger imports were also observed in the literature, with positive impacts on access to cheaper and higher quality inputs but, at the same time, pressuring the domestic competition (Dai et al. 2014; Handoyo et al. 2021). Okabe and Urata (2014) noted that the agreement supported trade creation effects in many products, while evidence of trade diversion effects was found in nearly half of the goods studied.
The economic integration of ASEAN with other Asian partners under the Regional Comprehensive Economic Partnership (RCEP) is the most ambitious regional project to date. The strategy that proposes broader trade agreements with nearby (geographically) partners suggests that regional members could benefit from what Deardorff (2004) coined as “local comparative advantage”. Still, evidence suggests that the ASEAN Plus Six strategic partners’ bilateral agreements led to mixed outcomes (Handoyo et al. 2021; Taguchi 2015), with partners like China gaining more than other partners (e.g., India or South Korea).
Several studies supported a more extensive growth of manufacturing trade in Asia under intra-industry trade, IIT (Okabe and Urata 2014; Yang and Martinez-Zarzoso 2014). Manufacturing goods involved larger volumes of intra-regional trade under fragmented structures (Purwono et al. 2020), partly due to the drive in demand from China and Asian countries (Purwono et al. 2021; Sugiharti et al. 2020a) and partly due to decreasing coordination and transportation costs.
The literature on economic growth and trade often presents comparative advantage and specialization as dynamic because they change countries’ trade patterns over time (Neganova and Chistyakov 2020; Verter et al. 2020). Changes in trade patterns also reflect the dynamics of structural variations within countries, although patterns tend to fluctuate smoothly over time (Kitetu et al. 2021; Sposi 2015). In classical and neo-classical trade theories, shifts in comparative advantage across countries arise mainly because differences in productivity across sectors and goods are either supported by technology (Ricardian) or factor endowments (Heckscher–Ohlin). Variations in advantage are more significant in naturally resourced sectors (Esquivias 2017; Hoang et al. 2017; Sugiharti et al. 2020b) and less developed countries (Neganova and Chistyakov 2020).
The implementation of multiple agreements and improvement in competitiveness and productivity are likely to shift the pattern of trade in the dynamic South and East Asian regions, as noted by Shepherd (2019), suggesting the need to identify swings and to position countries in the context of a more liberalized, integrated area.
3. Methodology
This study employs two approaches. First, a gravity model estimates trade creation or diversion effects among regional trade partners. Second, we estimate the revealed comparative advantage (RCA) and the trade balance index (TBI) to identify trends in exports among trading partners. A particular focus is given to the case of Indonesia, the largest economy and most populated market in the ASEAN.
3.1. Gravity Model
In a generalized gravity equation, trade is positively related to markets’ economic size and population and negatively associated with distance. Anderson and Van Wincoop (2003) introduced multilateral resistance terms (MR terms) to capture some of the partners’ varying circumstances in terms of cost in a country-specific and time-specific way (Feenstra 2015). Since country- and time-specific effects are habitually unobservable, gravity models account for heterogeneity among partners by employing data panels and introducing country- and time-specific effects (Baier and Bergstrand 2007). Country fixed effects and time effects are introduced as variable dummies.
Moreover, trade agreements are included in the gravity model as independent variables to explain trade creation or diversion effects. We introduced three dummy variables to estimate the effects of current FTAs on trade creation (larger intra-region trade), export creation extra-region, and trade diversion, as in Yang and Martinez-Zarzoso (2014).
The dynamic GMM system was employed to estimate the gravity model, as in Martínez-Zarzoso et al. (2009), and introduced lagged bilateral exports as an independent variable to capture the effect of time-varying components.
where Expijt is exports between the country i (exporter) and the importer country j in year t; Yit and Yij are GDPs of the markets (exporter i and importer j); Popit and Popjt are the populations of exporter (i) and importer (j) partners at year t; and Distij represents the geographic distance between these partners. , and are dummy variables to capture intra-region and extra-region effects. FTA1 is a dummy variable equal to one when both exporter and importer countries are in a trade agreement and zero otherwise. FTA2 is a dummy variable that equals one when only the exporter country is a member of the free trade area and zero otherwise. FTA3 is a dummy variable that takes a value of one when only the importer country is an FTA member and zero otherwise. Country fixed effects were introduced as dummy variables for each country (exporter and importer), as in Baier et al. (2019). Specifically, represents a dummy for exporter country effects, while denotes importer country effects.
The three dummy variables, FTA1, FTA2, and FTA3, aimed to estimate the trade creation or trade diversion effects arising from the FTAs’ implementation. The logic implies that the trade creation effect (increasing intra-bloc trade, FTA1) is followed by a decreasing import from extra-region partners (trade diversion, FTA3), thereby canceling part of the FTA effects. By contrast, larger exports to intra-bloc partners (trade creation, FTA1) are followed by larger exports to extra-bloc partners (FTA2), thereby creating more trades. The estimation captured the effect magnitudes and direction, hence, capturing FTA impacts: whether trade creation is more dominant than trade diversion or vice versa.
‘Pure trade creation’ indicates that the agreement promotes larger trade flows than usual within the ASEAN Plus Six country members. Our results aligned with previous studies covering the ASEAN (Handoyo et al. 2021) and other integrated regions (Egger et al. 2022). Additionally, a statistically significant and positive sign on the FTA3 dummy variable indicates that imports from outside the bloc increased in the bloc (pure trade creation in extra-bloc imports). Broader, extra-bloc sourcing is associated with a more efficient supply of goods, allowing access to vital inputs and possible welfare gains due to lower prices. As a comparison to the GMM results, we used the Poisson pseudo-maximum likelihood (PPML) estimator. Both GMM and PPML allow to control for endogeneity. The PPML was utilized as a robustness test. The PPML has proven results in controlling for heteroskedasticity, becoming increasingly popular in estimating gravity models (Silva and Tenreyro 2006). Other approaches (i.e., the two-stage approach of Heckman) exist (Tran et al. 2013). Using the same coefficients as in Equation (1), the following equation was proposed for the PPML:
3.2. Revealed Comparative Advantage (RCA) and Trade Balance Index (TBI)
A second approach focused on measuring comparative advantage and trade specialization. Revealed comparative advantage (RCA) indexes and alternative measures and theoretical elements were discussed in the following papers: (Costinot 2009; Laursen 2015; Di Giovanni and Levchenko 2009; Sposi 2015). Additional empirical studies of factors driving changes or explanations in RCA and specialization patterns were covered in the following: (Balassa and Noland 1988; Hoang et al. 2017).
The calculation of comparative advantage was based on the RCA index proposed by Balassa (1965). The revealed comparative advantage index denotes “the relative export performance of a country in particular goods”. The index reveals the trading nations’ advantages centered on cost factors, service link cost, and other non-price elements. RCA indexes were obtained by dividing a nation’s share in the exports of a given product by the share in world exports of the same good:
- RCAij = country’s j revealed comparative advantage for commodity group i;
- Eij = exports of good i by country exporter j;
- Etotj = total exports—merchandise alone, excluding services.
The revealed symmetric comparative advantage (RSCA) index advanced by Dalum et al. (1998) was constructed based on RCA with a “simple decreasing monotonic transformation” expressed as:
The RSCAij index takes values in the range of minus one to one (−1 ≤ RSCAij ≤ 1). Values of RSCAij beyond zero infer a comparative advantage of country i in the group of products j. An RSCAij value lower than zero suggests a comparative disadvantage of country i in the group of products j.
The trade balance index (TBI) identifies whether the country has export specialization as a net exporter or a net importer (Lafay 1992). The TBI signals whether a specific good contributes to national surplus or drives trade deficit with trade partners. TBI is expressed as:
- TBIij = trade balance index of country i for products j;
- xij = exports of product j by country i;
- mij = imports of products j by country i.
The values of the TBI range from −1 to 1. The TBI equals −1 if a country only imports (net importer) and 1 if it only exports (net exporter).
Accompanying the analysis of indexes, “product mapping” (Widodo 2009) was used to classify products into four groups: A, B, C, and D (Figure 1).
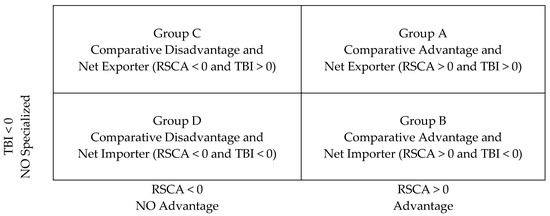
Figure 1.
Product mapping chart. Source: (Widodo 2009), adapted by the author.
Group A includes goods that enjoy the comparative advantage and export specialization; Group B includes commodities that reveal comparative advantage but no export specialization; Group C includes is goods with export specialization but that do not reveal comparative advantage; and Group D includes products with neither comparative advantage nor export specialization.
After the computation of the RCA, RSCA, and TBI values, all the goods were categorized based on the four groups (A, B, C, or D) for each year. Each product was also given a status (Champion, New A, or No Longer A) depending on whether the good enjoyed and maintained a comparative advantage for the whole period (Champion), gained RCA (New A), lost RCA (No Longer A), or never enjoyed RCA. The degree and the status of the advantage helped to trace inter-temporal fluctuations.
The study mapped and cross-analyzed all RSCA and TBI indicators for all trading partners, finding goods that compete (Group A), products in which one country enjoys A status and the others B or D status (net importer), and goods for which there is no competition. This allowed the calculation of the competitive environment, as well as the seizing of opportunities and the discovery of threats to further liberalization.
3.3. Data
A panel data model for 38 countries was employed to estimate the gravity model, covering 2007 to 2017. Sixteen member countries of the ASEAN Plus Six regional group and 22 other non-trade bloc members were included. The ASEAN Plus Six region is currently under revision and changing into a broader, regional free trade agreement (RCEP). The core variables used in this study were exports (data in current USD), real GDP (current USD), total yearly population, and the geographical distance between the capitals of each country (extracted from indonesia.distanceworld.com). Data in bilateral export flows were obtained in annual series from the International Trade Center. Real GDP and population per country were extracted annually from the World Development Indicators. Table 1 displays the summary statistics.

Table 1.
Summary statistics.
Besides, looking at the manufacturing sector, we aggregated data on five main groups based on technology and skills intensity, as in Lall [10]: High Tech, Medium Tech, Low Tech, Naturally Sourced Goods, and Primary Products. The last two groups refer to natural resources.
The panel’s trading partner countries are 10 ASEAN countries and the six strategic ones. The ASEAN countries are Indonesia, Malaysia, Thailand, Philippines, Singapore, Vietnam, Laos, Cambodia, Brunei, and Myanmar. The six strategic partners include China (joined in 2005), South Korea (2007), Japan (2008), Australia and New Zealand (2010), and India (2010). Additionally, 22 non-FTA partner countries are included in the panel: Bangladesh, Belgium, Brazil, Canada, Egypt, France, Germany, Hong Kong, Iceland, Italy, Mexico, Netherlands, Nigeria, Norway, Pakistan, Russia, Spain, Switzerland, Turkey, United Arab Emirates, United Kingdom, and the United States.
4. Results
4.1. Trade Creation and Trade Diversion Effects
The main objects of interest in the gravity model were the three FTA dummy variables that capture the trade creation/diversion from FTAs. Moreover, in Table 2, we compute the net trade effects (creation or diversion) of all four manufactured goods groups, the naturally sourced goods, and the primary products using an approach proposed by Carrere (2006) and Martínez-Zarzoso et al. (2009). The impact of the agreements (net trade effect) was captured by the three FTA dummy variables: , estimated using Equation (1) (coefficients in Table 3).
Table 2.
Net trade creation or diversion effects.
Table 3.
Trade determinants (ASEAN Plus Six trade).
Overall, the FTA dummy variables had a statistically significant impact on exports (Table 2 and Table 3). In the case of manufactured goods, there was an overall trade creation in exports (FTA1) and a pure trade creation in imports for the regional members. ‘Pure trade creation’ indicates that the agreement promoted larger trade flows than usual within the ASEAN Plus Six country members. Similarly, the positive value in the dummy variable for FTA2 indicates an increase in exports to extra-member countries, suggesting larger trade with other regions. Additionally, a statistically significant and positive sign on the FTA3 dummy variable indicates that imports from outside the bloc have increased in the bloc (pure trade creation in extra-bloc imports). Broader, extra-bloc sourcing is associated with a more efficient supply of goods, allowing access to vital inputs and possible welfare gains due to lower prices. Our results for manufactured goods were in line with previous studies in ASEAN (Handoyo et al. 2021) and other integrated regions (Egger et al. 2022), agreeing that regional integration promotes manufactured goods’ trade flows.
The sub-groups of manufactured products (high, medium, and low tech) differed from the more aggregated category of manufactured goods. High-tech goods experienced negative effects from the implementation of FTAs, suggesting that exports under this category grew more slowly than when the FTA was absent. Both FTA variables for intra-bloc (FTA1) and extra-bloc trade (FTA2 and FTA3) were negative. As exports of high-tech goods were differentiated and specialized, they likely rely on a higher degree of demand forces rather than on the absence of tariffs alone. Besides, high-tech exports were concentrated in a few countries (i.e., China, Japan, and South Korea, as noted in (Purwono et al. 2022)). During the analysis period, some ASEAN members developed capability in high-tech sectors, such as transportation, chemicals, and electronics (Purwono et al. 2020; World Bank 2019), suggesting a possible substitution of imports for domestic goods.
Medium-tech goods experienced faster than usual trade within the regional bloc (FTA1) due to the free trade agreement. Nevertheless, exports of medium tech to non-trade partners signaled a negative FTA2 coefficient, suggesting trade diversion in extra-bloc exports. Overall, exports of medium-tech goods faced a net trade diversion effect (reduction of −10.9%). It is worth noting that emerging countries outside the bloc expanded rapidly in exports of medium-tech goods (e.g., South Asian countries, Russia, and Brazil), likely resulting in larger competition on the global market for such goods.
Low-tech goods exports were emerging, showing faster trade within the regional bloc (FTA1), more trade in extra-bloc exports (FTA2), and more imports from non-trade partners (FTA3). As a result of the FTAs, low-tech goods net trade creation reached 61.9%, suggesting that FTAs effectively increase the trade of low-tech goods.
The results for naturally sourced goods indicated a statistically significant and negative effect on the FTA1 dummy variable. A negative FTA1 signals a decrease in intra-region exports, while a negative effect on the FTA2 dummy suggests the presence of export diversion (lower exports to non-partners). Besides, a negative FTA3 variable also supports import diversion, a shift from, initially, intra-bloc goods to extra-bloc products. The net trade creation for intra-bloc goods was negative for naturally sourced goods. Trade diversion means the transfer of trade from treaty member countries to non-member countries (Schaak 2015) or the redirection of trade to non-member partners (De Benedictis et al. 2005). Dai et al. (2014) noted that trade diversion effects could signal increasing foreign competition, both in intra-regional trade and domestic activities. Urata and Okabe (2014) found that the ASEAN FTA caused trade creation and diversion impacts in the region.
A statistically significant and positive FTA1 variable implies trade creation in exports for primary products. The effects of FTA2 (exports to extra-bloc) and FTA3 (imports from extra-bloc) were statistically insignificant. In a study covering FTAs for dairy products, Schaak (2015) found that FTAs favored intra-bloc partners with broader goods sourcing. Sugiharti et al. (2020b) also found trade creation in natural resource goods, supporting our findings.
4.2. Trade Determinants
We will now discuss the results obtained for the core variables in the gravity model (Table 3). First, the coefficient for lag exports (t − 1) was positive and significant for the six groups of products. This variable illustrated the strong effect on persistence (dynamic component) often observed in the literature (Egger et al. 2022; Heo and Doanh 2020). The sunk cost associated with developing export markets suggested that exports display persistency, meaning that, once markets are open, exports are highly likely to continue from year to year. Apart from that, in regional partners, it is likely that cultural ties and affinity built across long periods will help to build more persistent trade links.
Additionally, we found that income (proxied by GDP) for both exporter and importer countries had a positive and statistically significant effect on total exports for all group categories. The only exception was in the exporter country’s GDP for high-tech manufacturers, where the coefficient was negative and significant. Income (proxied by GDP) had a stronger positive effect on export flows for manufactured goods than naturally sourced groups. Our findings showed that both the exporter (production capacity) and the GDP of the importer (purchasing power) had important roles in explaining regional trade flows. High-tech goods, natural, and primary products had larger coefficients in the importer’s GDP than the other groups, suggesting a more crucial role for buyers’ income in explaining the demand for exports.
As for population, the exporter country had a statistically significant and positive effect on exports of all groups but manufactured goods. Large countries, such as China, India, Indonesia, Japan, Vietnam, and the Philippines, had more abundant possibilities for exports than smaller countries or less naturally endowed nations. Having a bigger population also allowed for a broader scope of specialization and scale, suggesting that large countries may capture the benefits of free trade. On the other hand, the coefficient for the importer countries was negative and statistically significant for all but primary products. Importer countries probably have strong internal supply, widely available factor endowments (less import dependence), and more diversified production activities, as noted in Yang and Martinez-Zarzoso (2014). Our findings aligned with Heo and Doanh (2020) in the North American region, who found that large markets (population) cause less reliance on foreign goods. In the case of primary products, the relationship between exports and the total population of importer countries was positive and statistically significant. Demand for primary products in large countries (China, India, and Indonesia) grew substantially during 2007–2017.
Finally, the results related to the distance between the trading partner countries’ capitals negatively affected exports for all groups studied. Our findings were consistent with theoretical and empirical studies (Bergstrand et al. 2015; Heo and Doanh 2020) and indicated that the farther the distance, the smaller the trade flow (Baier et al. 2019; Egger et al. 2022). High transportation costs, associated with long distances and time, can decrease the volume of trade (Yang and Martinez-Zarzoso 2014). The coefficient was more considerable for natural, primary commodities, and medium-tech products, suggesting that transportation cost may be an important aspect of competitiveness within those sectors.
The results for natural resources supported previous findings in Southeast Asia, suggesting the higher impact of transportation costs (Sugiharti et al. 2020a; Purwono et al. 2020).
Robustness Test
Ensuring the validity of additional instruments in the GMM-sys was carried out by employing the Sargan–Hansen test. Two important requirements must be satisfied. First, the instruments employed should be relevant to the model, meaning they must be correlated with the proposed variables (endogenous) and uncorrelated with the error term. Second, the residuals must not include second-order correlation. The Sargan–Hansen test looked at the possible over-identifying restriction in the model. The test values are displayed in the results table. Furthermore, estimates for the dynamic panel model must be robust to the first-order autocorrelation and heteroskedasticity.
Additionally, an F-test (Prob > F) was carried out to determine the independent variables’ simultaneous significance in influencing the dependent variable. A partial test (t-test) verified the significance level of the independent variables. Testing was carried out by observing both the t-value and the p-value.
The dynamic GMM-sys was employed to estimate the gravity model, with results reported in Table 2 and Table 3. As a comparison, we used the Poisson pseudo-maximum likelihood (PPML) estimator. The PPML is increasingly popular in estimating gravity models, mostly in the presence of zero trade values.
Overall, the findings using the PPML (Table 4) confirmed the results (especially the sign) from the GMM model in both the core gravity variables and the dummy variables for FTA effects. Few differences were found. The PPML indicated a trade creation in exports within the ASEAN Plus Six region (FTA1) and extra-region (FTA2). However, there was trade diversion in manufactured exports from extra-region to ASEAN (negative FTA3). In the case of high-tech, medium-tech, and low-tech products, the FTA dummy variables all had the same sign in the coefficients when using the PPML or GMM. The magnitude differed among models, as the data of GDP and population were rescaled for the PPML model (as suggested when using PPML). In the case of resource-based products, the PPML indicated trade creation in exports to regional partners (FTA1), contrary to the results of the GMM (diversion). However, the impact of FTA2 and FTA3 had the same direction for both models. Primary products had same direction in the effect of the three FTA variables, although the PPML indicated significant impact on FTA3 (not significant when using GMM).
Table 4.
PPML estimates.
4.3. Pattern of Indonesian Trade
The gravity model helped identify trade determinants in the context of ASEAN Plus Six. However, a second approach was needed to identify specific opportunities for Indonesia and capture possible changes in the trade pattern during the liberalization period. The second method measured the comparative advantage and trade specialization of 5100 Indonesian products against all ASEAN Plus Six partner countries. The study mapped and cross-analyzed all RSCA and TBI indicators for all trading partners’ and groups’ products in sub-categories: High Tech, Medium Tech, Low Tech, Primary Products, and Naturally Sourced Goods. This allowed the identification of the opportunities and threats during the liberalization process.
Table 5 displays key indicators of trade related to total exports, compound annual growth rate (CAGR), the export share per category, and the export share to FTA regional partners and non-partners. In 2016, exports from Indonesia to trade partners accounted for nearly 64% of total exports (USD 144.4 billion). From 2003 to 2016, Indonesia’s nineteen trade partner countries were responsible for 65% of export expansion, mainly through rapid growth in raw materials and natural resource exports. Indonesia’s trade reoriented to Asian markets (China, ASEAN, and other FTA partners, see Table 6), mainly supported by strong economic growth, massive demand, and high commodity prices (Padilla et al. 2019; Purwono et al. 2020).
Table 5.
Indonesian exports and indicators, 2005, 2011, and 2016.
Table 6.
Indonesian export growth to/from trading partners, CAGR, 2005–2016.
Although there were substantial changes within group categories, Indonesia’s pattern of trade remained positively related to natural resources, primary goods, and low-tech sectors (footwear and miscellaneous, Table 5). Indonesia also lowered its share of exports in machinery (−5%), miscellaneous (−2%), and textiles (−3%), probably losing in competition to China, Vietnam, and other low-cost countries in Asia. Indonesia gained penetration in new sectors, likely as new trade promotion policies were fostered (Ajija et al. 2021). Transportation goods and stone/glass reported the largest compound annual growth rate (15% CAGR), followed by vegetable products, foodstuffs, chemicals, and footwear. Vegetable goods accounted for 22% of the total export growth for Indonesia.
Although Indonesia adopted trade policies that shift away from naturally sourced goods and primary goods (Ajija et al. 2021), they still represented 56% of total export expansion. Table 6 reports the export growth indicators per group and market destination. Indonesia benefited from the boom in demand for raw materials in East Asia and the high global commodity prices (Padilla et al. 2019; Sugiharti et al. 2020a; Esquivias 2017). Exports experienced fast growth until 2011 (nearly USD 205 billion), declining because of (1) effects from stronger regional competition within machinery/electrical and textiles; (2) a fall in commodity prices in minerals causing −13.7% (CAGR) loss in exports, rubber (−11.8%), metals (−7.6%), vegetable oils, and chemicals; (3) pressure in global demand; and (4) post-financial crisis of 2008–2009 (Purwono et al. 2022).
4.4. Product Mapping and Changes in the Pattern of Indonesian Trade
As explained in Figure 1 (product mapping chart), the 5100 products were categorized according to the comparative advantage (RSCA) and trade balance index (TBI). Table 7 indicates the total number of products under each category (A, B, C, or D), the share of the products on total exports, and the export share of each category. As an example, within the category of animal products, a total of 35 goods were categorized as A (advantage and specialization); they contributed to 2% of total exports, and they (A) accounted for 96% of exports of animal products. For most countries, more than 70% of the total exports were from Group A, meaning that advantage and specialization were relevant in the export pattern for Indonesia, making both of these indicators important for trade analysis.
Table 7.
Number of A, B, C, and D goods, share from total exports, and share from sector (Indonesia, 2016).
In the Indonesian case, animal products, footwear, vegetable, wood, and textile products were highly determined by comparative advantage and specialization (Group A). More than 90% of the exports under those sectors corresponded to goods under the A category (Table 7), in line with Esquivias (2017). A similar pattern to Indonesia was observed for ASEAN countries within the agriculture or natural resource sectors (Sugiharti et al. 2020b). On the other hand, Indonesia’s import pattern is characterized by products that cannot be produced competitively at home (86% of goods had no comparative advantage) or goods with no specialization (net import in 91% of imports).
In 2016, 80% of Indonesia’s total exports belonged to goods under Group A (Table 8). In Indonesia, Champion products (A status from 2005 to 2016) accounted for 65% of total exports in 2016. The number of sectors losing their A status after 2005 dropped, to account for only 7% of total exports in 2016. New products that gained A status after 2005 represented 16% of exports in 2016. From 2005 to 2016, Indonesia shifted slightly towards more differentiated goods, often within B, C, or even D groups, where advantage and expertise do not necessarily determine competitiveness. Nearly 12% of Indonesian exports were under status D (not specialized and no advantage), mainly related to higher- and medium-tech, and vertical trade (transportation, machinery/electrical, plastics, and metals).
Table 8.
Indonesian A category goods (Champion, New A, No Longer A).
Table 9 displays the number of Group A goods in selected ASEAN Plus Six countries per industry category, which compares changes in competitiveness across partners. The table reports the number of goods that lost A-list status, those that remain on the A list (Champion, 2005–2016), and those that gained A-list status (New A). In Indonesia, 394 products lost their A-list status, 334 products remained competitive, and 248 products gained entered the A list. Indonesia’s loss is greater than that of China, Thailand, and Vietnam, and the gain is also smaller than that of China, India, Thailand, and Vietnam. This suggests that other ASEAN Plus Six partners may have reaped more benefits from the FTAs than Indonesia (See Table 10).
Table 9.
Number of goods that gained A status, lost A status, remained as A status (2005–2016), selected countries.
Table 10.
Share of exports under Group A goods (comparative advantage and export specialization) per country, 2016.
Table 11 displays the number of products that ASEAN Plus Six partners compete in (comparative advantage and specialization). Indonesia faces the strongest competition in goods with A status from China (54% of overlap), India (43%), Vietnam (41%), and Thailand (32%). Sectors that face special competition under primary products are animal products (China, Myanmar, New Zealand) and stone/glass (China, 66%). Within resource-based exports, Indonesia faces strong competition in foodstuffs (Thailand, 50%) and wood products (China, Vietnam). In exports of low-tech goods, Indonesia faces competition in footwear (China (100%), India, Vietnam) and miscellaneous (Vietnam, 54%). In medium-tech exports, competition arises within metals (China), plastics (Thailand (75%), China, Malaysia, Vietnam), and transportation (India, Japan, Thailand).
Table 11.
Percentage of A goods that compete with Indonesian A goods.
4.5. Trade Expansion of Indonesia with Trade Partners: Implications
Although Indonesia faces intense competition with China, India, Thailand, and Vietnam (see Table 9 and Table 10), all countries offer trade expansion opportunities within specific categories. Indonesia competes in only a few sectors with Australia-New Zealand, Brunei, South Korea, and Singapore. At least half of the A goods within Indonesia can access foreign trade partners’ markets.
A lesson from the past decade of Indonesian trade is that a pattern of exports highly related to comparative advantage and trade specialization can offer benefits in times of bonanza, but it also provides adverse effects in times of shocks. In the same way that exports expanded rapidly from 2005 to 2011, exports also contracted sharply from 2012 to 2016 (Padilla et al. 2019; Sugiharti et al. 2020a). India, Indonesia, Japan, and Vietnam reinforced their trade pattern in A goods, while most of the other Indonesian trading partners shifted to a lower share of exports in A goods.
Another aspect of the expansion of Indonesian trade with trading partners is that imports grew faster than exports. Only with ASEAN partners did Indonesia report more exports than imports in value terms, while, with China and East Asia, it reported smaller export growth. Table 6 indicates the growth of imports in Indonesia at the sectoral level, where China and other trade partners benefited from the FTAs. Indonesia benefited from the trade agreements in the categories of resource-based (foodstuffs and vegetables), resource-based (minerals), and medium tech (transportation) where exports exceeded imports.
The pattern of trade expansion in Indonesia has several implications. First, it puts severe pressure on Champion sectors (traditionally enjoying advantage and specialization). China, Vietnam, Thailand, and India exert intense pressure on traditionally competitive sectors in Indonesia (low-tech goods). Second, Indonesia positively benefitted from high commodity prices and a boom in demand within the natural resource and primary products sectors (minerals, organic chemicals, stone/glass, vegetable products), reaping maximum benefits in the agreements within those groups. Third, Indonesia revealed lower engagement than its trading partners in medium- and high-tech manufactured goods (machinery, electric, electronics, computers, and telecommunication), which rapidly expanded in the past decade under fragmented networks, missing a decade of manufacturing within those fast-growing sectors. Fourth, Indonesia consolidated its advantages in its smaller number of A goods and gained a new set of commodities that accounted for larger gains than those that vanished in the No Longer A product group (Table 8). Fifth, gains in new competitive products revealed the relocation of resources to new fields with higher efficiency and exposed to larger exports.
4.6. Implications for the ASEAN Plus Six Region
Overall, the FTAs helped expand intra-regional trades in all groups (trade creation) as long as they were high-tech and naturally sourced goods. However, FTAs failed to support extra-regional trade of the five product sub-categories. This suggests the need for further collaboration in the region and more collaborative efforts to build a more competitive ASEAN bloc. Improvements in transportation, trade facilitation, further liberalization of capital, labor, and service flows may facilitate a more strategic resource distribution. Similarly, improvements in technological capabilities may help the ASEAN Plus Six members to improve competitiveness in high-tech and medium-tech goods exports to extra-regional partners.
The distance, a proxy for transportation costs and time, suggests that transportation logistics are an important determinant for trades in ASEAN Plus Six countries, especially for natural, primary commodities, and medium-tech products. The ASEAN Plus Six countries should make more efficient transportation systems if they seek improvement in trades internally and externally. Finally, the ASEAN Plus Six’s markets seem to be continuously expanding as the increasing income and population boost trade activities.
Regarding the approach, GMM generally performed better than OLS, fixed effects (Martínez-Zarzoso et al. 2009; Weidner and Zylkin 2021), and instrumental variable methods (Egger et al. 2022). Nevertheless, GMM tended to over/underestimate the effects of FTAs, partly because controlling heterogeneity across countries is challenging. In cases such as primary commodities and naturally sourced goods, analyzing a single country’s effects might not have been captured by GMM as some ASEAN countries dominate specific commodities (e.g., rubber, crude palm oil, and coffee). Changes in global prices, demand, and supply swings could have produced inaccuracy. Further studies could consider employing the Poisson pseudo-maximum likelihood (PPML) approach by Silva and Tenreyro (2006) or the two-step procedure by Heckman (1979). Both approaches are robust in estimating gravity models and can handle the presence of zero. More disaggregated groups of products are likely to include zero observations, suggesting that Heckman (Tran et al. 2013) or PPML models may be more appropriate in such a context. Finally, further studies may consider additional, country-specific factors in the gravity model (i.e., common language, colonial ties, exchange rate, and common borders, among other commonly employed variables).
5. Conclusions
This paper analyzes whether the liberalization through the agreements signed by Indonesia with nineteen countries supported trade creation effects, allowing the country to benefit from the free trade schemes and whether the additional trade agreements might be changing patterns of exports and imports for the country over time. This study first applied a gravity model to estimate the effect of FTAs in trade flows among 16 economies in the ASEAN Plus Six region. We applied a generalized method of moment (GMM-sys) and the Poisson pseudo-maximum likelihood (PPML) estimator. We aggregated goods in six different categories to avoid aggregation bias. Manufactured goods, medium tech, low tech, and primary products experienced trade creation effects derived from the implementation of regional FTA agreements. High tech and natural products saw trade diversion in intra-region trade and exports to extra-regional partners. All groups of products had significant, dynamic effects (persistence in trade). Transportation cost and distance matter to a larger extent for medium-tech goods, natural, and primary products.
Secondly, this study mapped the more than 5100 six-digit goods categorized by the HS 1998 system based on comparative advantage RCA and trade balance index to find patterns of competition and further opportunities to expand trade with strategic partners. The study covered Indonesia and leading trade partners for three periods: 2005, 2010, and 2016. Several conclusions can be pointed out. First, the large number of trade agreements signed by Indonesia might have supported the rapid expansion of trade experienced by the country, as most of the trade gains took place with regional partners. Second, trade partners also underwent large economic trade expansion, offering opportunities to Indonesia to expand trade and benefit from the large and growing market in Indonesia. Third, the growth of Indonesia was strongly supported within the naturally sourced and primary product sectors that reaped the most significant gains. Fourth, the opening of markets might have contributed to a healthier competitive environment for Indonesia’s traditional industries (textile, footwear, and wood, among others). Countries with similar patterns to Indonesia benefited from opening markets (China, Vietnam, and Thailand). Fifth, the Indonesian backbone sector (competitive since at least 2005) accounts for nearly 65% of total exports. Some commodities lost competitiveness (394), while 248 new ones gained competitiveness. Sixth, Indonesia developed capabilities within new sectors (i.e., transportation) but lost in rapidly growing sectors in Asia (machinery and electrical), missing a decade of large expansion in production networks in Asia. Seventh, although the competitive landscape is aggressive, possibilities for trade expansion are large, as more than 50% of Indonesian goods enjoy an advantage in fields other countries do not have.
As trade patterns are tight with respect to comparative advantage and export specialization for most trading partner countries, the agreements might have imposed pressure on competition rather than driven additional trade (trade creation) or allowed countries to expand trade with new goods.
Author Contributions
R.P. carried out the supervision, project administration, and validation; M.A.E. carried out the conceptualization, writing—review; L.S. handled the methodology and formal analysis, and funding acquisition. R.D.H. focused on data curation, original draft preparation, carried out the writing—review and editing. All authors have read and agreed to the published version of the manuscript.
Funding
This research was funded by Universitas Airlangga, Surabaya, Indonesia, under the Research Grant Penelitian Unggulan Fakultas. The APC was funded by Universitas Airlangga.
Data Availability Statement
Not applicable.
Conflicts of Interest
The authors declare no conflict of interest.
References
- Ajija, Shochrul Rohmatul, Arivia Fikratuz Zakia, and Rudi Purwono. 2021. The impact of opening the export promotion agencies on Indonesia’s non-oil and gas exports. Heliyon 7: e07756. [Google Scholar] [CrossRef] [PubMed]
- Anderson, James. E. 1979. A theoretical foundation for the gravity equation. The American Economic Review 69: 106–16. [Google Scholar]
- Anderson, James E., and Eric Van Wincoop. 2003. Gravity with gravitas: A solution to the border puzzle. American Economic Review 93: 170–92. [Google Scholar] [CrossRef]
- Baier, Scott L., and Jeffrey H. Bergstrand. 2004. Economic determinants of free trade agreements. Journal of International Economics 64: 29–63. [Google Scholar] [CrossRef]
- Baier, Scott L., and Jeffrey H. Bergstrand. 2007. Do free trade agreements actually increase members’ international trade? Journal of International Economics 71: 72–95. [Google Scholar] [CrossRef]
- Baier, Scott L., Yoto V. Yotov, and Thomas Zylkin. 2019. On the widely differing effects of free trade agreements: Lessons from twenty years of trade integration. Journal of International Economics 116: 206–26. [Google Scholar] [CrossRef]
- Balassa, Bela. 1965. Trade liberalisation and “revealed” comparative advantage. The Manchester School 33: 99–123. [Google Scholar] [CrossRef]
- Balassa, Bela, and Marcus Noland. 1988. Japan in the World Economy. Washington, DC: Peterson Institute. [Google Scholar]
- Bergstrand, Jeffrey H., Mario Larch, and Yoto V. Yotov. 2015. Economic integration agreements, border effects, and distance elasticities in the gravity equation. European Economic Review 78: 307–27. [Google Scholar] [CrossRef]
- Carrere, Céline. 2006. Revisiting the effects of regional trade agreements on trade flows with proper specification of the gravity model. European Economic Review 50: 223–47. [Google Scholar] [CrossRef]
- Costinot, Arnaud. 2009. An elementary theory of comparative advantage. Econometrica 77: 1165–92. [Google Scholar]
- Dai, Mian, Yoto V. Yotov, and Thomas Zylkin. 2014. On the trade-diversion effects of free trade agreements. Economics Letters 122: 321–25. [Google Scholar] [CrossRef]
- Dalum, Bent, Keld Laursen, and Gert Villumsen. 1998. Structural change in OECD export specialisation patterns: De-specialisation and ‘stickiness’. International Review of Applied Economics 12: 423–43. [Google Scholar] [CrossRef]
- De Benedictis, Luca, Roberta De Santis, and Claudio Vicarelli. 2005. Hub-and-Spoke or else? Free trade agreements in the ’enlarged’ European Union. The European Journal of Comparative Economics 2: 245–61. [Google Scholar]
- Deardorff, Alan V. 2004. Local comparative advantage: Trade costs and the pattern of trade. International Journal Economic Theory 10: 9–35. [Google Scholar] [CrossRef]
- Egger, Peter H., Mario Larch, and Yoto V. Yotov. 2022. Gravity Estimations with Interval Data: Revisiting the Impact of Free Trade Agreements. Economica 89: 44–61. [Google Scholar] [CrossRef]
- Esquivias, Miguel Angel. 2017. The Change of Comparative Advantage of Agricultural Activities in East Java Within the Context of Asean Economic Integration. AGRIS On-Line Papers in Economics and Informatics 9: 33–47. [Google Scholar] [CrossRef]
- Fanelli, Rosa Maria, and Alessandro Giglio. 2020. The ‘similarity’ of Agri-Food Trade Flows between the EU-28 and the Asia-50. The International Trade Journal 35: 558–86. [Google Scholar] [CrossRef]
- Feenstra, Robert C. 2015. Advanced International Trade: Theory and Evidence. Princeton: Princeton University Press. [Google Scholar]
- Handoyo, Rossanto Dwi, Lilik Sugiharti, and Miguel Angel Esquivias. 2021. Trade Creation and Trade Diversion Effects: The Case of the Asean Plus Six Free Trade Area. Bulletin of Monetary Economics and Banking 24: 26. [Google Scholar] [CrossRef]
- Head, Keith, and Thierry Mayer. 2014. Gravity equations: Workhorse, toolkit, and cookbook. In Handbook of International Economics. Amsterdam: Elsevier, vol. 4, pp. 131–95. [Google Scholar]
- Heckman, James J. 1979. Sample selection bias as a specification error. Econometrica: Journal of the Econometric Society 47: 153–61. [Google Scholar] [CrossRef]
- Heo, Yoon, and Nguyen Khanh Doanh. 2020. Is NAFTA Trade-Creating or Trade-Diverting? A System GMM Approach. Economic Papers: A Journal of Applied Economics and Policy 39: 222–38. [Google Scholar] [CrossRef]
- Hoang, V., Tien K. Tran, Van B. Tu, Ngoc V. Nguyen, and Quynh A. Nguyen. 2017. Agricultural Competitiveness of Vietnam by the RCA and the NRCA Indices, and Consistency of Competitiveness Indices. AGRIS on-line Papers in Economics and Informatics 9: 53–67. [Google Scholar] [CrossRef]
- Khurana, Richa, and D. K. Nauriyal. 2017. ASEAN-India Free Trade Agreement: Evaluating Trade Creation and Trade Diversion Effects. Journal of East-West Business 23: 283–307. [Google Scholar] [CrossRef]
- Kitetu, Geoffrey Musyoki, Appolinaire Roland Mbante II, and Jong-Hwan Ko. 2021. Revealed Trade Competitiveness between Korea and Japan. Is It Viable to Deepen Economic Integration? Journal of Global Business and Trade 17: 67–84. [Google Scholar] [CrossRef]
- Kohl, Tristan. 2014. Do we really know that trade agreements increase trade? Review of World Economics 150: 443–69. [Google Scholar] [CrossRef]
- Lafay, Gerard. 1992. The measurement of revealed comparative advantages. In International Trade Modelling. Berlin: Springer, pp. 209–34. [Google Scholar]
- Lall, Sanjaya. 2000. The Technological structure and performance of developing country manufactured exports, 1985-98. Oxford Development Studies 28: 337–69. [Google Scholar] [CrossRef]
- Laursen, Keld. 2015. Revealed comparative advantage and the alternatives as measures of international specialization. Eurasian Business Review 5: 99–115. [Google Scholar] [CrossRef]
- Di Giovanni, Julian, and Andrei A. Levchenko. 2009. Putting the Parts Together: Trade, Vertical Linkages, and Business Cycle Comovement. IMF Working Papers. Washington, DC: IMF, pp. 1–55. [Google Scholar]
- Martinez-Zarzoso, Inmaculada, Nowak-Lehmann D. Felicitas, and Nicholas Horsewood. 2009. Are regional trading agreements beneficial? The North American Journal of Economics and Finance 20: 46–65. [Google Scholar] [CrossRef]
- Mattoo, Aaditya, Prachi Mishra, and Arvind Subramanian. 2017. Beggar-Thy-Neighbor Effects of Exchange Rates: A Study of the Renminbi. American Economic Journal: Economic Policy 9: 344–66. [Google Scholar] [CrossRef][Green Version]
- Neganova, V. P., and Yu F. Chistyakov. 2020. Development of Agricultural Foreign Trade in the Post-Soviet Countries. Economy of Region 16: 597–611. [Google Scholar] [CrossRef]
- Okabe, Misa, and Shujiro Urata. 2014. The impact of AFTA on intra-AFTA trade. Journal of Asian Economics 35: 12–31. [Google Scholar] [CrossRef][Green Version]
- Padilla, Miguel Angel Esquivias, Rossanto Dwi Handoyo, and Lilik Sugiharti. 2019. Production networks under The ASEAN Plus Six. A good deal or a threat? Entrepreneurship and Sustainability Issues 7: 81–91. [Google Scholar] [CrossRef]
- Pöyhönen, Pentti. 1963. A tentative model for the volume of trade between countries. Weltwirtschaftliches Archiv, 93–100. [Google Scholar]
- Purwono, Rudi, Miguel Angel Esquivias, Lilik Sugiharti, Unggul Heriqbaldi, and Rossanto Dwi Handoyo. 2020. Value Chains, Production Networks and Regional Integration: The Case of Indonesia. Journal Ekonomi Malaysia 54: 135–51. [Google Scholar]
- Purwono, Rudi, Unggul Heriqbaldi, Miguel Angel Esquivias, and M. Khoerul Mubin. 2021. The US-China Trade War: Spillover Effects on Indonesia and other Asian Countries. Economics Bulletin 41: 2370–85. [Google Scholar]
- Purwono, Rudi, Unggul Heriqbaldi, Miguel Angel Esquivias, and M. Khoerul Mubin. 2022. The American–China Trade War and Spillover Effects on Value-Added Exports from Indonesia. Sustainability 14: 3093. [Google Scholar] [CrossRef]
- Schaak, Henning. 2015. The Impact of Free Trade Agreements on International Agricultural Trade: A Gravity Application on the Dairy Product Trade and the ASEAN-China-FTA. Perspektiven Für Die Agrar-Und Ernährungswirtschaft Nach Der Liberalisierung. p. 181. Available online: https://ageconsearch.umn.edu/record/211619/ (accessed on 22 March 2022).
- Shepherd, Ben. 2019. Mega-regional trade agreements and Asia: An application of structural gravity to goods, services, and value chains. Journal of the Japanese and International Economies 51: 32–42. [Google Scholar] [CrossRef]
- Silva, J. M. C. Santos, and Silvana Tenreyro. 2006. The log of gravity. The Review of Economics and Statistics 88: 641–58. [Google Scholar] [CrossRef]
- Sposi, Michael. 2015. Evolving comparative advantage, sectoral linkages, and structural change. Journal of Monetary Economics 103: 75–87. [Google Scholar] [CrossRef]
- Sugiharti, Lilik, Miguel Angel Esquivias, and Bekti Setyorani. 2020a. The impact of exchange rate volatility on Indonesia’s top exports to the five main export markets. Heliyon 6: e03141. [Google Scholar] [CrossRef] [PubMed]
- Sugiharti, Lilik, Rudi Purwono, and Miguel Angel Esquivias Padilla. 2020b. Analysis of determinants of Indonesian agricultural exports. Entrepreneurship and Sustainability Issues 7: 2676–95. [Google Scholar] [CrossRef]
- Taguchi, Hiroyuki. 2015. Trade creation and diversion effects of ASEAN-plus-one free trade agreements. Economics Bulletin 35: 1856–66. [Google Scholar]
- Tinbergen, Jan. 1962. Shaping the World Economy, Suggestions for an International Economic Policy. New York: Twentieth Century Fund. [Google Scholar]
- Tran, Nhuong, Norbert Wilson, and Diane Hite. 2013. 5 Choosing the Best Model in the Presence of Zero Trade: A Fish Product Analysis. In Frontiers of Economics and Globalization. Edited by J. C. Beghin. Bingley: Emerald Group Publishing Limited, pp. 127–48. [Google Scholar] [CrossRef]
- Urata, Shujiro, and Misa Okabe. 2014. Trade Creation and Diversion Effects of Regional Trade Agreements: A Product-level Analysis. The World Economy 37: 267–89. [Google Scholar] [CrossRef]
- Verter, Nahanga, Ivo Zdráhal, Věra Bečvářová, and Libor Grega. 2020. ‘Products mapping’ and trade in agri-food products between Nigeria and the EU28. Agricultural Economics (Zemědělská Ekonomika) 66: 34–45. [Google Scholar] [CrossRef]
- Viner, Jacob. 1950. The Customs Union Issue. New York: Carnegie Endowment for International Peace. [Google Scholar]
- Weidner, Martin, and Thomas Zylkin. 2021. Bias and consistency in three-way gravity models. Journal of International Economics 132: 103513. [Google Scholar] [CrossRef]
- Widodo, Tri. 2009. Dynamic comparative advantages in the ASEAN+ 3. Journal of Economic Integration 24: 505–29. [Google Scholar] [CrossRef]
- World Bank. 2019. World Development Report 2020: Trading for Development in the Age of Global Value Chains. Washington, DC: The World Bank. [Google Scholar] [CrossRef]
- Yang, Shanping, and Inmaculada Martinez-Zarzoso. 2014. A panel data analysis of trade creation and trade diversion effects: The case of ASEAN–China Free Trade Area. China Economic Review 29: 138–51. [Google Scholar] [CrossRef]
Publisher’s Note: MDPI stays neutral with regard to jurisdictional claims in published maps and institutional affiliations. |
© 2022 by the authors. Licensee MDPI, Basel, Switzerland. This article is an open access article distributed under the terms and conditions of the Creative Commons Attribution (CC BY) license (https://creativecommons.org/licenses/by/4.0/).