Article

A Consumer Health Information System to Assist Patients Select Quality Home Health Services †

Health Administration Division, Central Michigan University, Mount Pleasant, MI 48859, USA
*
Author to whom correspondence should be addressed.
This paper is an extended version of our paper published in Proceedings of the 10th International Conference on PErvasive Technologies Related to Assistive Environments (PETRA ‘17), Island of Rhodes, Greece, 21–23 June 2017.
Technologies 2017, 5(4), 76; https://doi.org/10.3390/technologies5040076
Submission received: 1 November 2017 / Revised: 21 November 2017 / Accepted: 23 November 2017 / Published: 29 November 2017

Abstract

:
Patients evaluate the quality of home health agencies (HHAs) using the Health Consumer Assessment of Healthcare Providers and Systems (HCAHPS) survey. This paper describes a prototype community health information system to help patients select appropriate and quality HHAs, according to the location, proprietary status, type of service, and year of HHA establishment. Five HCAHPS indicators were selected: “summary rating”, “quality of care”, “professional care”, “communication”, and “recommend agency”. Independent t-test analysis showed that agencies offering Speech Pathology, Medical-Social, or Home Health Aide services, receive significantly worse HCAHPS ratings, while mean ratings vary significantly across different US states. Multiple comparisons with post hoc ANOVA revealed differences between and within HHAs of different proprietary status (p < 0.001): governmental HHAs receiving higher ratings than private HHAs. Finally, there was observed a relationship between all five quality rating variables and the HHA year of establishment (Pearson, p < 0.001). The older the agency is, the better the HCAPS summary ratings. Findings provided the knowledge to design of a consumer health information system, to provide rankings filtered according to user criteria, comparing the quality rankings of eligible HHAs. Users can also see how a specific agency is ranked against eligible HHAs. Ultimately, the system aims to support the patient community with contextually realistic comparisons in an effort to choose optimal HH service.

1. Introduction

Home health care includes a wide range of services that can be provided at the patient’s home place for an illness. In December 2008, the Centers for Medicare and Medicaid Services (CMS) launched a five-star rating system and a web-based report card detailing quality of care at CMS-certified services [1]. According to this system, a rating of one star represents poor quality while a rating of five stars represent excellent quality. Star rating systems were created by CMS to improve patient decision making in their selection of a healthcare organization. The star rating exists for hospitals, nursing homes, and other healthcare organizations, including home health agencies. Performance information helps patients understand how a healthcare organization compares against others. The ratings therefore affect organizational strategies and performance [2].
Star ratings help patients choose service and additionally award extra payment to highly performing services. Evidently, the star ratings drive improvements in the quality of plans [3]. According to Werner et al., after the star-based rating system was released, 1-star facilities typically lost eight percent of their market share, and 5-star facilities gained over six percent of their market share [4]. Good communication of the care team with patients is evidently a very important factor driving quality. It has been noted that improving communication about medications can increase the overall hospital score. The HCAHPS data should therefore be used by health institutions towards encouraging patient centered care to improve outcomes [5].
There is an open debate on whether for-profit organizations provide higher quality of service. Similarly, there is no consensus on whether patient satisfaction is related to the type of organizational ownership. There are, though, many studies that investigate the relationship of other factors with quality and patient satisfaction. A recent study found that nursing homes accredited by the joint commission achieved significantly higher star ratings, have fewer deficiencies, fewer payment denials, and lower fines compared to non-accredited ones [6]. In addition, environmental and sociodemographic characteristics can explain regional variation in quality measures related to medication use. Case-mix adjustments of quality measures could successfully refine intervention strategies for pharmacists serving certain regional populations, such as low income and African American populations [7]. In another study, Konetzka et al. investigated the extent to which dual eligible Medicare and Medicaid patients versus non-dual ones, chose highest-rated homes. The study concluded that the gap in quality, as measured by the star rating, grew over time. While both groups resided in higher rated homes, eventually the increased likelihood of choosing highest-rated homes was substantially smaller for dual eligibles [8].
Researchers have studied the factors related to the Nursing Home Compare rating. Kim found that nursing homes in Indiana, located in very high demand market areas (highly concentrated with fewer nursing homes), tend to perform better than those which are not in high demand areas [2]. Other researchers compared the star rating and patient outcomes between Medicare and Medicaid services and found that higher CMS star rating was associated with lower patient mortality and readmissions [9].
Despite the reported success, a series of issues with the star ratings system remain unresolved. HCAHPS case-mix adjustment does not include adjustment for specialty or diagnosis, which may result in artificially lower scores for centers that provide a high level of complex care. Further research is needed to ensure that the HCAHPS is an unbiased comparison tool [10]. Other concerns and criticism include, among other, the methodology of performance metrics and differences among beneficiary populations which should, but are not, taken into account. Adjustments such as the above should be explored by CMS to fine-tune methods of measurement [3].
The topic of healthcare services quality among organizations of different proprietary status has been discussed in the literature, but there is only limited research for HHAs. While star ratings are expected to assist patients in choosing best HHAs, they might be restricted to agencies of specific proprietary status, for reasons such as location availability, personal preference, or insurance restrictions. Very often, patients are restricted to specific agencies in close proximity. Other times, patients may have specific preferences, such as to opt for private HHAs. If there is difference across agencies of different characteristics, then the overall rating may not reflect the actual distribution of perceived quality within, for instance, each proprietary status, or within the cohort of HHAs that provide a needed specialized service (such as speech pathology or physical therapy).
According to the American Medical Informatics Association (AMIA) [11], Consumer Health Informatics (CHI) is “devoted to consumer or patient views which include patient-focused informatics, health literacy and consumer education, to empower consumers to manage their own health.” Consumer health informatics research outcomes empower users to take charge of their health and actively participate in decision-making about healthcare delivery [12]. The term “consumer health information system” refers to a broad range of applications, tools, and educational resources developed to empower consumers with knowledge, techniques, and strategies, to manage their own health [13]. With the advancement of new technologies, tools can become available provide patients with more sophisticated decision-making capacity. Taking into consideration the trends in today's health care environment, CHI is expected to expand. An extended review conducted by Le Rouge et al. in 2013 verified the extensive use of user-centered design principles in existing consumer health informatics applications [14].
To respond to the decision-making need of patients, looking for HHAs, we designed and furthermore developed a data-driven prototype consumer health information system to assist patients and their caregivers find eligible and quality HHAs. The first objective is to explore differences to five HHA star ratings between agencies with different characteristics (Objective 1a). The characteristics that we investigated are: The HHA location, specialized services provided, the proprietary status and finally the year that the agency was established. By exploring the degree to which star ratings vary across different types of HHAs, the study further suggests adjusted ratings. We used the HHA characteristic proprietary status as an example. The adjusted rating ranks each HHA to a comparative position in relation to other HHAs of same proprietary status (Objective 1b). The adjusted scores are anticipated to assist patients who are looking for a HHA, providing comparative ratings per HHA proprietary status. It is common that the choice of patients may be limited to one proprietary type of HHA only, and, therefore, ratings are adjusted to facilitate the significantly different rating distribution. Objective 1 is the knowledge discovery phase, which forms the foundation for the development of our system (Objective 2-system design phase).
A prototype consumer health information system was then developed accordingly, based on evidence from the knowledge discovery phase, to allow users review and compare star ratings based on their disease requirements (e.g., availability of specialized services), the location, or the proprietary status of the HHA that they are eligible to use (Objective 2). According to their selection criteria patients and their caregivers are provided with a selection of eligible HHAs that are ranked by HHA star rating. Each HHA is ranked against other eligible agencies according to the search results, rather than the overall national ratings. The system will assist patients or their family caregivers to navigate through available HHAs by zip code, by services provided, and, finally, according to the agency year of establishment. The system also compares the overall summary star ratings to adjusted ones according to the agency proprietary status.

2. Materials and Methods

This research has been conducted using the Health Home Agency compare (HHA compare) dataset, which is available, free of cost, through the Medicare web-portal [15]. The dataset contains 12,058 HHA records; however only 5790 included data on five-star rating. Therefore, the rest (6268) were excluded from the analysis. Five variables have been included for analysis:
Star Rating, summary of HCAHPS survey (Summary);
Star rating, health care services quality (Quality);
Star rating, professionalism of care from health team (Professionalism);
Star Rating, communication of health team with patient (Communication);
Percentage of patients who would definitely recommend the HHA to friends and family (% Recommend).
There are more than these five rating variables in the HHA compare dataset. We decided to explore these specific parameters, since they address the most important dimensions of perceived patient experiences: (i) overall rating; (ii) the concept of service quality; (iii) professionalism; and (iv) communication. The Survey Summary Star Rating represents the mean rating based on the questions about the care of patients, communication between provider and patients, specific care issues and overall rating of care provided by the home health agency (https://www.cms.gov). The Survey Summary Star Rating is therefore used as a single indicator combining responses to 17 survey questions.
The study follows a two-phase design. First is the knowledge discovery, which is followed by the system design phase. The knowledge discovery phase aims to provide evidence that significant differences in HHA ratings can be attributed to specific agency characteristics. We therefore conducted statistical analysis using correlation and comparison statistics. Our alternative hypothesis is that the HCAHPS star ratings are different across various US States, between various types of services offered, across agencies with different proprietary status, and, finally, across agencies that were established in different time periods. This statistical analysis was conducted in order to (i) provide the scientific evidence base for the prototype consumer health informatics system and (ii) justify the validity of rankings based on filtered criteria, instead of comparing to the overall non-specific, national mean scores. We explored differences in ratings between HHAs offering and those not offering specialized services using independent samples t-test statistics. The relationship between HCAHPS ratings and the HHA age was explored with the use of bivariate Pearson correlation. We compared the three proprietary status types by performing analysis of variance (ANOVA), and furthermore stepwise multiple comparisons with the use of Tukey post hoc test. Finally, to compare differences of ratings across different US States, we calculated the mean ratings per State, for each of the five quality indicators under study and reported the top and bottom five States with the highest and lowest ratings respectively. All statistical tests were performed at the significance level of 0.05.
The prototype CHI system was designed with Microsoft Visual Studio 2015, while expanded functionality became possible via VSPackage technology. The HHA compare data were organized into an SQL database schema that was developed with Microsoft SQL Server. Parametric queries were developed accordingly, to filter out database results based on the four user-input criteria, as verified in the knowledge discovery phase. Figure 1 provides a diagrammatic overview of the study design.
Naturally, patients primarily select home health agencies based on the agency service area, which covers a specific geographical zone. Oftentimes, patients opt for agencies that provide specialized services such as physical therapy or speech pathology. In other cases, patients are limited to specific eligible home health agencies, according to the agency proprietary status (governmental, non-profit, or for-profit). For these reasons, the system has been designed to filter down data in order to compare eligible agencies, according to the aforementioned restrictions or patient preferences, in terms of the quality of service (star ratings of summary, quality, professionalism, communication, and % of patients that would recommend the HHA). The star ratings of the eligible agencies are compared and presented to the user in ranked order. This comparison is more meaningful and more contextually relevant that a comparison against the national or State average. The latter would practically fail to provide, to the patient, their capacity to weigh viable options.

3. Results

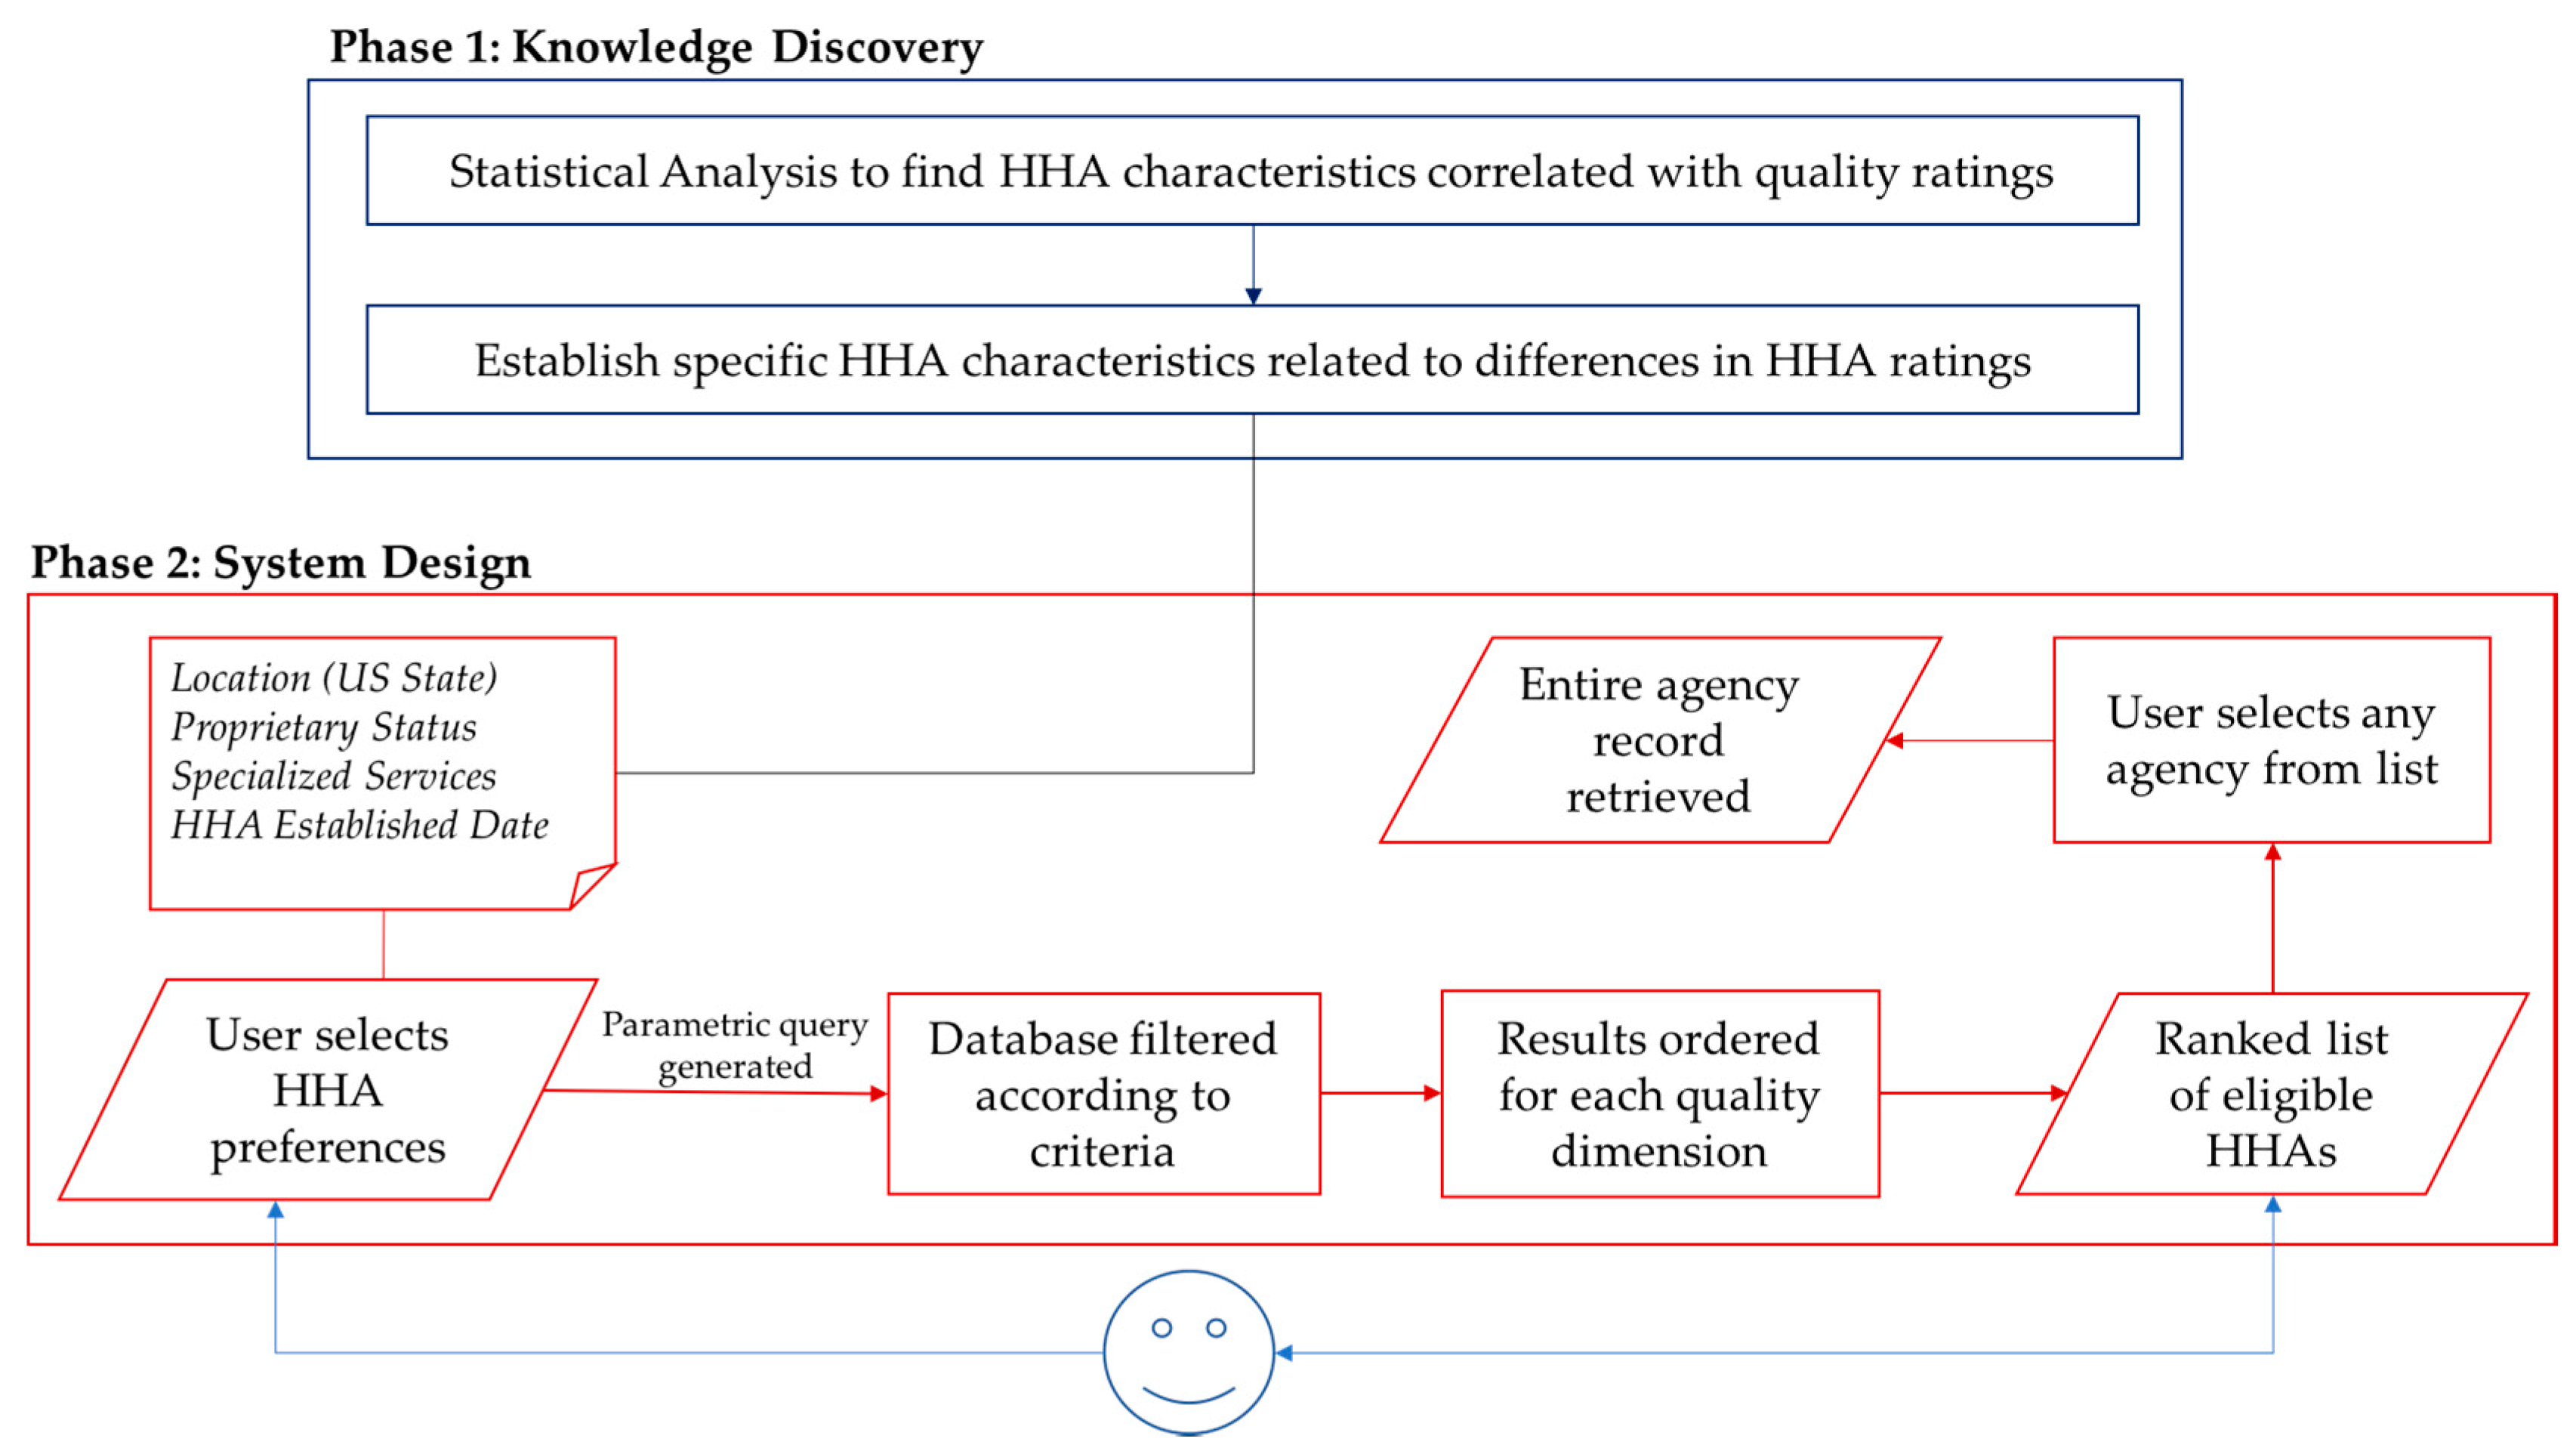
3.1. Knowledge Discovery Phase

Table 1 provides descriptive statistics for the 5790 agencies included in the analysis, including information about the age of agencies, services offered and selected HCAHPS star ratings.

3.1.1. Relationship between HCAHPS Ratings and HHA Age

Using Pearson correlation, we observed a moderate, but statistically significant relationship between all five quality rating variables and the agency year of establishment. In specific, the year that the HHA was established, was found to be correlated with the HCAHPS summary star rating (−0.209, p < 0.001), the quality of patient care rating (−0.051, p < 0.001), the professional care rating (−0.201, p < 0.001), the communication with the patient rating (−0.247, p < 0.001), and the % that would recommend the HHA (−0.230, p < 0.001). Since the relationship was negative, the older the agency (smaller year value) the higher the summary star ratings (Table 2). The year of HHA establishment was selected for inclusion to the application, as a relevant filtering criterion. Users are given the option to filter out HHAs that were established after a specific year.

3.1.2. Comparison of HCAHPS Ratings According to the Services Offered

We furthermore examined the specialized services offered in the HHAs. We compared the HCAPS summary star rating of HHAs offering specialized service, against those which do not. According to independent t-test analysis, agencies that offer Speech Pathology, Medical-Social, or Home Health Aide services receive significantly lower HCAPS summary star rating compared to agencies that do not offer the aforementioned services (Table 3). Possible reasons for the observed lower star ratings in HHAs that offer these services are discussed later in this paper. Patients who are in need of specialized care want to know how HHAs offering that service, compare against other HHAs, also offering the same service.

3.1.3. Comparison of HCAHPS Ratings across HHAs in Different US States

Mean HCAHPS summary star ratings vary significantly across different US states. For the home health agencies of the State of Mississippi, the mean HCAHPS summary star rating was found to be equal to 4.47. On the contrary, in Nevada, the mean HCAHPS summary star rating was significantly lower, and equal to 2.98. Table 4 presents the top and bottom five US states in terms of their star ratings for the five quality dimensions under study. In our analysis, we excluded states with less than 15 HHAs. Results are sorted in descending order for the HCAHPS summary rating. These differences may be attributed to a series of sociocultural and health system related factors and need to be further explored. According to these differences, for instance, one of the best ranked HHA in Nevada would be ranked much lower against agencies in Alabama or Los Angeles. Since HHAs do not offer interstate service, our system will provide state-specific HHA quality rankings, according to the patient’s residence.

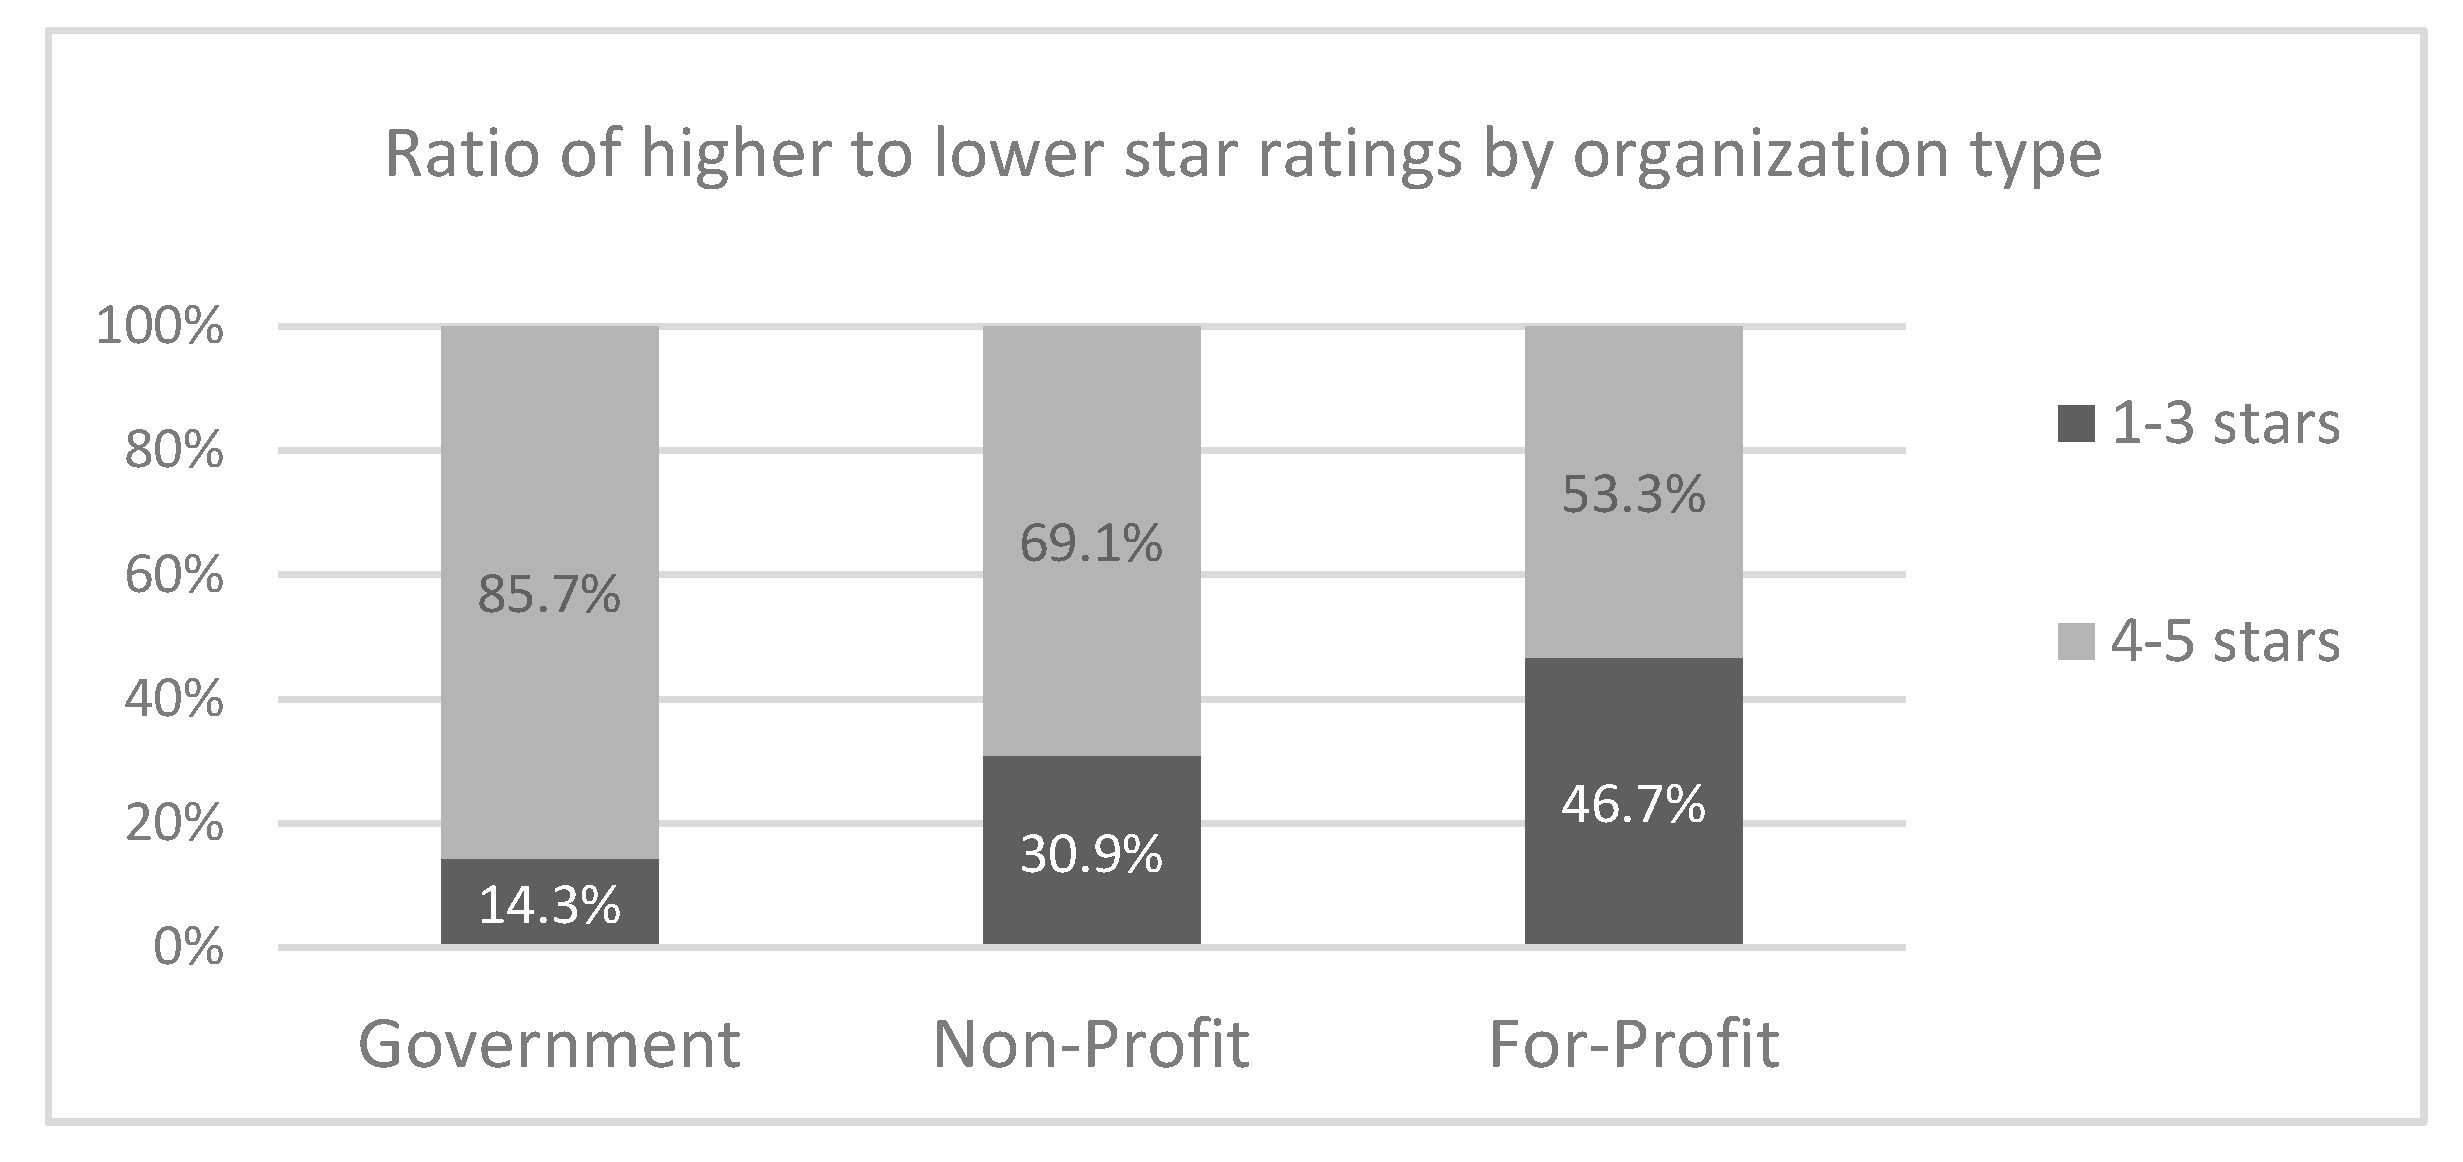
3.1.4. Comparison of HCAHPS Ratings across the Three Proprietary Status Types

The seven categories of ownership were recoded into three groups that are commonly used in health services research, as Governmental, Non-Profit, and For-Profit facilities. The three governmental types were merged into one category, as the ANOVA test that was conducted confirmed no difference in the overall HCAHPS score between these three governmental types of HHA (F (2305) = 0.499, p = 0.607). Regarding their proprietary status, a total of 4079 HHAs (70.4%) were for-profit, 1403 agencies (24.2%) were non-profit, while 308 HACs (5.4%) were governmental. Table 5 shows the distribution of the HCAHPS survey summary star ratings for each proprietary status.
Star ratings of 4 or 5 represent higher quality HHAs, while scores of 3 or below indicate HHAs that are not of higher quality. Figure 2 shows the distribution by proprietary status, with the use of the binary grouping (“4/5” vs. “3 or below”). It is notable that, while the 85.7% of governmental HHAs received higher summary star ratings, only 69.1% and 53.3% of private for-profit and non-profit agencies, received higher star ratings, respectively.
We further compared the three proprietary status types by performing analysis of variance (ANOVA). According to findings, the ratings differ significantly (p < 0.001) for all five patient experiences variables between and within the three proprietary statuses. Table 6 outlines the ANOVA results and provides descriptive statistics of comparisons.
Finally, stepwise multiple comparisons were performed with the use of Tukey post hoc test to compare the difference of ratings between the three different HHA proprietary status types (governmental vs. non-profit, governmental vs for-profit, and non-profit vs. for profit). According to the statistical analysis results, shown in Table 7, the ratings were significantly different between all the aforementioned pairs (p < 0.001), with the exception of the patient care quality star rating. For this variable, there was found that the ratings of profit and non-profit organizations do not differ significantly from the ratings of governmental agencies.
Objective 1b is the development of an adjusted star ratings. The reason why adjusted star ratings are introduced is that patients may be limited to one proprietary type of HHA only, and, therefore, ratings are adjusted to facilitate the significantly different rating distribution, as shown in the ad-hoc analysis. We implemented the adjusted ratings, for the HHA proprietary status. Similar adjusted ratings can be constructed for other HHA characteristics as well. We were clearly driven by the statistical analysis findings of Objective 1a, which indicated significant difference of the star ratings between different HHA proprietary statuses. For each proprietary status, the adjusted ratings would compare each HHA to their counterparts of the same proprietary status.
For this task, the mean and standard deviation of the HCAHPS summary star rating was estimated, for each of the three different proprietary status types. The mean value of each ownership distribution became the average score (three stars) of the new scales, and new scores were calculated and mapped to each of the original star ratings, by using the standard deviations of each proprietary status distribution. This resulted to adjusted scores which reflect how an HHA compares against agencies of the same proprietary status. After the construction of the adjusted ratings, the initial HHA compare dataset was updated to include the adjusted ratings as an extra variable. The adjusted rating per status is shown on Table 8.

3.2. System Design Phase: Prototype CHI System to Assist Patients Compare HHAs

The prototype CHI system allows the user to perform four tasks:
(i)
Select preferred criteria to see eligible HHAs and ratings for each of these HHAs. Search results are presented to the user in a ranked order. These criteria include
  • Preference for specialized service offered by the HHA;
  • Patient location;
  • Proprietary Status;
  • HHA year of establishment.
The system also has the functionality to rank the resulting HHAs according to any of the five quality indicators under study.
(ii)
The system provides to the user the option to view plots comparing HHAs based on the aforementioned system output;
(iii)
Alternatively, the user can search directly for a specific agency name to view information about that agency (HHA characteristics and star ratings). In this case, the system auto-generates a query that filters down the database, according to the characteristics of the selected agency. The user-selected HHA is therefore ranked against the filtered results. The user is informed accordingly how their selection stacks up against similar agencies for each of the quality star ratings under study;
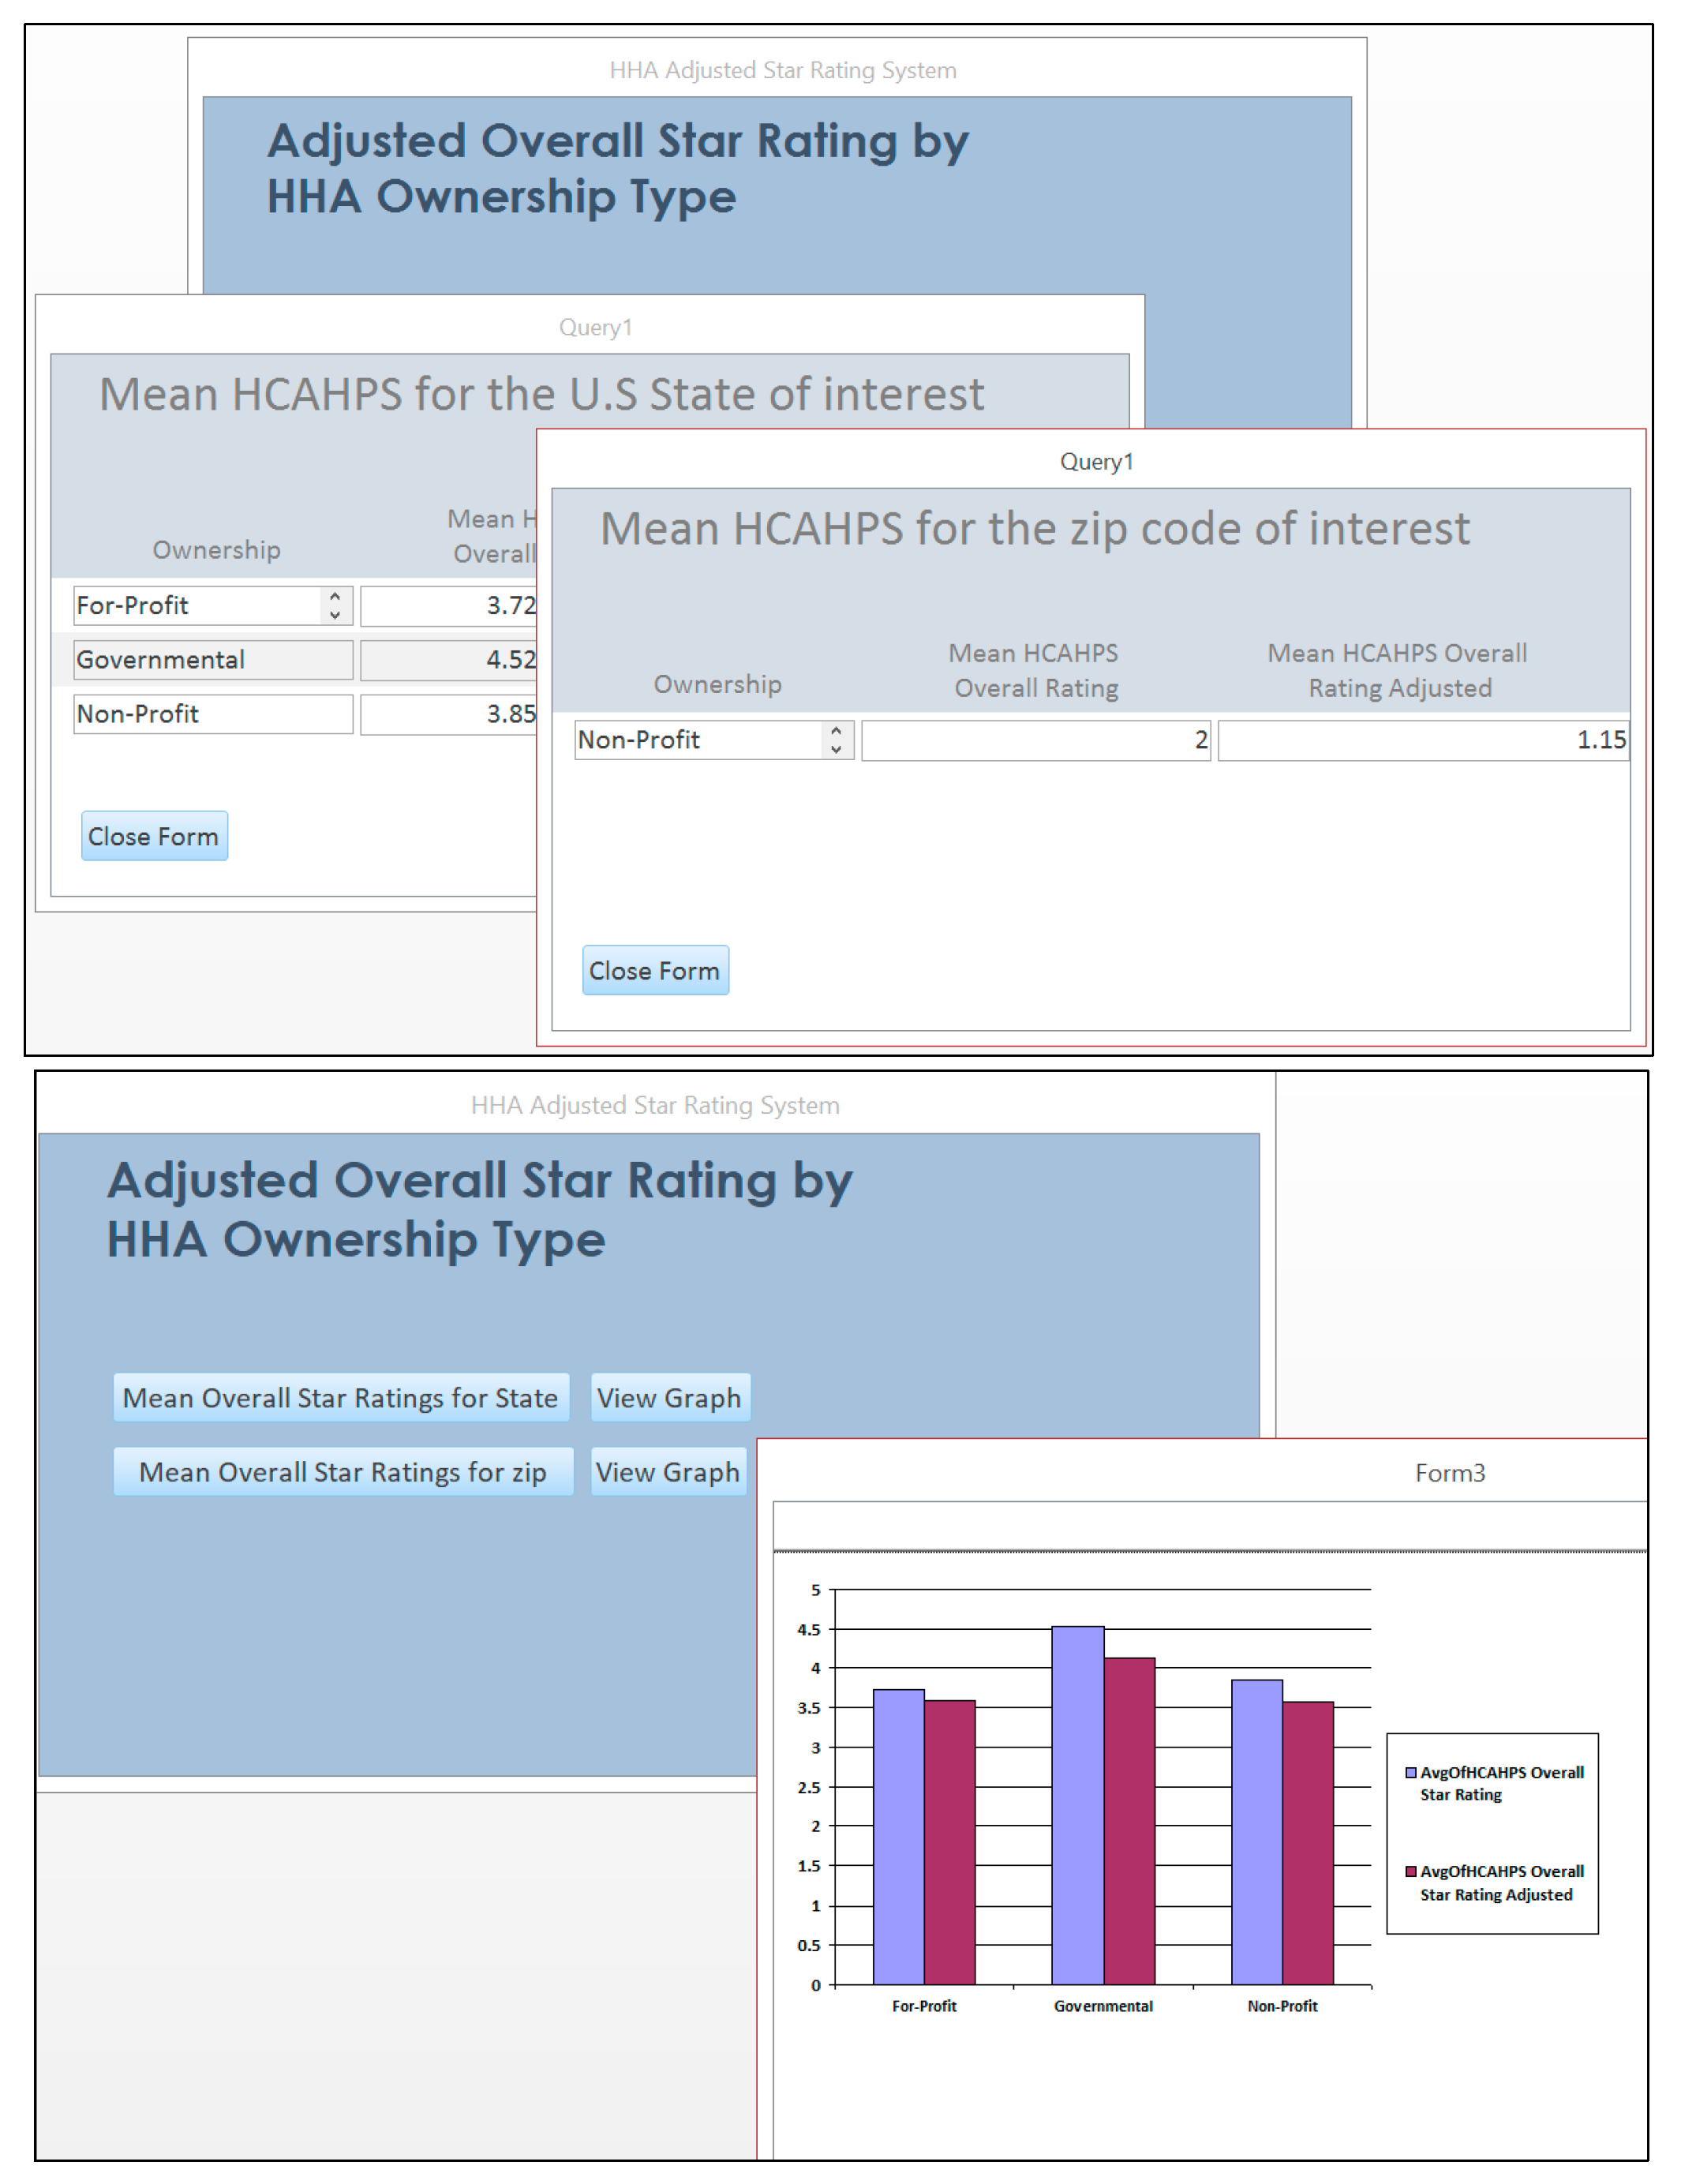
(iv)
The user can explore plots to compare the overall rating scores and adjusted scores of each HHA proprietary status types for the US state, zip code, or home health agency of interest.
With the use of the application, patients and their family caregivers will be given the opportunity to compare different agencies in their area, and learn how the available agencies are ranked against all other agencies (original star rating) and against agencies of the same proprietary status (adjusted star rating). With the adjusted ratings, patients will be provided with a realistic score, in case they are restricted to only select HHAs of a specific proprietary status. Figure 3 shows examples of the system functionality.

4. Discussion

Star ratings are important to patients and their family caregivers, who utilize the information to seek service of high quality. The star rating system has been shown to drive decisions of patients. Patients are receptive to using online information about quality. Their searches, and choice, though, is limited by the need for specialized services, proximity to family or health care providers, and availability of Medicaid beds. Proper use of the online star ratings is also limited by lack of awareness and, to some extent, distrust of the rating information [10]. In this study, independent t-test analysis showed that agencies offering Speech Pathology, Medical-Social, or Home Health Aide services, receive worse HCAPS summary star rating scores, while mean ratings vary significantly across different US states. Multiple comparisons with post hoc ANOVA revealed differences of ratings between and within HHAs of different proprietary status. Governmental HHAs received high summary star ratings (4 or 5 stars), than private for-profit and non-profit agencies. Finally, there was observed a relationship between all five quality rating variables and the HHA year of establishment. It was observed that the older the agency is, the better the HCAPS summary star ratings.
Understanding the star rating differences among for-profit, non-profit, and governmental HHAs benefits all patients. Patients who are limited to or prefer a specific HHA proprietary type are able to select the highest quality available within that proprietary status group. At the same time, patients who have more choices between the different HHA proprietary status types are able to compare the quality of available HHAs, adjusted for existing organizational differences.
Another important factor of consumer choice is the type of services offered. Assuming that the need and demand for HHA services is largely formed by clinical needs of consumers, it is reasonable to offer the customer an option to filter out HHAs that do not provide requested services and allow for quality comparison between only the relevant agencies. As evident from the analysis, offering specific services, such as speech therapy or medical social services, was associated with the HHAs star rating. While lower ratings of agencies offering medical social services may be associated with a possible unclear role of medical social workers [16], in general, patients with more complex cases are likely to assign lower (worse) star ratings. In addition, a significant variation across specialties (i.e., plastic surgery vs. transplant surgery) has been shown in star scores, as well as in individual composite scores, such as pain management or nursing care [10]. Similarly, variations of star ratings according to home health services offered, may be related to differences to clinical needs of patients.
Patient’s choice of HHA is also limited by the home health agencies that offer services to specific geographic locations. The geographic difference by state is common in healthcare. For instance, Gupta et al. found a significant difference in patient pain care perception between the states [17], while Nothelle et al. reported a difference in potentially inappropriate medication use between US regions [18]. Similarly, Cole, Wilson, and Trivedi reported state variation in quality outcome for community health centers [19]. Given the demonstrated difference in average HHA star rating by state, it is evident that the same rating would carry different meaning depending of the state in which a consumer initiates the search.
Although no healthcare studies were found to explore reasons for association between organizational age and quality of services provided, in other industries, age of a company was associated with consumer trust [20]. At the same time, as all five measures consistently demonstrated negative statistically significant correlation with the agency age, one may argue about the possibility of survivor bias, with higher closure rate for low quality HHA leading to higher quality among a “survived” older organization.
A number of recent studies questioned consumer’s ability to effectively use provided information about healthcare provider’s quality. In 2016, Hu et al. expressed concerns about consumers’ ability to make informed decisions depending on global quality ratings while choosing a hospital [21]. Similarly, other researchers commented on consumers’ ability to interpret public report cards on healthcare providers due to content, design, and accessibility of such reports and urged policy-makers to move toward more consumer-centered report cards [22]. As stated by Gebele et al., the nature of healthcare information, along with the amount and quality of the information may lead to consumers’ confusion in choice of healthcare provider [23]. The proposed model allows for reduction of irrelevant information about HHAs and empowers consumers to make a better-informed selection of healthcare services. This will ultimately increase the decision-making capacity of patients who are in need for HH service in an era where citizens, patients, and their caregivers require access to highly specific and personalized services to assist them in selecting safe healthcare services.
According to results of the statistical analysis, the design and output of our consumer health information system was driven by evidence that home health agency ratings differ significantly according to the agency location, the existence of specialized services, the proprietary status and the agency age. This prototype system is therefore intended to be a useful resource for patients and their caregivers who seek quality HHA services and especially want to know how an HHA compares against other eligible agencies, according to the patient preferences or other objective limitations. The prototype application can be expanded with more variables that relate to patient preferences and are selection criteria of value. This will become possible by integrating case-specific characteristics of HHAs, such as the case-mix of ICD diagnoses and the procedures, per agency, available through the Centers for Medicare and Medicaid Services. This information will enable comparisons of agencies according to the types of diseases they specialize on. The evolution of this prototype system will provide opportunities to evaluate usefulness and usability aspects via coalition with patient organizations and population health experts.

Author Contributions

Nailya DeLellis provided the required data for the analysis. Dimitrios Zikos and Nailya DeLellis conceived and designed the statistical analysis questions and conducted the analysis. Dimitrios Zikos wrote the introduction, methods, and results portion of the paper. Nailya DeLellis prepared the discussion portion of the paper. Dimitrios Zikos developed the consumer health information system.

Conflicts of Interest

The authors declare no conflict of interest.

References

  1. Konetzka, R.T.; Perraillon, M.C. Use of nursing home compare website appears limited by lack of awareness and initial mistrust of the data. Health Aff. 2016, 35, 706–713. [Google Scholar] [CrossRef] [PubMed]
  2. Kim, A.S. Market Conditions and Performance in the Nursing Home Compare Five-Star Rating. J. Health Politics Policy Law 2016, 41, 939–968. [Google Scholar] [CrossRef] [PubMed]
  3. Sprague, L. The Star Rating System and Medicare Advantage Plans. Issue Brief Natl. Health Policy Forum 2015, 854, 1–10. [Google Scholar]
  4. Werner, R.M.; Konetzka, R.T.; Polsky, D. Changes in consumer demand following public reporting of summary quality ratings: An evaluation in nursing homes. Health Serv. Res. 2016, 51, 1291–1309. [Google Scholar] [CrossRef] [PubMed]
  5. Thiels, C.A.; Hanson, K.T.; Yost, K.J.; Mathis, K.L.; Cima, R.R.; Zielinski, M.D.; Habermann, E.B. Achieving a 5-star rating: Analysis of hospital consumer assessment of healthcare providers and systems (HCAHPS) scores among patients undergoing elective colorectal operations. Surgery 2016, 160, 902–914. [Google Scholar] [CrossRef] [PubMed]
  6. Williams, S.C.; Morton, D.J.; Braun, B.I.; Longo, B.A.; Baker, D.W. Comparing Public Quality Ratings for Accredited and Non-Accredited Nursing Homes. J. Am. Med. Dir. Assoc. 2017, 18, 24–29. [Google Scholar] [CrossRef] [PubMed]
  7. Desai, V.; Nau, D.; Conklin, M.; Heaton, P.C. Impact of Environmental Factors on Differences in Quality of Medication Use: An Insight for the Medicare Star Rating System. J. Manag. Care Spec. Pharm. 2016, 22, 779–786. [Google Scholar] [CrossRef] [PubMed]
  8. Konetzka, R.T.; Grabowski, D.C.; Perraillon, M.C.; Werner, R.M. Nursing home 5-star rating system exacerbates disparities in quality, by paper source. Health Aff. 2015, 34, 819–827. [Google Scholar] [CrossRef] [PubMed]
  9. Wang, D.E.; Tsugawa, Y.; Figueroa, J.F.; Jha, A.K. Association between the centers for medicare and medicaid services hospital star rating and patient outcomes. JAMA Intern. Med. 2016, 176, 848–850. [Google Scholar] [CrossRef] [PubMed]
  10. Thiels, C.A.; Hanson, K.T.; Yost, K.J.; Zielinski, M.D.; Habermann, E.B.; Cima, R.R. Effect of Hospital Case Mix on the Hospital Consumer Assessment of Healthcare Providers and Systems Star Scores: Are All Stars the Same? Ann. Surg. 2016, 264, 666–673. [Google Scholar] [CrossRef] [PubMed]
  11. American Medical Informatics Association. Consumer Health Informatics. Available online: https://www.amia.org/applications-informatics/consumer-health-informatics (accessed on 23 November 2017).
  12. Faiola, A.; Holden, R. Consumer Health Informatics: Empowering Healthy-Living-Seekers Through mHealth. Prog. Cardiovasc. Dis. 2017, 59, 479–486. [Google Scholar] [CrossRef] [PubMed]
  13. Monkman, H.; Kushniruk, A.W. The Consumer Health Information System Adoption Model. Stud Health Technol. Inform. 2015, 218, 26–31. [Google Scholar]
  14. LeRouge, C.; Wickramasing, N. A Review of User-Centered Design for Diabetes-Related Consumer Health Informatics Technologies. J. Diabetes Sci. Technol. 2013, 7, 1039–1056. [Google Scholar] [CrossRef] [PubMed]
  15. Medicare. Home Health Compare Datasets. Available online: https://data.medicare.gov/data/home-health-compare (accessed on 23 November 2017).
  16. O'Brien, M.; Stewart, S.J. Measuring satisfaction with social work services. Soc. Work Health Care 2009, 48, 105–118. [Google Scholar] [CrossRef] [PubMed]
  17. Gupta, A.; Daigle, S.; Mojica, J.; Hurley, RW. Patient perception of pain care in hospitals in the United States. J. Pain Res. 2009, 2, 157–164. [Google Scholar] [CrossRef] [PubMed]
  18. Nothelle, S.K.; Sharma, R.; Oakes, A.H.; Jackson, M.; Segal, J.B. Determinants of Potentially Inappropriate Medication Use in Long-Term and Acute Care Settings: A Systematic Review. J. Am. Med. Dir. Assoc. 2017, 18, 806.e1–806.e17. [Google Scholar] [CrossRef] [PubMed]
  19. Cole, M.B.; Wilson, I.B.; Trivedi, A.N. State Variation in Quality Outcomes and Disparities in Outcomes in Community Health Centers. Med. Care 2017, 55, 1001–1007. [Google Scholar] [CrossRef] [PubMed]
  20. Bijlsma-Frankema, K.; Woolthuis, R.K. Trust under Pressure: Empirical Investigations of Trust and Trust Building in Uncertain Circumstances; Edward Elgar: Cheltenham, UK; Northampton, MA, USA, 2005. [Google Scholar]
  21. Hu, J.; Jordan, J.; Rubinfeld, I.; Schreiber, M.; Waterman, B.; Nerenz, D. Correlations among Hospital Quality Measures: What “Hospital Compare” Data Tell Us. Am. J. Med. Qual. 2016, 32, 605–610. [Google Scholar] [CrossRef] [PubMed]
  22. Sinaiko, A.D.; Eastman, D.; Rosenthal, M.B. How report cards on physicians, physician groups, and hospitals can have greater impact on consumer choices. Health Aff. 2012, 3, 602–611. [Google Scholar] [CrossRef] [PubMed]
  23. Gebele, C.; Tscheulin, D.K.; Lindenmeier, J.; Drevs, F.; Seemann, A.K. Applying the concept of consumer confusion to healthcare: Development and validation of a patient confusion model. Health Serv. Manag. Res. 2014, 27, 10–21. [Google Scholar] [CrossRef] [PubMed]
Figure 1. With the knowledge discovery phase, we found relationships of home health agency (HHA) variables with quality ratings, serving as the evidence base for the system design.
Technologies 05 00076 g001
Figure 2. Percentage of “good” (4/5 stars) versus “not good” (3 stars or below) summary star ratings for each HHA proprietary status.
Technologies 05 00076 g002
Figure 3. Prototype application for the comparison of HCAHPS summary star ratings. Top: The user selected a US state to review mean, adjusted HCAHPS ratings, and ratings for the zip code of interest. Bottom: Bar charts comparing adjusted and non-adjusted star ratings for each proprietary organization type.
Technologies 05 00076 g003
Table 1. Characteristics of Home Health Agencies and Health Consumer Assessment of Healthcare Providers and Systems (HCAHPS) Star Ratings.
VariableMean Std. Dev.Range
Home Health Agency Age (years)22.3813.2249
Percent of Governmental agencies (%)5.3222.40100
HHAs Offering Physical Therapy Services (%)1004.70100
HHAs Offering Speech Pathology Services (%)9424100
HHAs Offering Medical Social Services (%)8931.0100
HHAs Offering Home Health Aide Services (%)9715.9100
HCAHPS Survey Summary Star Rating (5 pt. scale)3.640.924
HCAHPS Star Rating: Quality of Patient Care Star Rating (5 pt. scale)3.360.804
HCAHPS Star Rating: Health Team Gave Care in a Professional Way (5 pt. scale)3.881.014
HCAHPS Star Rating: Health Team Communicated Well With Them (5 pt. scale)3.920.994
Patients Would Definitely Recommend HHA to Friends & Family (%)79.228.3773
Table 2. Relationship of the year of HHA establishment with the five star ratings under investigation.
HCAHPS SummaryQuality of Patient CareProfessional CareCommunication with Patient% Recommend HHA
Year ESTDPearson−0.209−0.051−0.201−0.247−0.230
Sig (2-tailed)0.0000.0000.0000.0000.000
Table 3. Comparison (t-test) of HCAHPS summary rating between HHAs offering specific services vs. not.
ServiceOfferedNMeanSt. DevTSig.
Speech PathologyNo3613.831.0054.0550.000
Yes54293.620.918
Physical TherapyNo133.541.050−0.3860.700
Yes57773.649.25
Medical SocialNo6243.930.9548.3080.000
Yes51663.600.916
Home Health AideNo1513.790.9282.0300.042
Yes56393.630.925
Table 4. US states with the top and bottom five mean star ratings.
Top Five States with the Highest Star Ratings
StateHCAHPS SummaryProfessional CareCommunication with Patient% Recommend HHAQuality of Care
MS4.474.564.5685.423.605
AL4.354.564.5384.533.771
LA4.344.554.4784.263.31
KY4.244.584.4984.933.5
WV4.224.514.5784.843.725
Bottom Five States with the Lowest Star Ratings
StateHCAHPS SummaryProfessional CareCommunication with Patient% Recommend HHAQuality of Care
AZ3.143.413.4574.983.477
CA3.113.243.3474.213.57
PR3.083.83.1678.163.48
NY3.043.173.4174.093.276
NV2.983.253.0276.383.328
Table 5. Star rating distribution by type of HHA ownership.
Proprietary Status
StarsGovernmentalNon-ProfitFor-ProfitTotal
12 (0.65%)9 (0.64%)68 (1.67%)79
21 (0.32%)59 (4.21%)505 (12.38%)565
341 (13.31%)366 (26.09%)1333 (32.68%)1740
4141 (45.78%)700 (49.89%)1558 (38.2%)2399
5123 (39.94%)269 (19.17%)615 (15.08%)1007
Total308140340795790
Table 6. Analysis of variance (ANOVA) analysis comparing ratings by proprietary status.
Descriptive Statistics
Governm.Non-ProfitFor Profit
SummaryMean4.243.833.53
Std. Dev.0.7400.8060.948
QualityMean3.153.383.36
Std. Dev.0.6970.6900.851
ProfessionalismMean4.484.093.77
Std. Dev.0.7190.8561.059
CommunicationMean4.484.183.79
Std. Dev.0.7460.8351.029
% RecommendMean84.6781.1778.13
Std. Dev.6.1226.8358.714
One Way ANOVA Comparisons
DfFSig.
SummaryBetween Groups2129.890.000
Within Groups5787
QualityBetween Groups210.380.000
Within Groups5744
ProfessionalismBetween Groups2113.740.000
Within Groups5787
CommunicationBetween Groups2142.690.000
Within Groups5787
% RecommendBetween Groups2144.690.000
Within Groups5787
Table 7. Stepwise multiple comparisons with Tukey post hoc test (Governmental = 1, Non-Profit = 2, For-Profit = 3).
Variable(I)(J)Mean Diff. (I-J)Std. Err.Sig.95% C. I
Low BoundUpper Bound
Summary12
3
0.41
0.71
0.057
0.053
0.000
0.000
0.28
0.59
0.55
0.84
21
3
−0.41
0.30
0.057
0.028
0.000
0.000
−0.55
0.24
−0.28
0.37
31
2
0.41
0.71
0.053
0.028
0.000
0.000
−0.84
−0.37
−0.59
−0.24
Quality12
3
−0.22
−0.20
0.051
0.048
0.000
0.000
−0.34
−0.32
−0.10
−0.09
21
3
0.22
0.021
0.051
0.025
0.000
0.677
−0.10
−0.03
0.34
0.08
31
2
0.20
0.02
0.048
0.025
0.000
0.677
0.09
0.08
0.32
0.03
Professionalism12
3
0.38
0.71
0.063
0.059
0.000
0.000
0.24
0.57
0.53
0.85
21
3
−0.38
0.32
0.063
0.031
0.000
0.000
−0.53
0.25
−0.24
0.40
31
2
−0.71
−0.32
0.059
0.031
0.000
0.000
−0.85
−0.40
−0.57
−0.25
Communication12
3
0.30
0.69
0.061
0.057
0.000
0.000
0.16
0.56
0.44
0.83
21
3
−0.30
0.39
0.061
0.030
0.000
0.000
−0.44
0.33
−0.16
0.47
31
2
−0.69
−0.39
0.057
0.030
0.000
0.000
−0.83
−0.47
−0.56
−0.33
% Recommend12
3
3.49
6.53
0.514
0.483
0.000
0.000
2.29
5.40
4.70
7.67
21
3
−3.49
3.04
0.514
0.253
0.000
0.000
−4.70
2.45
−2.29
3.64
31
2
−6.53
−3.04
0.483
0.253
0.000
0.000
−7.67
−3.64
−5.40
−2.45
Table 8. Adjusted star rating for the summary star rating variable.
Original Star RatingAdjusted Star Rating
GovernmentalNon-ProfitFor-Profit
1111
211.151.66
31.332.562.77
43.173.723.91
5555

