1. Introduction
The growing demand for high-speed, reliable, and flexible wireless communication services has led researchers to explore beyond conventional radio frequency (RF) technologies. Free-space optical (FSO) communication has emerged as a strong alternative, offering a high bandwidth, high data rates, secure transmission, and immunity to electromagnetic interference [
1,
2,
3,
4].
In practical wireless communication scenarios, especially in urban or dense environments, a direct line of sight (LOS) between the source and destination is often obstructed by buildings, terrain, or other obstacles. This poses a significant challenge for FSO communication, which relies heavily on precise LOS alignment to maintain link integrity. To overcome this limitation, a dual-hop architecture employing an RF link followed by an FSO link offers a robust solution. The RF hop, operating under non-LOS conditions, has better penetration capabilities and effectively bridges the source to an intermediate relay node. The relay, strategically positioned to maintain LOS with the destination, then transmits the signal over the high-capacity FSO link. This combination enables reliable connectivity in scenarios where direct FSO communication is infeasible, while still capitalizing on the bandwidth benefits of optical wireless transmission [
5]. Among the relay strategies, amplify and forward (AF) is the simplest, as the relay merely amplifies and retransmits the received signal without performing decoding, which makes it computationally efficient.
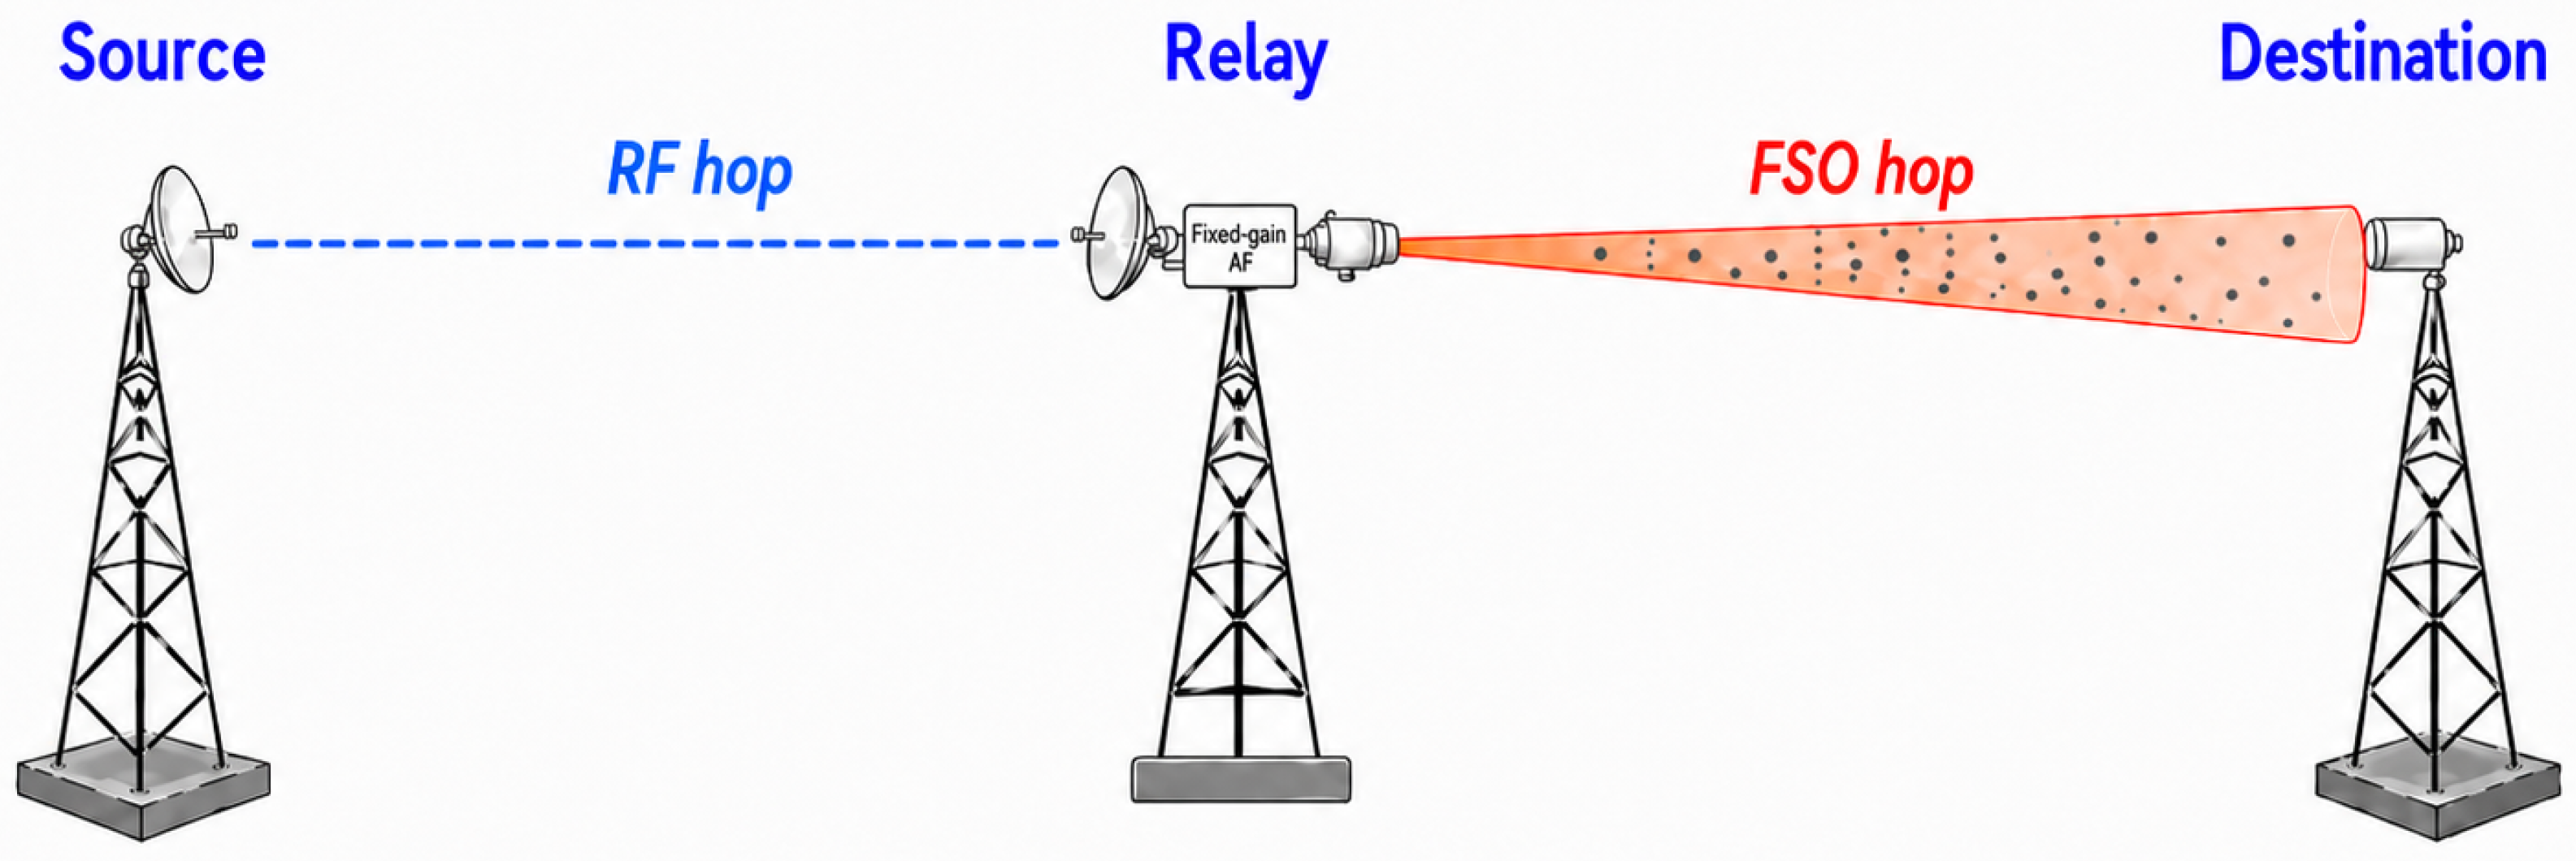
The operating concept of the considered cascaded RF/FSO system is illustrated in
Figure 1. The source communicates with the fixed-gain AF relay through the RF hop, after which the relay converts and forwards the received signal over the dust-impaired FSO hop toward the destination.
Mixed RF/FSO relaying has been investigated under a wide range of fading conditions, optical impairments, and relaying strategies. The survey in [
5] provides a comprehensive classification of hybrid and mixed RF/FSO architectures and highlights their potential for improving link availability and transmission reliability. Representative early analyses of asymmetric mixed RF/FSO dual-hop transmission were presented in [
6,
7]. In particular, the fixed-gain AF system in [
6] employed Rayleigh fading over the RF hop and gamma–gamma turbulence over the FSO hop. The analysis was subsequently extended in [
8] by modeling the optical channel using the generalized
-distribution. More general mixed RF/FSO frameworks incorporating generalized RF fading, atmospheric turbulence, pointing errors, and different AF and DF relaying strategies were investigated in [
9,
10]. The reliability and physical-layer security of mixed dual-hop transmission employing differential chaos shift keying were examined in [
11], while a more recent framework considered rate-splitting transmission over mixed RF/FSO channels [
12]. These studies provide important analytical foundations for evaluating the outage probability, error performance, and ergodic capacity metric. However, their optical channel models primarily characterize turbulence-induced irradiance fluctuations and pointing errors, such as the Málaga-
turbulence and misalignment effects considered in [
13], rather than dust-induced optical-signal variations.
Studies specifically addressing dust- and sand-induced impairments in optical wireless links have followed several different modeling approaches. Libich et al. [
14] experimentally investigated the combined effects of aerosol-particle scattering and atmospheric turbulence on a single FSO link, while Zhong et al. [
15] experimentally characterized laser attenuation under controlled dust/sandstorm conditions as a function of the visibility, optical wavelength, and effective particle size. These studies characterize the dust effect through experimentally measured attenuation rather than through a random dust-fading distribution. Cao et al. [
16] investigated optical propagation through sand-dust media using radiation-propagation and small-angle approximations, accounting for multiple-scattering effects such as attenuation, the pulse delay, and pulse broadening, but without introducing a probabilistic dust-fading model.
Dust effects have also been investigated in hybrid and relay-assisted communication architectures. Esmail et al. [
17] experimentally studied RF and FSO transmission under the same dusty conditions and demonstrated both cascaded FSO/RF transmission and a parallel hybrid configuration in which the RF link can provide an alternative communication path when the FSO link is severely degraded. In this work, the dust effect was characterized experimentally through visibility-dependent attenuation rather than by a random dust-fading distribution. Mohamed et al. [
18] subsequently introduced a probabilistic model for random dust attenuation based on meteorological visibility data, combined it with gamma–gamma atmospheric turbulence, and evaluated a hybrid FSO/RF system using parallel links with selection combining. In another direction, Gismalla et al. [
19] considered a serial multi-hop DF FSO relay system under sandstorm conditions, where sandstorm attenuation was modeled as a visibility-dependent deterministic loss and combined with random atmospheric turbulence, angle-of-arrival fluctuations, and pointing errors. Although this system employs cascaded relaying, all hops are optical and no RF hop is included.
More specifically, the work in [
20] developed a statistical model for dust-induced irradiance fluctuations using controlled experimental measurements. The normalized received irradiance was modeled by a beta distribution, and analytical expressions were developed for the outage probability, average BER, and channel capacity of a single-hop IM/DD FSO system employing OOK modulation. The experimentally fitted beta model in [
20] provides the statistical basis for the dust-impaired optical hop considered in the present work. However, that analysis is limited to a stand-alone FSO link and therefore does not characterize the coupling between the RF multipath fading, dust-induced optical fading, relay gain, and amplified relay noise that arises in a cascaded fixed-gain AF RF/FSO system.
The principal distinctions between representative conventional mixed RF/FSO studies, existing dust-impaired optical and hybrid systems, and the present work are summarized in
Table 1.
The comparison in
Table 1 shows that dust-impaired optical transmission has previously been investigated using experimental attenuation measurements, deterministic visibility-dependent propagation models, and random statistical dust models. Hybrid RF/FSO systems under dusty conditions have also been studied using both cascaded and parallel configurations. However, the existing experimental cascaded FSO → RF study in [
17] characterizes dust primarily through visibility-dependent attenuation, whereas the probabilistic hybrid model in [
18] employs parallel RF and FSO links with selection combining rather than serial AF relaying. Similarly, the beta-distributed dust model in [
20] was developed and analyzed only for a single-hop FSO link. Therefore, the specific unresolved problem addressed here is the end-to-end statistical characterization of a cascaded fixed-gain AF system in which a Rayleigh-faded RF hop and a beta dust-impaired FSO hop are coupled through the relay operation. To the best of the author’s knowledge, the end-to-end performance of this specific Rayleigh/beta fixed-gain AF RF/FSO configuration has not previously been analytically characterized.
Accordingly, the main contributions of this work are summarized as follows: (1) an exact integral representation was formulated for the end-to-end SNR CDF of a cascaded fixed-gain AF RF/FSO system combining a Rayleigh-faded RF hop with an experimentally motivated beta dust-fading FSO hop; (2) a finite-series closed-form approximation was derived using the admissible inverse moments of the FSO-hop SNR; (3) corresponding analytical approximations were developed for the outage probability, average OOK BER, and ergodic capacity metric; and (4) the analytical results were validated through numerical integration and Monte Carlo simulation using experimentally obtained beta dust-channel parameters.
2. Channel and System Models
We considered an asymmetric dual-hop wireless communication system comprising a source node
S, a destination node
D, and a single relay node
R. The system operates in a cascaded RF/FSO configuration, where the source–relay (S–R) link utilizes an RF channel, and the relay–destination (R–D) link employs an FSO channel. There is no direct link between the source and the destination. The relay node adopts a fixed-gain AF protocol, converting the incoming RF signal into an optical signal for onward transmission. The relay is assumed to operate in full-duplex mode, simultaneously receiving over the RF hop and transmitting over the FSO hop. Since the two links operate in distinct RF and optical domains, conventional in-band self-interference is neglected. The end-to-end instantaneous SNR at the destination is given by [
6]:
where
and
denote the instantaneous SNRs of the RF and FSO hops, respectively, and
C is a constant determined by the relay gain and the internal noise power.
The RF link was modeled as a Rayleigh fading channel, which is commonly used to represent multipath fading and serves as a standard baseline in mixed RF/FSO studies [
12]. Consequently, the instantaneous SNR
followed an exponential distribution. Its probability density function (PDF) is given by [
6]:
where
is the average SNR of the RF link.
The FSO link experiences dust-induced fading, modeled by a beta-distributed irradiance
I. Starting from Equation (
3) in [
20] and applying the random variable transformation
the probability density function of
, expressed in terms of its mean value
, is obtained as
where
and
are the shape parameters of the beta distribution, and
denotes the beta function. Here,
denotes the average electrical SNR of the FSO hop. The beta-distributed irradiance
I models the normalized random dust-induced fluctuations around this average. The beta parameters used in this work,
and
, were obtained in [
20] by fitting the beta distribution to experimentally measured normalized irradiance fluctuations under dust-storm conditions. The dust sample used in the experiment was collected from an actual dust storm and had an average particle diameter of approximately
. For the fitted parameters,
and
, and hence, the resulting distribution was concentrated toward the upper normalized-irradiance boundary while exhibiting a tail toward lower irradiance values. This behavior is consistent with the experimental measurements, where a large fraction of the received-signal samples occurred in the high-irradiance region, while dust-induced fluctuations produced intermittent lower-irradiance events.
It should be emphasized that and are empirically fitted statistical shape parameters rather than direct physical measures of the dust-particle size, dust concentration, or atmospheric visibility. Physical properties such as the particle size, concentration, composition, and morphology can influence optical scattering and, consequently, the resulting irradiance statistics. However, the experimental measurements used to obtain the adopted beta parameters did not independently vary or characterize these quantities sufficiently to establish a quantitative mapping between them and . Such a mapping would require dedicated measurements under independently controlled dust conditions and is beyond the scope of the present work.
The FSO hop uses intensity modulation/direct detection (IM/DD) with binary OOK and equal a priori bit probabilities. The receiver employs an optimal fixed decision threshold for on–off keying (OOK) under additive white Gaussian noise (AWGN) that aggregates thermal noise and background-induced shot noise. In this work, atmospheric turbulence and pointing errors were omitted to isolate beta-distributed dust-induced irradiance fluctuations and maintain analytical tractability. If atmospheric turbulence and pointing errors are simultaneously present, the FSO hop would experience additional multiplicative irradiance fluctuations and alignment-dependent losses beyond those represented by the beta dust-fading model. These additional impairments are expected to increase the variability of the received optical signal and reduce the effective FSO-hop SNR, generally resulting in a higher outage probability and BER and lower achievable rates than in the dust-only case considered here. In addition, the resulting composite FSO SNR distribution would differ from that in (
4), and the corresponding inverse moments required in the subsequent finite-series derivation would also change. Consequently, the coefficients of the finite-series approximation would require rederivation. Extending the present framework to jointly incorporate dust fading, atmospheric turbulence, and pointing errors is left for future investigation.
For convenience, the principal symbols and parameters used throughout the subsequent analysis are summarized in
Table 2.
3. CDF of the End-to-End SNR
The CDF of the end-to-end SNR is defined as:
Rewriting the inequality inside the probability yields:
Since
and
are statistically independent, applying the law of total probability [
21] gives the end-to-end CDF as
The CDF of
is given by:
By substituting (
8) into (
7), we obtain the exact integral form of the end-to-end SNR CDF as:
To simplify this expression, we factor the exponential term:
The exponential term in (
11) can be expanded via a Taylor series as:
The expansion involves inverse moments of
. As shown below, the
nth inverse moment is finite only when
. Therefore, the maximum admissible summation order is defined as
Accordingly, the series is truncated at
. For the experimentally obtained value
considered in this work,
. Using the admissible terms of the expansion in (
13) and substituting (
12) into (
11) gives:
We define the
n-th inverse moment as:
Therefore, the CDF becomes:
Using the normalized PDF of
from (
4), the
n-th inverse moment is derived as:
Substituting (
17) into (
16) and retaining the admissible terms up to
yields the following finite-series closed-form approximation:
Validity of the Finite-Series Approximation
It is important to emphasize that the expression in (
18) is a finite-series closed-form approximation rather than an exact representation of the end-to-end CDF, since it is obtained by retaining only the admissible terms of the Taylor expansion in (12). The exact end-to-end CDF remains the integral expression given in (11).
A convenient parameter for characterizing the magnitude of the finite-series terms is defined as
The approximation generally becomes more accurate as
decreases. This occurs at moderate and high average SNR values, for smaller values of the relay coefficient
C, or for smaller evaluation values of
. Conversely, the approximation accuracy may deteriorate under low-average-SNR conditions, large SNR thresholds, or large values of
C.
Therefore, the applicability of (
18) should be assessed by comparison with the exact numerical evaluation of (11). In particular, the approximation should be used within the operating region in which it remains close to the exact CDF and satisfies the probability constraint
. The numerical accuracy of the proposed approximation is examined in
Section 5.
The low-SNR limitation originates from restricting the Taylor expansion in (
12) to the terms for which the required inverse moments are finite. When
becomes relatively large, the resulting finite-series approximation becomes less accurate and may, in severe cases, yield CDF values outside the admissible probability interval
. Therefore, the direct numerical evaluation of the exact integral in (11) should be preferred when a high accuracy is required in the low-SNR region, whereas the finite-series expression provides a convenient analytical alternative in the moderate- and high-SNR regions. Alternative approximation techniques that do not rely on the same inverse-moment truncation may be investigated in future work to extend the useful analytical range toward a lower SNR.
5. Numerical Results
This section presents the numerical performance evaluation of the considered dual-hop relay system. The fading coefficients for the FSO hop were characterized by a beta distribution with shape parameters
and
, which were empirically obtained from experimental measurements [
20]. The normalized fixed-gain relay parameter
C was set to unity and
for the baseline numerical results, with equal average SNRs across both hops, i.e.,
, unless otherwise specified. The equal-average-SNR condition was adopted only as a symmetric reference case for the numerical evaluation; the general expressions derived above retained
and
separately and were therefore applicable to unequal hop SNRs. In practical asymmetric deployments, the degradation of either hop can limit the end-to-end performance. A relatively weak RF hop reduces the signal quality available at the relay, whereas a weak FSO hop increases the influence of the optical-hop impairment and relay-noise term. From (
1), as
becomes large relative to
C, the end-to-end SNR approaches
, indicating that further improvement of an already strong FSO hop provides diminishing benefit and the RF hop becomes the dominant limitation. Thus, the assumption
should be viewed as a convenient baseline rather than a general deployment constraint.
5.1. Accuracy of the Finite-Series Outage Approximation
To quantify the accuracy of the finite-series outage approximation, its results were compared with the exact numerical evaluation of the outage integral in (
11). The absolute outage-probability error is defined as the magnitude of the difference between the approximate and exact outage probabilities as
For this comparison, the SNR threshold was set to
dB.
To illustrate the low-SNR behavior clearly,
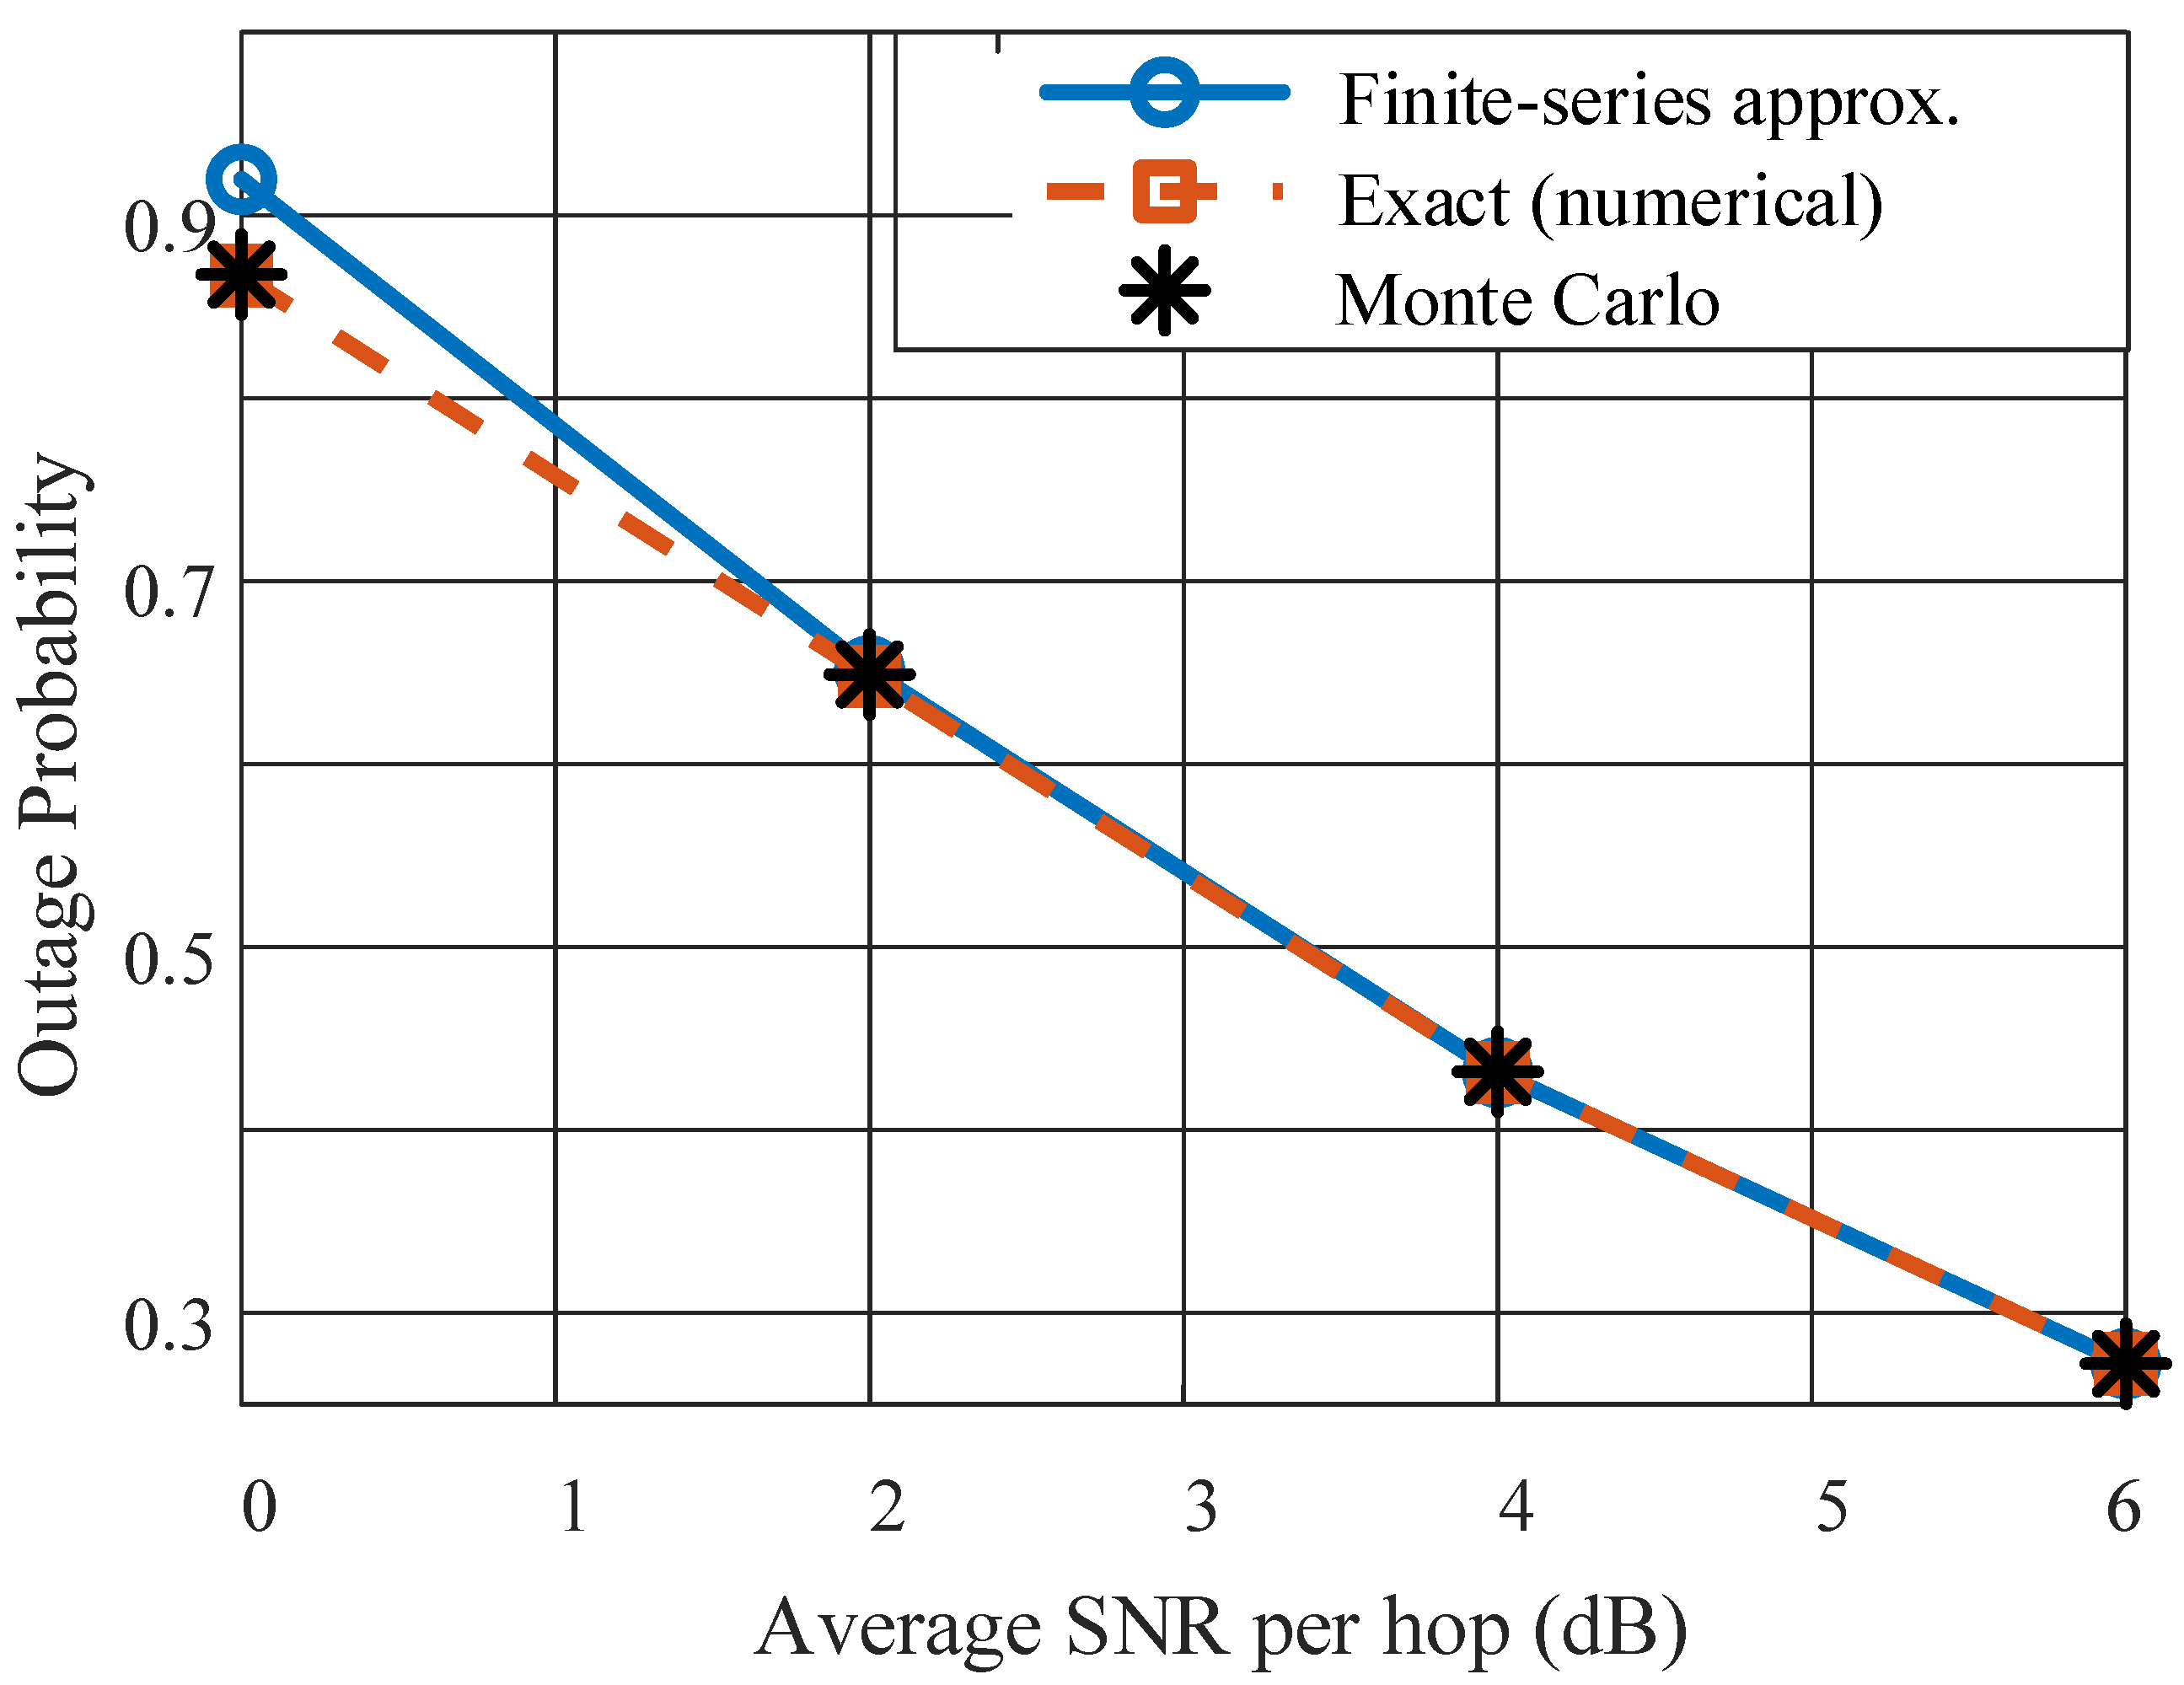
Figure 2 compares the finite-series outage approximation with the exact numerical result and Monte Carlo simulation. A linear vertical scale was used because the difference at a low SNR is difficult to observe in the logarithmic-scale outage plot.
As shown in
Figure 2, the finite-series approximation slightly overestimated the exact outage probability at an average SNR of 0 dB. At this operating point, the approximate and exact outage probabilities were
and
, respectively, corresponding to an absolute error magnitude of
and a relative error of approximately
. The Monte Carlo result was
and closely followed the exact numerical value.
The deviation at 0 dB was associated with the relatively large value of the approximation parameter defined in (19). In this region, the terms omitted from the finite-series expansion had a more significant contribution. As the average SNR increased, the product increased and decreased, thereby reducing the contribution of the omitted terms.
The approximation accuracy improved rapidly with an increasing average SNR. At 2 dB, the approximate and exact outage probabilities were and , respectively, corresponding to an absolute error of . The error decreased to at 4 dB and to at 6 dB. Consequently, the approximate and exact outage curves became practically indistinguishable in the moderate-SNR region.
The Monte Carlo results closely followed the exact numerical curve over the SNR interval shown in
Figure 2. This agreement confirms the numerical evaluation of the exact outage integral and the Monte Carlo implementation.
To quantify the trade-off between the approximation accuracy and the computational cost, the finite-series expression was further compared with direct numerical integration in terms of the execution time. Inspired by the performance–complexity approach in [
25], the normalized computation time was defined as
, where
denotes the finite-series approximation or exact numerical integration, respectively;
is the median execution time of method
i; and
is the median execution time of the finite-series method. An accuracy-weighted computational metric was defined as
, where
is the relative error of method
i expressed as a fraction. The term
ensures that the exact numerical method, for which
, still reflects its computational cost. Lower values of
indicate a more favorable accuracy–computation trade-off.
As shown in
Table 3, the finite-series approximation was approximately 138 times faster than exact numerical integration at 0 dB, although its relative error was about
. At 5 dB, the relative error decreased to only
while the speedup remained at approximately 145 times. At 10 and 20 dB, the approximation error became practically negligible, while the finite-series method remained approximately 123–185 times faster. The composite metric further quantifies this trade-off:
decreased from
at 0 dB to approximately unity at 5 dB and above, whereas
ranged from approximately 123 to 185 because of its substantially higher computation time. Since lower values of
indicate a more favorable trade-off, these results confirm that the finite-series approximation provides a clear computational advantage with negligible accuracy loss in the moderate- and high-SNR regions. The execution times were measured in Google Colab using an Intel Xeon 2.20 GHz CPU with two CPU cores and 12 GiB of memory, and the reported values correspond to median execution times over repeated evaluations.
At a very low average SNR, however, a measurable approximation error may occur. Therefore, the direct numerical evaluation of the exact integral in (
11) should be preferred when a high accuracy is required in that operating region.
5.2. End-to-End SNR Distribution
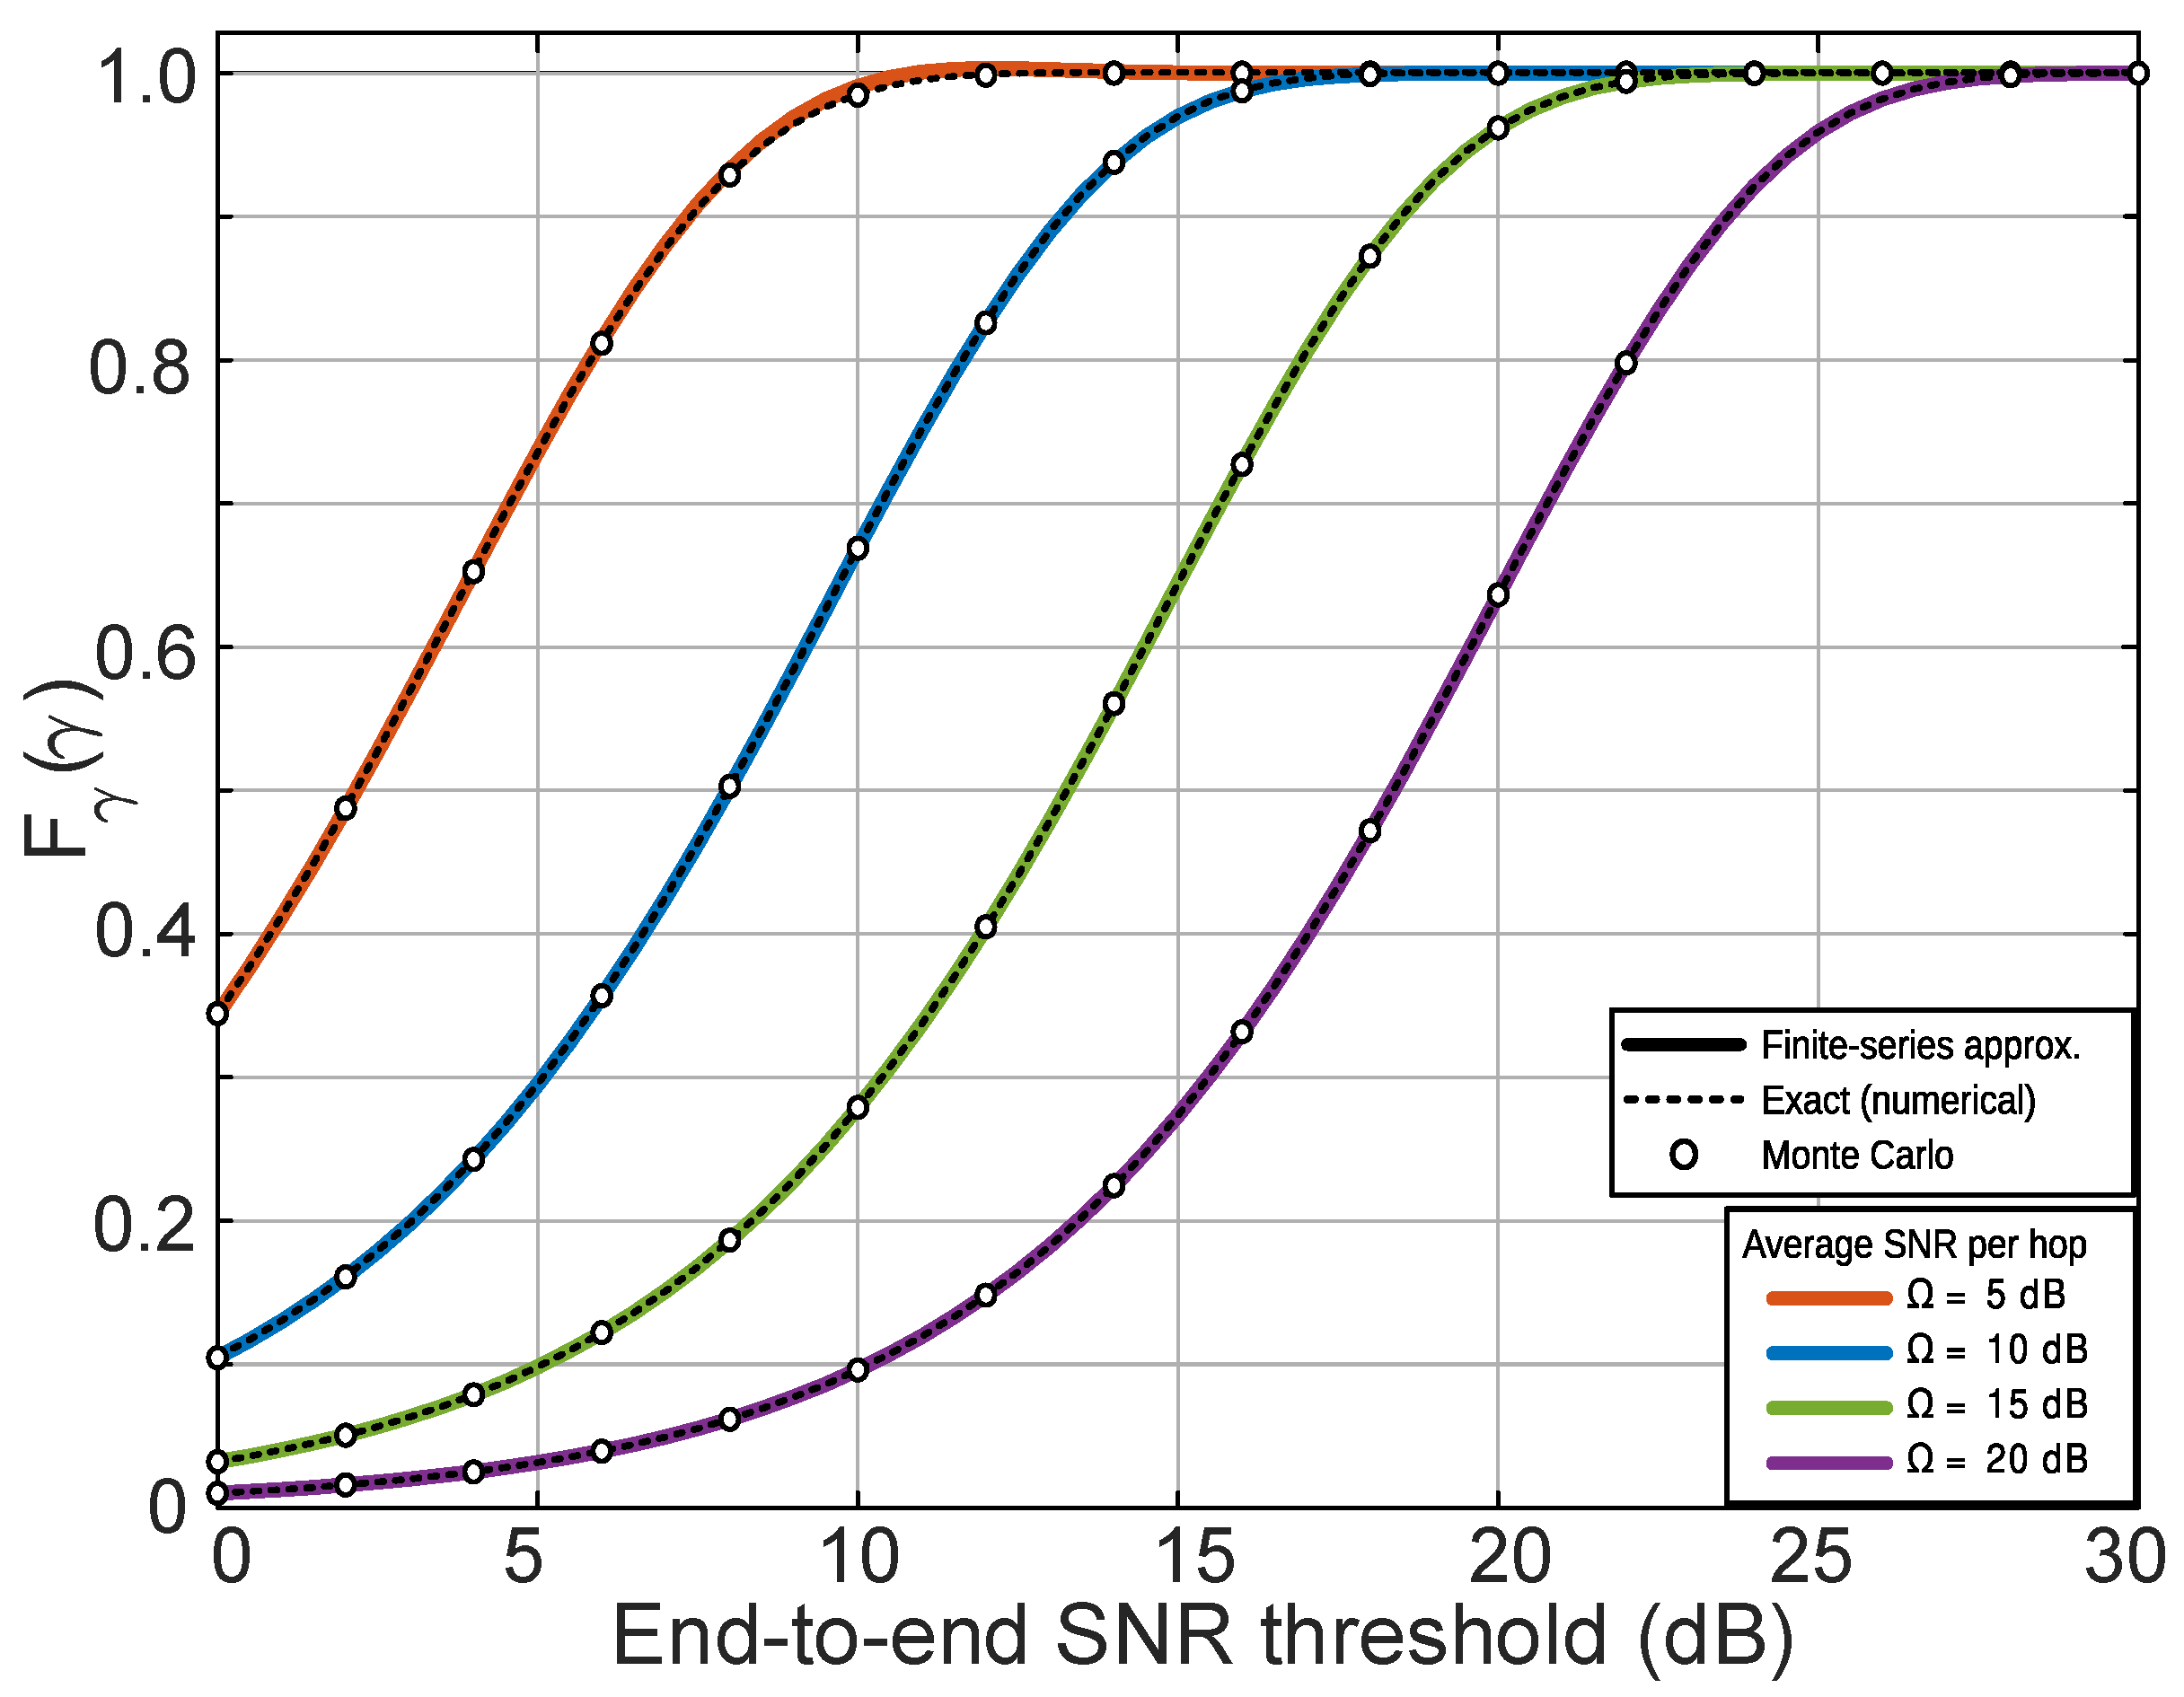
Figure 3 presents the end-to-end SNR CDF for equal average SNRs of
, 10, 15, and 20 dB. For each operating condition, the finite-series approximation was compared with the exact numerical evaluation and Monte Carlo simulation.
The exact numerical and Monte Carlo results closely agreed for all the considered average-SNR values, confirming the exact CDF evaluation and simulation procedure. Increasing the average SNR shifted the CDF curves toward higher end-to-end SNR thresholds. Thus, for a fixed threshold, the probability that the instantaneous end-to-end SNR falls below that threshold decreased as the average SNR increased.
The finite-series approximation closely followed the exact numerical and Monte Carlo CDFs over most of the considered operating range. For dB, a small deviation appeared in the upper-CDF region as the evaluation threshold increased. In particular, the approximation showed its most noticeable overshoot above the valid CDF upper bound of unity over thresholds of approximately 11–15 dB, reaching a maximum value of about near dB, corresponding to an overshoot of only about . This localized deviation resulted from truncating the series at , since the omitted higher-order terms became more influential as increased. For dB, the corresponding overshoot was negligible, while no out-of-range values were observed for the 15- and 20-dB cases over the considered threshold range. The close agreement between the exact numerical and Monte Carlo results confirms that this small validity violation arose from the finite-series approximation rather than from the adopted beta dust-fading model.
5.3. Outage Probability Performance
Having examined the low-SNR accuracy of the finite-series outage approximation,
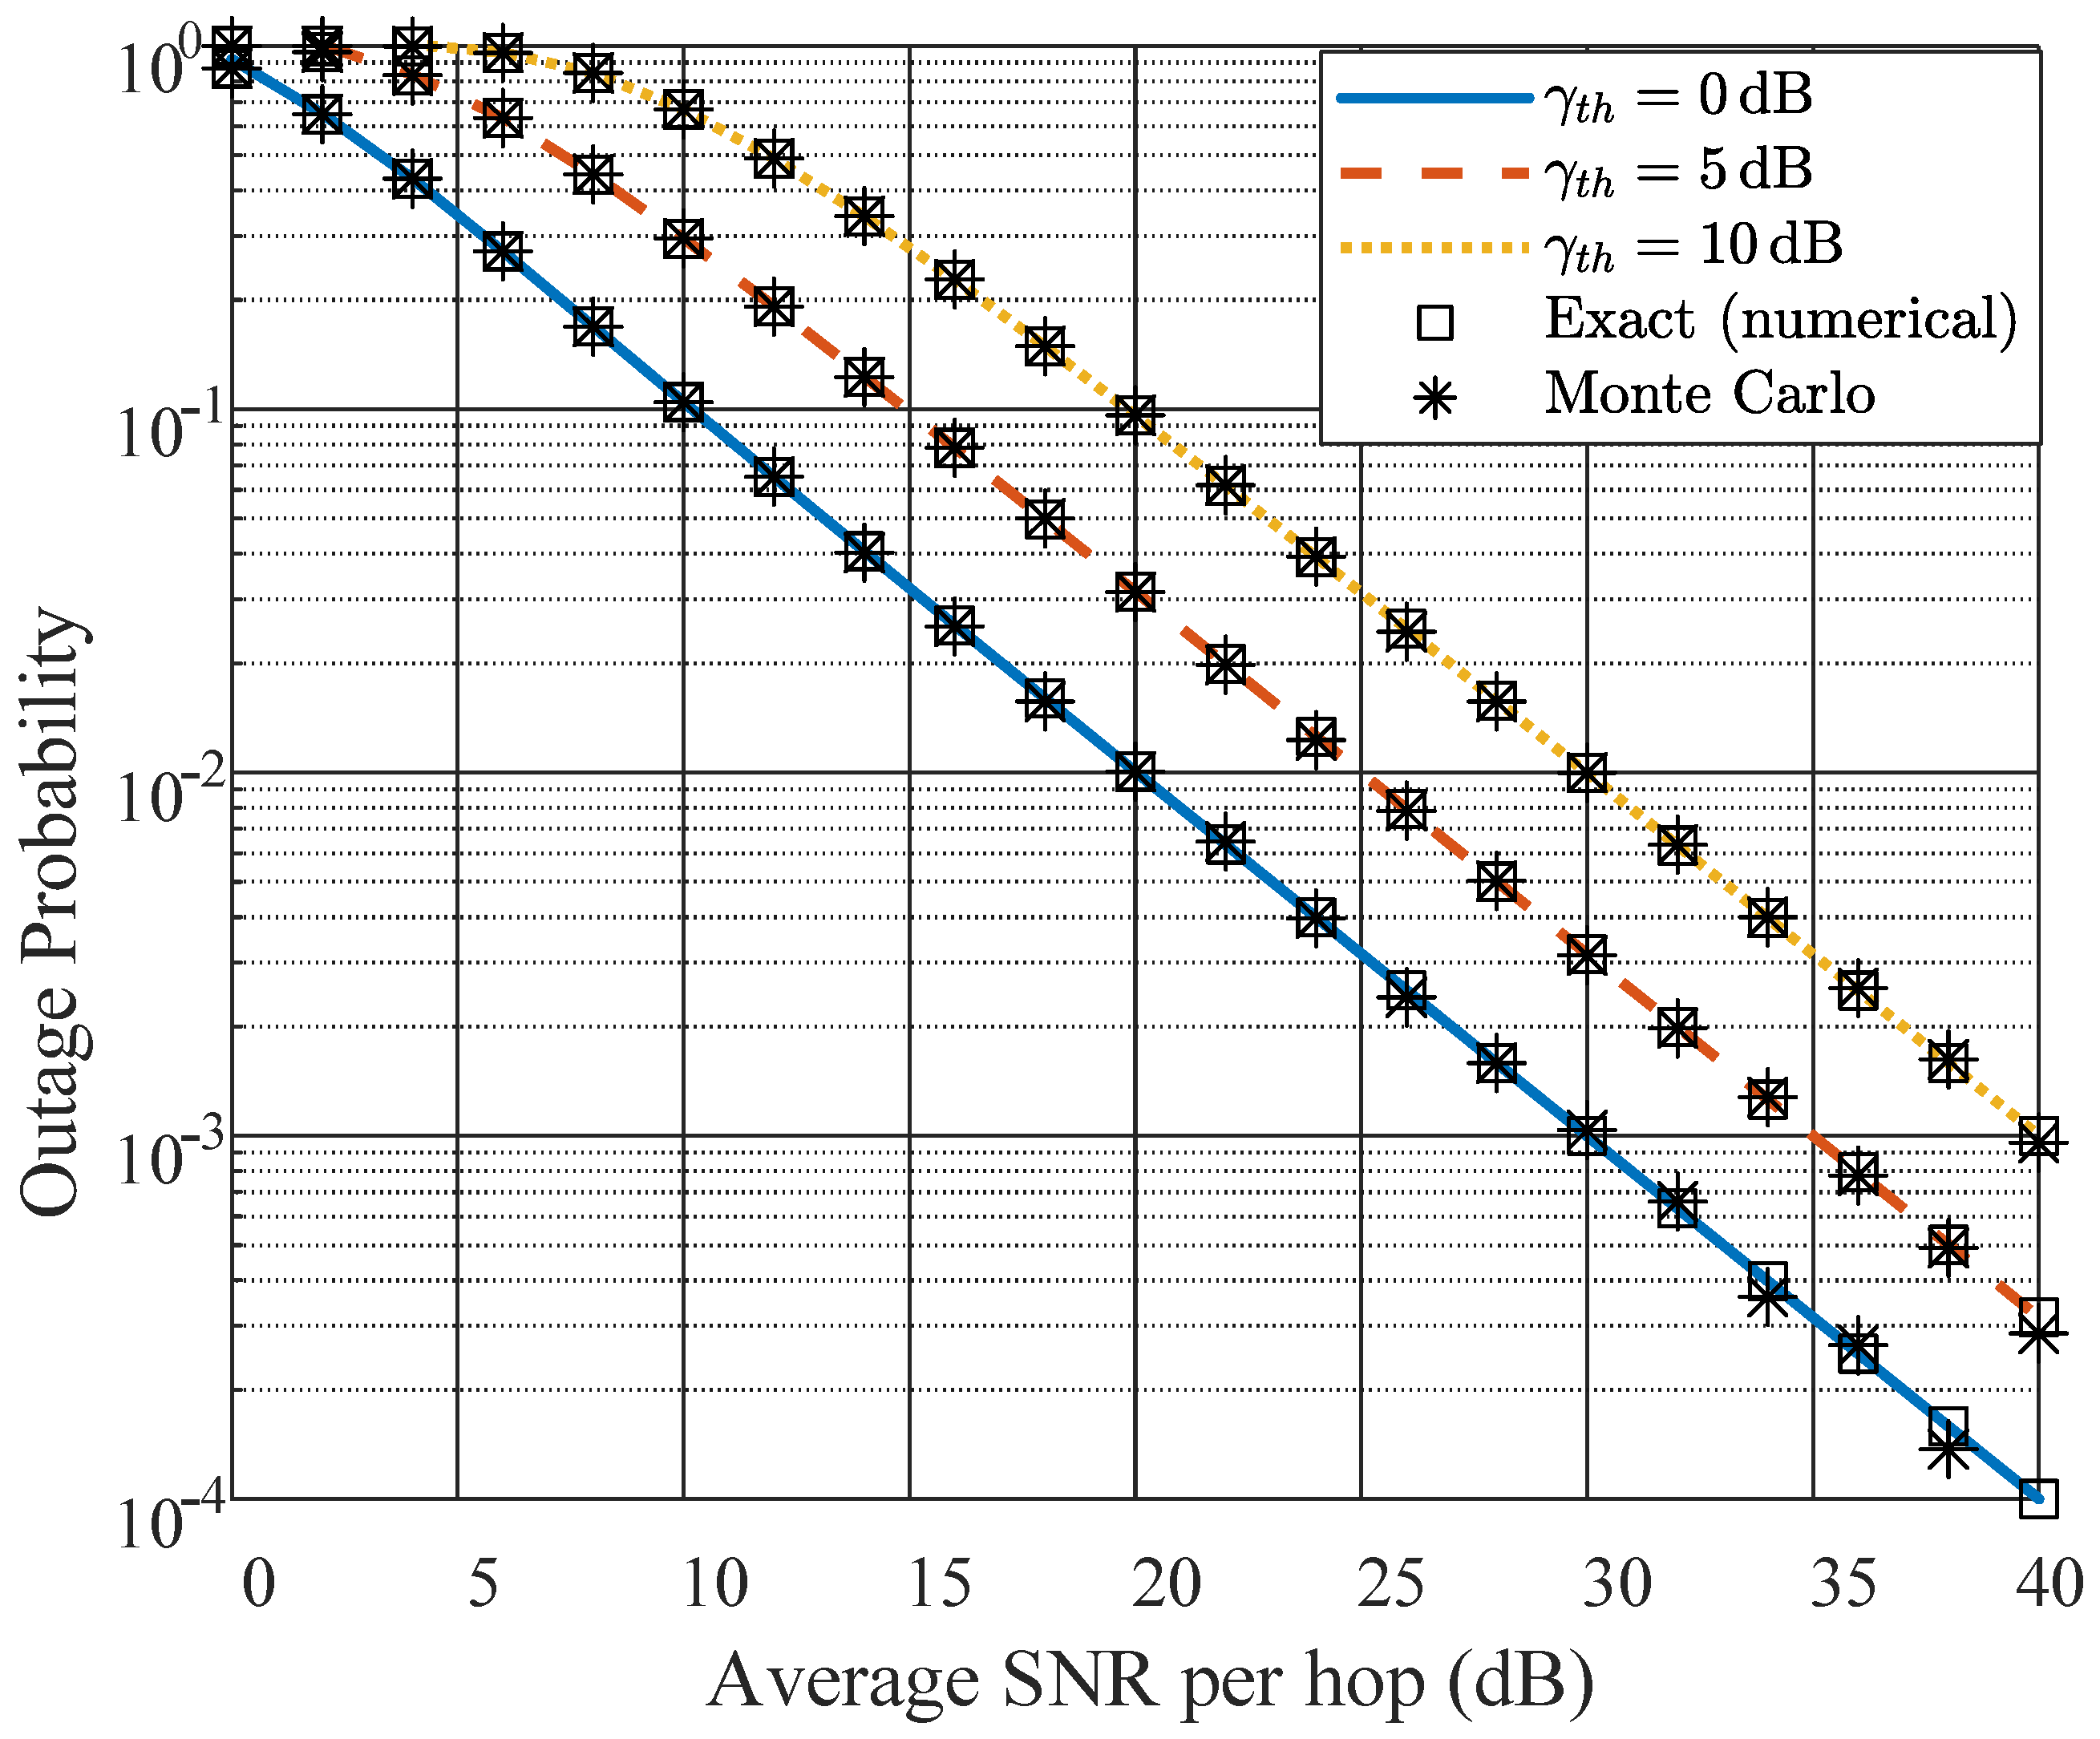
Figure 4 compares the approximate outage probability with the exact numerical evaluation and Monte Carlo simulation for
, 5, and 10 dB. The Monte Carlo results closely followed the exact numerical integration over the considered SNR range. The finite-series approximation exhibited a measurable deviation at a very low SNR, as discussed in
Section 5.1, but rapidly approached the exact result as the average SNR increased. As expected, the outage probability decreased monotonically with an increasing average SNR, reflecting improved link reliability. Higher values of
resulted in larger outage probabilities. For instance, at an average SNR of 20 dB, the outage probability was approximately
for
dB and increased to approximately
and
for thresholds of 5 and 10 dB, respectively. This behavior was expected because higher SNR thresholds impose stricter reliability requirements, thereby increasing the likelihood of outage.
5.4. Average BER Performance
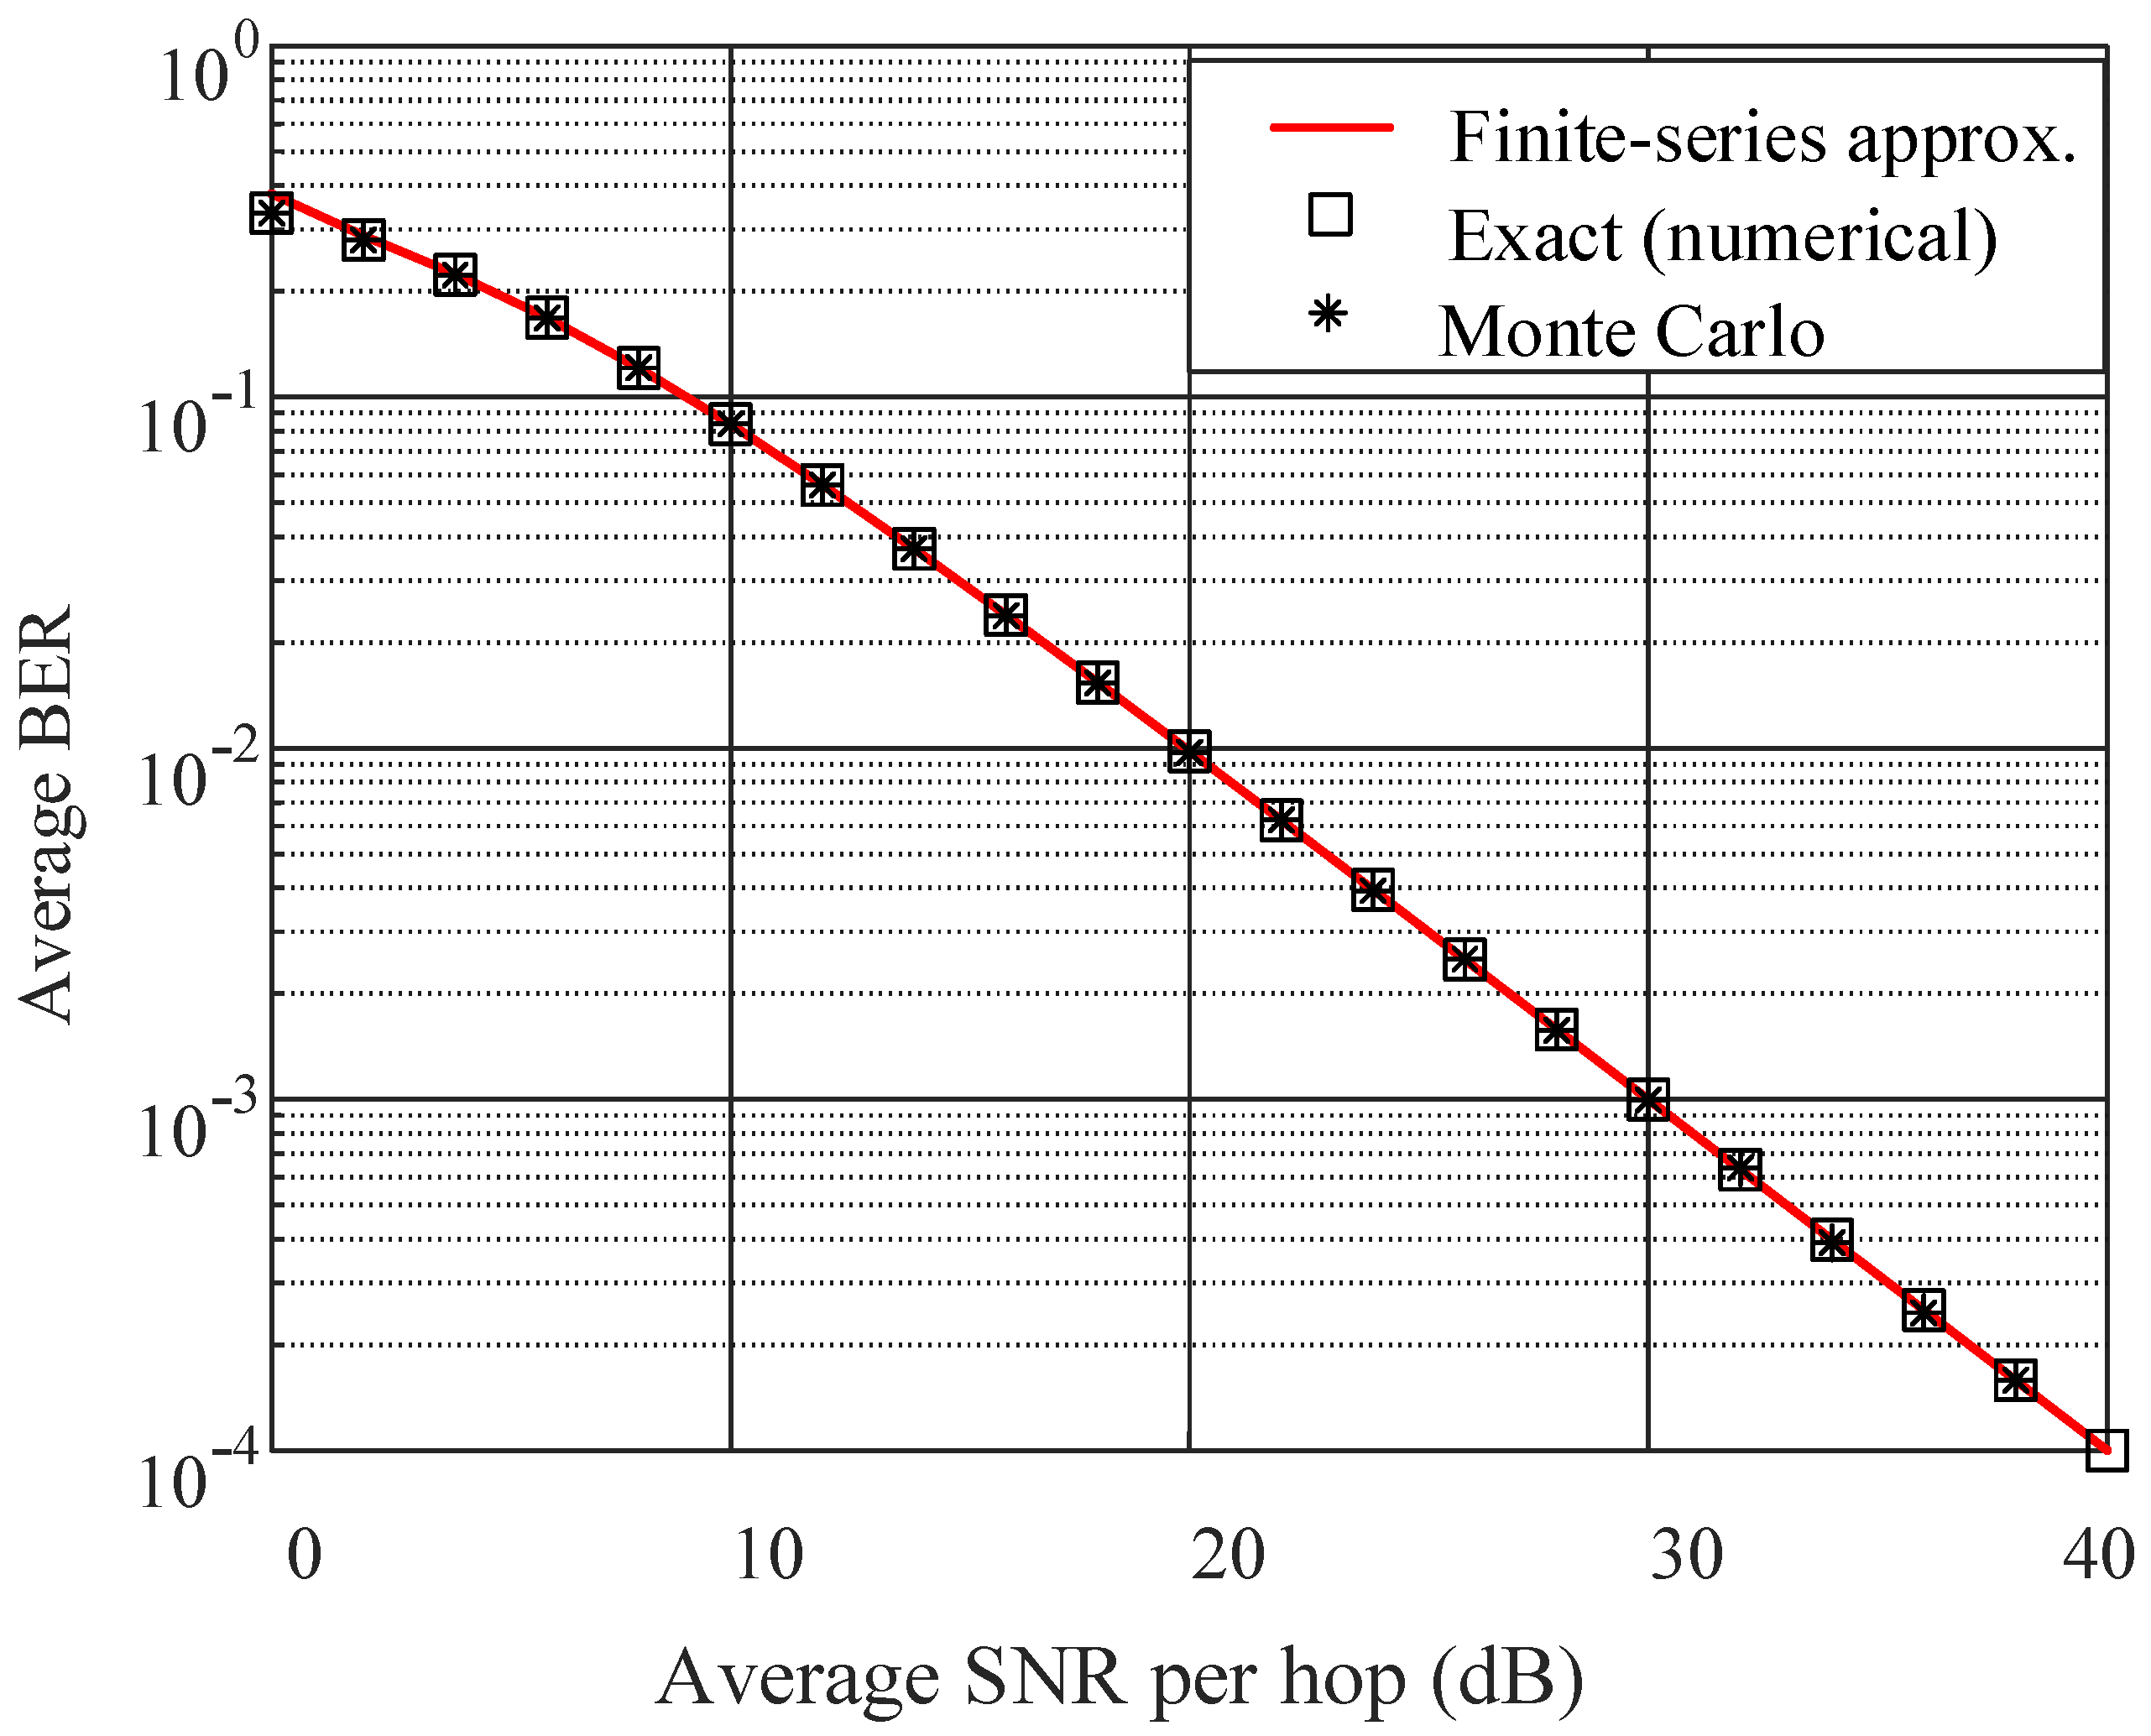
Figure 5 compares the finite-series approximation, exact numerical evaluation, and Monte Carlo simulation of the average BER. The exact numerical and simulated results closely agreed over the considered SNR range, confirming the numerical and simulation procedures.
A visible approximation error occurred at a very low average SNR. At 0 dB, the approximate and exact BER values were approximately and , respectively, giving an absolute error magnitude of about . This deviation is consistent with the low-SNR limitation of the truncated finite-series expansion.
As the average SNR increased, the approximation rapidly approached the exact result, and the curves became practically indistinguishable in the moderate- and high-SNR regions. The average BER decreased monotonically with increasing SNR, reaching the order of at 30 dB. Therefore, the finite-series expression provides an accurate and computationally efficient BER estimate except under very-low-SNR conditions.
5.5. Ergodic Capacity Metric Performance
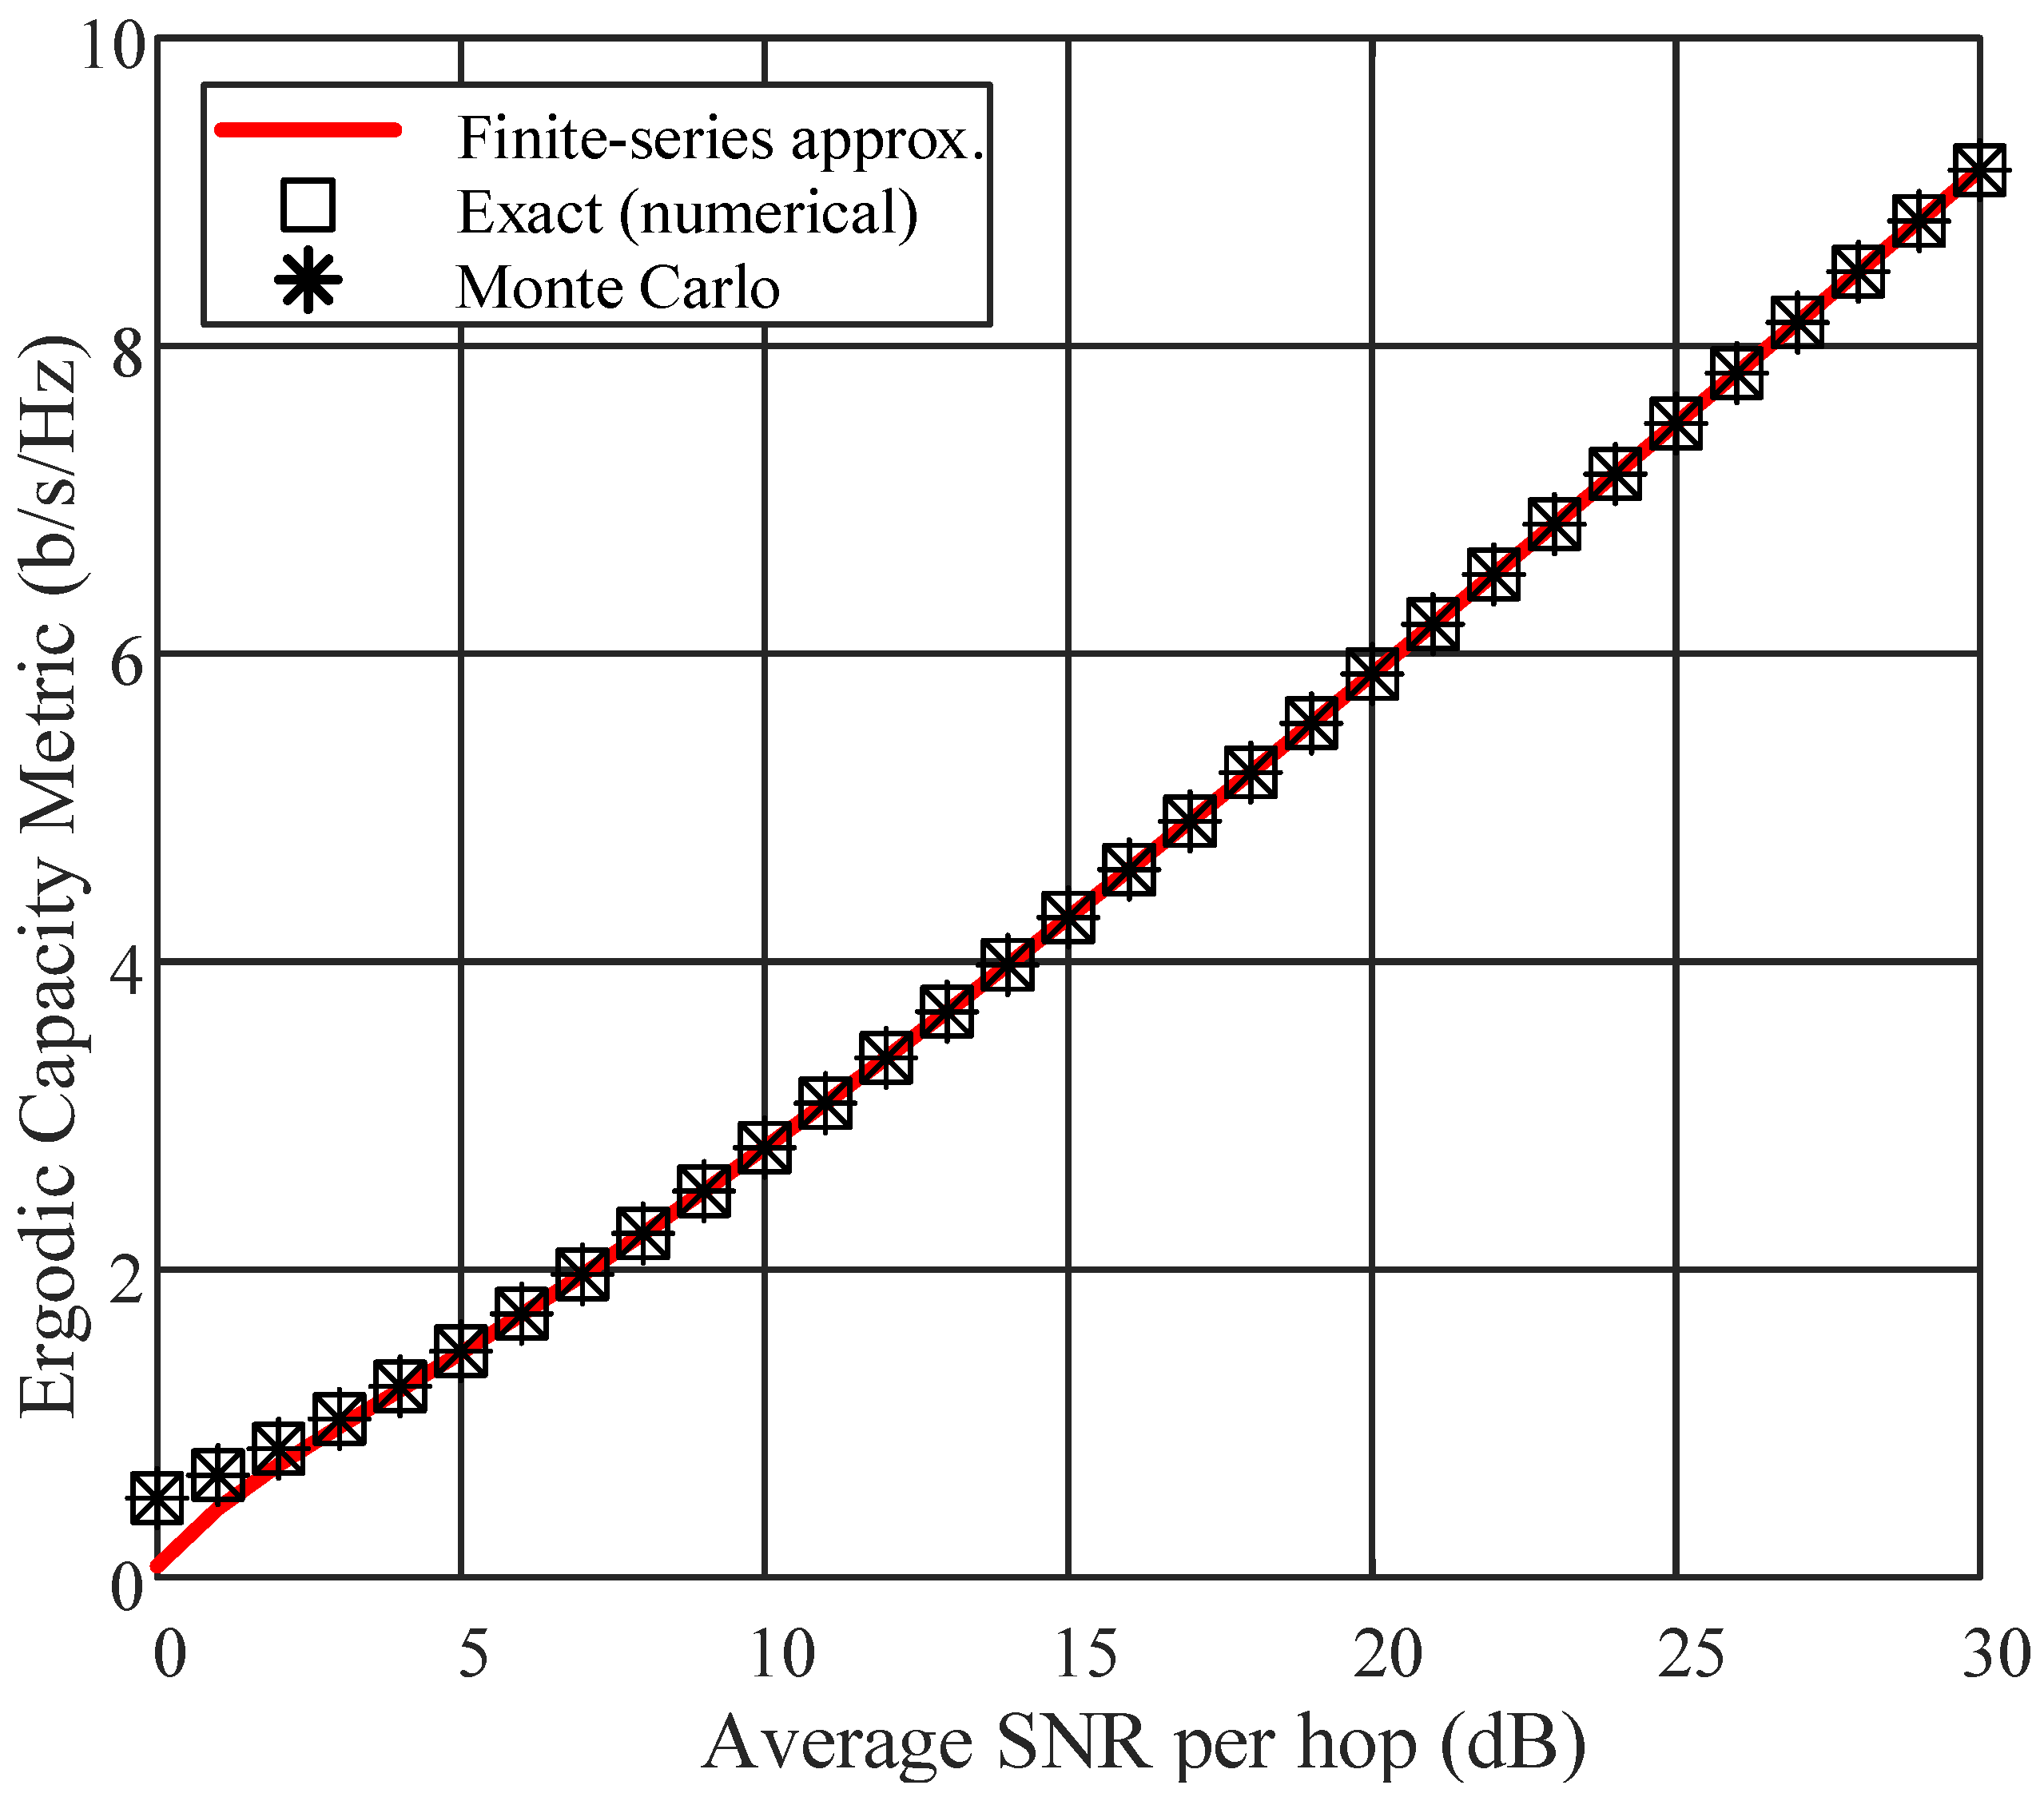
Figure 6 presents the ergodic capacity metric obtained using the finite-series approximation, exact numerical evaluation, and Monte Carlo simulation. The Monte Carlo results closely followed the exact numerical metric over the considered SNR range, whereas the finite-series approximation exhibited a noticeable deviation at a very low SNR. At an average SNR of 0 dB, the exact and approximate metric values were approximately
and
b/s/Hz, respectively. This discrepancy was attributed to the reduced accuracy of the truncated finite-series approximation when the parameter
is relatively large.
The approximation accuracy improved rapidly with an increasing average SNR. At 5 dB, the exact and approximate metric values were approximately and b/s/Hz, respectively, reducing the absolute error magnitude to approximately b/s/Hz. At 10 dB, the corresponding metric values were and b/s/Hz, and the error decreased further to approximately b/s/Hz. Hence, the finite-series and exact metric curves became practically indistinguishable in the moderate- and high-SNR regions.
The exact ergodic capacity metric increased monotonically with the average SNR, reaching approximately b/s/Hz at 20 dB and b/s/Hz at 30 dB. These results show that the finite-series expression provides a computationally efficient and highly accurate estimate of the metric at moderate and high SNRs, whereas a direct numerical evaluation of the exact integral should be preferred when accurate metric values are required at very low SNRs.
5.6. Parameter Sensitivity Analysis
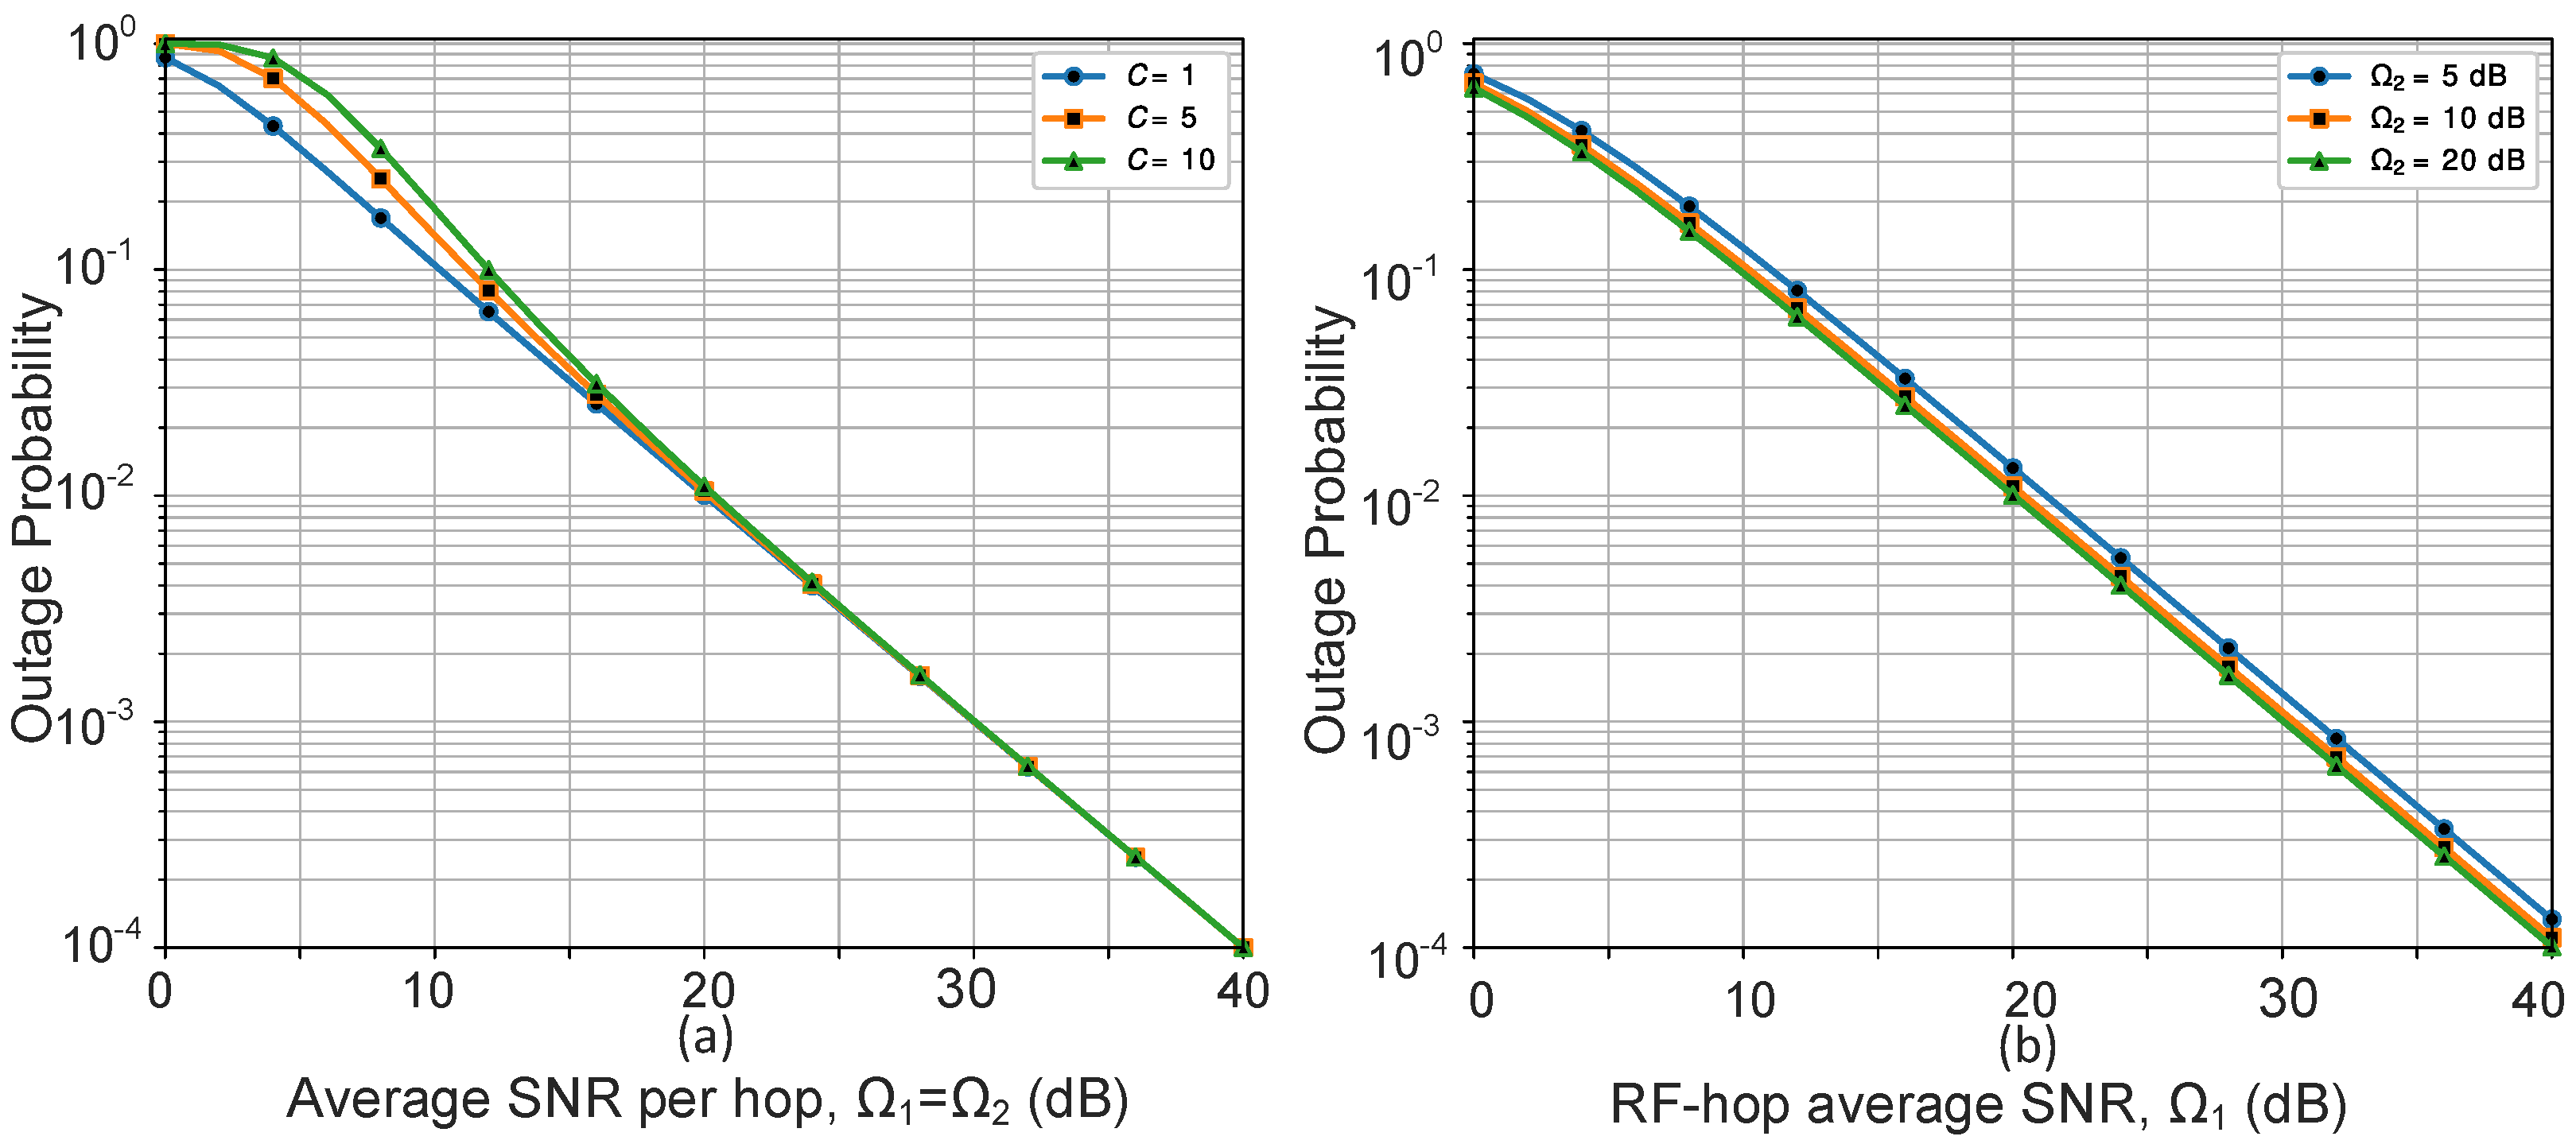
To examine the sensitivity of the system beyond the baseline configuration, the outage probability was further evaluated for different values of the fixed-gain relay parameter C and for unequal RF/FSO average SNRs. The experimentally fitted dust-channel parameters were retained throughout this analysis to preserve the physical basis of the adopted statistical model.
Figure 7a shows that increasing the relay parameter
C increased the outage probability, with the effect being most pronounced in the low- and moderate-SNR regions. For example, at an equal per-hop average SNR of 10 dB, the exact outage probability increased from approximately
for
to
for
and
for
. At 20 dB, the corresponding values decreased to approximately
,
, and
, respectively. These results quantitatively demonstrate that the influence of
C becomes progressively weaker as the average SNR increases. This behavior follows directly from the end-to-end SNR expression in (
1), since the relative influence of
C diminishes as the FSO-hop instantaneous SNR becomes large compared with
C. Consequently, the system becomes progressively less sensitive to the relay parameter at high SNRs.
Figure 7b examines the effect of unequal hop average SNRs by varying the RF-hop average SNR
while maintaining fixed FSO-hop average SNRs of
, 10, and 20 dB. Increasing
improves the outage performance; however, the improvement becomes progressively smaller as the FSO hop becomes stronger. For example, at
dB, increasing
from 5 to 10 dB reduces the exact outage probability from approximately
to
, while a further increase to
dB reduces it only to approximately
. This diminishing improvement is explained by the end-to-end SNR expression in (
1), since, for a sufficiently large
relative to
C,
approaches
. Thus, further improvement of an already strong FSO hop provides only a limited additional performance gain, while the RF hop becomes the dominant performance limitation under the considered operating conditions.
6. Conclusions
This paper investigated the performance of a cascaded dual-hop RF/FSO system employing a fixed-gain AF relay. The RF hop was modeled using Rayleigh fading, whereas the FSO hop was characterized by an experimentally motivated beta distribution representing dust-induced irradiance fluctuations. An exact integral representation of the end-to-end SNR CDF was formulated, and finite-series closed-form approximations were derived for the outage probability, average OOK BER, and ergodic capacity metric.
The beta dust-fading parameters adopted for the FSO hop were obtained from previously reported experimental measurements, whereas the cascaded RF/FSO system developed in this work was evaluated analytically and validated numerically through direct numerical integration and Monte Carlo simulation. No experimental implementation of the complete cascaded system was performed in the present study. The results showed that a measurable approximation error may occur under very-low-SNR conditions, whereas a highly accurate agreement was achieved in the moderate- and high-SNR regions. The high-SNR analysis further demonstrated that the considered system achieved a diversity order of one under equal per-hop average-SNR scaling. Under the adopted channel parameters, the Rayleigh-faded RF hop determined the leading asymptotic outage slope, while the beta dust parameters and relay coefficient influenced the finite-SNR performance through higher-order terms.
The developed analytical framework provides computationally efficient tools for evaluating cascaded RF/FSO relay systems under beta-distributed dust fading. Future work may extend the analysis to include atmospheric turbulence, pointing errors, visibility-dependent dust conditions, adaptive relay-gain selection, and experimental implementation and validation of the complete cascaded RF/FSO system.