A Hybrid Meta-Learning Framework Integrating ECG, Cine-MRI, and Biomarkers for Heart Failure Prediction

 , ,
, ,  and
and
Abstract
1. Introduction
- A novel multimodal framework that integrates structural, electrical, biochemical and demographic data for robust HF prediction.
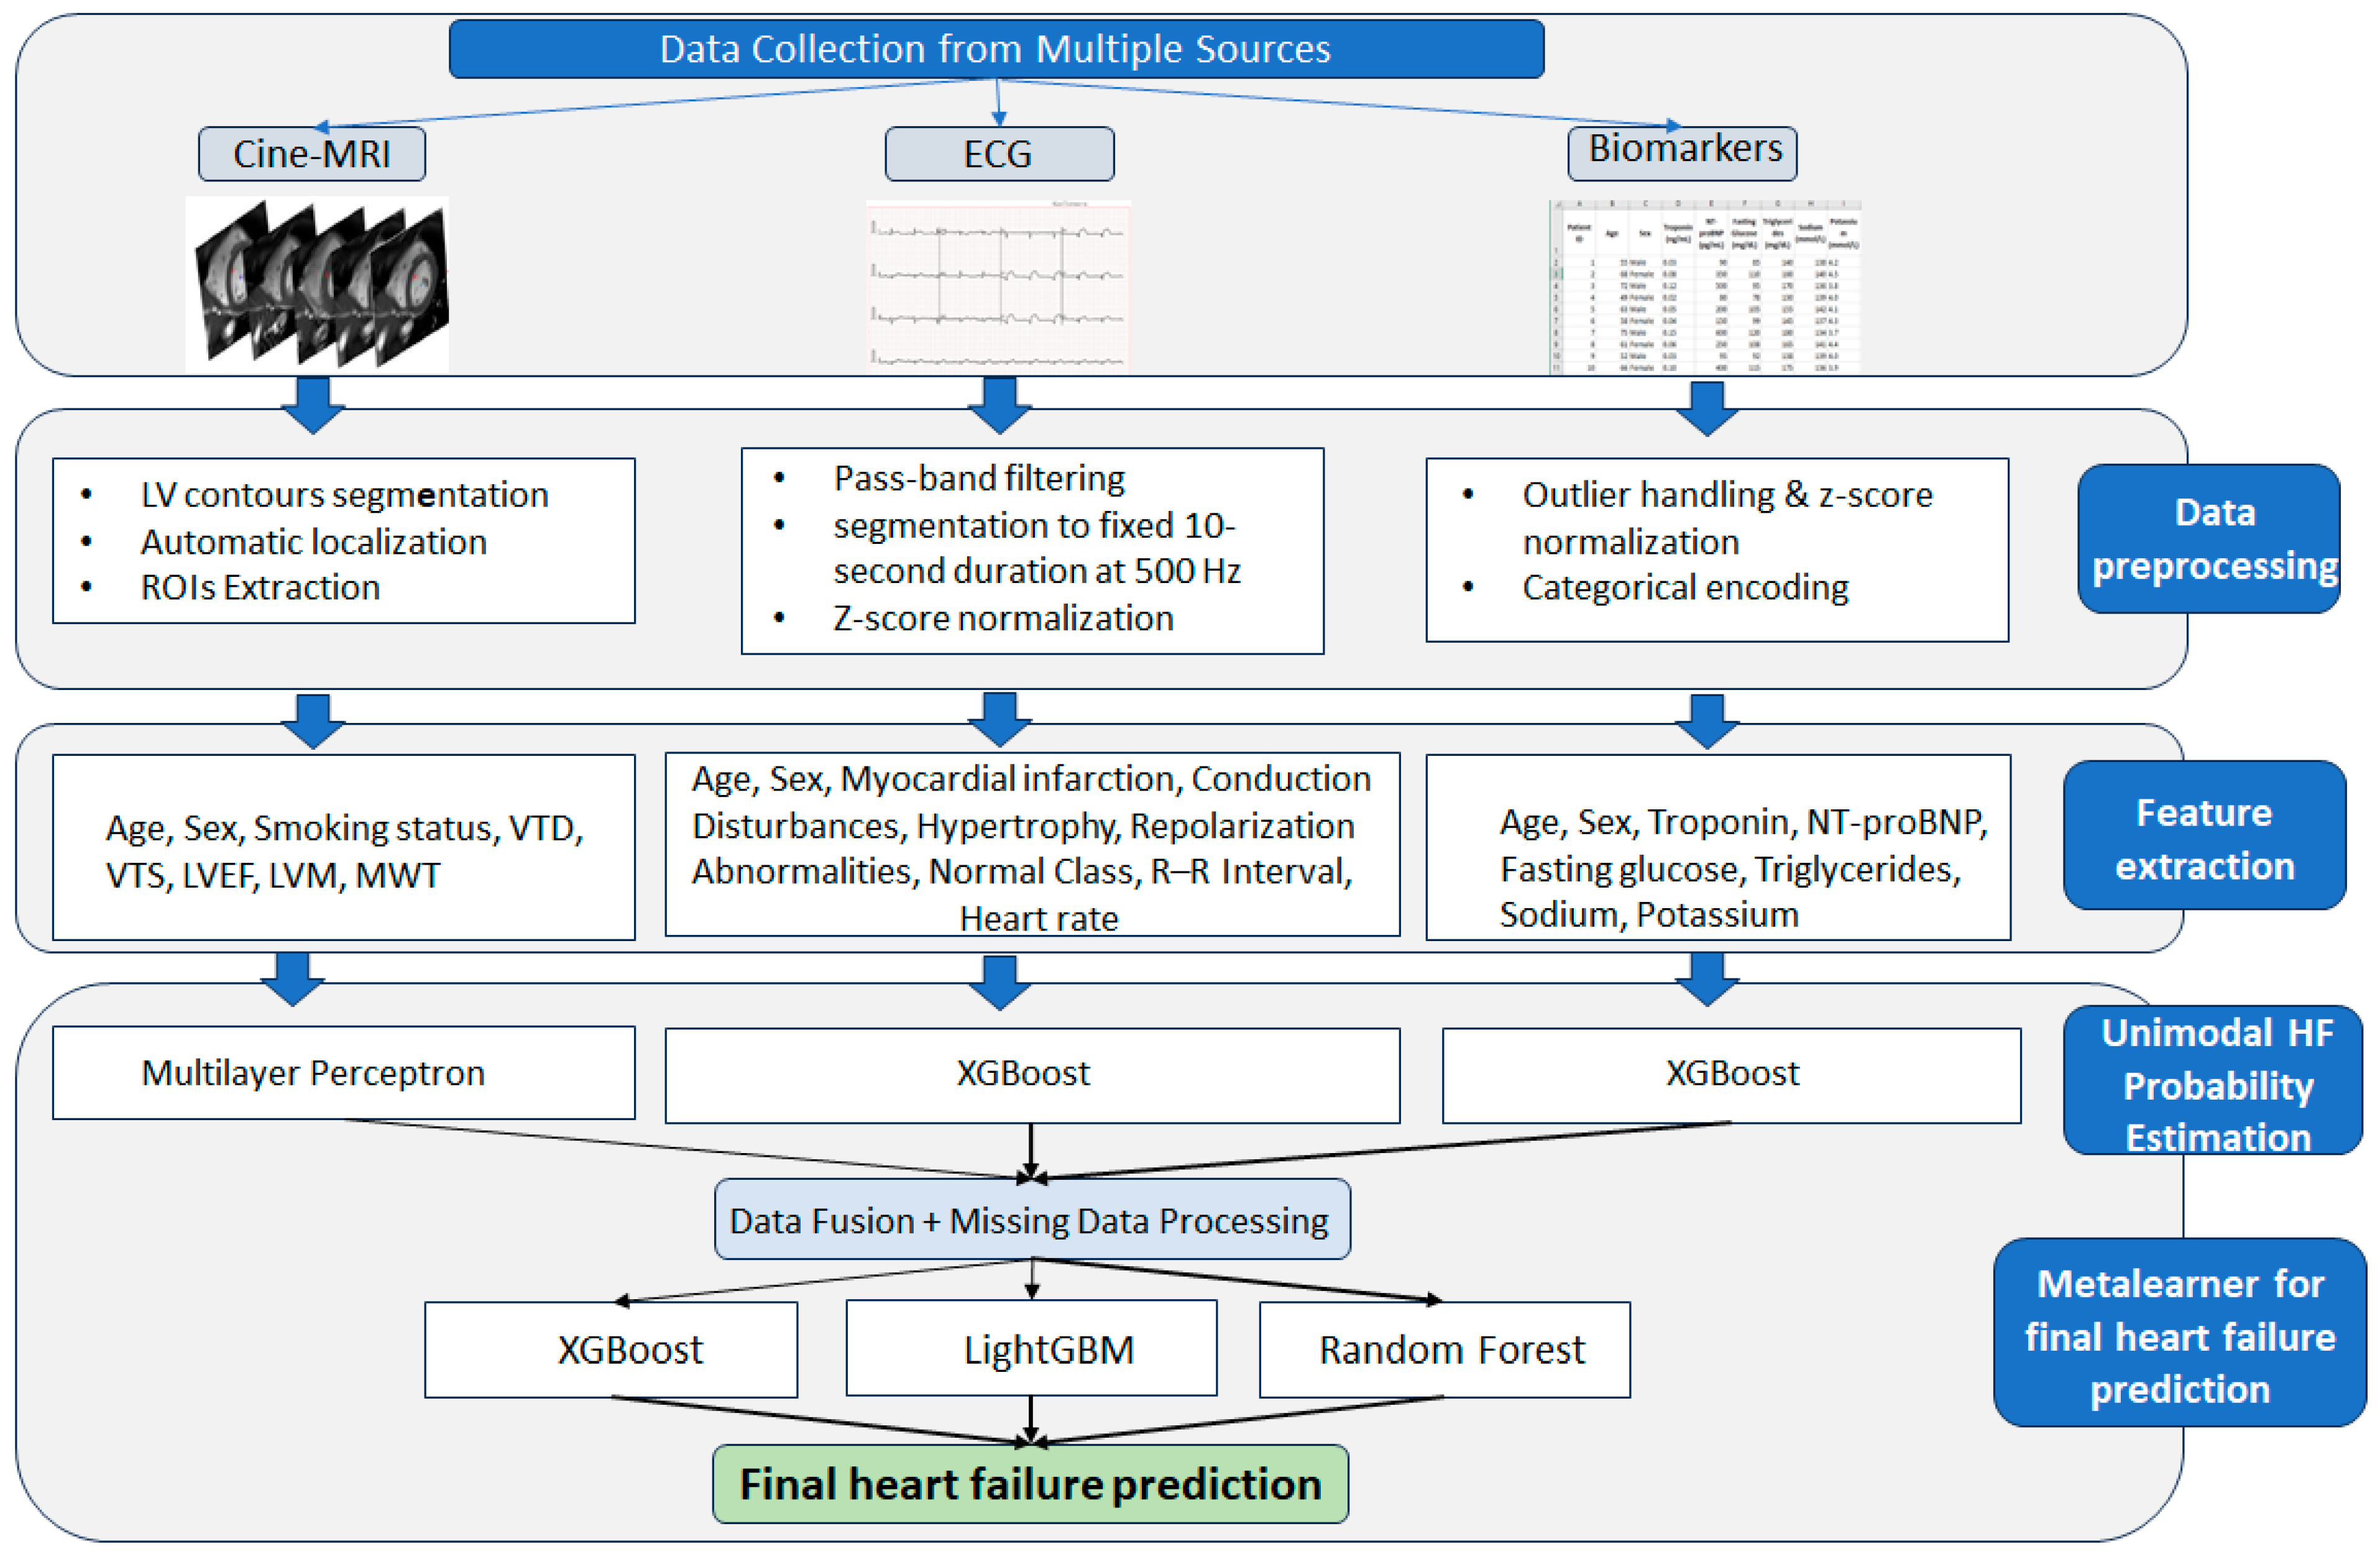
- An adaptive meta-learning architecture combining modality-specific models (Attention U-Net, MLP, XGBoost) with ensemble meta-learners (XGBoost, LightGBM, Random Forest) to handle missing data and adaptively weight heterogeneous inputs.
- A real-world strategy for incomplete data, employing indicator variables and neutral probability placeholders to ensure consistent predictions despite missing modalities.
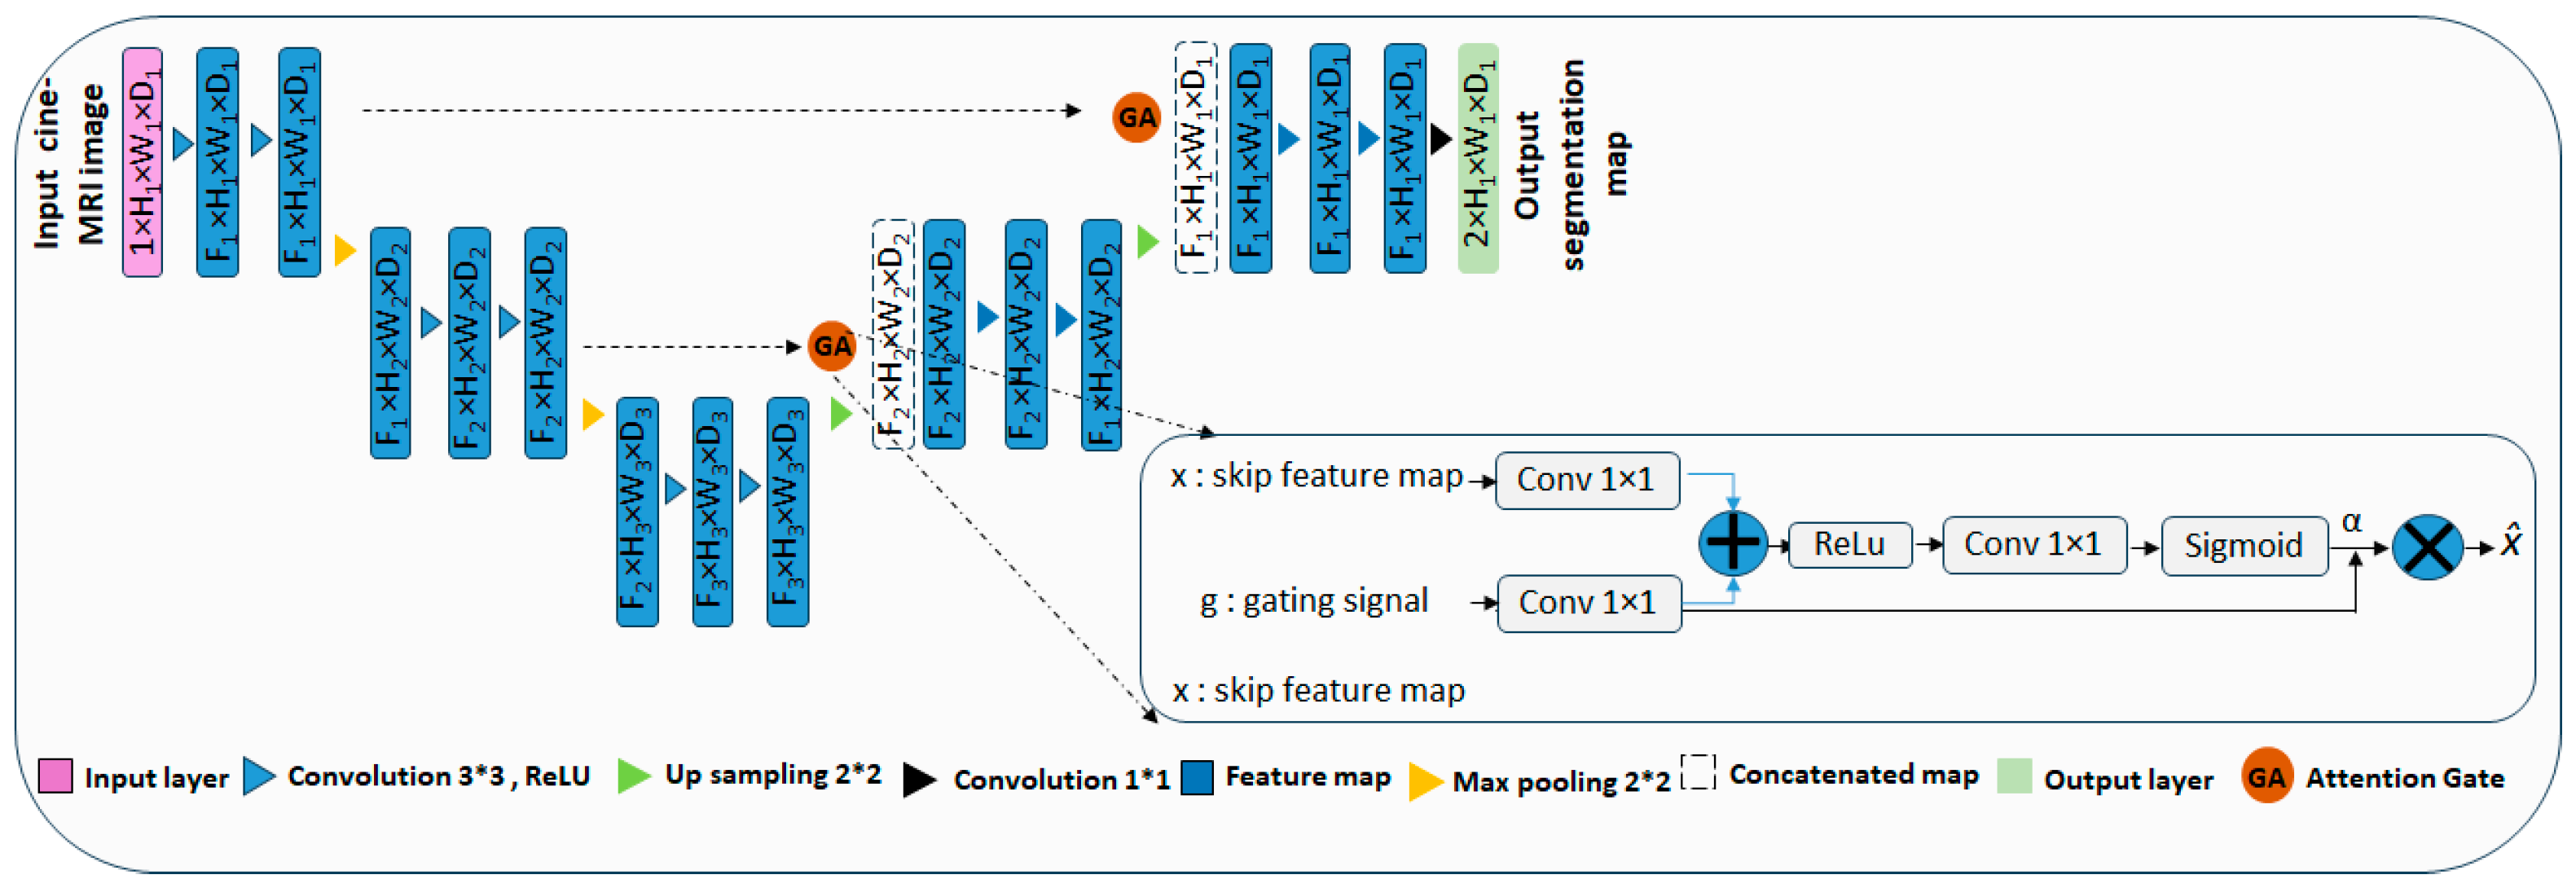
- An interpretable and computationally efficient pipeline incorporating a lightweight Attention U-Net for cine-MRI feature extraction and independent per-modality models to enhance transparency and reduce complexity.
- Superior performance over unimodal methods, offering robust and generalizable predictions that highlight the framework’s potential for early detection, risk stratification, and improved patient assessment.
2. Literature Review
3. Materials and Methods
3.1. Study Design
3.2. Study Population and Eligibility Criteria
3.2.1. Cine-MRI Imaging Cohort
3.2.2. Physionet ECG Database: Cohort Selection
3.2.3. Biomarker Data Sources
3.3. Datasets Preprocessing
3.3.1. Cine-MRI
3.3.2. ECG Dataset
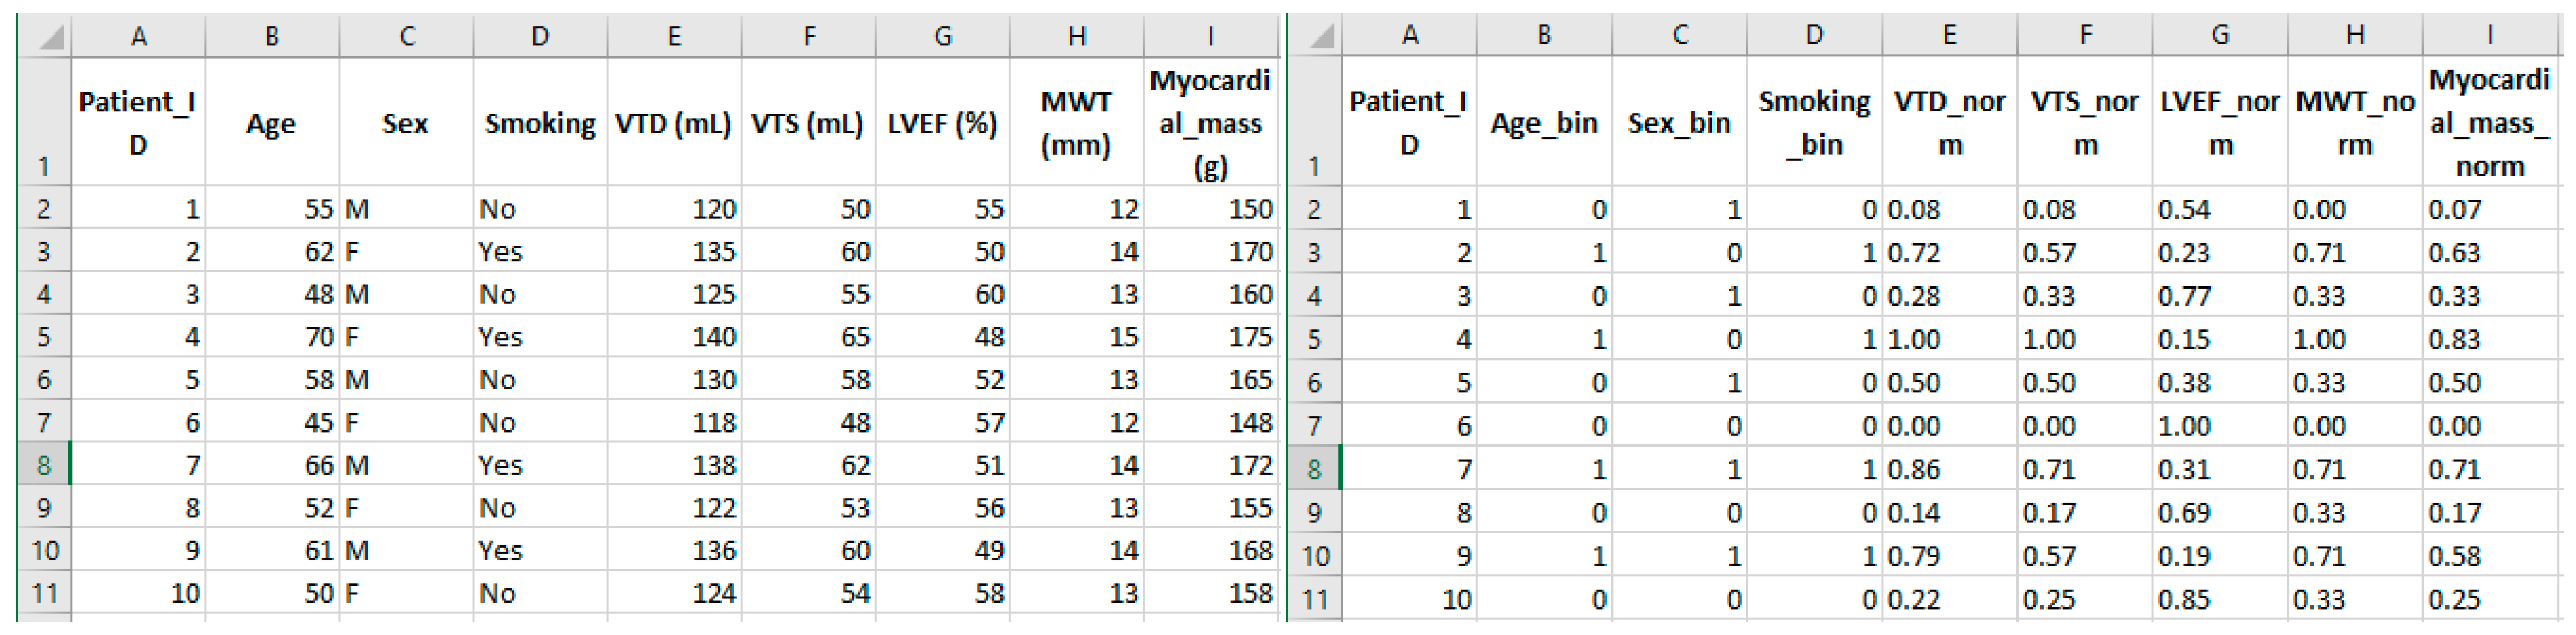
3.3.3. Biomarker Data Sources
3.4. Feature Extraction
3.4.1. Cine MRI Dataset
3.4.2. ECG Dataset
3.4.3. Biomarker Data Sources
3.5. Proposed Multimodal Late-Fusion Framework for Heart Failure Prediction
3.5.1. MRI-Based Branch
- a.
- Feature preparation
- b.
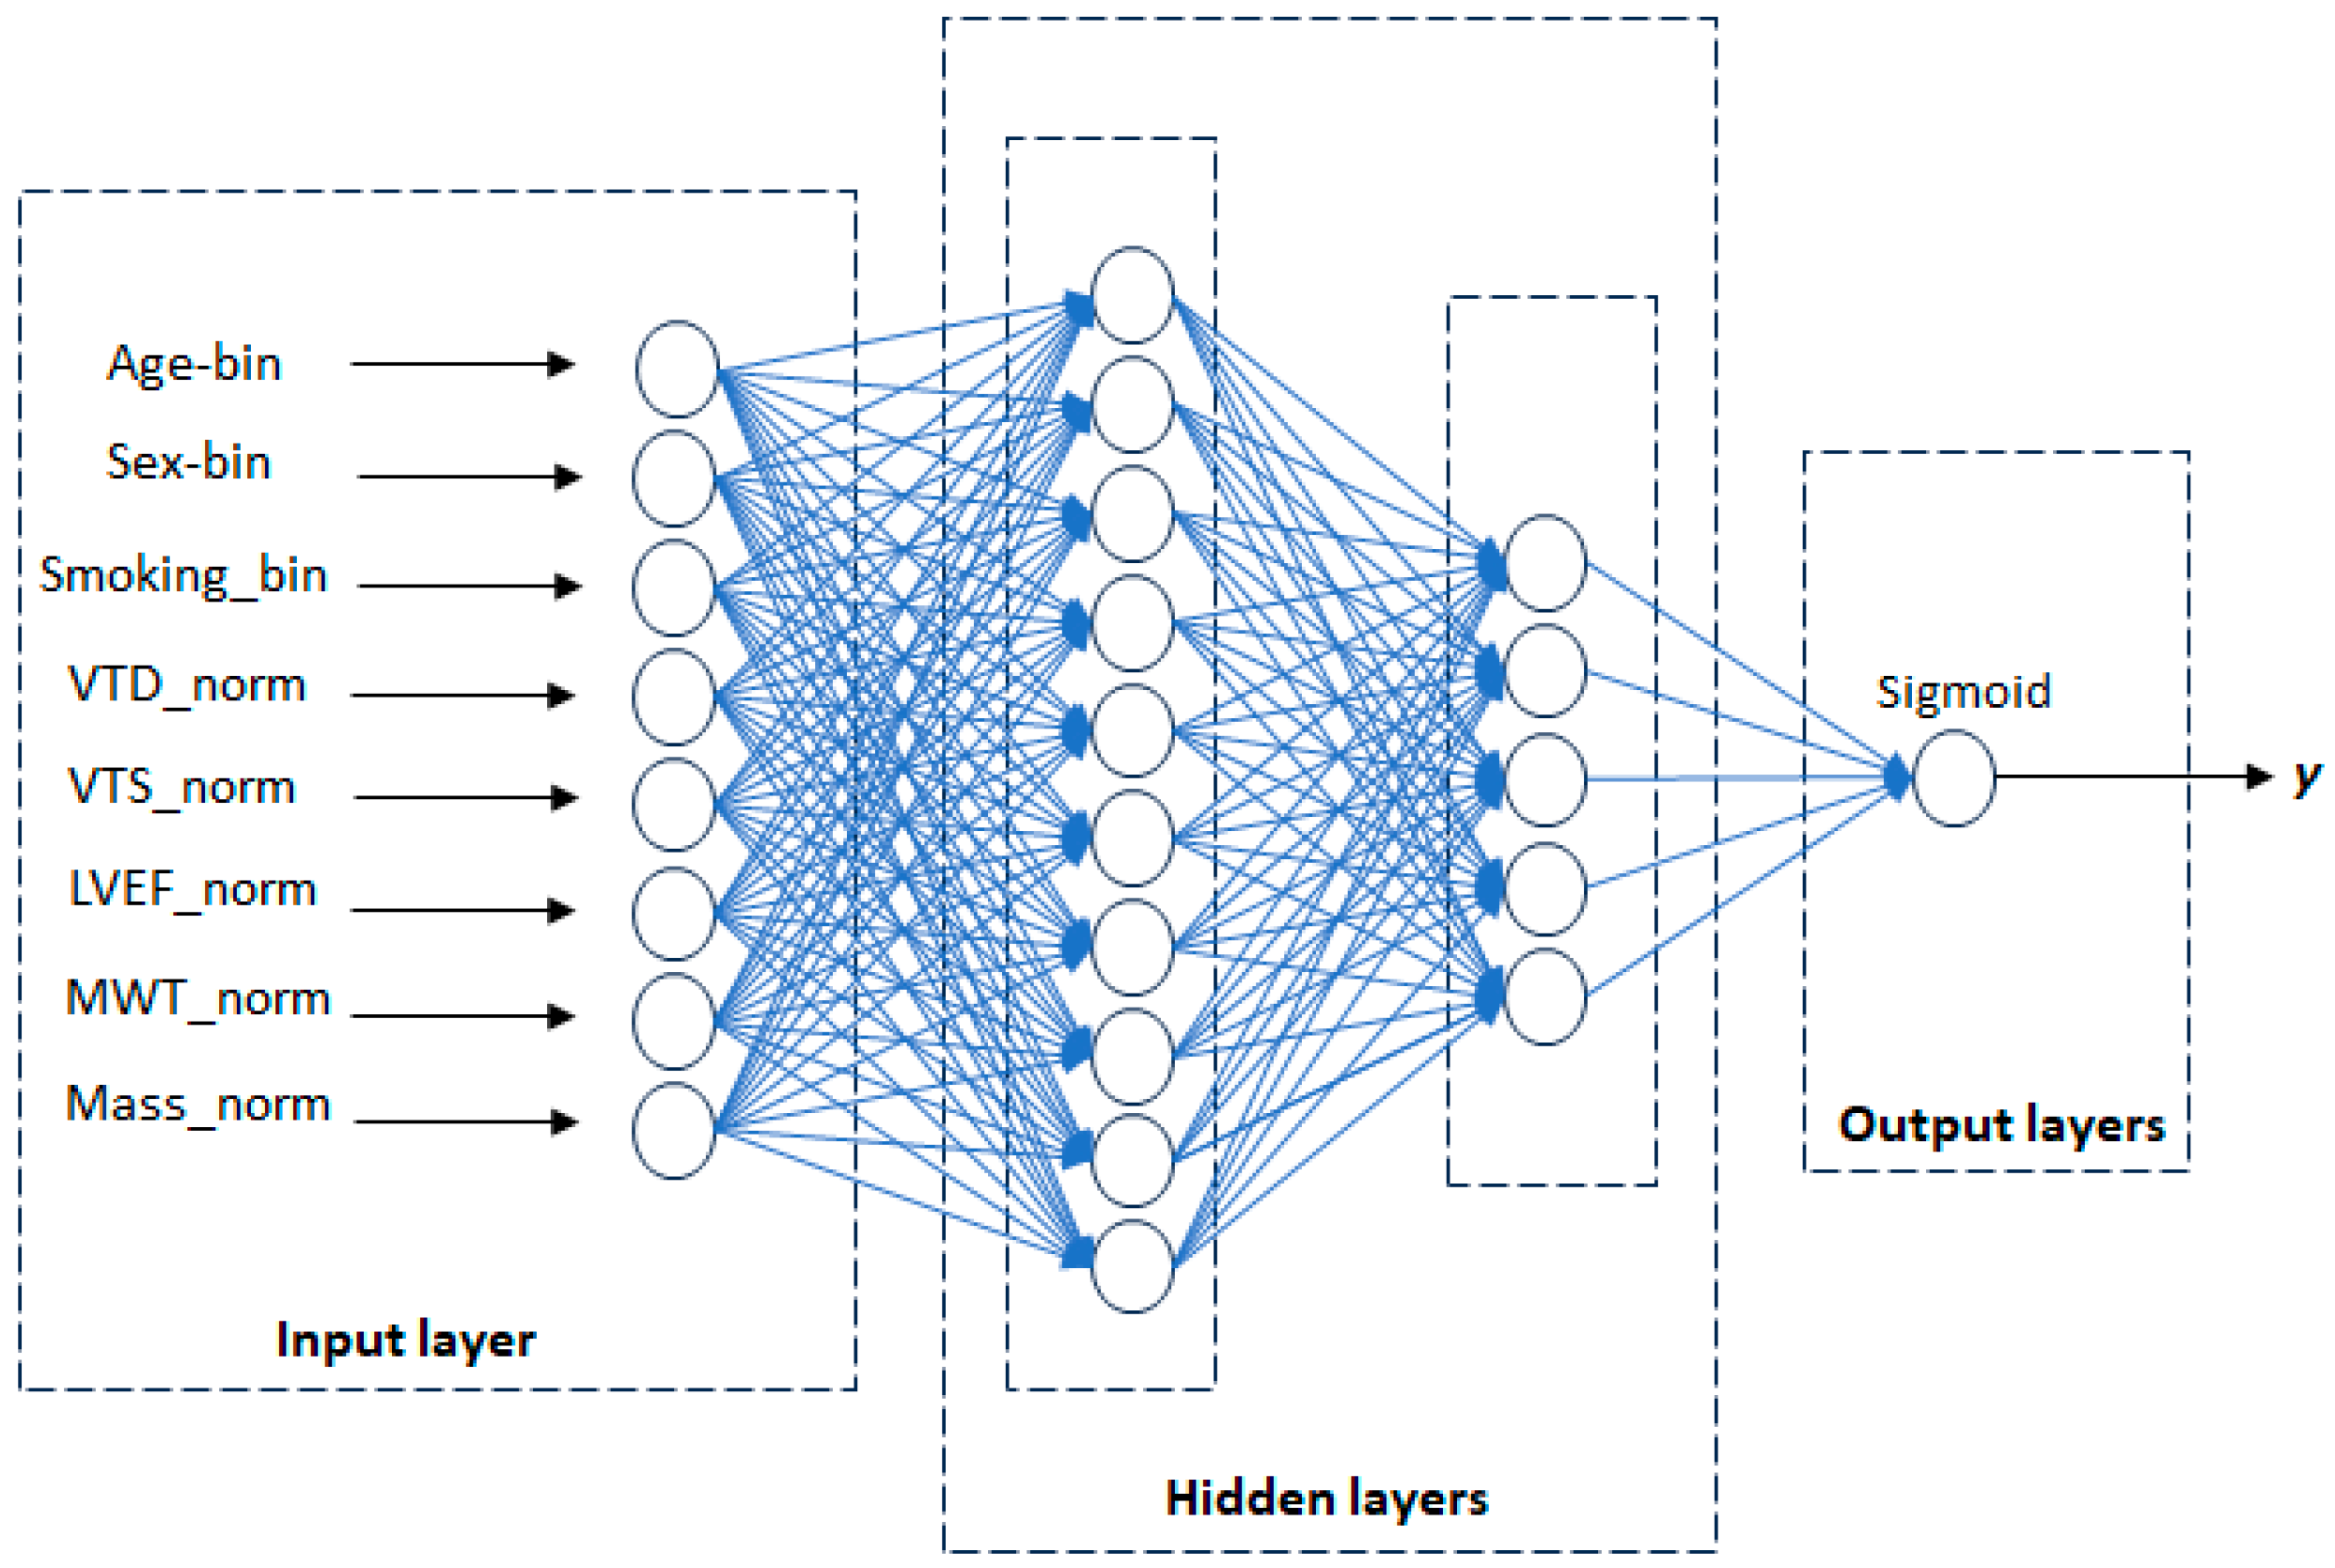
- MLP-Based Prediction Framework
3.5.2. ECG-Based Branch
- a.
- Feature preparation
- b.
- XGBoost-Based Prediction Framework for ECG Features
3.5.3. Biomarker-Based Branch
- a.
- Feature preparation
- b.
- XGBoost-Based Prediction Framework for Biomarker Features
3.5.4. Multimodal Late Fusion and Meta-Learning Strategy
- a.
- Preparation of Multimodal Features for Meta-learner
- b.
- Meta-learner selection
- XGBoost:
- LightGBM:
- Random Forest:
- c.
- Meta-Learner Training and Final Prediction
| Algorithm 1 Heart Failure Prediction Using Multimodal Data and Meta-learner |
#Inputs:
Step 1: Train individual modality models for each modality m ∈ {Cine-MRI, ECG, Biomarkers} do if m == Cine-MRI then Perform segmentation using U-Net Calculate × Extract features and train MLP classifier output probability p-MRI else If m == ECG then Extract temporal and frequency features Train XGBoost with objective function: output probability p_ECG else if m == Biomarkers then Train XGBoost similarly output probability p_Bio end if end for Step 2: Dataset preparation and splitting for meta-learner #Input: All patients P=PMRI ∪ PECG ∪ PBio for each patient i in P do if i ∈ PMRI then ← pMRI (i) end if if i ∈ PECG then ← pECG (i) end if if i ∈ PBio then ← pBio (i) end if Store target yi ← heart failure label of patient i end for # Shuffle P randomly Ptrain = first 80% of P Ptest = remaining 20% of P # Calculate training weights: NMRI = count of MRI patients in Ptrain NECG = count of ECG patients in Ptrain NBio = count of Bio patients in Ptrain Ntotal = ∣Ptrain∣ # Normalize weights so that the sum of weights for each modality is that the total sum of weights is the number of patients for each patient i ∈ Ptrain do wi = 0 if has MRI then wi + = Ntotal/(3×NMRI) end if if has ECG then wi+ = Ntotal/(3×NECG) end if if has Bio then wi + = Ntotal/(3×NBio) end if end for #Output (Xtrain,ytrain,wtrain) for Ptrain (Xtest,ytest) for Ptest Step 3: Meta-learner Training #Input: (Xtrain, ytrain, wtrain) # Initialize three metalearners: ML1 ← XGBoost ML2 ← LightGBM ML3 ← Random Forest for each meta-learner ML ∈ [ML1, ML2, ML3] do Train ML on (Xtrain, ytrain) (Xtrain, ytrain) with sample weights wptrain end for #Output: Three trained meta-learner models Step 4: Final Prediction Generation Inputs: Trained meta-learners: ML_XGBoost ML_LightGBM ML_RandomForest Test set: P_test with feature vectors X_test for each patient i ∈ P_test do Get prediction from XGBoost: p_xgb = ML_XGBoost.predict_proba(x_i) Get predictions from LightGBM: p_lgb = ML_LightGBM.predict_proba(x_i) Get predictions from Random Forest: p_rf = ML_RandomForest.predict_proba(x_i) Compute final ensemble prediction: p_final(i) = (p_xgb + p_lgb + p_rf)/3 end for #output Final ensemble prediction probabilities p_final Step 5: Performance evaluation Inputs True labels y_test for P_test Final predictions p_final for P_test Calculate AUC-ROC AUC = roc_auc_score(y_test, p_final) Calculate key metrics for comparison with state-of-the-art methods Accuracy = (TP + TN)/(TP + TN + FP + FN) Sensitivity =TP/(TP+FN) Precision = TP/(TP + FP) Recall = TP/(TP + FN) F1 = 2 × (Precision × Recall)/(Precision + Recall) outputs Primary metrics for state-of-the-art comparison: AUC, F1-score, Accuracy Clinical performance metrics: Precision, Recall, Specificity |
3.6. Performance Evaluation
4. Experimental Results
4.1. Left Ventricle Segmentation
4.2. Heart Failure Prediction from Cine-MRI Features
4.3. Heart Failure Prediction from ECG Features
4.4. Heart Failure Prediction from Biomarkers Features
4.5. Final Meta-Learner-Based Heart Failure Prediction
5. Discussion
6. Conclusions
Supplementary Materials
Author Contributions
Funding
Institutional Review Board Statement
Informed Consent Statement
Data Availability Statement
Acknowledgments
Conflicts of Interest
Abbreviations
| AI | Artificial Intelligence |
| AUC-ROC | Area Under the Receiver Operating Characteristic Curve |
| CNN | Convolutional Neural Network |
| DNN | Deep Neural Network |
| ECG | Electrocardiogram |
| EDV | End-Diastolic Volume |
| ESV | End-Systolic Volume |
| HF | Heart Failure |
| LV | Left Ventricle |
| LVEF | Left Ventricular Ejection Fraction |
| LVH | Left Ventricular Hypertrophy |
| MI | Myocardial Infarction |
| ML | Machine Learning |
| MLP | Multilayer Perceptron |
| MSE | Mean Squared Error |
| MWT | Myocardial Wall Thickness |
| RF | Random Forest |
| SVM | Support Vector Machine |
| XGBoost | Extreme Gradient Boosting |
References
- Chen, S.; Huang, Z.; Liang, Y.; Zhao, X.; Aobuliksimu, X.; Wang, B.; He, Y.; Kang, Y.; Huang, H.; Li, Q.; et al. Five-year mortality of heart failure with preserved, mildly reduced, and reduced ejection fraction in a 4880 Chinese cohort. ESC Heart Fail. 2022, 9, 2336–2347. [Google Scholar] [CrossRef] [PubMed]
- Khan, M.S.; Shahid, I.; Bennis, A.; Rakisheva, A.; Metra, M.; Butler, J. Global epidemiology of heart failure. Nat. Rev. Cardiol. 2024, 21, 717–734. [Google Scholar] [CrossRef] [PubMed]
- Savarese, G.; Moritz, P.; Becher, P.M.; Lund, L.H.; Seferovic, P.; Rosano, G.M.C.; Coats, A.J.S. Global burden of heart failure: A comprehensive and updated review of epidemiology. Cardiovasc. Res. 2022, 118, 3272–3287. [Google Scholar] [CrossRef] [PubMed]
- Medhi, D.; Kamidi, S.R.; Sree, K.P.M.; Shaikh, S.; Rasheed, S.; Murichathil, A.H.T.; Nazir, Z. Artificial intelligence and its role in diagnosing heart failure: A narrative review. Cureus 2024, 16, e59661. [Google Scholar] [CrossRef] [PubMed]
- Adnan, M.; Yi, Y.; Wang, E.; Imtiaz, M.N. StackTrans—Multimodal Heart Disease Detection Using Stacked Transformer Fusion Framework. IEEE Access 2025, 13, 99911–99922. [Google Scholar] [CrossRef]
- Sangha, V.; Nargesi, A.A.; Dhingra, L.S.; Khunte, A.; Mortazavi, B.J.; Ribeiro, A.H.; Banina, E.; Adeola, O.; Garg, N.; Brandt, C.A.; et al. Detection of left ventricular systolic dysfunction from electrocardiographic images. Circulation 2023, 148, 765–777. [Google Scholar] [CrossRef] [PubMed]
- Awadi, R.; Benameur, N.; Hafsi, H.; Younes, T.B.; Arous, Y.; Labidi, S.; Tavares, J.M.R. Myocardial Strain Assessment for Early Duchenne Muscular Dystrophy Diagnosis in Pediatric Patients Using Cardiac MRI. Appl. Sci. 2024, 14, 10341. [Google Scholar] [CrossRef]
- Singh, M.S.; Thongam, K.; Choudhary, P.; Bhagat, P.K. An integrated machine learning approach for congestive heart failure prediction. Diagnostics 2024, 14, 736. [Google Scholar] [CrossRef] [PubMed]
- Moshawrab, M.; Adda, M.; Bouzouane, A.; Ibrahim, H.; Raad, A. Cardiovascular events prediction using artificial intelligence models and heart rate variability. Procedia Comput. Sci. 2022, 203, 231–238. [Google Scholar] [CrossRef]
- Kottapalle, P.; Tak, T.K.; Kshirsagar, P.R.; Ginnela, G.; Akula, V.K. QHF-CS: Quantum-Enhanced Heart Failure Prediction Using Quantum CNN with Optimized Feature Qubit Selection with Cuckoo Search in Skewed Clinical Data. Comput. Mater. Contin. 2025, 84, 3857–3892. [Google Scholar] [CrossRef]
- Wang, J.; Xue, Q.; Zhang, C.W.J.; Wong, K.K.L.; Liu, Z. Explainable coronary artery disease prediction model based on AutoGluon from AutoML framework. Front. Cardiovasc. Med. 2024, 11, 1360548. [Google Scholar] [CrossRef] [PubMed]
- Gao, Y.; Jiang, Y.; Peng, Y.; Yuan, F.; Zhang, X.; Wang, J. Medical Image Segmentation: A Comprehensive Review of Deep Learning-Based Methods. Tomography 2025, 11, 52. [Google Scholar] [CrossRef] [PubMed]
- Kumar, D.; Balraj, K.; Seth, S.; Vashista, S.; Ramteke, M.; Rathore, A.S. An improved machine learning-based prediction framework for early detection of events in heart failure patients using mHealth. Health Technol. 2024, 14, 495–512. [Google Scholar] [CrossRef]
- Panchal, R.; Tiwari, S.; Agarwal, S. Multimodal image fusion on ECG signals for congestive heart failure classification. Multimed. Tools Appl. 2025, 84, 8247–8259. [Google Scholar] [CrossRef]
- Khan, S.; Khan, A.A.; Mahendran, R.K.; Fazil, M.; Rehman, A.U.; Jiang, W.; Farouk, A. C2DEEP-OT: Utilizing Multi-Agent Deep Reinforcement Learning Algorithm and Optimized Attentive Transformer Network for Cervical Cancer Detection. Inf. Sci. 2025, 738, 123047. [Google Scholar] [CrossRef]
- Chandraman, M.; Santhiyakumari, N.; Shree, K.V.M.; Murugesan, M.; Kumarganesh, S.; Rishabavarthani, P.; Sahani, S.K. Enhancing Cardiovascular Disease Analysis in Healthcare Systems with Hybrid Random Forest and Neural Network Algorithm. Eng. Rep. 2025, 7, e70373. [Google Scholar] [CrossRef]
- Lin, C.H.; Liu, Z.Y.; Chu, P.H.; Chen, J.S.; Wu, H.H.; Wen, M.S.; Kuo, C.F.; Chang, T.Y. A multitask deep learning model utilizing electrocardiograms for major cardiovascular adverse events prediction. npj Digit. Med. 2025, 8, 1. [Google Scholar] [CrossRef] [PubMed]
- Zhang, Z.; Li, D.; Zhao, J.; Ma, H.; Wang, F.; Hao, Q. Heart failure prognosis risk assessment model based on multimodal data fusion and IoT device monitoring. Alex. Eng. J. 2025, 127, 722–732. [Google Scholar] [CrossRef]
- Punn, N.S.; Dewangan, D.K. Ensemble Meta-Learning using SVM for Improving Cardiovascular Disease Risk Prediction. medRxiv 2024, 125, 1–15. [Google Scholar] [CrossRef]
- Wagner, P.; Strodthoff, N.; Bousseljot, R.D.; Kreiseler, D.; Lunze, F.I.; Samek, W.; Schaeffter, T. PTB-XL, a large publicly available electrocardiography dataset. Sci. Data 2020, 7, 1–15. [Google Scholar] [CrossRef]
- Ronneberger, O.; Fischer, P.; Brox, T. U-net: Convolutional networks for biomedical image segmentation. In Proceedings of the International Conference on Medical Image Computing and Computer-Assisted Intervention; Springer International Publishing: Cham, Switzerland, 2015; pp. 234–241. [Google Scholar] [CrossRef]
- Baccouch, W.; Oueslati, S.; Solaiman, B.; Lahidheb, D.; Labidi, S. Automatic left ventricle volume and mass quantification from 2D cine-MRI: Investigating papillary muscle influence. Med. Eng. Phys. 2024, 127, 104162. [Google Scholar] [CrossRef] [PubMed]
- Sinsomboonthong, S. Performance comparison of new adjusted min-max with decimal scaling and statistical column normalization methods for artificial neural network classification. Int. J. Math. Math. Sci. 2022, 2022, 3584406. [Google Scholar] [CrossRef]
- Paul, A.; Bandyopadhyay, R.; Yoon, J.H.; Geem, Z.W.; Sarkar, R. SinLU: Sinu-sigmoidal linear unit. Mathematics 2022, 10, 337. [Google Scholar] [CrossRef]
- Wiens, M.; Verone-Boyle, A.; Henscheid, N.; Podichetty, J.T.; Burton, J. A tutorial and use case example of the eXtreme gradient boosting (XGBoost) artificial intelligence algorithm for drug development applications. Clin. Transl. Sci. 2025, 18, e70172. [Google Scholar] [CrossRef] [PubMed]
- Chai, X.; Li, J.; Zhao, J.; Wang, W.; Zhao, X. LGB-PHY: An evaporation duct height prediction model based on physically constrained lightGBM algorithm. Remote Sens. 2022, 14, 3448. [Google Scholar] [CrossRef]
- Fatima, S.; Hussain, A.; Amir, S.B.; Ahmed, S.H.; Aslam, S.M.H. Xgboost and random forest algorithms: An in depth analysis. Pak. J. Sci. Res. 2023, 3, 26–31. [Google Scholar] [CrossRef]
- Liao, H.; Zhang, X.; Zhao, C.; Chen, Y.; Zeng, X.; Li, H. LightGBM: An efficient and accurate method for predicting pregnancy diseases. J. Obstet. Gynaecol. 2022, 42, 620–629. [Google Scholar] [CrossRef] [PubMed]
- Baccouch, W.; Hasnaoui, B.; Benameur, N.; Jemai, A.; Lahidheb, D.; Labidi, S. Deep Learning-Based Algorithm for the Classification of Left Ventricle Segments by Hypertrophy Severity. J. Imaging 2025, 11, 244. [Google Scholar] [CrossRef] [PubMed]
- Botros, J.; Mourad-Chehade, F.; Laplanche, D. Explainable multimodal data fusion framework for heart failure detection: Integrating CNN and XGBoost. Biomed. Signal Process. Control 2025, 100, 106997. [Google Scholar] [CrossRef]
- Liang, X.; Jiang, N.; Qi, P.; Chen, Z.; Tong, J.; Xia, S. ECGEL: A multimodal 12-lead ECG classification model for heart failure prediction. Biomed. Eng. Lett. 2025, 15, 537–547. [Google Scholar] [CrossRef] [PubMed]
- Liu, J.; Zhu, D.; Deng, L.; Chen, X. Predictive Modeling of Heart Failure Outcomes Using ECG Monitoring Indicators and Machine Learning. Ann. Noninvasive Electrocardiol. 2025, 30, e70097. [Google Scholar] [CrossRef] [PubMed]
- Ghazal, M.T. Multimodal fusion framework for enhanced diagnosis of heart failure using ECG, chest X-rays, blood biomarkers, and clinical text data. Iran J. Comput. Sci. 2026, 9, 42. [Google Scholar] [CrossRef]
- Teoh, J.R.; Hasikin, K.; Wong, H.D.; Ng, W.L.; Lee, K.W.; Kiew, L.V.; Lai, K.W. Multimodal late fusion for heart failure diagnosis using tabular and chest X-ray data: A comparative study of fusion strategies. Biomed. Signal Process. Control. 2026, 120, 110106. [Google Scholar] [CrossRef]
- Peng, J.; Beetz, M.; Banerjee, A.; Chen, M.; Grau, V. AEM: An interpretable multi-task multi-modal framework for cardiac disease prediction. Med. Image Anal. 2026, 109, 103951. [Google Scholar] [CrossRef] [PubMed]
- Chen, Y.; Liang, X.; Qi, P.; Xia, S.; Tong, J. Multimodal heart failure prediction model based on graph convolutional neural network. Biomed. Eng. Lett. 2026, 1–10. [Google Scholar] [CrossRef]





| Ref. | Year | Heart Disease | Database/Modality | Feature Count | AI-Model | Performance Measures | Challenges |
|---|---|---|---|---|---|---|---|
| [8] | 2024 | Heart Failure | 5888 participants/clinical, demographic features + lifestyle factors + laboratory results | 12 | LR, Random forest, SVM, naive Bayes decision tree, DNN | Acc = 95.30% F1-score = 97.03%, Sen = 96.49%, Pre = 97.58% | Reliance on a single dataset without external validation limits generalizability |
| [9] | 2024 | Heart failure | Three public datasets: UCI heart disease, Framingham, Faisalabad/ECG, angiography | 13 | a new guided attentive HF prediction approach | Acc = 98% | Single-center origin and absence of external validation may restrict generalizability; feature ranking remains complex |
| [11] | 2024 | Coronary artery disease | Five public datasets: Cleveland, Hungary, Switzerland, VA Long Beach and Statlog | 12 | AutoGluon model | AUC = 95.62 Acc = 91.67 | Group imbalance, no propensity matching, unclear case timing, and missing confounder data limit model validity. |
| [13] | 2024 | Heart failure | 128 patients/biological, ECG demographic | 33 | Gaussian Naive Bayes, SVM, MLPC | Pre = 98% Re = 91% F1-score = 0.94% | Dependence on extensive hyperparameter tuning |
| [19] | 2024 | Cardiovascular disease | 70,000 samples/ECG, imaging, demographic features, clinical features | 11 | Meta-learning using SVM | Acc = 90% Auc-ROC = 94% Pre = 87% Re = 88%, F1-score = 87% | Careful feature engineering, guided by domain knowledge, is crucial for maximizing performance. |
| [10] | 2025 | Heart failure | 299 medical records, Cleveland, Hungarian, Switzerland, Long Beach, VA, and Statlog databases | 13 | Enhanced Quantum CNN | Acc = 94% pre = 94% Re = 95% F1-score = 94% | Absence of real-time predictive capability and lack of validation on actual quantum hardware. |
| [14] | 2025 | Heart failure | 5000 ECG recordings/Multimodal Feature Fusion | - | Convolutional Neural Networks (CNNs) and Gated Recurrent Units (GRUs) | Acc = 97.79% for MIF and 98.19% for MFF | Dependence on high-quality ECG signal preprocessing and the absence of external validation limit generalizability |
| [17] | 2025 | Cardiac disease | 2,821,889 standard 12-lead ECGs | 12 | Deep neural network | AUROCs of 0.90 for heart failure (HF) | High dimensionality of raw ECG data increases computational complexity and may hinder model interpretability |
| [18] | 2025 | Heart failure | EMR dataset/Chest X-ray image dataset | - | CNN + graph neural networks | Acc = 97.2% ROC (AUC) = 97.2%, | High complexity and limited external validation |
| Feature | Description | Typical Values | Clinical Relevance for HF Prediction |
|---|---|---|---|
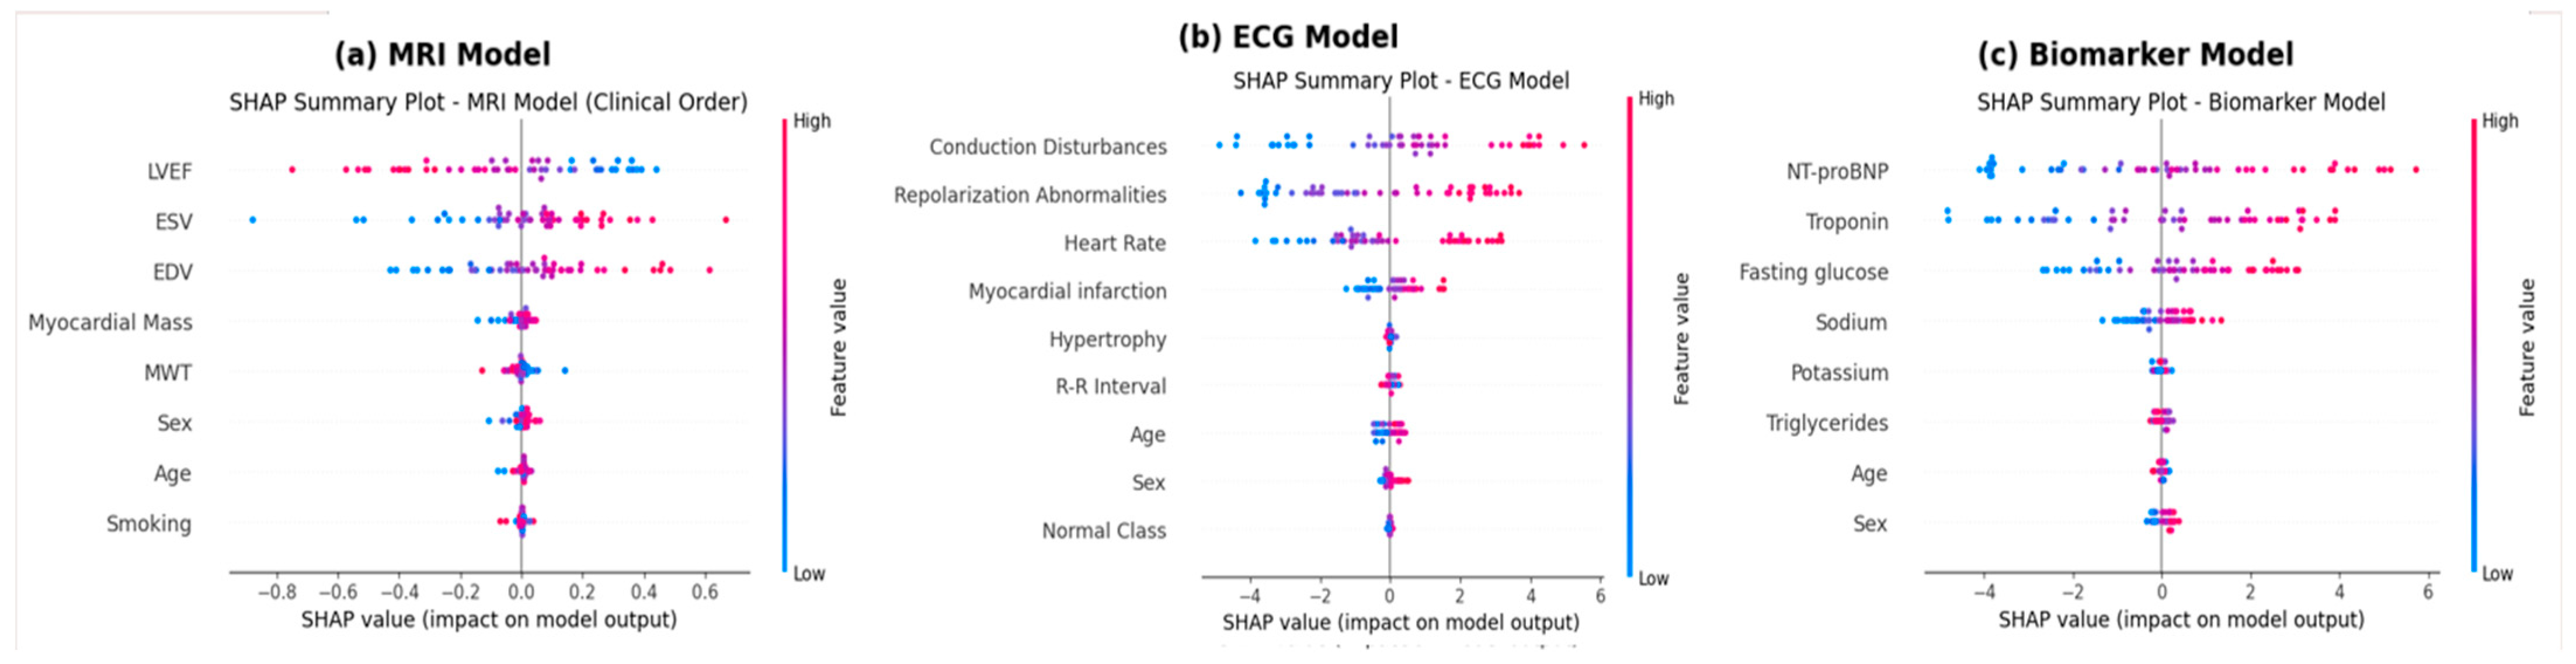
| LVEF | Percentage of left ventricular blood volume ejected during systole (%) | 55–70% | Reduced LVEF is a direct marker of systolic HF |
| EDV | Left ventricular volume measured at the end of diastole (mL) | 120–210 mL | Elevated EDV indicates ventricular dilatation, common in HF with reduced EF |
| ESV | Left ventricular volume measured at the end of systole (mL) | 50–80 mL | Elevated ESV reflects impaired contraction, predicting systolic dysfunction |
| MWT | Average thickness of LV myocardium (mm) | 6–15 mm | Increased thickness suggests hypertrophy; decreased thickness may indicate remodeling or atrophy |
| Myocardial mass | Total mass of LV myocardium (g) | 100–200 g | Elevated mass reflects hypertrophy and structural remodeling linked to HF |
| Features | Description | Typical Values | Clinical Relevance |
|---|---|---|---|
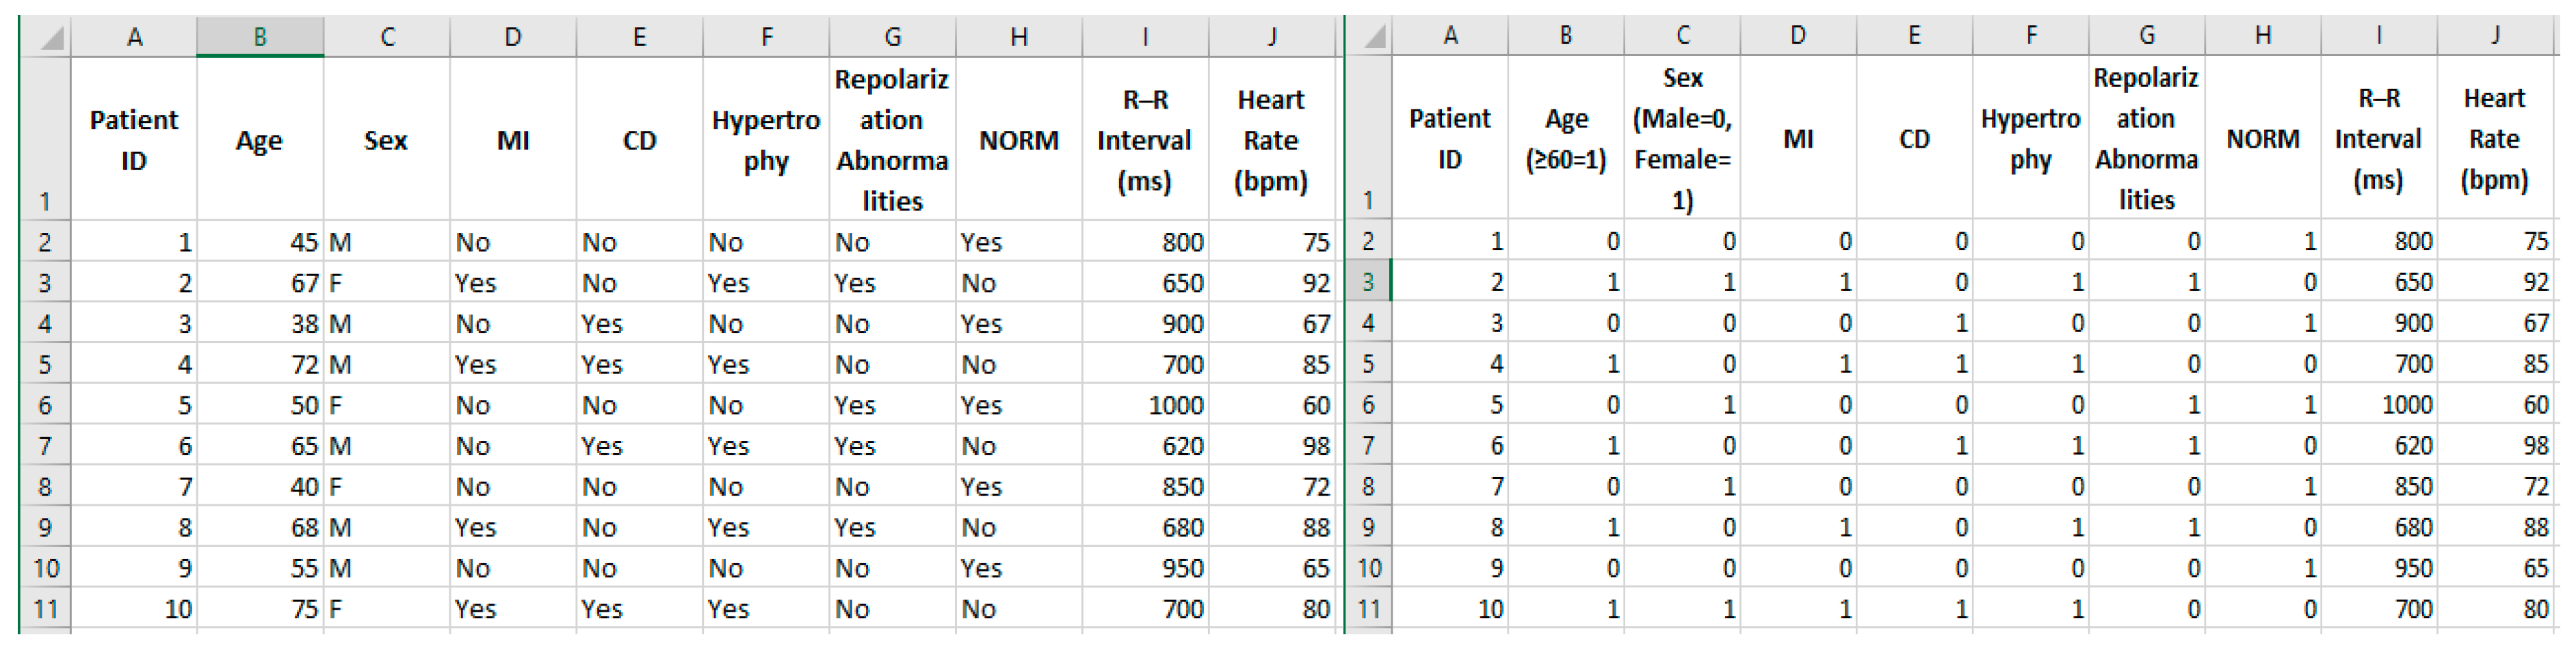
| Myocardial infarction (MI) | Presence of prior myocardial infarction, based on ECG annotation | Binary (Yes = 1, No = 0) | Previous MI leads to myocardial damage and is a major risk factor for heart failure |
| Conduction Disturbances (CDs) | Abnormalities in impulse conduction such as bundle branch block or atrioventricular block | Binary (Yes = 1, No = 0) | Conduction abnormalities impair ventricular synchronization and contribute to reduced cardiac function. |
| Hypertrophy | Evidence of ventricular hypertrophy from ECG patterns | Binary (Yes = 1, No = 0) | Hypertrophy increases myocardial workload and predisposes to heart failure. |
| Repolarization Abnormalities | Alterations in ST segment or T-wave | Binary (Yes = 1, No = 0) | ST-segment deviations and T-wave abnormalities indicate ventricular electrical instability, reflecting underlying ischemia or ventricular stress. |
| Normal Class (NORM) | Absence of pathological findings in the ECG | Binary (Yes = 1, No = 0) | Serves as a control reference for distinguishing healthy from pathological signals. |
| R–R Interval | Serves as a control reference for distinguishing healthy from pathological signals. | ~600–1200 ms (normal sinus rhythm: 50–100 bpm) | Reflects heart rate variability; deviations may indicate arrhythmias or autonomic imbalance in heart failure. |
| Heart Rate | Number of heart beats per minute derived from R–R intervals | ~50–100 bpm | Provides a direct measure of cardiac function; tachycardia or bradycardia can signal HF risk. |
| Feature | Description | Typical Values or Norms | Clinical Relevance |
|---|---|---|---|
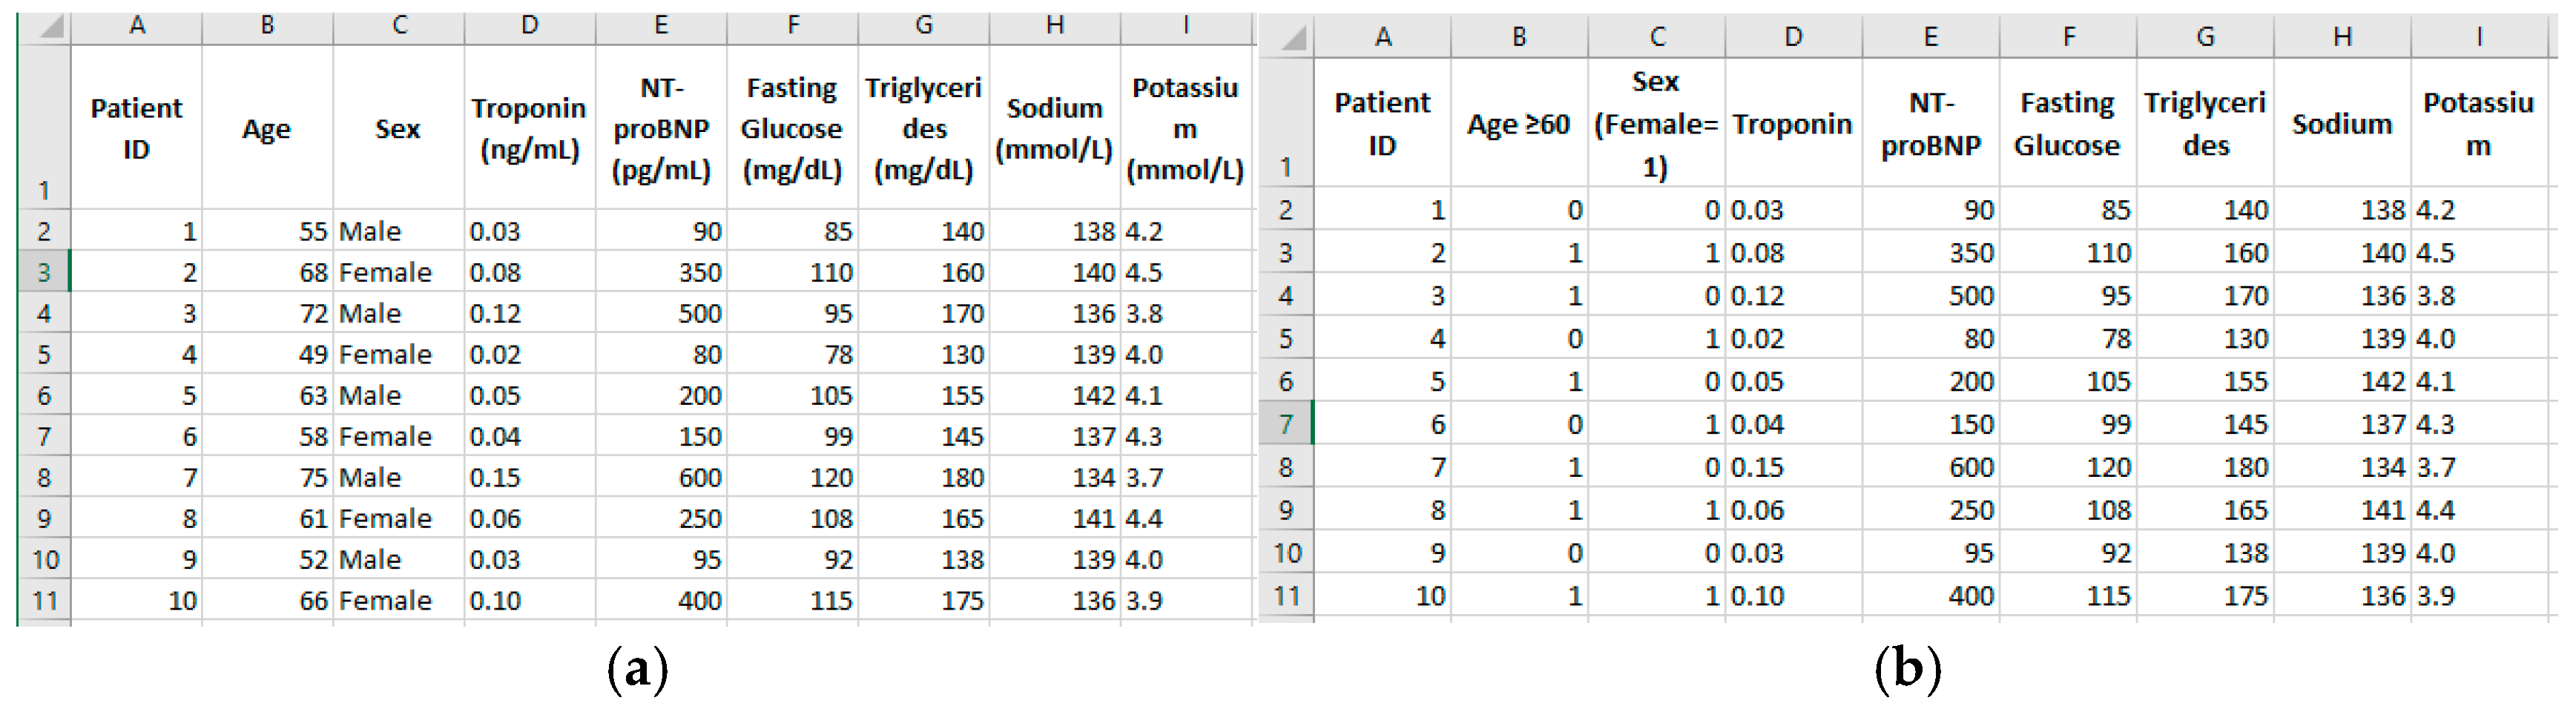
| Troponin | Cardiac-specific biomarker indicating myocardial injury | <0.04 ng/mL | Marker of ongoing myocardial damage |
| NT-proBNP | Biomarker of ventricular wall stress and overload | <125 pg/mL | Indicator of heart failure severity |
| Fasting glucose | Blood glucose after overnight fast | 70–100 mg/dL | Metabolic risk factor |
| Triglycerides | Blood lipid measurement | <150 mg/dL | Dyslipidemia, cardiovascular risk |
| Sodium | Serum sodium concentration | 135–145 mmol/L | Electrolyte balance |
| Potassium | Serum potassium concentration | 3.5–5.0 mmol/L | Electrolyte and cardiac electrophysiology |
| Parameters | Epochs | Batch Size = 4 | Batch Size = 8 | |||
|---|---|---|---|---|---|---|
| Adam | Adamax | Adam | Adamax | |||
| Learning Rate | 10−2 | 20 | 65.22 | 67.64 | 66.18 | 68.06 |
| 40 | 71.06 | 72.11 | 71.05 | 73.55 | ||
| 60 | 73.45 | 75.81 | 74.44 | 76.37 | ||
| 80 | 75.34 | 77.13 | 76.67 | 78.64 | ||
| 10−3 | 20 | 78.15 | 81.12 | 79.23 | 82.54 | |
| 40 | 84.41 | 86.32 | 85.35 | 88.31 | ||
| 60 | 88.36 | 91.10 | 89.78 | 93.67 | ||
| 80 | 91.33 | 94.08 | 92.93 | 97.25 | ||
| 10−4 | 20 | 70.73 | 71.54 | 72.11 | 73.43 | |
| 40 | 73.66 | 76.26 | 77.56 | 78.27 | ||
| 60 | 79.09 | 80.72 | 81.90 | 82.28 | ||
| 80 | 82.51 | 84.67 | 85.65 | 86.56 | ||
| Patient/Section | Mean HD (mm) | Mean DSC (%) | |||
|---|---|---|---|---|---|
| Endo | Epi | Endo | Epi | ||
| Healthy patient | Basal section | 7.342 ± 2.4 | 6.421 ± 2.4 | 95.26 ± 3.1 | 98.76 ± 3.1 |
| Mid-section | 6.832 ± 1.3 | 5.212 ± 3.1 | 96.41 ± 3.5 | 97.35 ± 2.0 | |
| Apical section | 7.154 ± 3.2 | 7.667 ± 0.3 | 94.17 ± 1.7 | 95.42 ± 4.2 | |
| Patient with heart failure | Basal section | 8.174 ± 1.5 | 5.256 ± 1.7 | 95.24 ± 2.3 | 96.56 ± 3.4 |
| Mid-section | 6.321 ± 1.1 | 6.778 ± 1.2 | 97.24 ± 1.1 | 98.01 ± 2.2 | |
| Apical section | 8.012 ± 0.2 | 7.022 ± 2.6 | 95.83 ± 2.3 | 96.17 ± 4.5 | |
| Depth | LR | Epochs | Batch Size = 8 | Batch Size = 16 | ||||
|---|---|---|---|---|---|---|---|---|
| Adam | Adamax | Rmsprop | Adam | Adamax | Rmsprop | |||
| 2 hidden layers | 10−3 | 70 | 0.084 | 0.080 | 0.089 | 0.092 | 0.088 | 0.094 |
| 80 | 0.080 | 0.076 | 0.085 | 0.090 | 0.086 | 0.091 | ||
| 90 | 0.078 | 0.074 | 0.083 | 0.091 | 0.087 | 0.092 | ||
| 100 | 0.076 | 0.072 | 0.081 | 0.093 | 0.089 | 0.094 | ||
| 120 | 0.077 | 0.073 | 0.082 | 0.095 | 0.091 | 0.096 | ||
| 10−2 | 70 | 0.072 | 0.068 | 0.079 | 0.088 | 0.084 | 0.090 | |
| 80 | 0.068 | 0.064 | 0.076 | 0.087 | 0.083 | 0.089 | ||
| 90 | 0.065 | 0.061 | 0.073 | 0.088 | 0.084 | 0.091 | ||
| 100 | 0.063 | 0.059 | 0.071 | 0.090 | 0.086 | 0.092 | ||
| 120 | 0.064 | 0.060 | 0.072 | 0.091 | 0.088 | 0.094 | ||
| 10−1 | 70 | 0.085 | 0.081 | 0.090 | 0.094 | 0.090 | 0.096 | |
| 80 | 0.083 | 0.079 | 0.088 | 0.095 | 0.091 | 0.097 | ||
| 90 | 0.081 | 0.077 | 0.086 | 0.096 | 0.093 | 0.099 | ||
| 100 | 0.079 | 0.075 | 0.084 | 0.099 | 0.095 | 0.101 | ||
| 120 | 0.080 | 0.076 | 0.085 | 0.101 | 0.097 | 0.103 | ||
| 3 hidden layers | 10−3 | 70 | 0.088 | 0.084 | 0.093 | 0.095 | 0.091 | 0.096 |
| 80 | 0.086 | 0.082 | 0.091 | 0.097 | 0.093 | 0.099 | ||
| 90 | 0.084 | 0.080 | 0.089 | 0.100 | 0.095 | 0.100 | ||
| 100 | 0.083 | 0.079 | 0.088 | 0.101 | 0.097 | 0.103 | ||
| 120 | 0.084 | 0.080 | 0.089 | 0.113 | 0.099 | 0.105 | ||
| 10−2 | 70 | 0.080 | 0.076 | 0.085 | 0.092 | 0.088 | 0.094 | |
| 80 | 0.078 | 0.074 | 0.083 | 0.093 | 0.090 | 0.097 | ||
| 90 | 0.076 | 0.072 | 0.081 | 0.096 | 0.092 | 0.098 | ||
| 100 | 0.075 | 0.071 | 0.080 | 0.097 | 0.094 | 0.100 | ||
| 120 | 0.076 | 0.072 | 0.081 | 0.110 | 0.096 | 0.102 | ||
| 10−1 | 70 | 0.090 | 0.086 | 0.095 | 0.097 | 0.093 | 0.099 | |
| 80 | 0.088 | 0.084 | 0.093 | 0.099 | 0.095 | 0.101 | ||
| 90 | 0.087 | 0.083 | 0.091 | 0.111 | 0.097 | 0.123 | ||
| 100 | 0.086 | 0.082 | 0.090 | 0.103 | 0.099 | 0.106 | ||
| 120 | 0.087 | 0.083 | 0.091 | 0.105 | 0.101 | 0.107 | ||
| Patients | Probabilities of Heart Failure Risk | |
|---|---|---|
| Before Calibration | After Calibration | |
| Patient 1 | 0.72 | 0.68 |
| Patient 2 | 0.54 | 0.51 |
| Patient 3 | 0.36 | 0.40 |
| Patient 4 | 0.83 | 0.79 |
| Parameter | Tested Values | Optimal Selected Value | Justification |
|---|---|---|---|
| n_estimators | 50, 100, 150 | 100 | Balanced trade-off between performance and computational cost, reduces overfitting risk |
| max-depth | 3, 4, 5 | 4 | Moderate depth captures feature interactions without overfitting |
| learning rate | 0.01, 0.1, 0.2 | 0.1 | Provides a good balance between convergence speed and stability |
| Subsample | 0.6, 0.8, 1.0 | 0.8 | Ensures robustness while retaining most of the training samples |
| colsample_bytree | 0.6, 0.8, 1.0 | 0.8 | Maintains feature diversity per tree without losing important information |
| reg_alpha | 0, 0.1, 1.0 | 0.1 | Light L1 regularization to reduce overfitting risk |
| reg_lambda | 1, 1.5, 2.0 | 1.5 | Moderate L2 regularization improves model stability |
| min_child_weight | 1, 3, 5 | 1 | Allows the model to be sensitive to small but relevant signal variations |
| gamma | 0, 0.1, 2.0 | 0.1 | Adds light regularization to prevent overly specific splits |
| scale_pos_weight | 1, 1.5, 2.0 | 1 | No major class imbalance observed, hence no additional weighting needed |
| Parameter | Tested Values | Optimal Selected Value | Justification |
|---|---|---|---|
| n_estimators | 50, 80, 100 | 80 | Balanced number of trees to capture variability without overfitting given the smaller dataset. |
| max-depth | 2, 3, 4 | 3 | Shallow trees prevent overfitting and ensure stable learning on limited biomarker data |
| learning rate | 0.01, 0.05, 0.1 | 0.05 | A moderately small learning rate stabilizes convergence while retaining efficiency. |
| Subsample | 0.6, 0.8, 1.0 | 1.0 | All samples are used since the cohort size (157 patients) is relatively small. |
| colsample_bytree | 0.6, 0.8, 1.0 | 1.0 | All features are included per tree, reflecting their strong and independent clinical significance. |
| reg_alpha | 0, 0.1, 1.0 | 0.1 | Mild L1 regularization improves generalization without discarding important biomarkers. |
| reg_lambda | 1.0, 1.5, 2.0 | 2.0 | Stronger L2 regularization reduces variance and enhances stability. |
| min_child_weight | 1, 3, 5 | 1 | Allows the model to split on fewer samples, capturing fine-grained patterns in biomarker variation. |
| gamma | 0, 0.1, 0.2 | 0.1 | Prevents overly complex splits while still allowing useful partitioning. |
| scale_pos_weight | 0.5, 0.67, 1.0 | 0.67 | Adjusted to compensate for class imbalance between HF and healthy groups |
| Parameter | XGBoost | Random Forest | LightGBM | |||
|---|---|---|---|---|---|---|
| Tested Values | Selected Value | Tested Values | Selected Value | Tested Values | Selected Value | |
| n_estimators | 50, 100, 150 | 100 | 50, 100, 200 | 100 | 50, 100, 200 | 100 |
| max_depth | 3, 4, 5 | 4 | 3, 5, 7 | 5 | 3, 4, 6 | 4 |
| learning_rate | 0.01, 0.1, 0.2 | 0.1 | - | - | 0.01, 0.05, 0.1 | 0.05 |
| Subsample/bagging fraction | 0.6, 0.8, 1.0 | 0.8 | - | - | 0.6, 0.8, 1.0 | 0.8 |
| colsample/feature_fraction | 0.6, 0.8, 1.0 | 0.8 | 0.6, 0.8, 1.0 | 0.8 | 0.6, 0.8, 1.0 | 0.8 |
| reg_alpha | 0, 0.1, 1.0 | 0.1 | - | - | 0, 0.1, 1.0 | 0.1 |
| reg_lambda | 1, 1.5, 2.0 | 1.5 | - | - | 1, 1.5, 2.0 | 1.0 |
| min_child_weight | 1, 3, 5 | 1 | - | - | 1, 2, 4 | 2 |
| min_samples_split | - | - | 2, 4, 6 | 2 | - | - |
| Metric | XGBoost | LightGBM | Random Forest | Final Ensemble (Meta-Learning) |
|---|---|---|---|---|
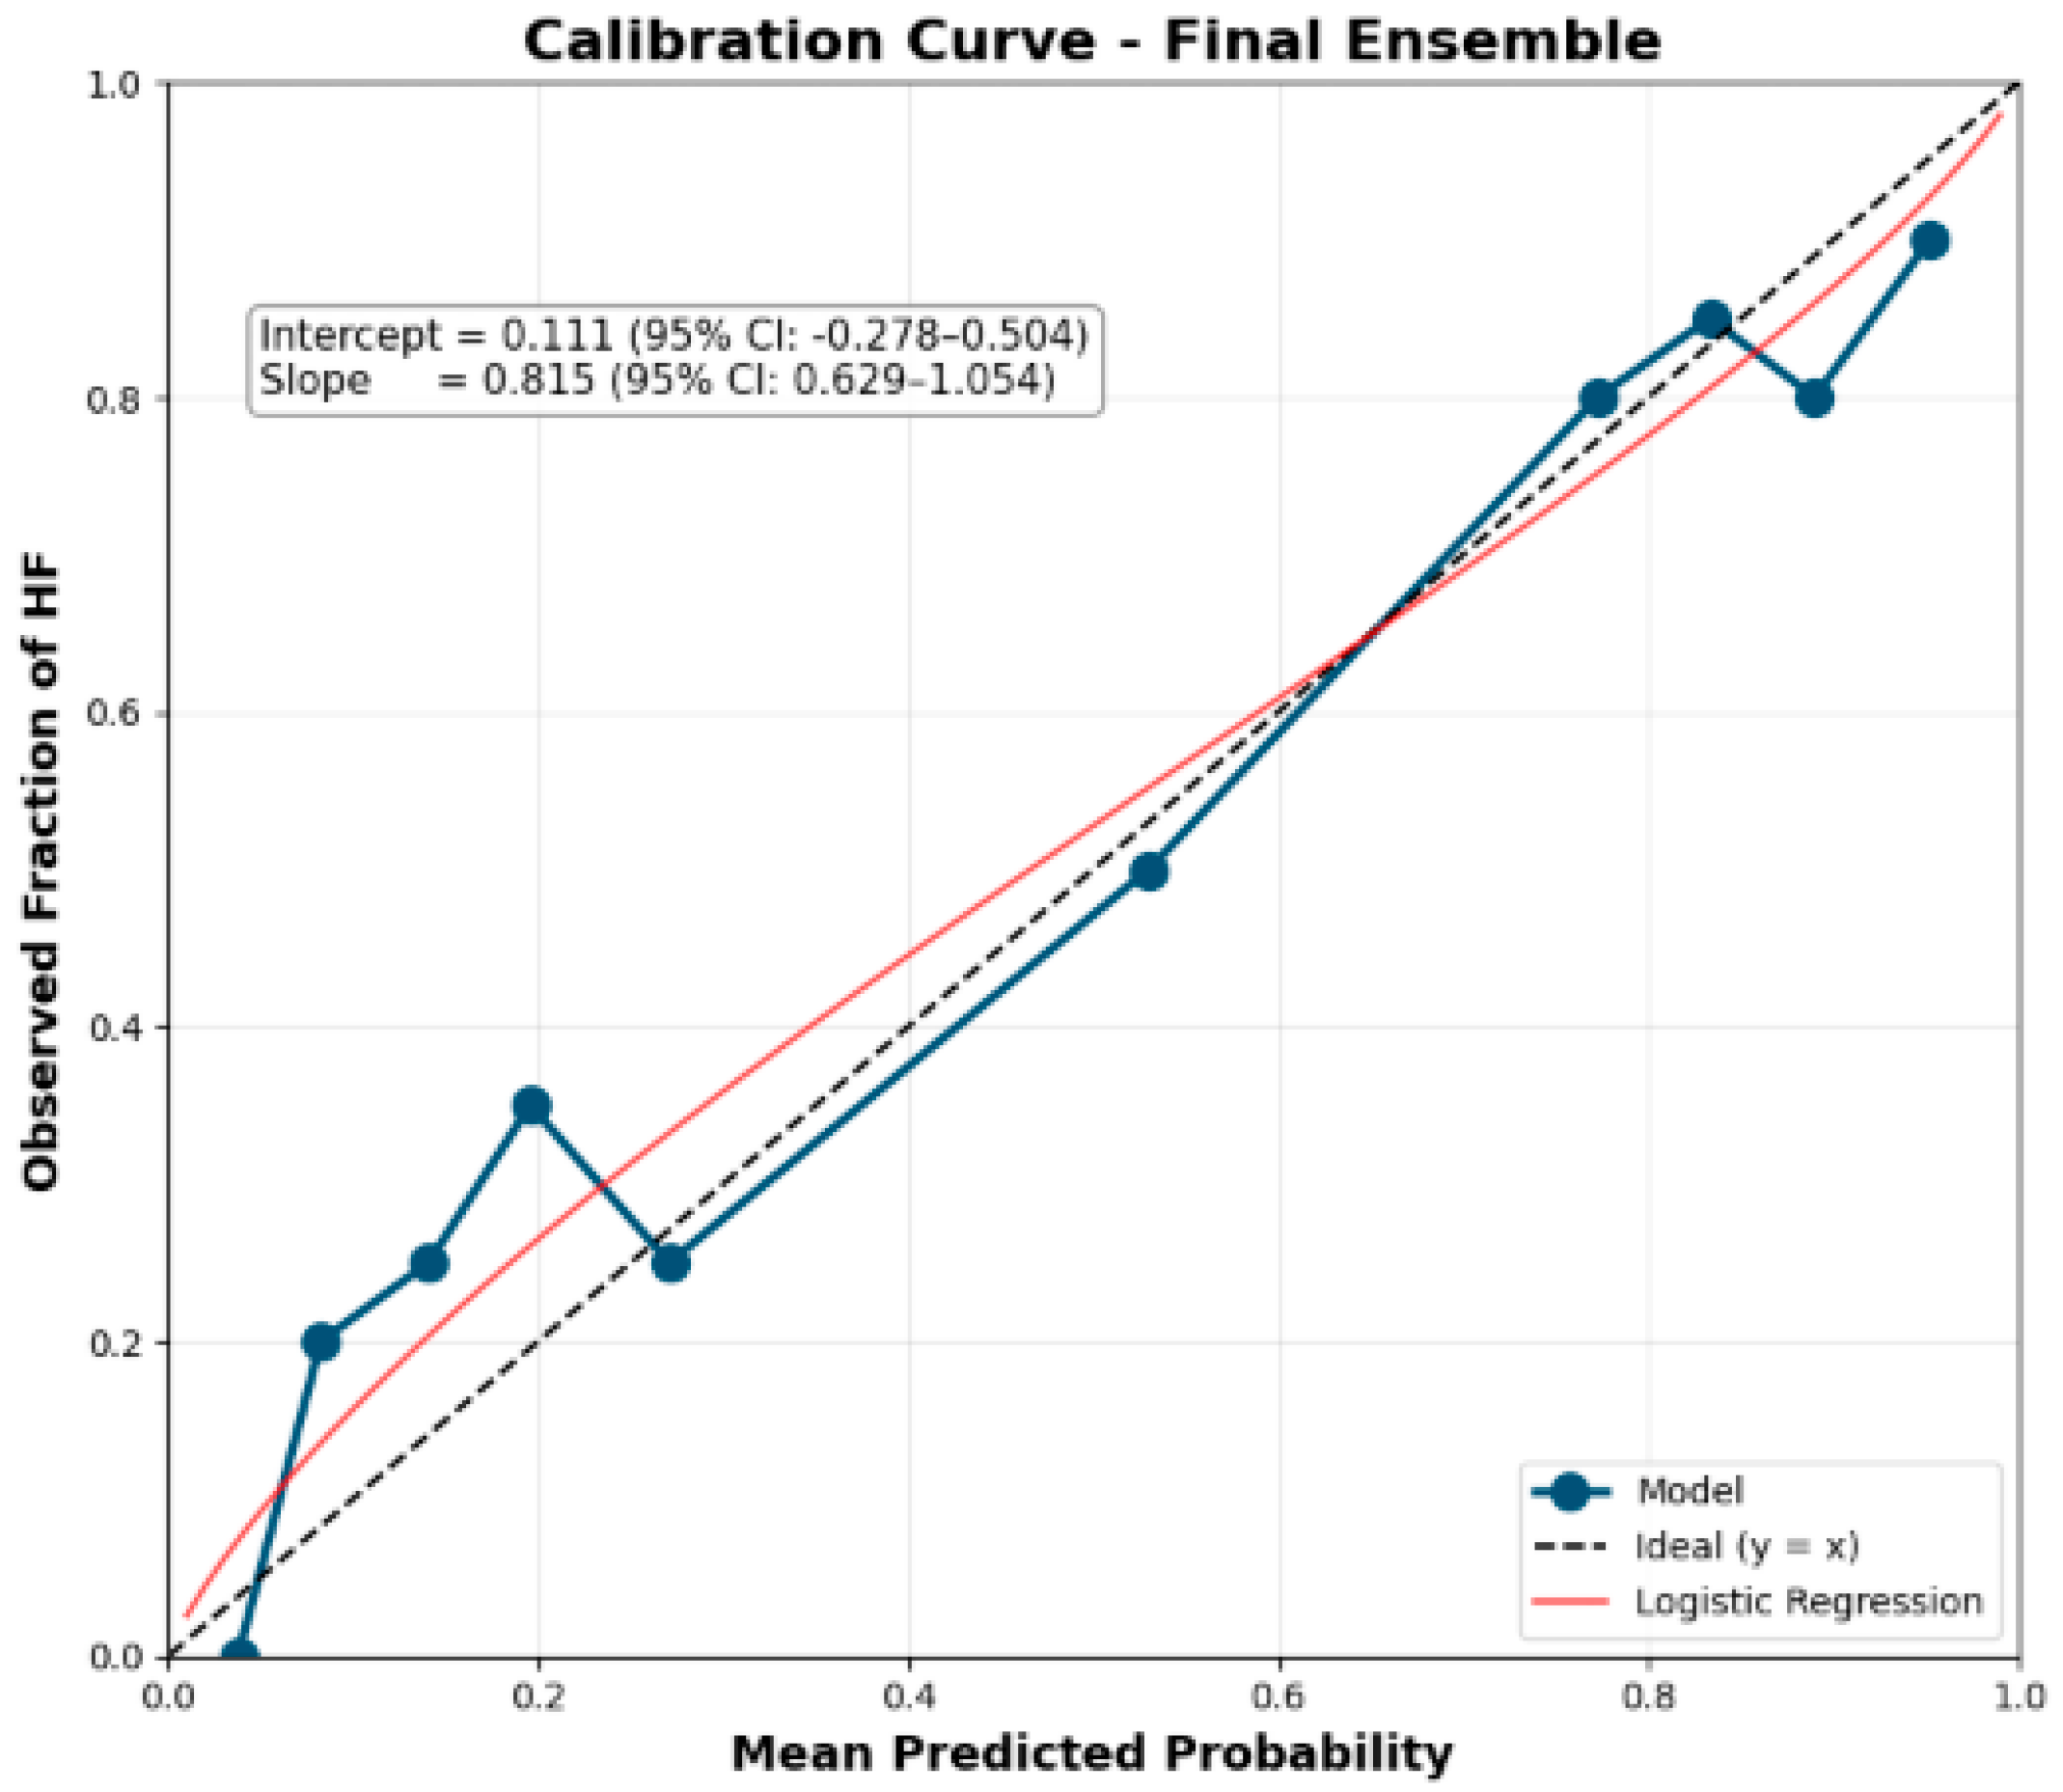
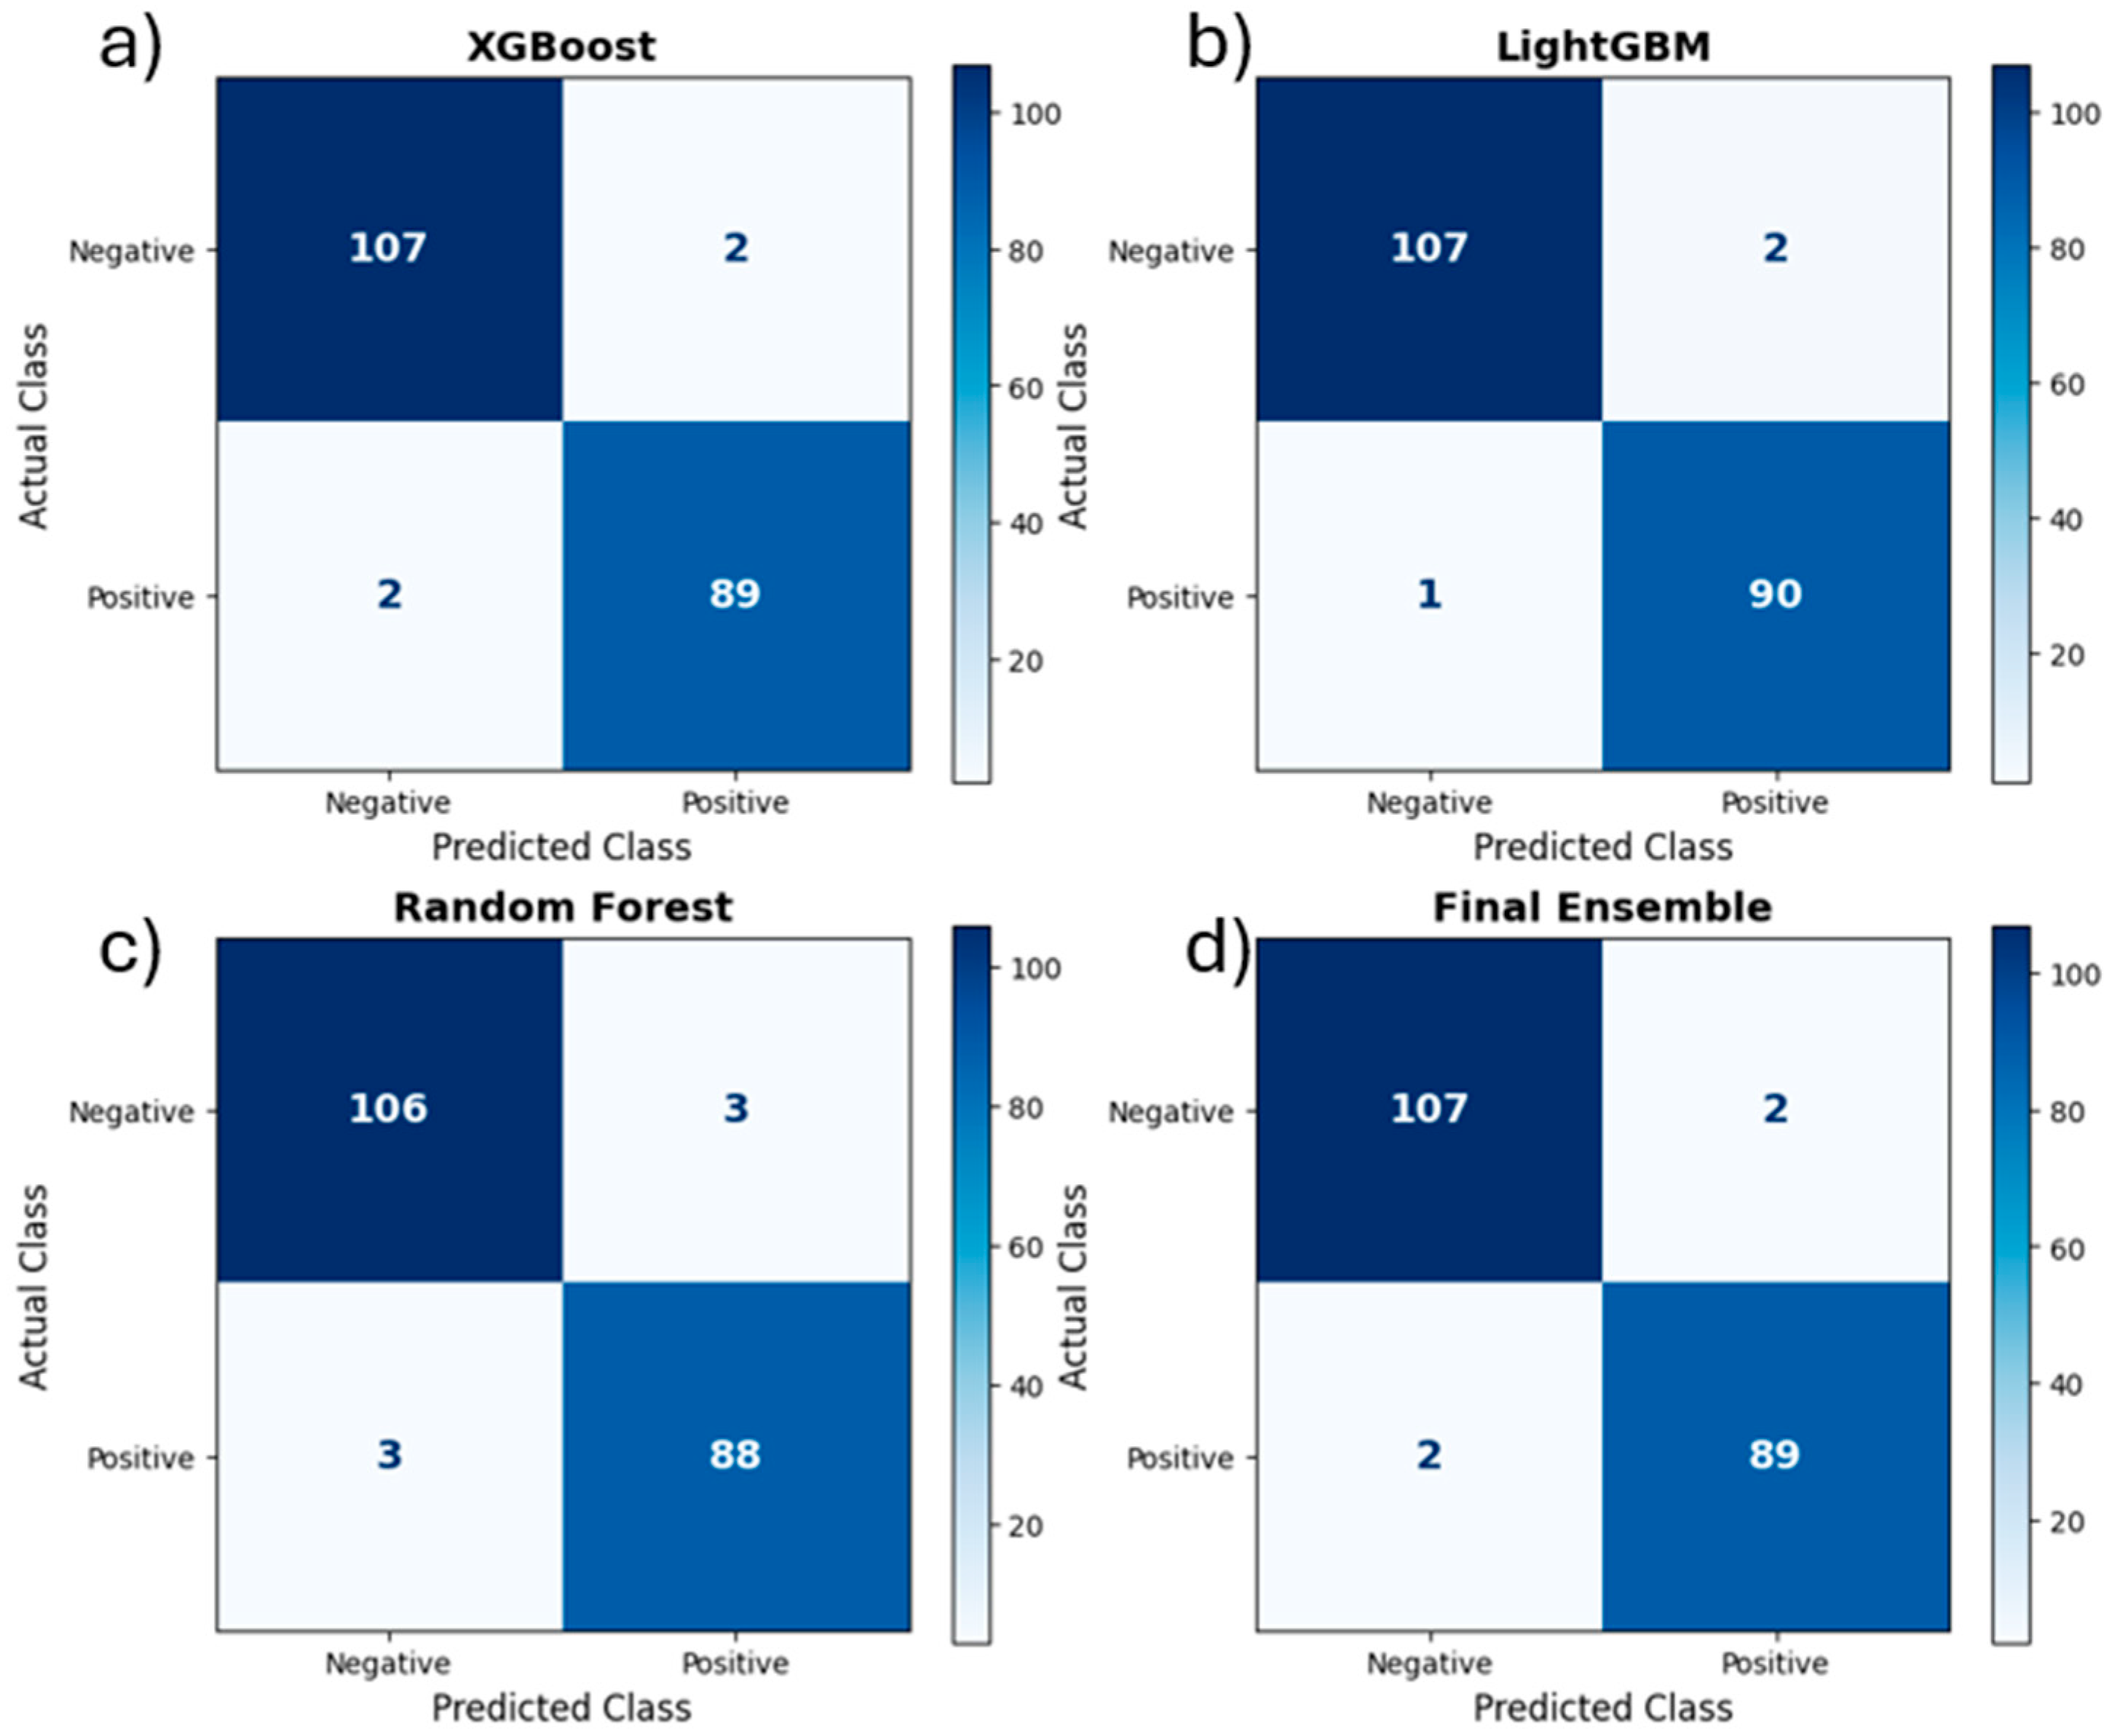
| MSE | 0.020 (0.013, 0.027) | 0.018 (0.011, 0.025) | 0.025 (0.018, 0.032) | 0.019 (0.013, 0.027) |
| Log-Loss | 0.065 (0.053, 0.077) | 0.060 (0.048, 0.072) | 0.075 (0.062, 0.088) | 0.063 (0.043, 0.081) |
| Brier Score | 0.014 (0.011, 0.017) | 0.012 (0.009, 0.015) | 0.016 (0.013, 0.019) | 0.013 (0.009, 0.021) |
| AUC-ROC | 0.975 (0.958, 0.992) | 0.981 (0.964, 0.998) | 0.968 (0.951, 0.985) | 0.978 (0.945, 0.996) |
| Accuracy (%) | 98.00 (94.96, 99.45) | 98.50 (95.68, 99.69) | 97.00 (93.6, 98.9) | 98.00 (94.96, 99.45) |
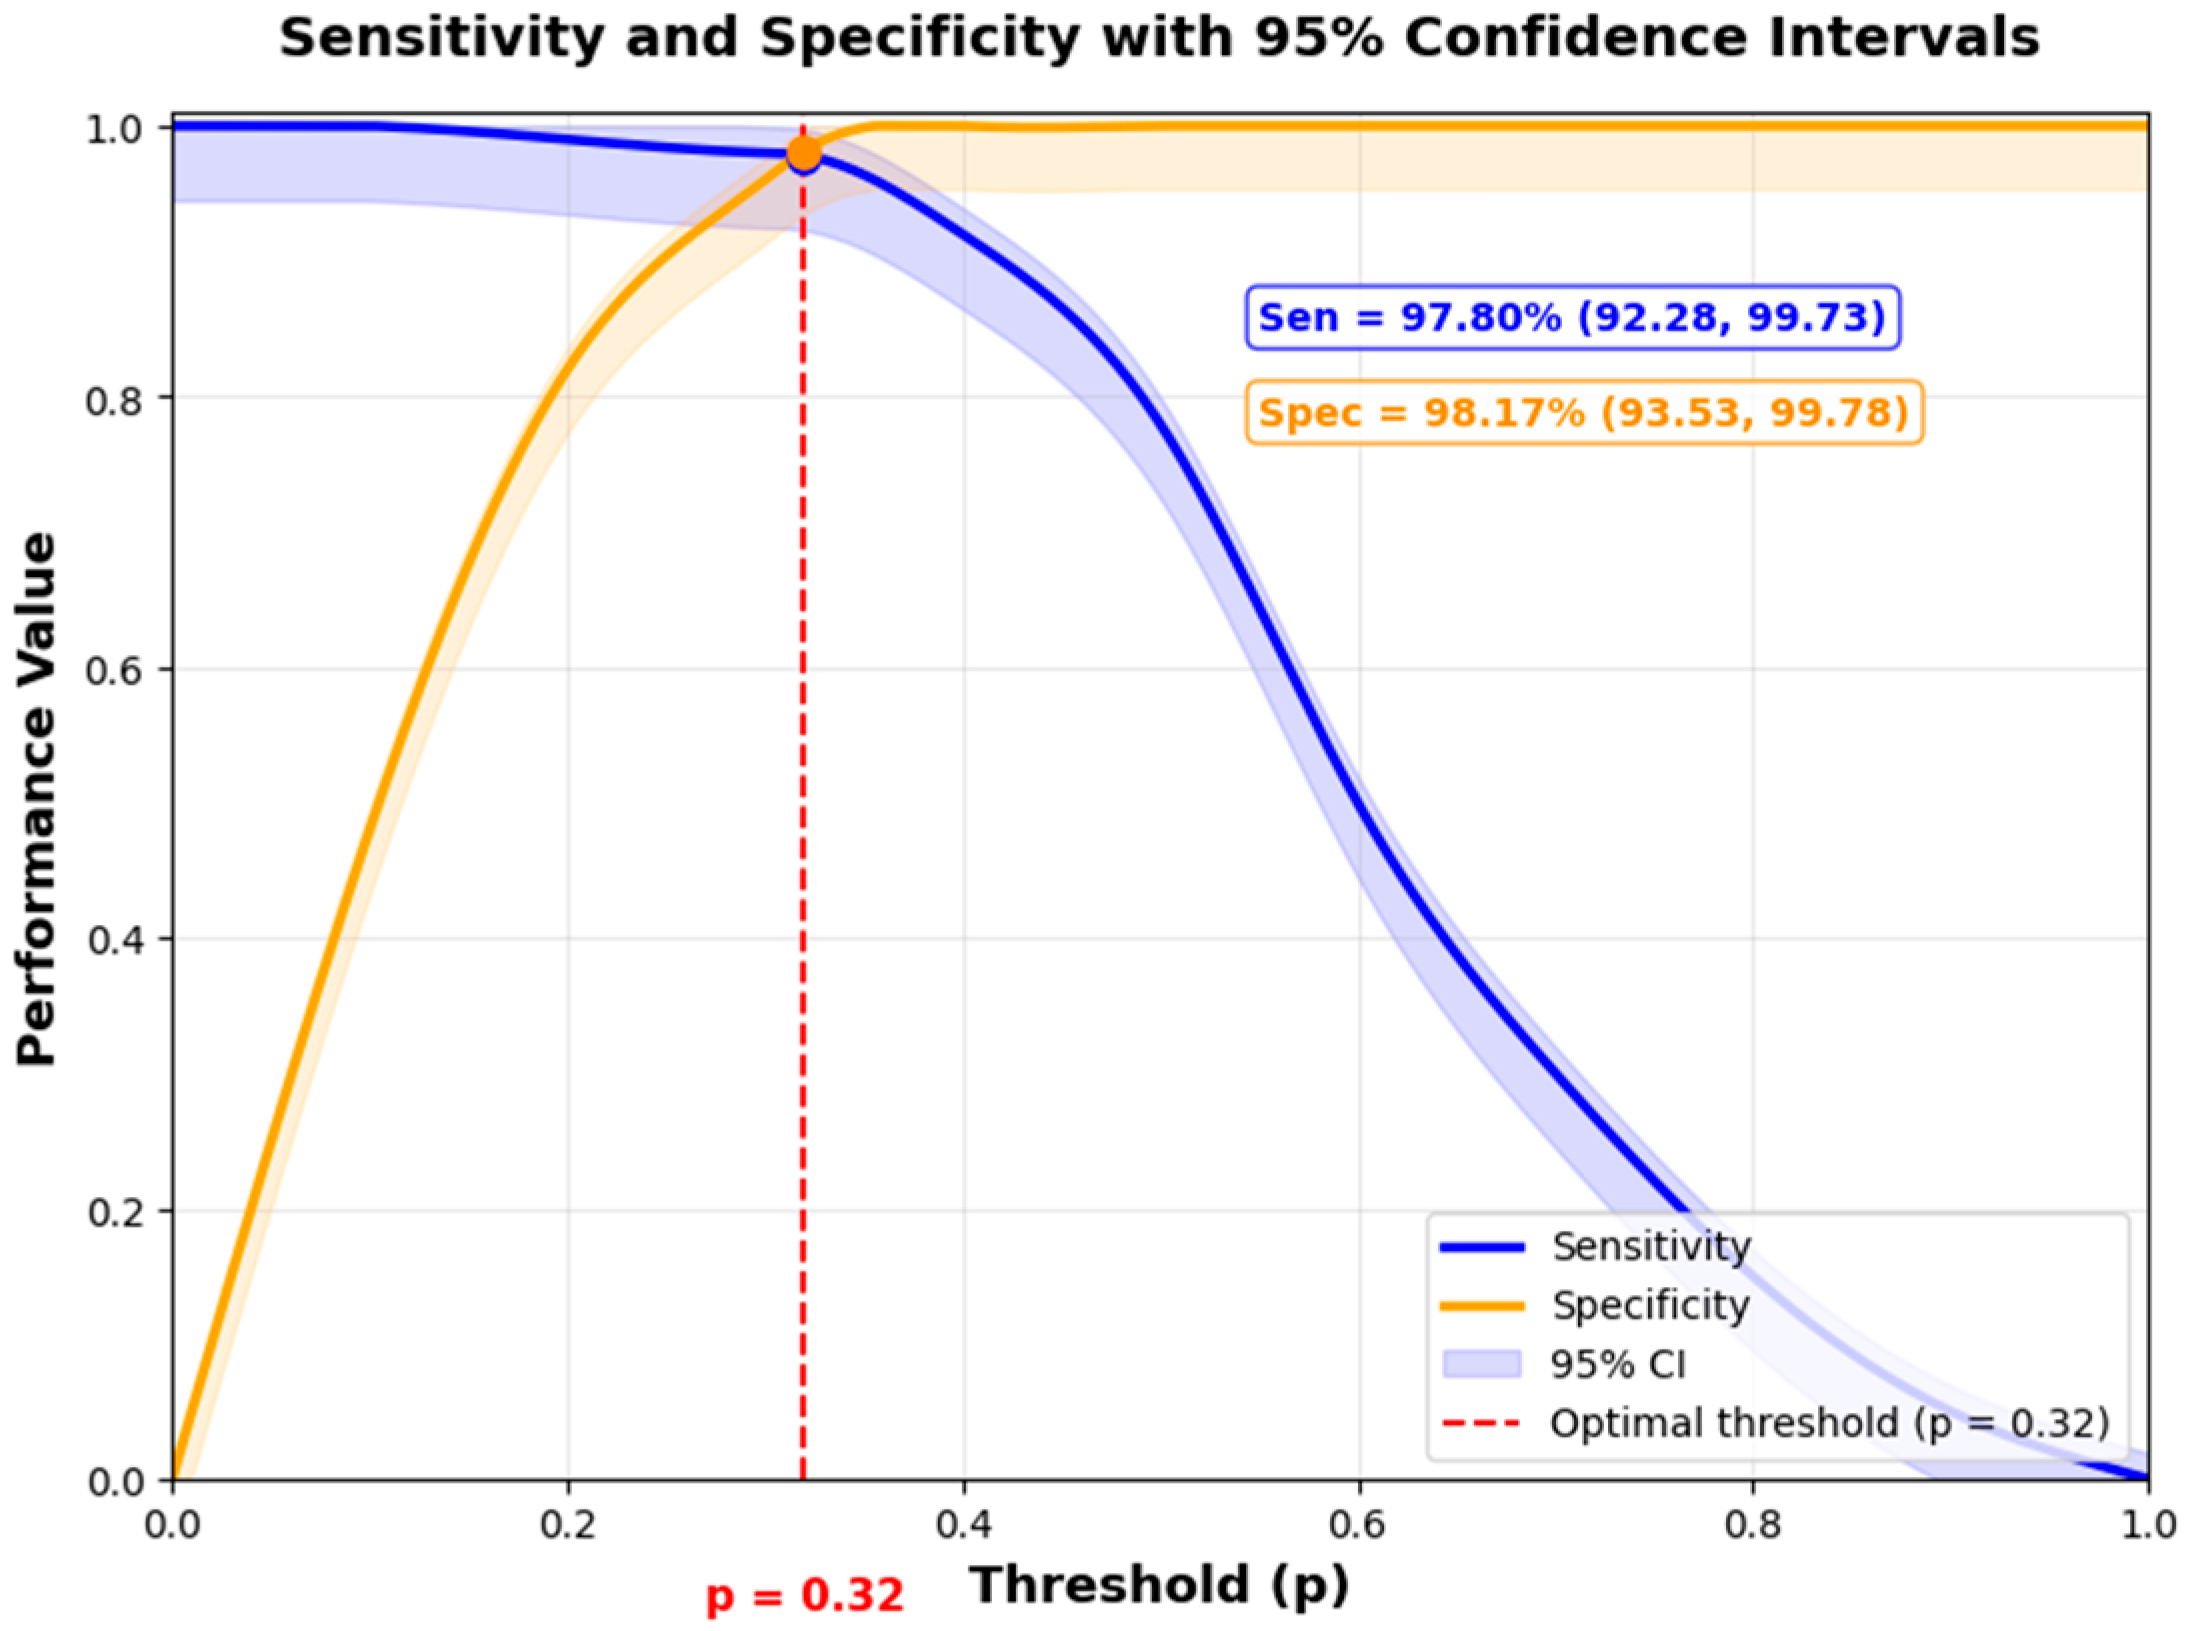
| Sensitivity (%) | 97.80 (92.28, 99.73) | 98.90 (94.03, 99.97) | 96.70 (90.7, 99.3) | 97.80 (92.28, 99.73) |
| Specificity (%) | 98.17 (93.53, 99.78) | 98.17 (93.53, 99.78) | 97.25 (92.17, 99.43) | 98.17 (93.53, 99.78) |
| F1-score (%) | 97.80 (92.0, 99.7) | 98.36 (94.0, 99.7) | 96.70 (92.1, 99.5) | 97.80 (93.6, 99.8) |
| PPV (%) | 97.80 (92.28, 99.7) | 97.83 (92.36, 99.73) | 96.70 (90.7, 99.31) | 97.80 (92.28, 99.73) |
| NPV (%) | 98.17 (93.53, 99.78) | 99.07 (94.95, 99.97) | 97.25 (92.17, 99.43) | 98.17 (93.53, 99.78) |
| Modalities | Accuracy (%) | AUC | Sensitivity (%) | Specificity (%) | F1-Score (%) |
|---|---|---|---|---|---|
| MRI only | 96.00 (93.8, 97.8) | 0.962 (0.94–0.98) | 95.80 (92.1, 98.1) | 96.20 (93.8, 98.0) | 96.00 (93.0, 98.1) |
| ECG only | 94.50 (91.9, 96.5) | 0.948 (0.93–0.97) | 94.20 (91.1, 96.5) | 94.80 (91.9, 97.0) | 94.50 (91.0, 97.0) |
| Biomarkers only | 91.00 (88.1, 93.4) | 0.918 (0.89–0.94) | 91.00 (87.8, 93.8) | 91.00 (87.4, 93.9) | 91.00 (87.4, 93.9) |
| MRI + ECG | 97.50 (95.8, 98.7) | 0.975 (0.96–0.99) | 97.40 (92.5, 99.5) | 97.60 (93.0, 99.0) | 97.50 (93.0, 99.0) |
| MRI + Biomarkers | 96.80 (94.9, 98.2) | 0.968 (0.95–0.98) | 96.70 (93.0, 98.7) | 96.90 (93.3, 98.9) | 96.80 (93.3, 98.9) |
| ECG + Biomarkers | 95.50 (93.4, 97.2) | 0.958 (0.94–0.97) | 95.40 (91.5, 97.8) | 96.90 (93.3, 98.9) | 95.50 (91.5, 97.8) |
| MRI + ECG + Biomarkers | 98.00 (94.96, 99.45) | 0.978 (0.945–0.996) | 97.80 (92.28, 99.73) | 98.17 (93.53, 99.78) | 97.8 (93.6, 99.8) |
| Subgroup | Accuracy (%) | Sensitivity (%) | Specificity (%) | F1-Score (%) | AUC |
|---|---|---|---|---|---|
| Age < 60 years | 98.20 (95.2, 99.5) | 98.30 (93.2, 99.8) | 98.10 (93.2, 99.8) | 98.20 (93.2, 99.8) | 0.977 (0.960–0.994) |
| Age ≥ 60 years | 97.70 (94.5, 99.2) | 97.80 (92.6, 99.7) | 97.60 (92.6, 99.7) | 97.70 (92.6, 99.7) | 0.972 (0.955–0.989) |
| Mild/Moderate HF | 98.30 (95.4, 99.6) | 98.14 (93.2, 99.8) | 98.0 (93.0, 99.7) | 98.30 (93.2, 99.8) | 0.978 (0.961–0.995) |
| Severe HF | 97.20 (94.0, 99.0) | 97.40 (91.8, 99.5) | 97.87 (93.2, 99.8) | 97.21 (91.8, 99.5) | 0.968 (0.951–0.985) |
| With comorbidity | 97.50 (94.3, 99.2) | 97.40 (91.6, 99.5) | 97.40 (91.8, 99.5) | 97.50 (91.3, 99.6) | 0.970 (0.953–0.987) |
| Without comorbidity | 98.10 (95.1, 99.5) | 98.20 (93.2, 99.8) | 98.20 (93.2, 99.8) | 98.10 (93.2, 99.8) | 0.976 (0.959–0.993) |
| Characteristic | Patient 1 (Healthy) | Patient 2 (Moderate HF) | Patient 3 (Severe HF) |
|---|---|---|---|
| Modality | MRI | ECG | Biomarkers |
| Age (years) | 45 | 58 | 72 |
| Sex | Male | Female | Male |
| Key features | LVEF = 62%, EDV = 130 mL, ESV = 49 mL | QRS = 128 ms, Repolarization abnormalities, HR = 95 bpm | NT-proBNP = 380 pg/mL, Troponin = 0.08 ng/mL, Glucose = 160 mg/dL |
| Comorbidities | None | Hypertension | Diabetes, chronic kidney disease |
| Clinical Context | Healthy subject, normal cardiac function | Moderate HF with early electrical remodeling | Severe decompensated HF with diabetes |
| Final Risk Score | 0.08 | 0.78 | 0.92 |
| Ref. | Year | Sample Size | Modalities | Feature Count | AI Model | ACC (%) | Sen (%) | Spe (%) | F1-Score | AUC |
|---|---|---|---|---|---|---|---|---|---|---|
| [30] | 2025 | MIMIC-IV database | ECG + blood test | 30 | CNN + XGBoost | 97.46 | 97.16 | 97.67 | - | - |
| [18] | 2025 | EMR/Chest X-ray | Imaging | 13 | CNN + graph neural networks | 83.18 | - | - | 0.823 | 0.938 |
| [31] | 2025 | 56.817 ECGs from 4437 patients | ECG signals + clinical text data | - | LUNet-Efficient Netv2, BiLSTM | 97.9 | - | - | 97.6 | - |
| [32] | 2025 | 1061 patients | clinical and biological data | 15 | Random forest (RF) classifier, the Boruta algorithm | 91.8 | 93.8 | 89.4 | 92.7 | 0.969 |
| [33] | 2026 | ECG, CXR, Biomarkers, clinical data | ECG, chest X-rays, Biomarkers, clinical text data | - | 1D-CNN, ResNet, XGBoost, BioBERT | 95.7 | 96.2 | 94.8 | 95.7 | 0.975 |
| [34] | 2026 | MIMIC-IV | Tabular, Notes, Chest X-ray | - | LSTM + VGG16 | 97.31 | - | - | - | 0.9962 |
| [35] | 2026 | UK Biobank | 3D biventricular anatomy + 12-lead ECG | - | AEM (Multi-task self-supervised Transformer | 76.89 | - | - | 77.58 | 0.8192 |
| [36] | 2026 | 12-lead ECG-Text-LVEF Cardio dataset | ECG + Clinical Text | - | Graph Convolutional Neural Network | 98.5 | 99 | - | - | 0.997 |
| Ours | 2026 | 281 patients (MRI), PTB-XL physionet database, 157 patients (biomarkers) | Cine-MRI, ECG, biomarkers, demographic | 25 | Cine-MRI, ECG, biomarkers, demographic | 98.00 | 97.80 | 98.17 | 97.80 | 0.978 |
Disclaimer/Publisher’s Note: The statements, opinions and data contained in all publications are solely those of the individual author(s) and contributor(s) and not of MDPI and/or the editor(s). MDPI and/or the editor(s) disclaim responsibility for any injury to people or property resulting from any ideas, methods, instructions or products referred to in the content. |
© 2026 by the authors. Licensee MDPI, Basel, Switzerland. This article is an open access article distributed under the terms and conditions of the Creative Commons Attribution (CC BY) license.
Share and Cite
Baccouch, W.; Benameur, N.; Alsayyari, A.A.; Alawaji, Z.; Kallel, A.; Jemai, A.; Labidi, S. A Hybrid Meta-Learning Framework Integrating ECG, Cine-MRI, and Biomarkers for Heart Failure Prediction. Technologies 2026, 14, 496. https://doi.org/10.3390/technologies14080496
Baccouch W, Benameur N, Alsayyari AA, Alawaji Z, Kallel A, Jemai A, Labidi S. A Hybrid Meta-Learning Framework Integrating ECG, Cine-MRI, and Biomarkers for Heart Failure Prediction. Technologies. 2026; 14(8):496. https://doi.org/10.3390/technologies14080496
Chicago/Turabian StyleBaccouch, Wafa, Narjes Benameur, Abdulrahman Abdullah Alsayyari, Zeyad Alawaji, Amani Kallel, Abderrazak Jemai, and Salam Labidi. 2026. "A Hybrid Meta-Learning Framework Integrating ECG, Cine-MRI, and Biomarkers for Heart Failure Prediction" Technologies 14, no. 8: 496. https://doi.org/10.3390/technologies14080496
APA StyleBaccouch, W., Benameur, N., Alsayyari, A. A., Alawaji, Z., Kallel, A., Jemai, A., & Labidi, S. (2026). A Hybrid Meta-Learning Framework Integrating ECG, Cine-MRI, and Biomarkers for Heart Failure Prediction. Technologies, 14(8), 496. https://doi.org/10.3390/technologies14080496