1. Introduction
The built environment is among the most vulnerable sectors to the impacts of extreme events, with in-use building assets facing critical risks under most climate-emissions scenarios [
1]. Despite the clear physical necessity for climate adaptation, outdated maintenance practices and a lack of scalable decision-making tools often stall the implementation of these measures. Given that around 85% of today’s European building stock is expected to remain in use by 2050, the core of the problem shifts from identifying risks to coordinating a timely and large-scale transition toward climate resilience [
2]. Direct physical damage from both fast- and slow-onset extreme events is the most straightforward risk category for buildings, especially given the increasing intensity of these events [
3]. At the same time, even the human dimension is critical. Beyond structural safety, there are health, productivity, and thermal comfort considerations [
4,
5]. For instance, more heatwaves not only cause material degradation but also stress the cooling system and exacerbate the urban heat effect, posing health risks [
6,
7].
Since buildings serve as interfaces between the outdoor and indoor environments, they must be maintained to ensure the safety and comfort of occupants [
8]. For that, the Intergovernmental Panel on Climate Change (IPCC) thought the Sixth Assessment Report (AR6) underscores the need to consider climate risks in the architectural design and retrofitting of residential buildings [
9]. In this regard, to evaluate potential retrofit actions for buildings, conducting a Climate Vulnerability and Risk Assessment (CVRA) is strongly recommended by the European Union (EU) within the Guidance (EU-level technical guidance on adapting buildings to climate change and best practice guidance: this two-part report provides a framework and practical applications, respectively. It aims to align building climate resilience with overarching EU Green Deal strategies. To ensure consistency in terminology, we will refer to these two reports using the Guidance and Best Practice Guidance, respectively.) [
10] and their accompanying Best Practice Guidance [
11]. Nowadays, these tools are used across different sectors, including infrastructure; however, there is no unified method for buildings. From this point onward, a limited number of studies have focused on buildings [
12,
13,
14], but gaps remain. In particular, a unique framework that integrates hazard exposure and current building conditions is essential to develop optimization models that help decision-makers determine the optimal retrofit strategy.
A review of the literature indicates that optimizing building retrofits in the context of natural hazards has attracted the interest of various research communities since the early 2000s [
15,
16]. These research communities focused on different types of natural hazards, such as earthquakes [
16,
17,
18,
19], hurricanes [
20,
21,
22], floods [
23], wind [
24], etc. A closer look at the literature also reveals several gaps and shortcomings. For instance, in the case of heatwaves, most studies were limited to new buildings or to a specific building typology or did not consider financial constraints [
25,
26,
27]. As an example of prior research in this field, Karimi et al. (2026) [
25] focused on using the Non-dominated Sorting Genetic Algorithm (NSGA-II) combined with Neural Networks (NNs) to optimize retrofit configurations that minimize energy use intensity and operational carbon intensity under future heatwave scenarios. In line with the previous study, Da Costa et al. (2025) [
26] used NSGA-II to improve the thermal resilience of multifamily buildings in Brazil. In another study, Ascione et al. [
27] proposed minimizing urban heat by retrofitting existing buildings using NSGA-II, thereby reducing energy use, costs, and discomfort while accounting for Life Cycle Cost (LCC). Extending this perspective, several research teams [
28,
29,
30] have investigated ways to optimize building resilience to heatwaves. These studies collectively consider thermal stress, advanced material properties, and building orientation as key factors in defining effective adaptation strategies. In the case of heavy precipitation, this problem has received limited attention in the literature, overlooking the building-level problem.
To our knowledge, few studies simultaneously address the optimization of buildings for both heatwaves and heavy precipitation hazards. These hazards are typically examined in isolation, whereas coupled hazards such as earthquakes and tsunamis have been more extensively studied in an integrated manner in the literature. Additionally, previous studies indicate that the multi-building portfolio in this field is often neglected and does not adequately address financial resource constraints. This issue is significant because stakeholders, such as the public and the private sectors, possess various assets but face limited financial resources. Consequently, there is a strong need for a framework that can be extended to encompass an unlimited number of assets. Along with this, previous investigations show that limited attention has been paid to integrating optimization problems with policies, like the Guidance [
10] issued by public authorities. This guidance consider important factors such as building exposure, sensitivity, and adaptive capacity. Therefore, a flexible framework that incorporates these factors is needed, which can be adapted to different geographical locations.
Furthermore, traditional engineering approaches to building resilience rely on complex and computationally intensive physical simulations (e.g., dynamic energy modeling). While these approaches are highly accurate for individual buildings, they are computationally intensive when applied to large real estate portfolios. This creates a clear need for a framework that can manage assets efficiently at scale.
Another key research gap in prior studies is the lack of a coherent, structured approach that enables end-users to identify optimal solutions, particularly for multi-objective problems. Existing studies predominantly rely on classical techniques, such as knee point detection, which lack the flexibility and adaptability offered by more advanced Multi-Criteria Decision-Making (MCDM) frameworks. Ultimately, previous studies in this field tend to overlook context-awareness and fail to provide a holistic assessment, often treating optimization problems as static and composed of isolated units [
31,
32]. However, the engineering problems are inherently context-dependent, requiring adaptive and specific decision-making. This limitation highlights the need for context-aware optimization frameworks, which can be effectively enabled by integrating Agentic Artificial Intelligence (AI).
From a scientific perspective, Agent-Based AI (ABAI) represents a computational paradigm that merges Agent-Based Modeling (ABM) with AI techniques to overcome the rigid decision rules [
33]. Within this framework, ABM is defined as a method where a system is modeled as a collection of autonomous decision-making entities called agents [
34]. These agents are characterized by autonomy, interactions, and the capacity to perceive and influence the environment [
35]. Building upon these foundations, and thanks to the latest development of AI, such as Visual Language Model (VLMs) and Large Language Models (LLMs), the Agentic AI tools are emerging [
32]. In fact, these systems enable autonomous decision-making, support adaptive system behavior, and enhance cooperative workflows across industrial systems [
36]. These technologies are structured as a network of specialized subagents, each designed to perform distinct tasks. By exchanging information and dynamically coordinating their actions, these agents collectively pursue high-level objectives [
32,
36]. In contrast to applications of Generative AI, where only users interact with LLMs, the users’ interaction with an orchestrated multi-agent environment. The Orchestrator coordinates subagents which interacting perform tasks and handle context-dependent engineering challenges.
In recent years, there has been rampant interest in applying LLMs in civil engineering [
37], including automated structural analysis [
38], generative design and optimization [
39], and fault detection and predictive maintenance [
40]. However, to the best of our knowledge, the application of Agentic AI in civil engineering remains limited compared to fields such as industrial engineering. Within the specific scope of climate adaptation for buildings, this research area is even less represented. One of the pioneering studies on this topic was carried out by Kalasapudi et al. (2025) [
41]. In fact, the authors proposed an integrated system that links the contractor’s internal cost estimation and project delivery. The system is engineered for the continuous retrieval, cleansing, processing, and analysis of cost and productivity data, facilitating both real-time operational support and long-term business intelligence. In line with the previous study, Jiang et al. (2025) [
42] presented a unified framework that integrates an Agentic AI architecture with a modular environment for physics-informed building energy modeling, control, and optimization. Building further on these premises, Lu et al. (2025) [
43] developed a LLM-based multi-agent framework for automatic energy retrofitting of buildings, defining a specific task division among specialized LLM-driven agents.
A critical synthesis of these works reveals that while Agentic AI has been successfully proven for operational tasks and energy efficiency, current applications remain largely situated within single-domain or deterministic environments. Its potential to improve building retrofits to enhance climate adaptation remains unexplored.
Despite significant advances in building optimization, a critical research gap persists in the integration of human-centric decision-making within multi-hazard resilience. Specifically, the current literature lacks (i) integration of multi-hazard building assessment at a portfolio scale; (ii) translation of policy into engineering actions; and (iii) explainable AI (XAI) capabilities to explain and justify the results to the stakeholders.
The scientific contribution of this research lies in the development of a Multi-Agentic Optimization (MAO) framework that marks a transition from traditional black-box metaheuristics to an explainable, policy-aligned decision-support system. The novelty is further established by the framework’s ability to provide not only mathematically optimal solutions but also context-aware justifications at a portfolio scale. The core novelties can be summarized as follows:
Operationalization of Policies: it translates the requirements of EU Guidance [
10] and its Best Practice Guidance [
11] into a computational workflow for climate adaptation.
Agentic AI Architecture: it introduces a novel, multi-agent orchestration layer that manages the complexity of building stocks, diverse cost databases, and multi-hazard scenarios, ensuring scalability across different geographic contexts.
Discrete Optimization Methodology: it tailors multi-objective metaheuristic optimizers specifically for binary decision spaces, providing a bespoke approach for selecting discrete retrofit actions in building maintenance.
Enhanced Decision Support System and XAI: it facilitates the selection of feasible solutions by integrating MCDM with XAI, providing human-readable justifications that bridge the gap between numerical optimization and stakeholder needs.
To achieve these objectives, this study integrates the optimization engine (
Section 2.2) into a multi-agent framework (
Section 2.3). Specifically, the aim of this framework is to analyze and optimize the adaptive maintenance of complex technical systems [
32,
44]. In particular, the adoption of this framework aligns with the ongoing paradigm shift in building maintenance, moving from emergency responses toward predictive and integrated system management [
45]. Notably, this tool serves as a cornerstone for climate adaptation strategies, effectively linking engineering expertise to real-world resilience challenges [
46].
The remainder of this paper is structured as follows.
Section 2 describes the proposed framework with respect to the Climate Vulnerability Assessment (CVA) component (
Section 2.1), Multi-Objective Optimization (MOO) (
Section 2.2), Agentic AI (
Section 2.3), and lastly the integration of MOO into the multi-agent framework (
Section 2.4). Subsequently,
Section 3 discusses the findings in relation to the metaheuristic optimizer (
Section 3.1) and its integration with the Agentic AI (
Section 3.2) and the discussion, limitations, and future direction of the work (
Section 3). Finally,
Section 4 concludes this paper.
2. Methodology
In line with the Guidance [
10] that provides the framework for risk assessment, and the Best Practice Guidance [
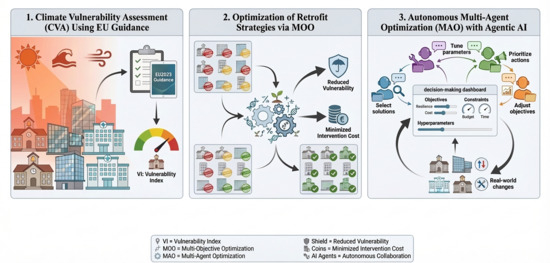
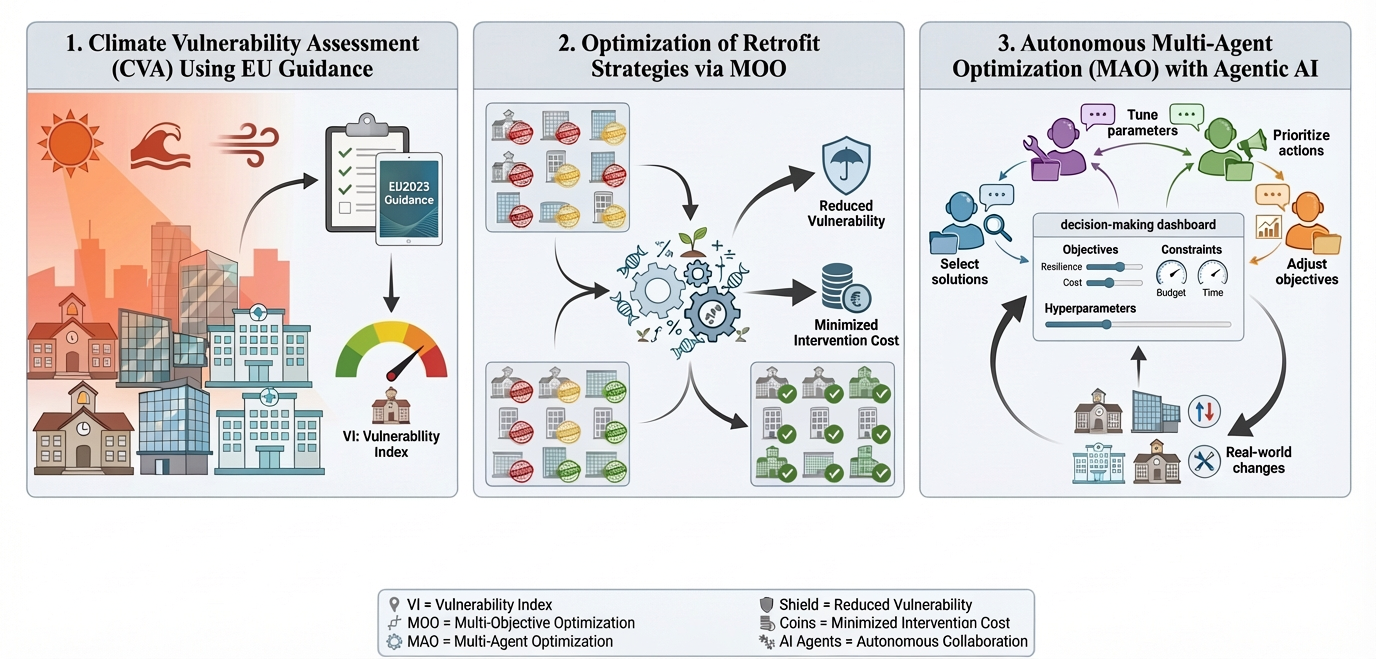
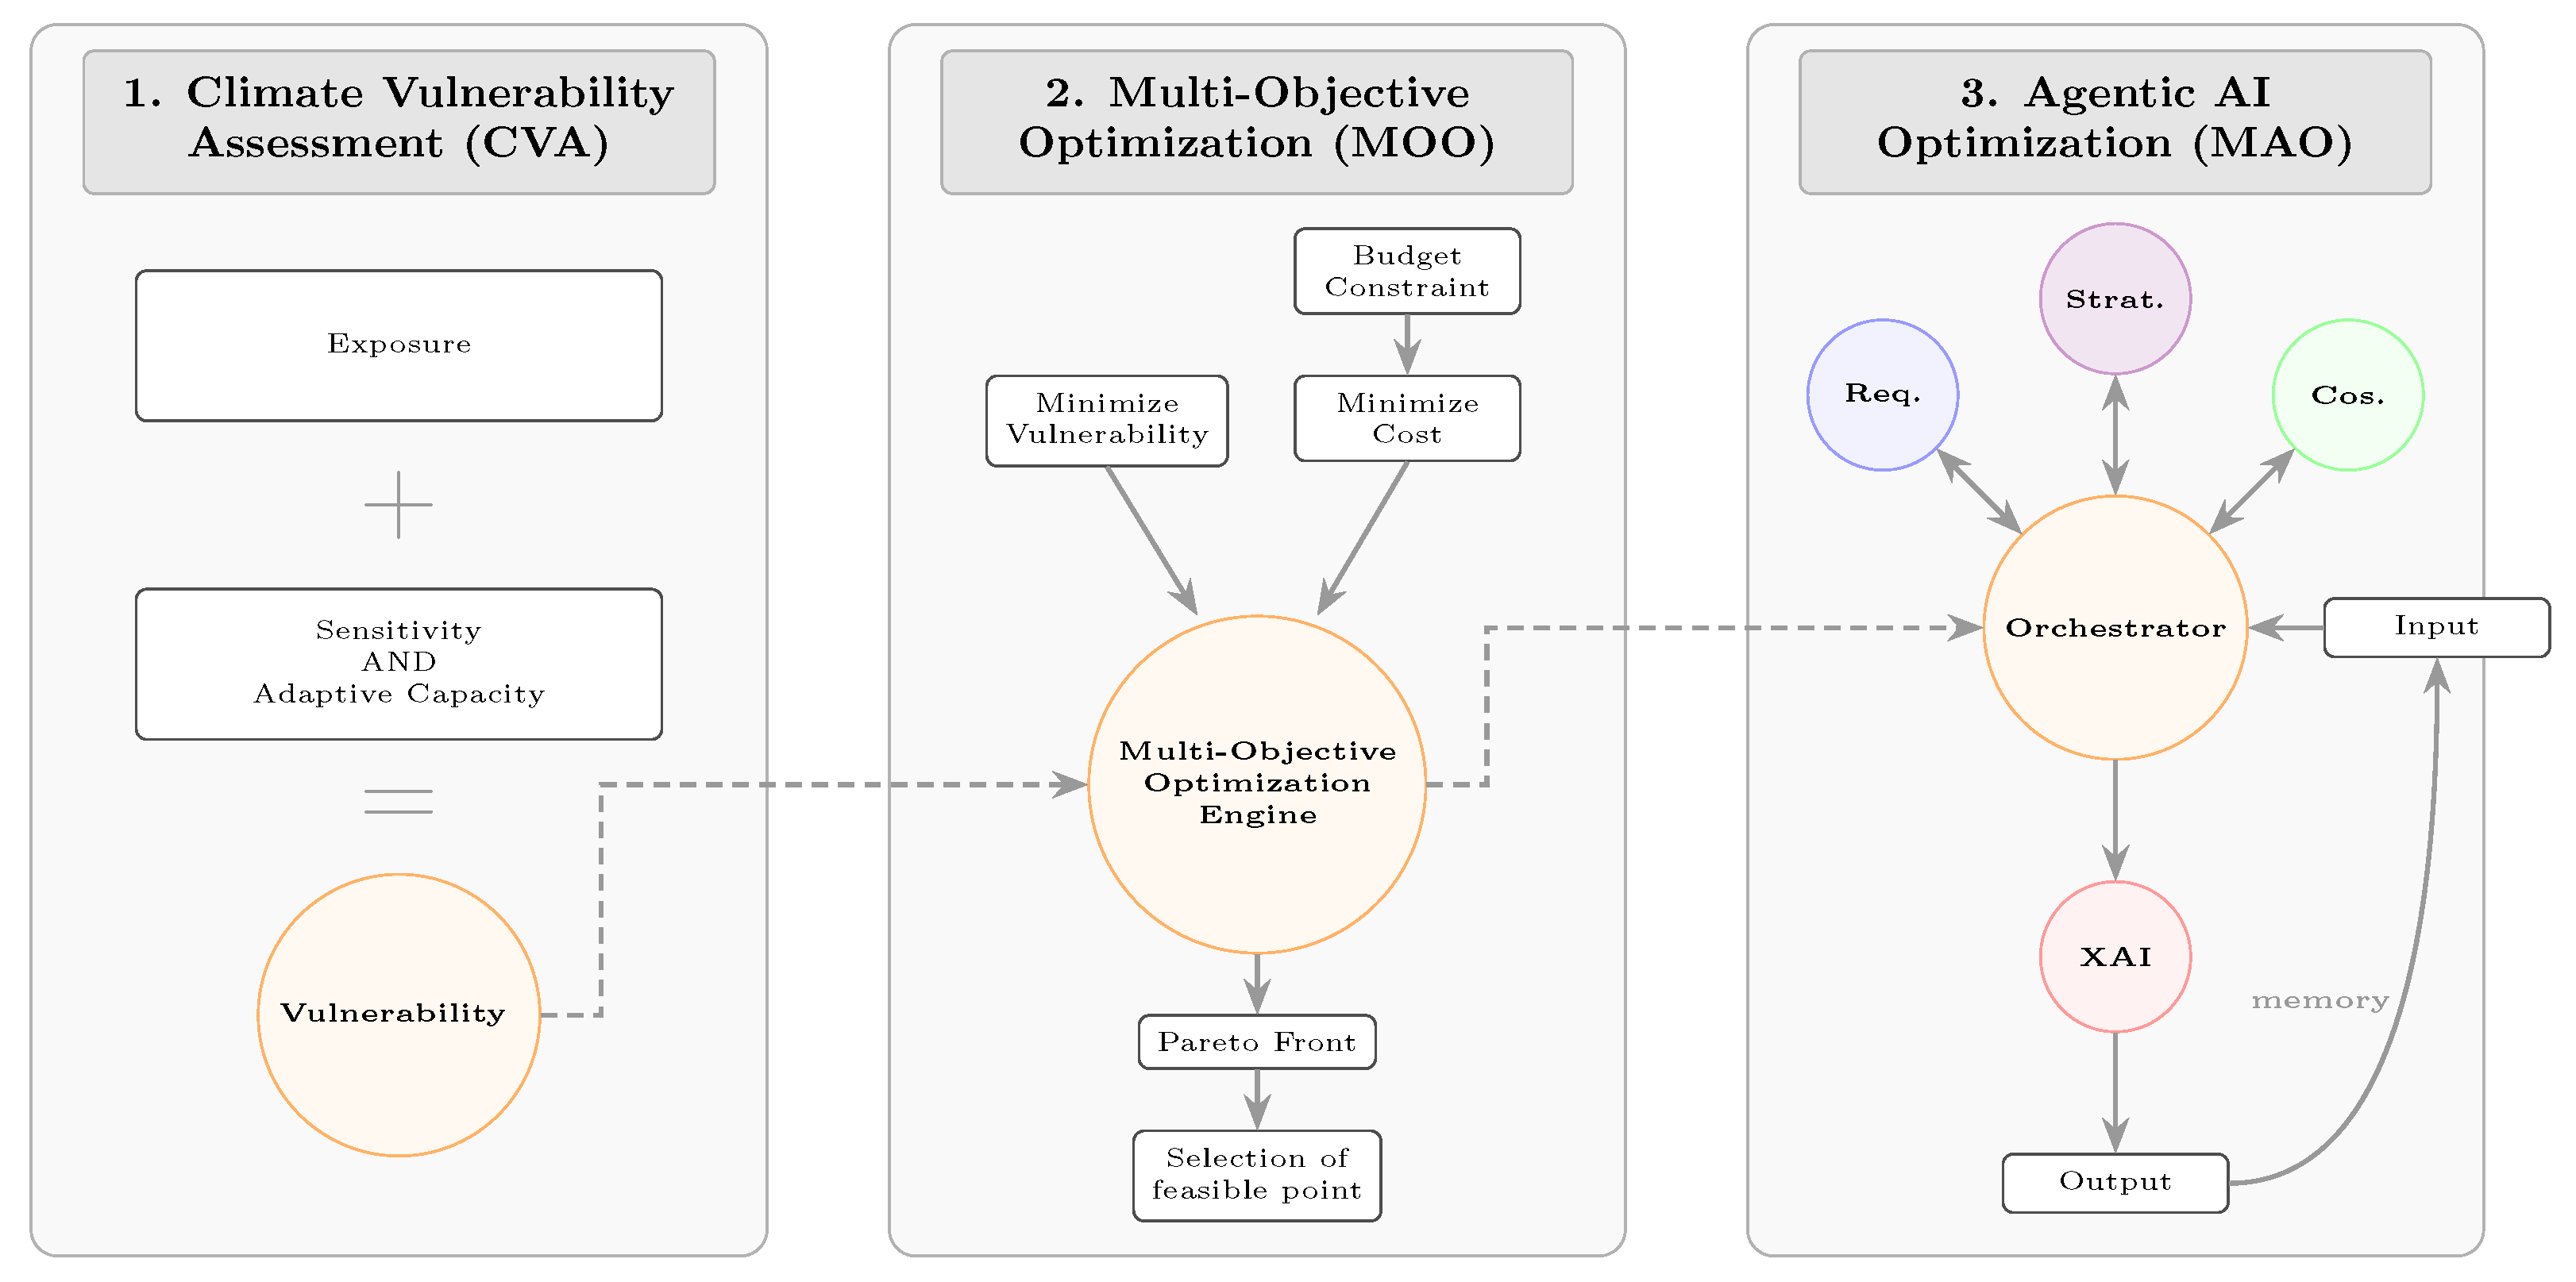
11] that offers technical solutions for building retrofit, this study aims to propose a technological framework to support public authorities in planning adaptive maintenance for existing buildings in resource-constrained environments. The framework, as shown in
Figure 1, is structured around three main components:
Determination of a CVA to retrieve the Vulnerability index (
) based on the Guidance [
10];
Utilization of two MOO algorithms: Multi-Objective Invasive Weed Optimization (MO-IWO) and Multi-Objective Grey Wolf Optimization (MO-GWO), to optimize retrofit strategies for a portfolio of public assets, thereby minimizing vulnerability and intervention costs;
Formulation of an Agentic AI framework for MOO that assists decision-makers by facilitating adaptive, context-aware, and stepwise optimization of retrofit actions. In this component, multiple agents interact within a closed-loop decision-making environment to dynamically adjust parameters in objective functions, including adjusting the decision variables and constraints, tuning the optimizer’s hyperparameter, selecting feasible solutions, and prioritizing based on evolving building conditions and budgetary limitations.
2.1. Climate Vulnerability Assessment (CVA)
In the context of CVA, the
V is based on three parameters: Exposure (
), Sensitivity (
), and Adaptive Capacity (
) of buildings to specific hazards (e.g., heat waves and heavy precipitation). From the definition proposed by [
10],
V is evaluated as follows:
where
represents the vulnerability index of building
b to the extreme event
e,
represents the exposure of building
b to event
e,
represents the sensitivity of the building to that event, and
represents the adaptive capacity of the building to cope with the considered extreme event.
Several approaches can be employed to estimate the first
component across various temporal horizons. For instance, climate data retrieved from the Copernicus Climate Data Store (CDS) [
47] can be used to calculate climate indices, such as those proposed by Expert Team on Climate Change Detection and Indices (ETCCDI) [
48], or to perform advanced statistical analyses like Extreme Value Theory (EVT) [
49] and Copula simulation [
50]. While these methods would enhance the CVA’s comprehensiveness, in this study
was fixed to 1. This choice isolates the AI’s optimization logic and ensures computational scalability for large portfolios. Due to the framework’s modularity, this constant can be seamlessly replaced with specific hazard evaluation (such as the methodology proposed in [
51]) in future developments without altering the core multi-agent coordination. By updating the
component with climate projections across different time windows, the framework is natively designed to account for temporal dynamics.
The second component,
, and the third component,
, of the CVA are evaluated jointly. These indicators are based on previous studies [
14,
52,
53,
54,
55,
56,
57,
58], which cover the urban context and the structural/non-structural elements of the building, considering it as a holistic system. Such a comprehensive approach enables the assessment of both intrinsic and modifiable resilience features of the buildings.
For this reason, some indicators focus on the building’s inherent characteristics (intrinsic sensitivity), while others evaluate aspects that can be modified to enhance the building’s resilience (e.g., adapting materials to the event). These indicators are organized into two questionnaires for expert evaluation of buildings, representing the current conditions or, more precisely, the building’s vulnerability score. Scores for these indicators range from 0 to 1, where 0 indicates minimal contribution to vulnerability, and 1 indicates a high contribution. To ensure a non-biased assessment [
59], an equal weighting approach is applied to the indicators. Specifically, each indicator within a given category is assigned a weight
, where
n is the total number of indicators in the category.
A summary of these indicators is shown in
Table 1.
Finally, the score retrieved from the questionnaire is normalized between the range [0, 1], using a linear Min–Max normalization. This ensures that the vulnerability score is directly comparable with the
component before being incorporated into Equation (
1) to calculate the
.
Given the large amount of data required to test the effectiveness of the proposed framework, synthetic data covering the of 50 buildings was stochastically generated to assess the model’s robustness across a plausible set of synthetic scenarios. In particular, a constrained stochastic generation process, based on the minimum and maximum ranges derived from the expert-based questionnaire, was used. The generated values were kept within the [0, 1] indicator scale before being used in the vulnerability calculation. By anchoring these datasets to the ranges established through the expert-based questionnaire, the optimization results remain consistent with empirical judgment.
2.2. Multi-Objective Optimization (MOO)
A MOO problem is a mathematical problem in which multiple objective functions are optimized simultaneously. Solving these problems entails identifying a set of trade-offs, since improving one objective may worsen another. The MOO problem can be set as follows:
where
denotes the decision vector (e.g., retrofit actions on buildings),
is the feasible space, and
are the objective functions, with
representing the number of objectives considered (e.g., total cost and total vulnerability).
To handle multiple conflicting objectives, the optimization algorithms rely on the concept of Pareto dominance. Let
denote a candidate solution and
represent the objective vector, where
and
correspond to total vulnerability and total cost, respectively. A solution
is said to dominate
if
Based on this definition, a non-dominated sorting procedure assigns a rank to each solution. Non-dominated solutions are assigned and form the current Pareto front, while dominated solutions receive higher ranks according to their dominance level (i.e., the front to which they belong).
Specifically, the optimizers used in this study are originally designed for single-objective problems. To adapt them for multi-objective optimization, a Pareto dominance approach is introduced in this work. The
Section 2.2.1 and
Section 2.2.2 detail the optimizer and how this integration is achieved.
The objective of this work is to simultaneously minimize two objective functions that represent total vulnerability and total cost of retrofit actions to adapt buildings to climate change:
where
represents a binary decision variable, and
and
are the objective functions aiming to minimize total vulnerability and total retrofit costs, respectively.
By framing the problem in this manner, the set of compromise solutions reduces total vulnerability while accounting for the effects of various hazards and budget constraints.
The objective functions are detailed below.
The objective is to minimize the total vulnerability of buildings to the extreme events (e.g., heat waves and heavy precipitation):
where
is fixed to start from 0 to avoid any unrealistic solutions,
b represents the
i-th building,
e denotes an extreme event (e.g., heatwaves or heavy rainfall),
a refers to a retrofit action and represents a measurable enhancement in vulnerability,
n is the total number of buildings, and
K is the total number of possible retrofit actions. The variable
is a binary decision variable that equals 1 if action
a is applied to building
b and 0 otherwise. Furthermore,
indicates the initial vulnerability of building
b to event
e, while
represents the change (typically a reduction) in the vulnerability of building
b to event
e when action
a is implemented. Finally,
signifies the final vulnerability of building
b to event
e.
It is worth mentioning that
is quantitatively determined by calculating the difference between the initial vulnerability score of each building (established through expert judgment via the questionnaire—summary in
Table 1) and the revised score following the simulated implementation of adaptation measures. Each retrofit action is mapped to one or more building indicators, where the ±notation denotes a discrete numerical shift (reduction or increase) in vulnerability score. This approach ensures that every adaptation measure has a traceable impact on the final objective function.
The objective is to minimize the total cost associated with applying retrofit actions to a set of buildings:
subject to the budget constraint:
where
b indexes buildings (
),
a indexes retrofit actions (
),
n is the total number of buildings, and
K is the total number of available retrofit actions. The decision variable
is binary, taking the value 1 if retrofit action
a is applied to building
b and 0 otherwise. The parameter
represents the cost of applying action
a to building
b, and
B denotes the total available budget for retrofit actions.
The selected retrofit actions focus on the building envelope and were identified by integrating practice-consolidated solutions with recommendations from the Best Practice Guidance [
11] and the one proposed by D’Amico et al. (2023) [
60].
A list of these actions is reported in
Table 2:
While
Table 2 shows retrofit-action interactions for two hazards, the framework architecture is designed to be extendable toward a multi-hazard matrix. The integration of additional hazards requires specific studies to define the relevant building indicators, retrofit actions, and cross-hazard interaction rules. The role of the Agentic AI is to manage this growing knowledge base once the engineering rules are defined, helping decision-makers retrieve, combine, and explain the relevant hazard–action interactions rather than manually inspecting every possible conflict.
In this study, two meta-heuristic algorithms were selected: MO-IWO and MO-GWO. The choice is dictated by the combinatorial and discrete nature of the building retrofit problem (NP-hard). Based on the definition of the binary decision variables, the number of possible retrofit combinations grows exponentially with the number of assets (b) and retrofit actions (K), reaching
. While traditional metaheuristics such as Genetic Algorithms (GA), NSGA-II, and MOEA/D are widely used, the recent literature highlights that IWO and GWO variants are effective for discrete engineering problems because they balance exploration and exploitation while maintaining convergence stability [
61,
62,
63,
64,
65]. To ensure computational scalability during evaluation, the framework’s objective functions are designed with linear complexity
, while the exponential search space is handled through metaheuristic exploration. When extending the framework to very large portfolios, additional strategies such as parallel computation, building archetype clustering, and pre-screening of retrofit actions may be required to keep the problem computationally manageable.
Therefore, MO-IWO and MO-GWO were selected as suitable engines for this Proof-of-Concept (PoC), with MO-IWO retained in the Agentic AI framework because it achieved stronger Pareto-front quality than MO-GWO within the reported experimental setting. This comparison is intended to support the selection of the optimization engine for the proposed framework, rather than to claim a universal superiority of MO-IWO. A broader benchmark is outside the scope of the present PoC and will be addressed in future validation studies.
2.2.1. Multi-Objective Grey Wolf Optimization (MO-GWO)
The Grey Wolf Optimizer (GWO) is a population-based swarm intelligence algorithm inspired by the social hierarchy and hunting behavior of gray wolves [
66]. In its standard formulation, the algorithm drives the search process by selecting the top three individuals with the best fitness values, designated as alpha (
), beta (
), and delta (
), to act as leaders for the remainder of the pack, omega (
). To handle scenarios where multiple conflicting objectives must be optimized simultaneously, the standard GWO is extended by adopting the concept of Pareto dominance. This multi-objective extension (MO-GWO) utilizes a fast non-dominated sorting procedure to classify the population into hierarchical fronts [
67]. Furthermore, a crowding distance metric is employed to measure the density of solutions in the objective space, ensuring a well-distributed and diverse set of optimal solutions along the Pareto front.
The main operator in GWO is the hunting process, which is mathematically modeled by simulating the encircling behavior of gray wolves around their prey. The encircling behavior is defined by the following equations:
where
t indicates the current iteration,
is the position vector of the prey (the optimum), and
indicates the position vector of a gray wolf. The coefficient vectors
and
are calculated as follows:
where
and
are random vectors uniformly distributed in
. The parameter
a is linearly decreased from 2 to 0 over the course of the maximum number of iterations (
) to simulate the closing in on the prey:
During the hunting phase, the top three non-dominated solutions from the archive (
,
, and
) guide the search. The distance vectors between the current wolf and these three leaders are calculated as follows:
These distances are subsequently utilized to determine the step vectors toward each respective leader:
In the standard continuous domain, the new position of the current wolf is computed as the arithmetic mean of these three vectors.
In this study, since the decision space involves discrete binary variables (i.e., the adoption or exclusion of retrofit actions on a building), the MO-GWO is adapted by applying a continuous-to-binary transformation to its position updates. This is achieved by mapping the continuous positions () into probabilities using a scaled S-shaped sigmoid transformation.
First, the continuous position is scaled:
The scaled value is then passed through the sigmoid function to obtain a probability bound between 0 and 1:
Finally, the continuous probability
is evaluated against a random threshold to determine the final binary position
of the wolf for the next iteration:
where
is a random number drawn from a uniform distribution in
. This thresholding mechanism ensures that the continuous search gradients established by the wolf pack hierarchy are effectively translated into discrete optimization decisions.
Algorithm 1 shows the pseudocode of the proposed MO-GWO.
| Algorithm 1 Multi-Objective Grey Wolf Optimization (MO-GWO) |
- Input:
- Output:
Pareto front of optimal solutions
- 1:
Initialization: - 2:
Generate initial population of size - 3:
for each wolf w in do - 4:
Randomly initialize binary position - 5:
Evaluate objectives: vulnerability and cost - 6:
end for - 7:
Initialize Pareto archive - 8:
for to do - 9:
Pareto update: - 10:
Combine current population with archive - 11:
Extract non-dominated solutions and update archive A - 12:
Leader selection: - 13:
Select three leaders ▹ Best trade-off solutions - 14:
Control parameter update: - 15:
- 16:
Position update (encircling and hunting): - 17:
for each wolf in do - 18:
for each decision variable do - 19:
Generate random vectors - 20:
- 21:
- 22:
- 23:
Repeat for and to compute - 24:
- 25:
end for - 26:
Apply binary transformation (e.g., sigmoid + threshold) - 27:
Evaluate updated solution - 28:
end for - 29:
Constraint handling: - 30:
Filter solutions with cost - 31:
if no feasible solutions then - 32:
Retain all solutions - 33:
end if - 34:
Update population with new wolves - 35:
end for - 36:
Post-processing: - 37:
Extract final Pareto front from archive A - 38:
Apply non-dominated filtering (if required) - 39:
return Pareto front
|
2.2.2. Multi-Objective Invasive Weed Optimization (MO-IWO)
The Invasive Weed Optimization (IWO) introduced by Mehrabian and Lucas [
68] is a metaheuristic algorithm that mimics the colonizing behavior of weeds through four primary operators. Although the algorithm is designed for single-objective problems, the scalar fitness evaluation is replaced by a Pareto-based ranking mechanism that governs the reproduction and selection phases.
The first operator, initialization, begins the process by randomly dispersing a finite number of seeds across a
d-dimensional binary search space. The second operator is reproduction, in which each plant produces several seeds that increase linearly with its Pareto rank relative to the colony’s best and worst performers, ensuring that even less fit individuals can contribute to the search. Specifically, the number of seeds
produced by plant
i is computed as follows:
where
and
denote the minimum and maximum ranks in the population, respectively. This formulation ensures that higher-quality solutions (lower ranks) produce more seeds. In the degenerate case where
, all plants generate
seeds.
These seeds undergo a third operator, called spatial dispersal, which is adapted to binary decision variables and uses a bit-flip mutation operator. Given a parent solution
, an offspring
is generated by independently flipping each decision variable with probability
:
The spatial dispersal mutation probability
decreases non-linearly over iterations, shifting the algorithm from broad exploration to local exploitation:
where
is the current iteration,
is the maximum number of iterations, and
l is a non-linear modulation exponent. This schedule enables a gradual transition from broad exploration to local exploitation.
The final operator is competitive exclusion and constraint handling, which activates once the maximum population is reached. After seed generation and dispersal, the parent and offspring populations are merged. A feasibility filter is then applied based on the budget constraint. Only feasible solutions are retained; however, if no feasible solutions exist within the combined population, the full population is temporarily preserved. This fallback mechanism ensures that the algorithm does not terminate prematurely in highly constrained landscapes, allowing the population to steadily evolve toward the feasible zone. The population is then sorted by Pareto rank, and the poorest performers are eliminated to truncate the population to a fixed size
. Upon termination, the final Pareto front
is obtained:
Algorithm 2 shows the pseudocode of the proposed MO-IWO.
2.2.3. Best-Compromise Selection and Algorithm Performance Metrics
Once the optimizers terminate, the resulting set
represents the optimal trade-offs between total vulnerability reduction and total retrofit cost. An additional consolidation step is performed to remove irregularities induced by the discrete binary representation, ensuring a well-structured, monotonic Pareto front. Using performance indicators to evaluate the quality of the metaheuristic algorithm’s results is essential to choosing the right optimizers. In fact, they can be considered scores assigned to results to assess the performance of optimizers [
69]. In this study, performance indicators related to distribution, spread, convergence, robustness, and reliability, including HyperVolume global (HV global), Inverted Generational Distance (IGD runs), 95% Confidence Interval runs (95% CI runs), 95% Confidence Interval global (95% CI global), and system stability, were used. In addition, the CPU time that the processor has spent executing the algorithm was taken into account. For more details about the performance indicators, refer to
Section S2 of the Supplementary Material [
69,
70].
| Algorithm 2 Multi-Objective Invasive Weed Optimization (MO-IWO) |
- Input:
- Output:
Pareto front of optimal solutions
- 1:
Initialization (IWO Operator 1): - 2:
Generate initial population of size - 3:
for each individual p in do - 4:
Randomly initialize binary position - 5:
Evaluate objectives: vulnerability and cost - 6:
end for - 7:
for to do - 8:
Compute mutation parameter: - 9:
- 10:
Pareto ranking: - 11:
Compute Non-dominated Sorting ranks for all individuals in - 12:
Reproduction (IWO Operator 2) and Spatial Dispersal (IWO Operator 3): - 13:
- 14:
Determine and - 15:
for each individual in do - 16:
if then - 17:
- 18:
else - 19:
- 20:
end if - 21:
- 22:
for to S do - 23:
Create child solution by copying - 24:
Apply spatial dispersal bit-flip mutation with probability - 25:
Evaluate child objectives - 26:
Add child to - 27:
end for - 28:
end for - 29:
Competitive exclusion (IWO Operator 4): - 30:
▹ Merge parents and offspring - 31:
solutions in with cost - 32:
if is empty then - 33:
▹ Allow evolution toward feasible zone - 34:
end if - 35:
Compute Pareto ranking on - 36:
Sort solutions by rank ascending - 37:
Select top solutions - 38:
Update selected solutions - 39:
Compute current Pareto front size with - 40:
end for - 41:
Post-processing: - 42:
Extract final Pareto front from - 43:
Apply non-dominated filtering to consolidate Pareto front - 44:
return Pareto front
|
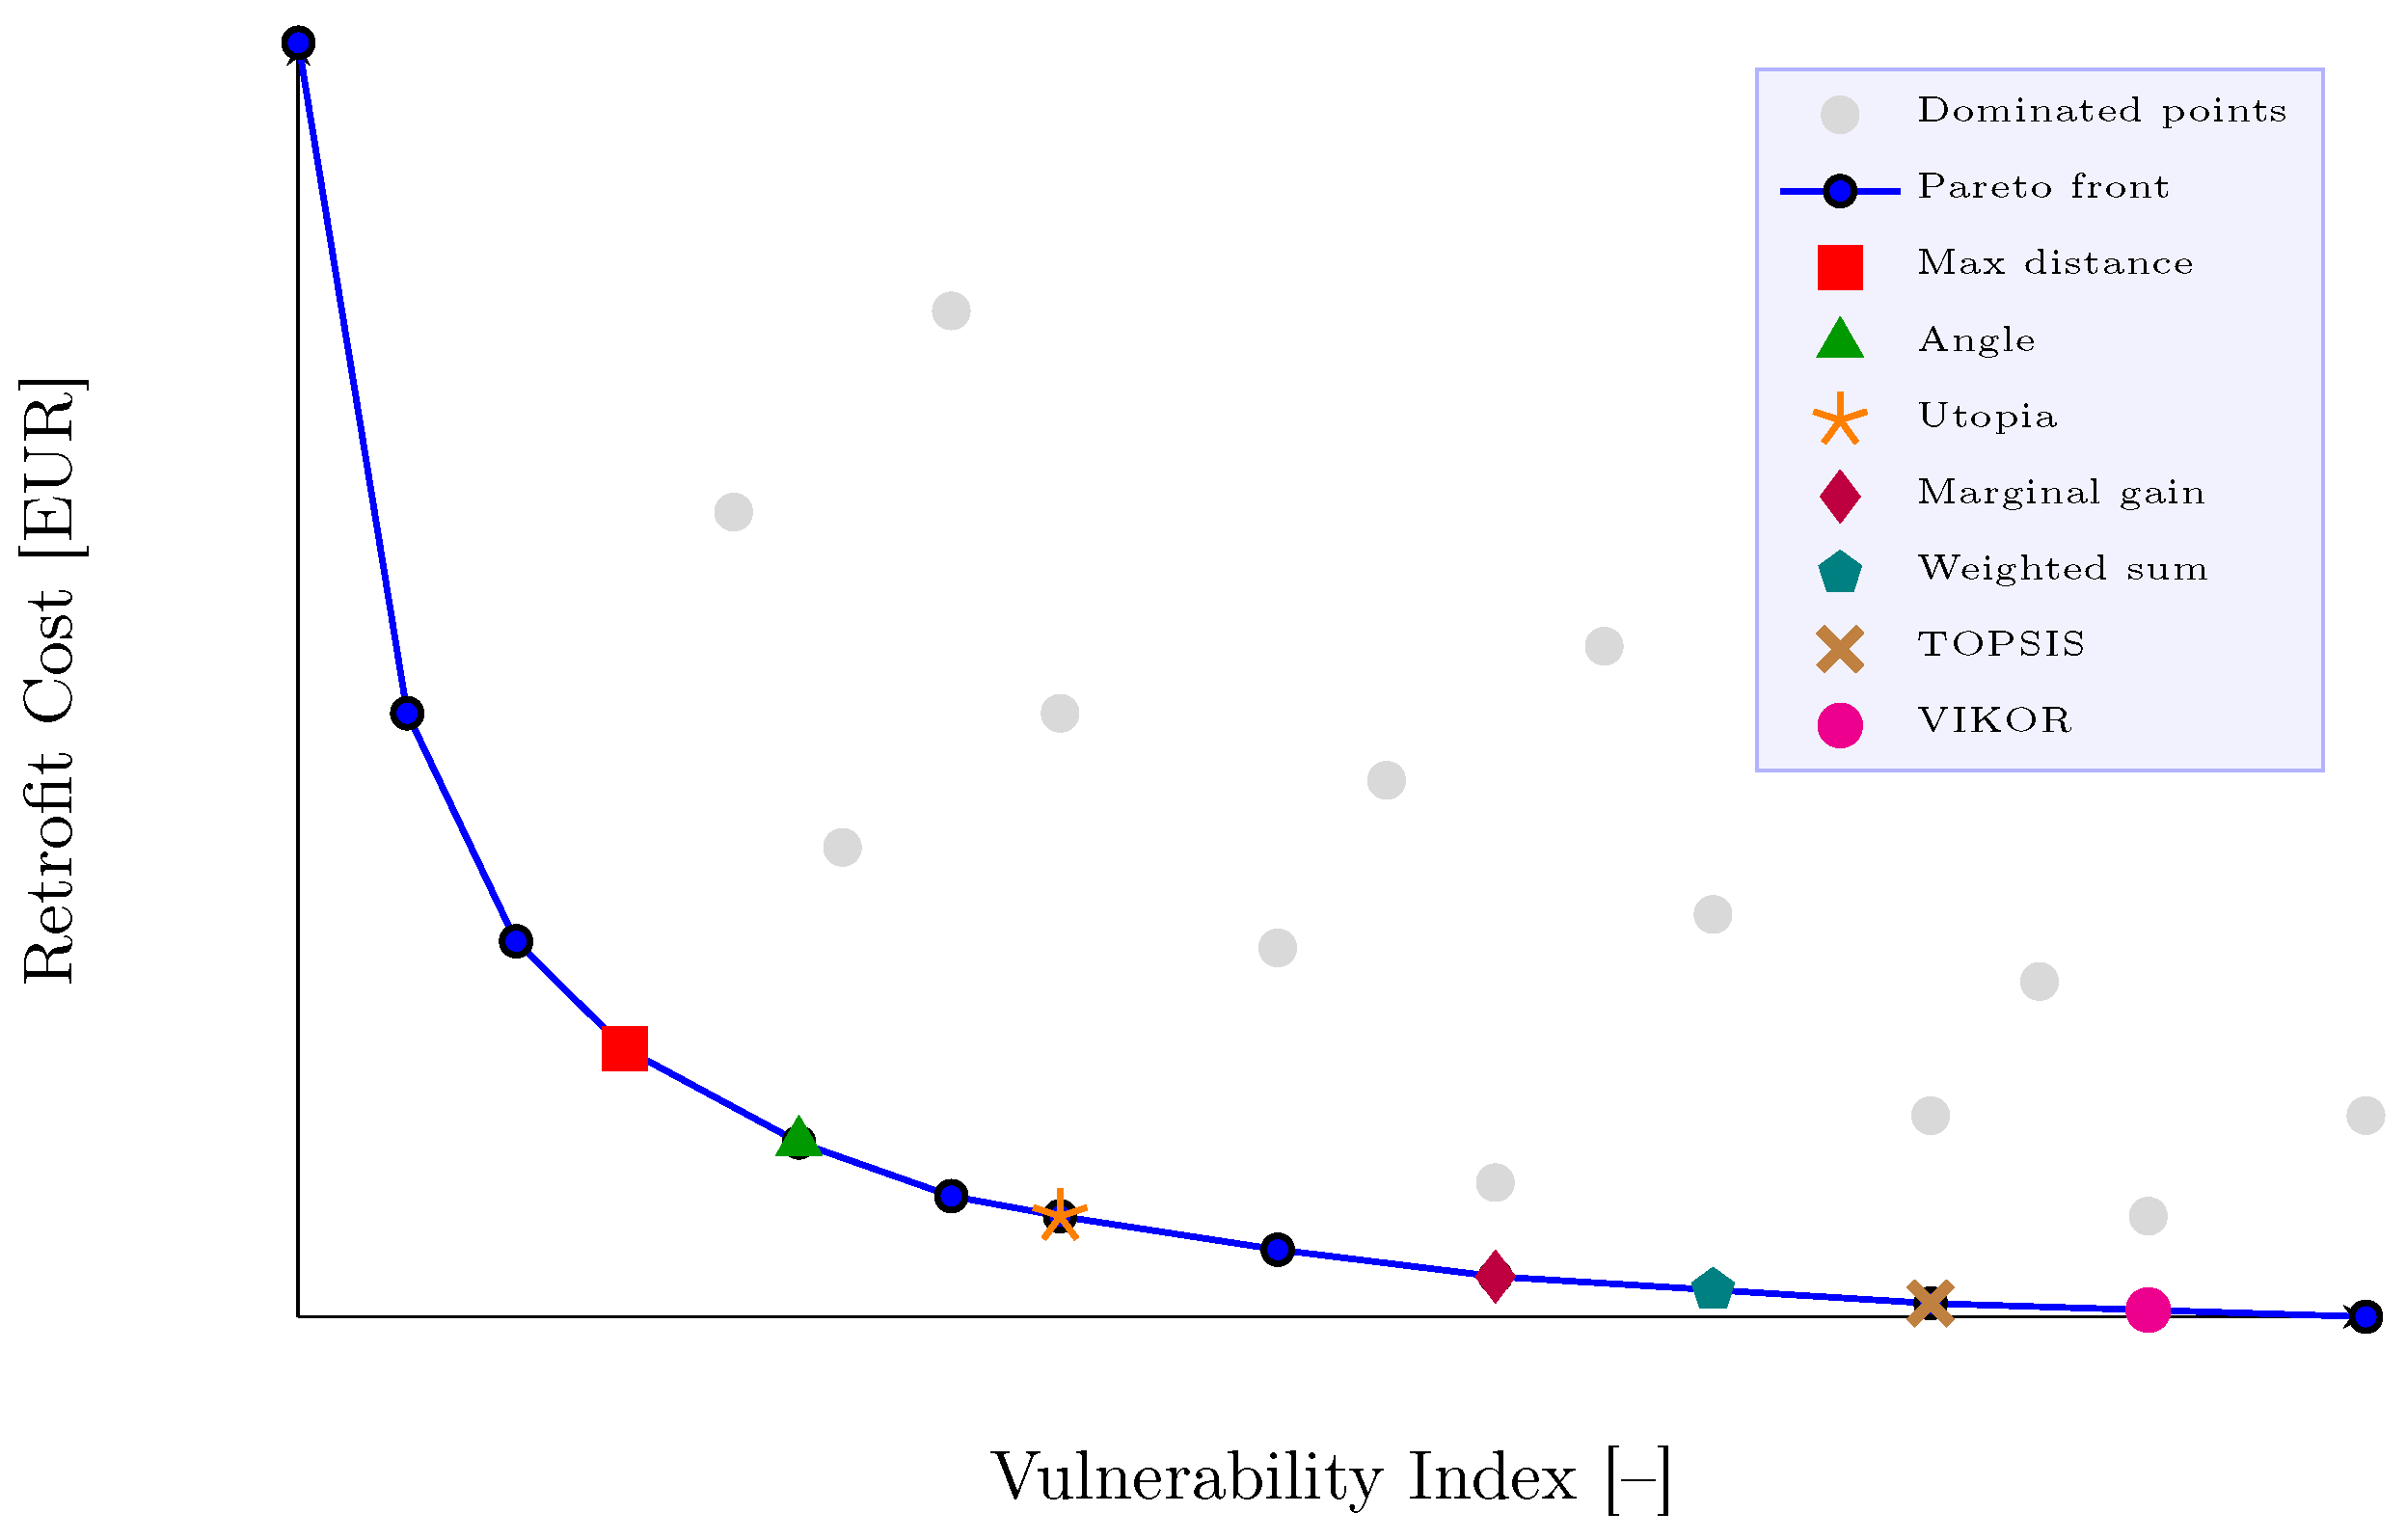
In the final stage, an ensemble of methods was applied to extract the best-compromise solution from the Pareto-optimal set, as shown in
Figure 2. Specifically, these methods are categorized into geometric (e.g., max distance, angle, and utopia methods), economic (e.g., marginal gain and weighted sum methods), and MCDM (e.g., Technique for Order of Preference by Similarity to Ideal Solution (TOPSIS) and Vise Kriterijumska Optimizacija I Kompromisno Resenje (VIKOR)) approaches. These were compared to assess their robustness and suitability for identifying the most balanced trade-off solution in the Pareto front. In particular, some of them are oriented toward finding the so-called knee point, the solution at which improvements in one objective would entail large sacrifices in the other [
71], especially for geometric and economic approaches. To ensure a fair comparison and avoid scale distortions arising from different units of measurement (total cost [EUR] vs. dimensionless total vulnerability index
), all objective values were normalized to the [0, 1] interval using Min–Max scaling before applying the selection methods.
As a first approximation, the methods that require assigning weights (e.g., weighted sum, TOPSIS, and VIKOR) to the two objectives, an equal weight (
;
) was assigned. In particular, by applying the Analytic Hierarchy Process (AHP) [
72], considering the 2 objective functions, the pairwise comparison matrix is 2 × 2, and the maximum eigenvalue is equal to the number of objective functions (in this case, 2 objective functions), which leads to a Consistency Ratio (CR) always equal to 0. It means that only two cases are available:
or
. This is due to the intrinsic limitation of the AHP method when applied to only two criteria; therefore, further studies are required.
In addition, to evaluate the robustness of the proposed framework, a sensitivity analysis was performed on the optimal retrofit plan generated by the MO-IWO algorithm. The analysis followed a one-at-a-time (OAT) approach, where each decision variable was perturbed individually to assess its impact on the scalarized objective function. To ensure consistency with the main optimization results, the sensitivity analysis was conducted using the same hyperparameters as the 20-run optimization (e.g.,
,
, etc.). Among the feasible points, the TOPSIS method was employed to select the baseline optimal solution from the Pareto front. Starting from this configuration, two sensitivity metrics were computed. A binary flip analysis was applied to all variables by toggling each decision (0<–>1). Also, a local sensitivity index was calculated for active variables (
) by applying a
perturbation under a continuous relaxation, treating the binary variables as continuous in the range [0, 1] solely for this assessment. Finally, the variables were ranked by the absolute sensitivity index, with higher values indicating greater influence on the optimization outcome:
where
is the baseline scalar objective value,
is the variation in the scalarized objective function resulting from the perturbation of a decision variable,
is the optimal decision state for action
a on building
b which for the baseline is set to 1, and
is the local perturbation (
).
2.3. Agentic AI: Modeling and Implementation
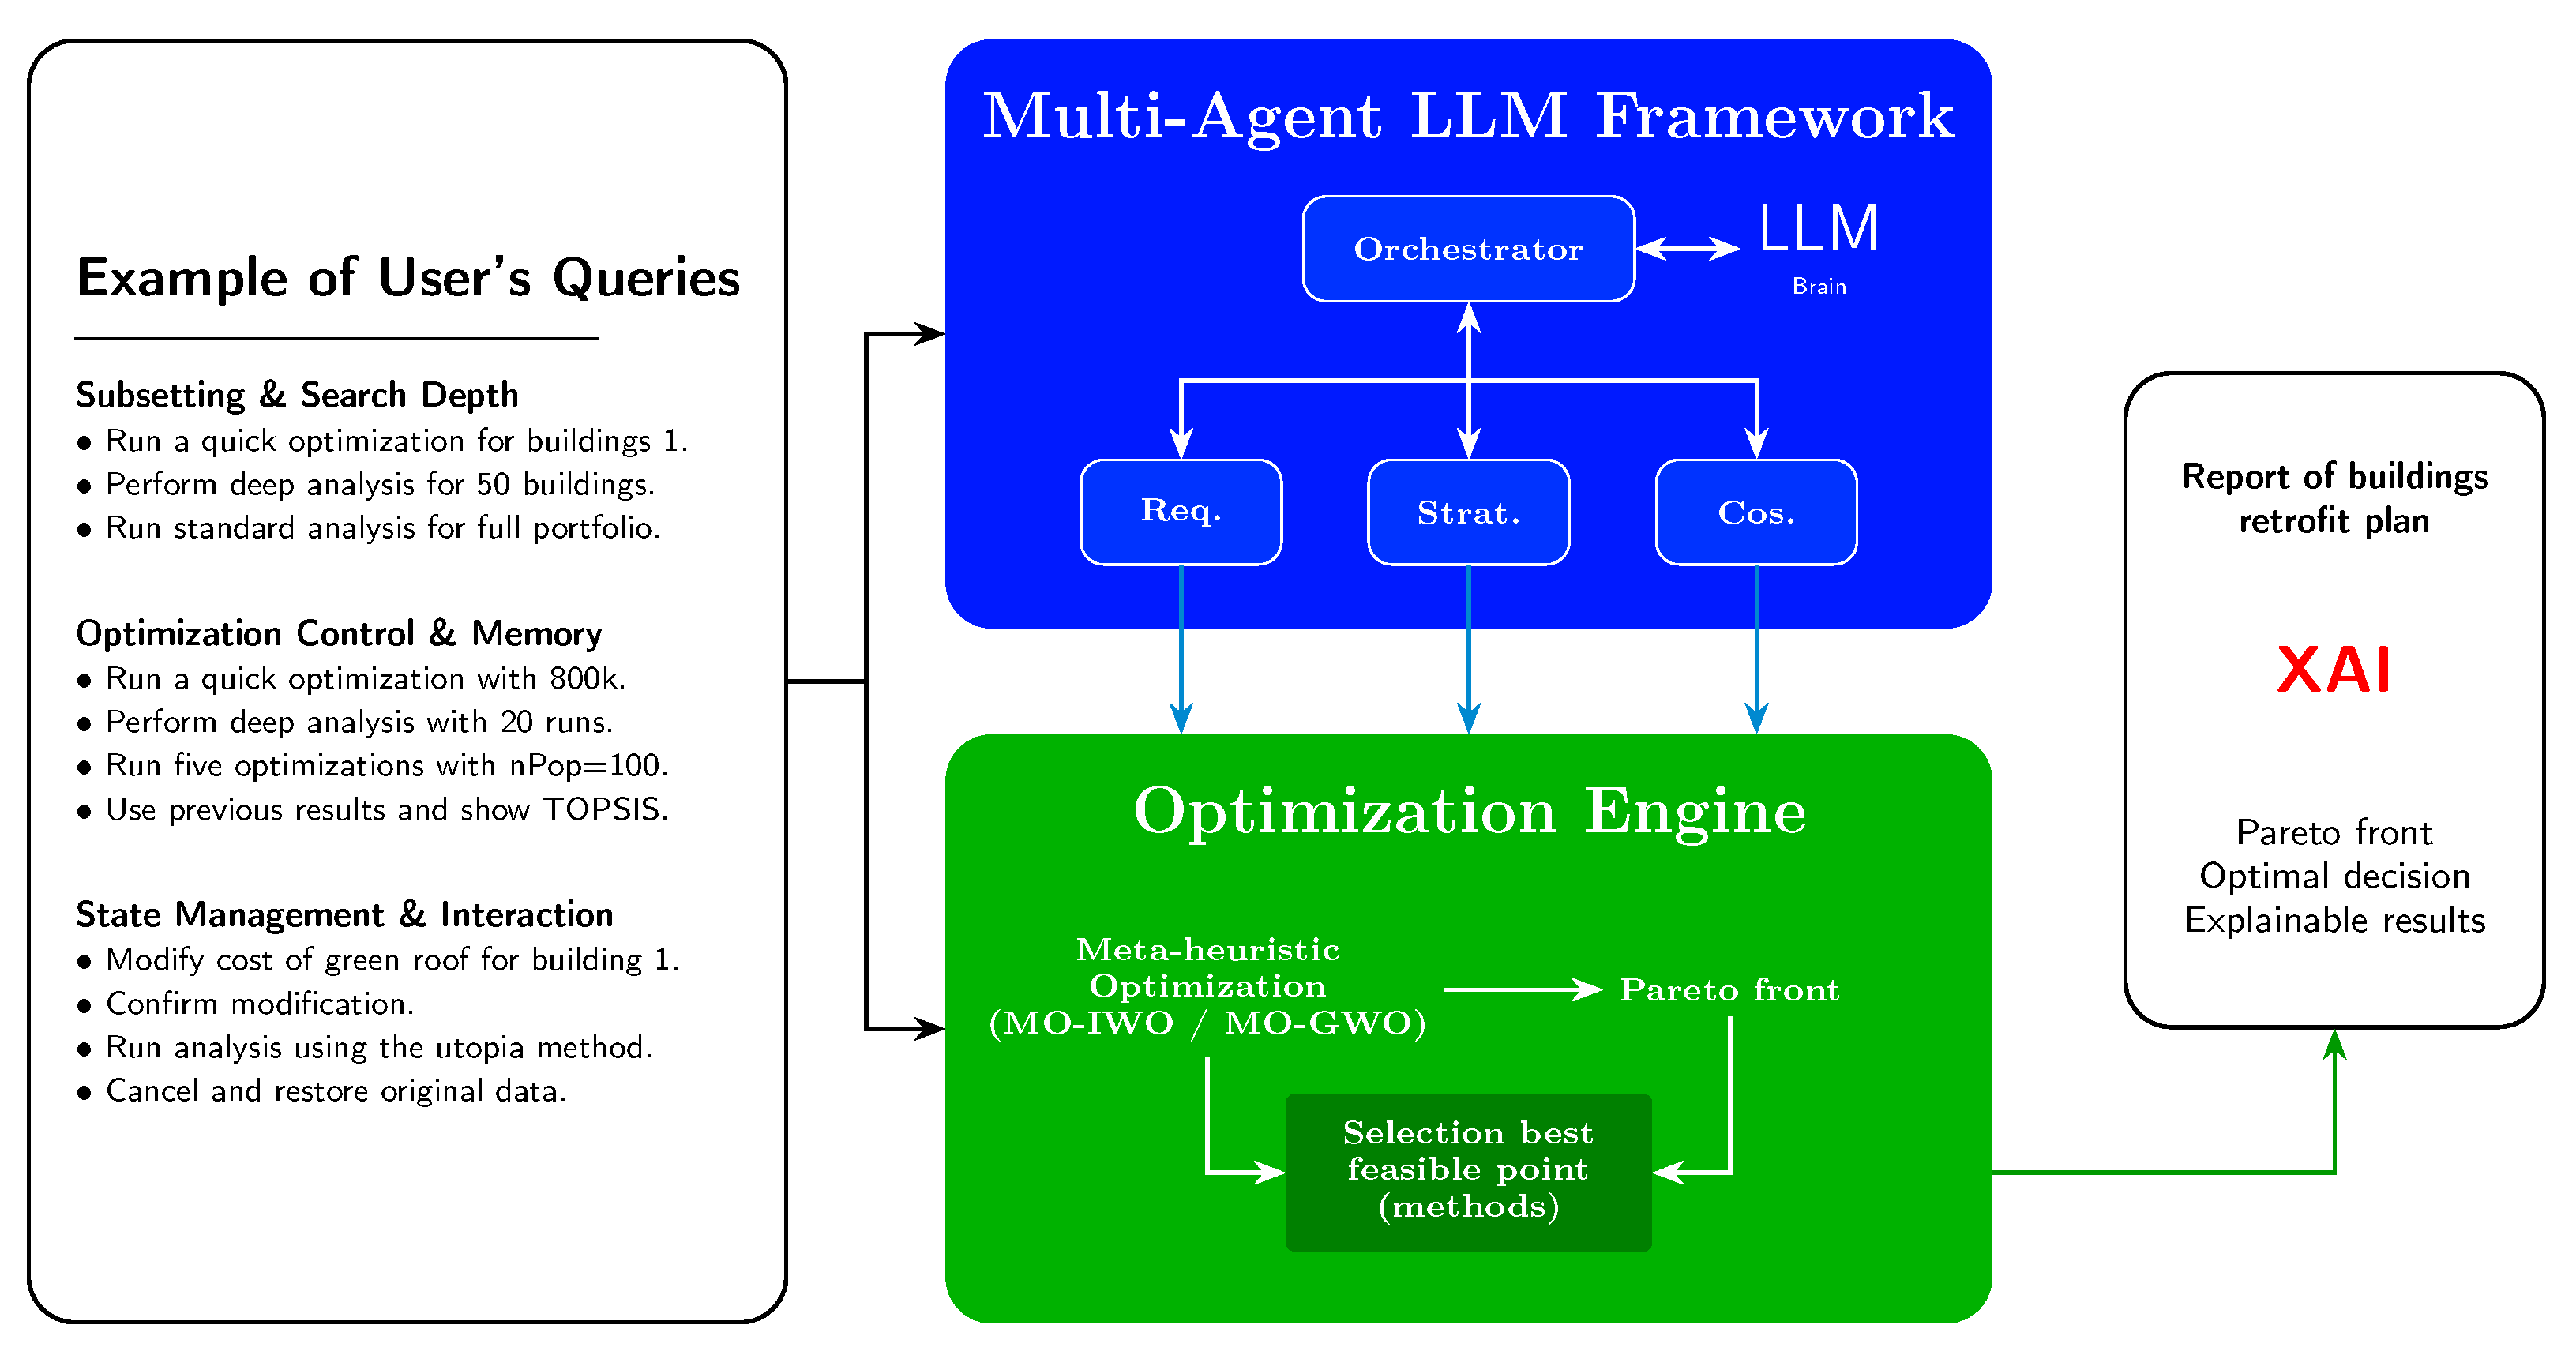
This framework comprises multiple modules within a multi-agent architecture, as shown in
Figure 3. Specifically, the term multi-agent refers to an environment in which specialized subagents collaborate to address more complex problems, coupled with a holistic approach. Typically, a primary agent, referred to as the Orchestrator, coordinates and delegates tasks to subagents concurrently to achieve the overarching goal [
36,
79]. In fact, specialized subagents extract critical information from the user’s query to facilitate effective goal attainment [
80].
The Agentic-AI framework developed in this study is described below:
Orchestrator (Optimizer Global Configuration): This primary agent aggregates the four subagents’ structured outputs into a global configuration optimizer. At the same it manages the fallback logic; if something is not specified in the query, it calls the default value or the previous memory. After each of the three subagent extracts its parameters, the Orchestrator uses these values to guide the optimizer, which relies on the information taken from the user’s query. Once the MOO algorithm generates the optimal Pareto front, the system applies the user-selected decision method or comparison to identify the solutions, which are then forwarded to a fourth subagent that can humanize the results.
Requirements Agent (Compliance Officer): This subagent analyzes the query to identify the buildings specified by the user. It applies strict rules to prevent misinterpretation of other elements within the query.
Cost Agent (Financial Controller): This subagent extracts the budget limit specified by the user and incorporates a parsing layer to standardize numerical notation (e.g., converting 15 k to 15,000). In the absence of a detected budget limit, a default value is imposed.
Strategy Agent (
Decision Analyst): This subagent determines from the user query the preferred method (e.g., TOPSIS; VIKOK) for selecting the optimal solution or a comprehensive methods comparison. It also indicates whether the user intends to conduct a single or in-depth analysis by specifying the number of runs and whether the algorithm operates in fixed or stochastic mode (autotuning in a range). This subagent also decides whether to utilize default values or reuse prior results by implementing context persistence. In particular, if the user does not specify buildings or budget in a second query, the system reuses the previous output and avoids the computational efforts of recalculating the Pareto front. Additionally, the Strategy Agent calculates the weight of each objective function. The weight (
w) of the cost criterion is then strictly defined as its complement (
). In fact, the subagent can translate qualitative preferences (e.g., maximum security) into quantitative weights using AHP logic, mapping Natural Language Processing (NLP) to precise numerical values (e.g., 0.95 for vulnerability priority). In fact, the priority intensity Saaty scale 1–9 [
72], in the AHP process, acts as a mathematical translator between the user’s vague language and the input parameters of the optimization algorithm. This is particularly useful for methods (e.g., weighted sum, TOPSIS, and VIKOR) in which weights influence the selection of the optimal solution. In addition, it establishes the rules for modifying the database and integrating a confirmation mechanism for the user. In fact, before modifying the input database, the agent puts the action in pending and waits for explicit user approval. This ensures human safety and control (human-in-the-loop).
XAI Agent (Explainer): This subagent receives numerical results from the MOO, including total cost, vulnerability, selected retrofit actions, and quality metrics. It can translate and explain the results in NLP by generating a report that contextualizes trade-offs, justifies selected retrofit actions based on the reduction in vulnerability per euro spent, and compares at least two competing strategies. In addition, if the user’s query contains report-related keywords, a dedicated module generates a structured PDF document that incorporates LLM advice, an action plan, and scientific quality metrics (e.g., HV global, CPU time, and system stability) to demonstrate the reliability and stability of the optimization results.
Algorithm 3 presents the pseudocode of the proposed Agentic AI framework.
| Algorithm 3 Multi-Agent Optimization (MAO) for Buildings Climate Adaptation |
- Input:
Query Q, database , memory M, Runs N - Output:
Report R, analysis figures F
- 1:
function KPI_Orchestrator() - 2:
Extract and B (fallback to M if missing) - 3:
Identify and Deep - 4:
Derive and via Saaty scale (AHP) - 5:
return - 6:
end function
- 7:
- 8:
if
then - 9:
for to N do - 10:
Sample - 11:
- 12:
- 13:
end for - 14:
- 15:
; Compute CI; store F - 16:
else - 17:
- 18:
end if
- 19:
- 20:
Map to retrofit actions - 21:
Generate an explainable report based on cost–safety trade-off - 22:
return
|
The Agentic AI layer is implemented as a typed orchestration pipeline around the optimization engine. The LLM is accessed through a Groq API wrapper (LLMService) using the qwen/qwen3-32b model. Calls are performed with temperature = 0 and JSON-object response mode, so that agent outputs can be parsed deterministically and validated before being used by the optimizer. The LLM is therefore not responsible for solving the optimization problem. Instead, it translates user intent into structured parameters and generates a post hoc explanation after the numerical optimization has been completed.
After the questions through the user query
q, the orchestrator invokes four specialized subagents, as shown in
Table 3:
The outputs of the first three agents were validated using Pydantic models (Requirements Output, Cost Output, and Strategy Output) and then merged into a global configuration object (OptimizerGlobalConfig). This object controls data filtering, budget assignment, IWO parameters, single-run or stress-test execution, and the MCDA method used to select a final solution from the Pareto front. The collaboration mechanism is therefore not an unconstrained conversation among agents; it is a sequential, schema-constrained workflow in which each subagent contributes one part of the shared optimization state. A session memory object stores previous budgets, selected building filters, pending data edits, and Pareto-front metadata to support follow-up queries. The XAI component is implemented as post hoc, decision-level interpretability.
First, the optimization engine exposes the objective decomposition for every candidate solution: total residual vulnerability and total retrofit cost. Second, the MCDA layer provides transparent selection rules, including the max distance, utopia, marginal gain, weighted sum, TOPSIS, VIKOR, and angle-based selection. Third, repeated-run stress tests report robustness indicators such as HV, IGD, system stability, and CI. Finally, the XAI Agent receives a structured summary containing the selected methods, cost, residual vulnerability, selected actions, and stability metrics, and returns a constrained engineering interpretation. Thus, interpretability is provided through traceable numerical criteria and a human-readable explanation of the selected retrofit plan, not through black-box attribution of the LLM internals.
2.4. Autonomous Metaheuristic Optimization Using Agentic AI
The integration of the metaheuristic engine into the multi-agent framework is central to the proposed framework’s optimization process. While this study employs MO-IWO, the framework is conceived to support a diverse optimization engines.
The Agentic AI manages the interaction between the optimizer model and the end-user to solve the two conflicting objective functions: total vulnerability () and total cost (). Unlike traditional optimization problems that require expert manual hyperparameter tuning, Agentic AI aims to bridge the gap between NLP user queries and the algorithm’s mathematical formulation and execution. In particular, this integration is achieved through three main functions: automated configuration (hyperparameter tuning), stochastic execution control (hyperparameter tuning range), and stability validation. The above-described Orchestrator agent translates the subagents’ output into a main input for the optimization engine. In fact, this process automates the selection of optimization constraints, such as the budget limit and the specific building IDs extracted from the Requirements Agent and Cost Agent. In addition, thanks to the intensity Saaty scale, the Strategy Agent can convert NLP judgments (e.g., “Try to save as much money as possible”) into a mathematical input for the algorithm.
Moreover, if the user requests a deep analysis and expresses uncertainty about the parameters, the Strategy Agent automatically switches from a single-run execution to a robust multi-run stochastic mode. This involves dynamically adjusting the MO-IWO hyperparameters, ensuring that the search space exploration is appropriate to the problem’s complexity. Notably, if the user is an expert and requires specific hyperparameters, the agent can set their value based on the query. After the hyperparameters are set, a Pareto front is generated, representing the set of non-dominated solutions across the two objective functions.
A distinctive feature of this integration is the implementation of performance metrics, explained in
Section S2 in the Supplementary Material [
69,
70]. In fact, when the Strategy Agent triggers a deep analysis, the system not only provides the user with solutions but also evaluates the optimizer’s performance. This ensures that the human-in-the-loop is informed not only about the Pareto front and the best feasible points, but also about the reliability of the optimization process concluded.
Crucially, if the user requests to change input parameters (e.g., the initial vulnerability of one building or the cost of retrofitting one building), the Agentic AI proposes a pending edit, which is finalized with explicit user confirmation, thereby maintaining strict governance of the process data. After confirmation, the Agentic AI creates a new input version, inputdataV1.xlsx, for use.
Lastly, the integration enables context persistence in memory; if the user modifies a minor detail (e.g., changing a decision method from TOPSIS to VIKOR) without altering the constraints, the Agentic AI avoids heavy computations by reusing the previous Pareto front from memory.
3. Results and Discussions
3.1. Buildings’ Retrofit Action Optimization
The MO-GWO and MO-IWO algorithms, introduced in
Section 2.2.1 and
Section 2.2.2, were used to minimize two objective functions that represent total vulnerability (Equation (
5)) and total cost of retrofit actions to adapt buildings to climate change (Equation (
6)).
The hyperparameters used to run these algorithms are detailed in the
Table 4 below.
To integrate the superior algorithm in the framework (presented in
Section 2.3) multiple performance indicators (
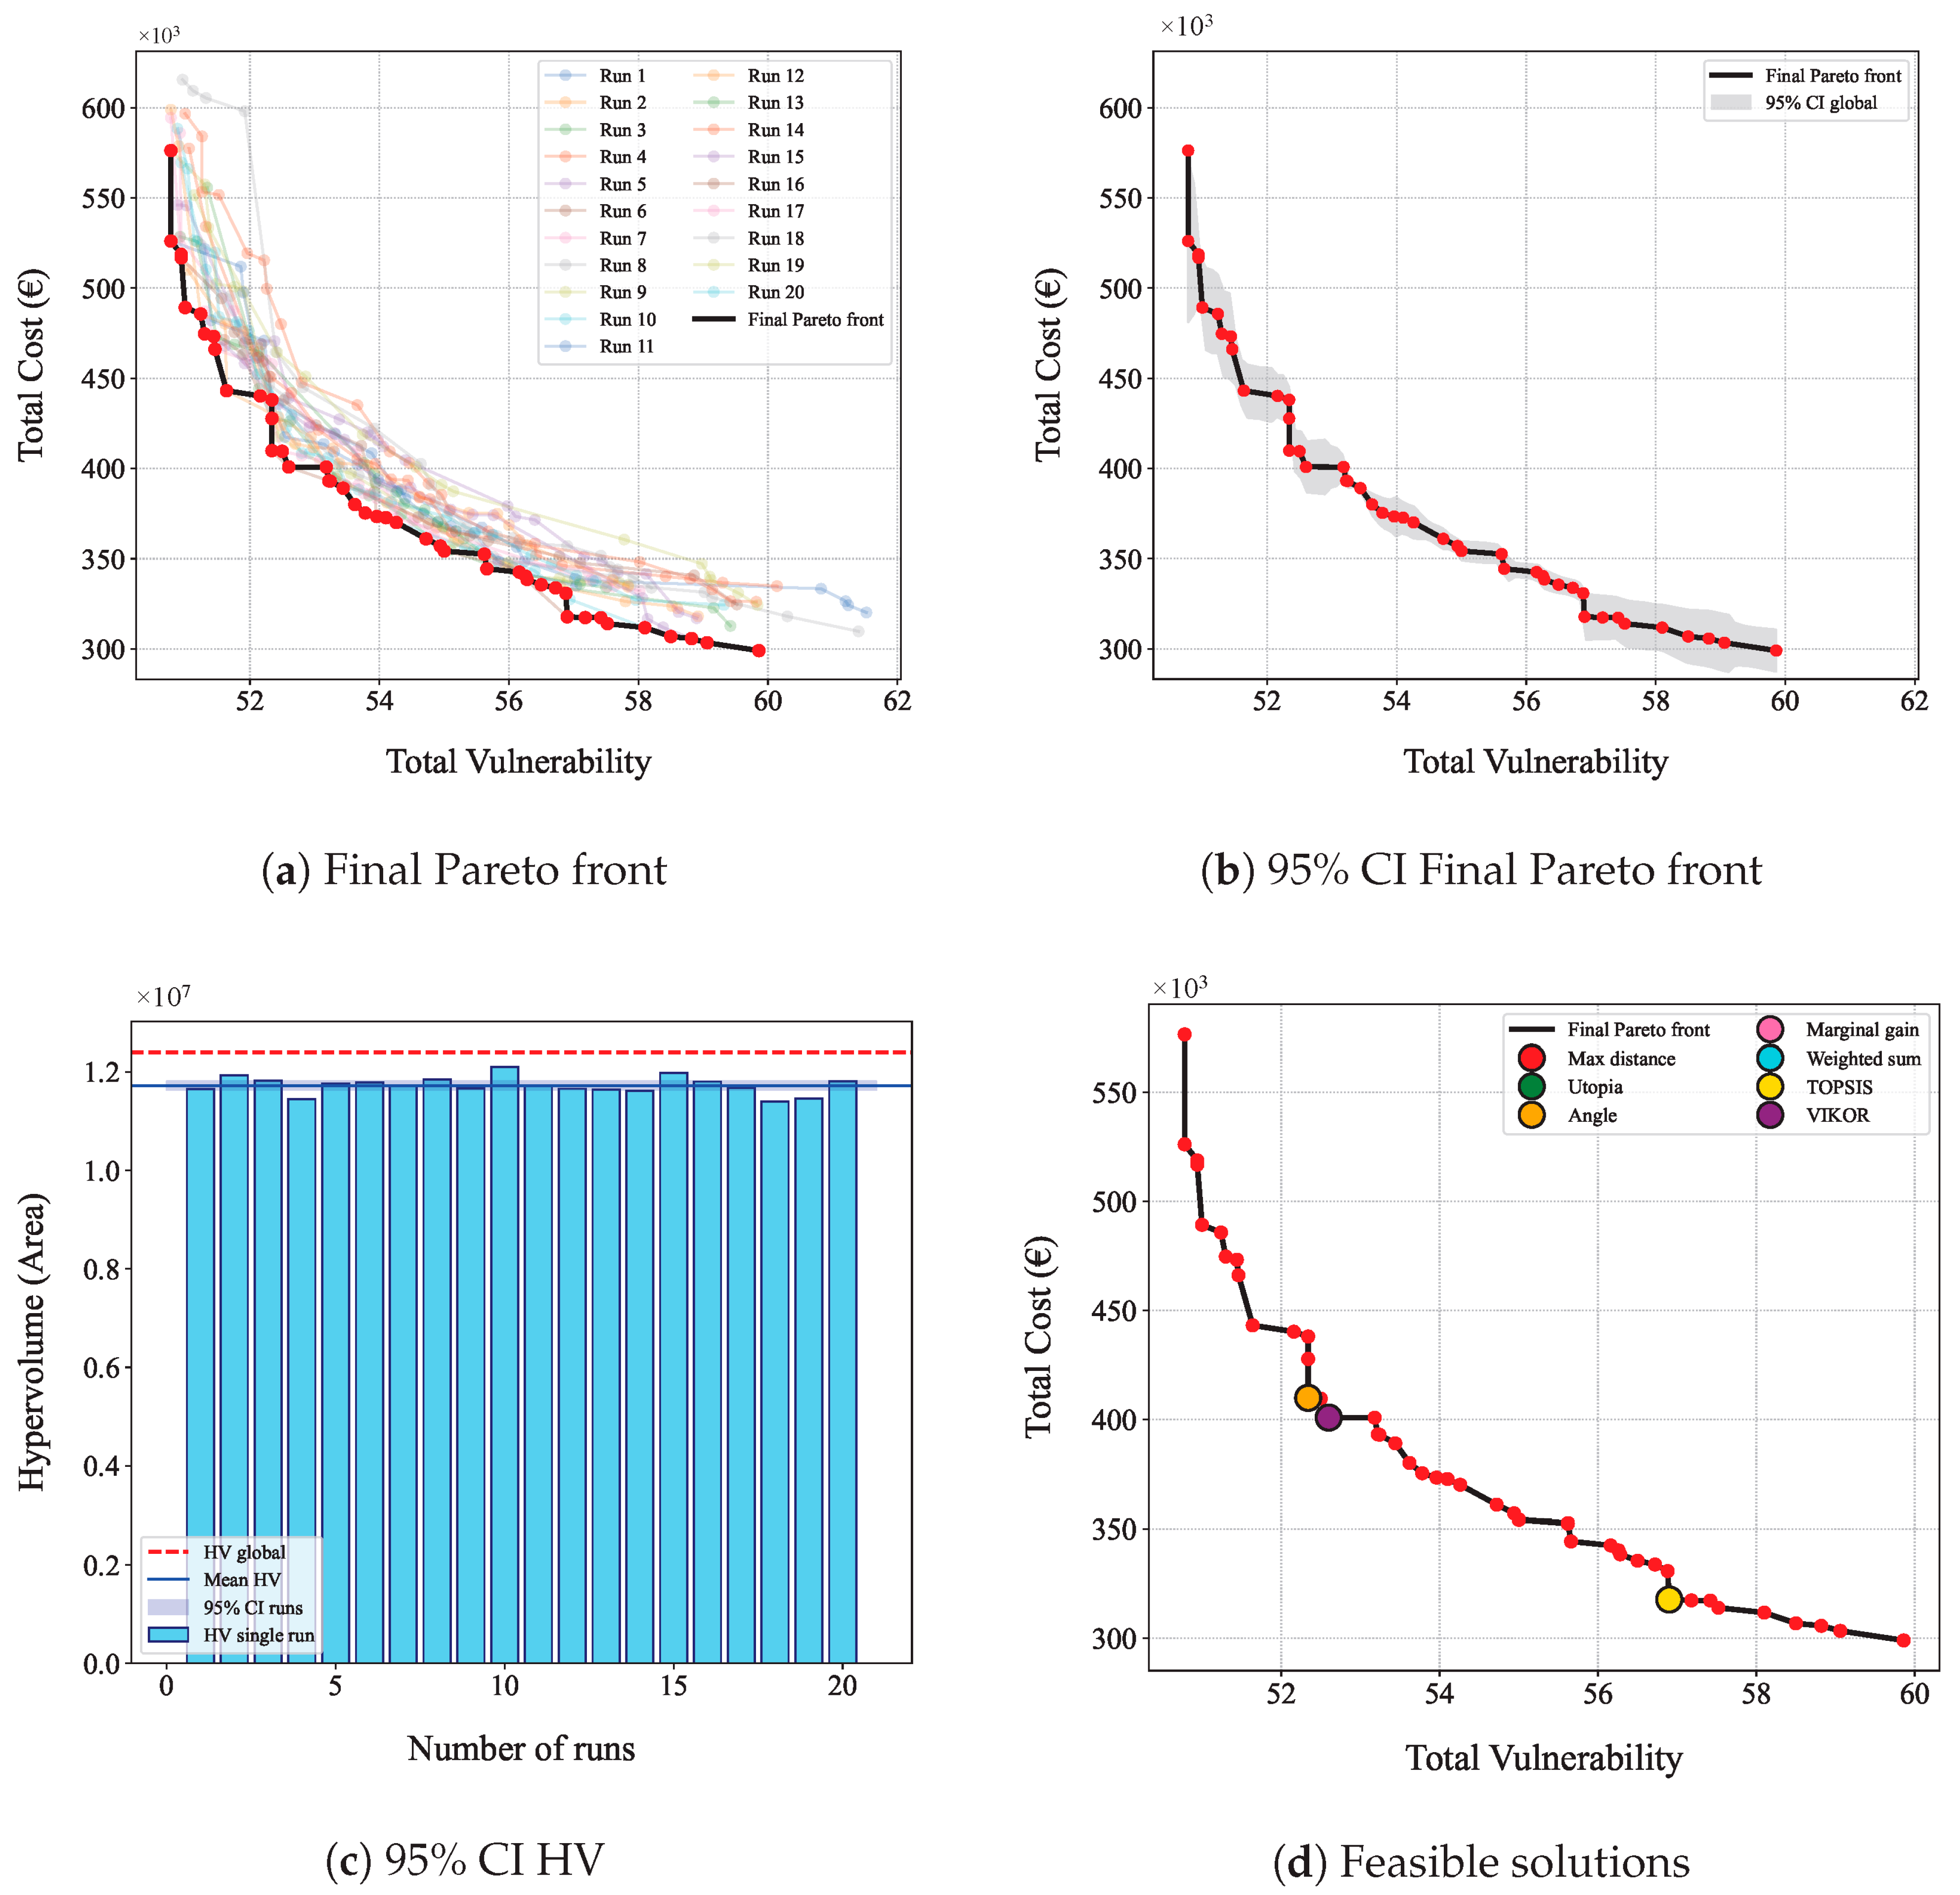
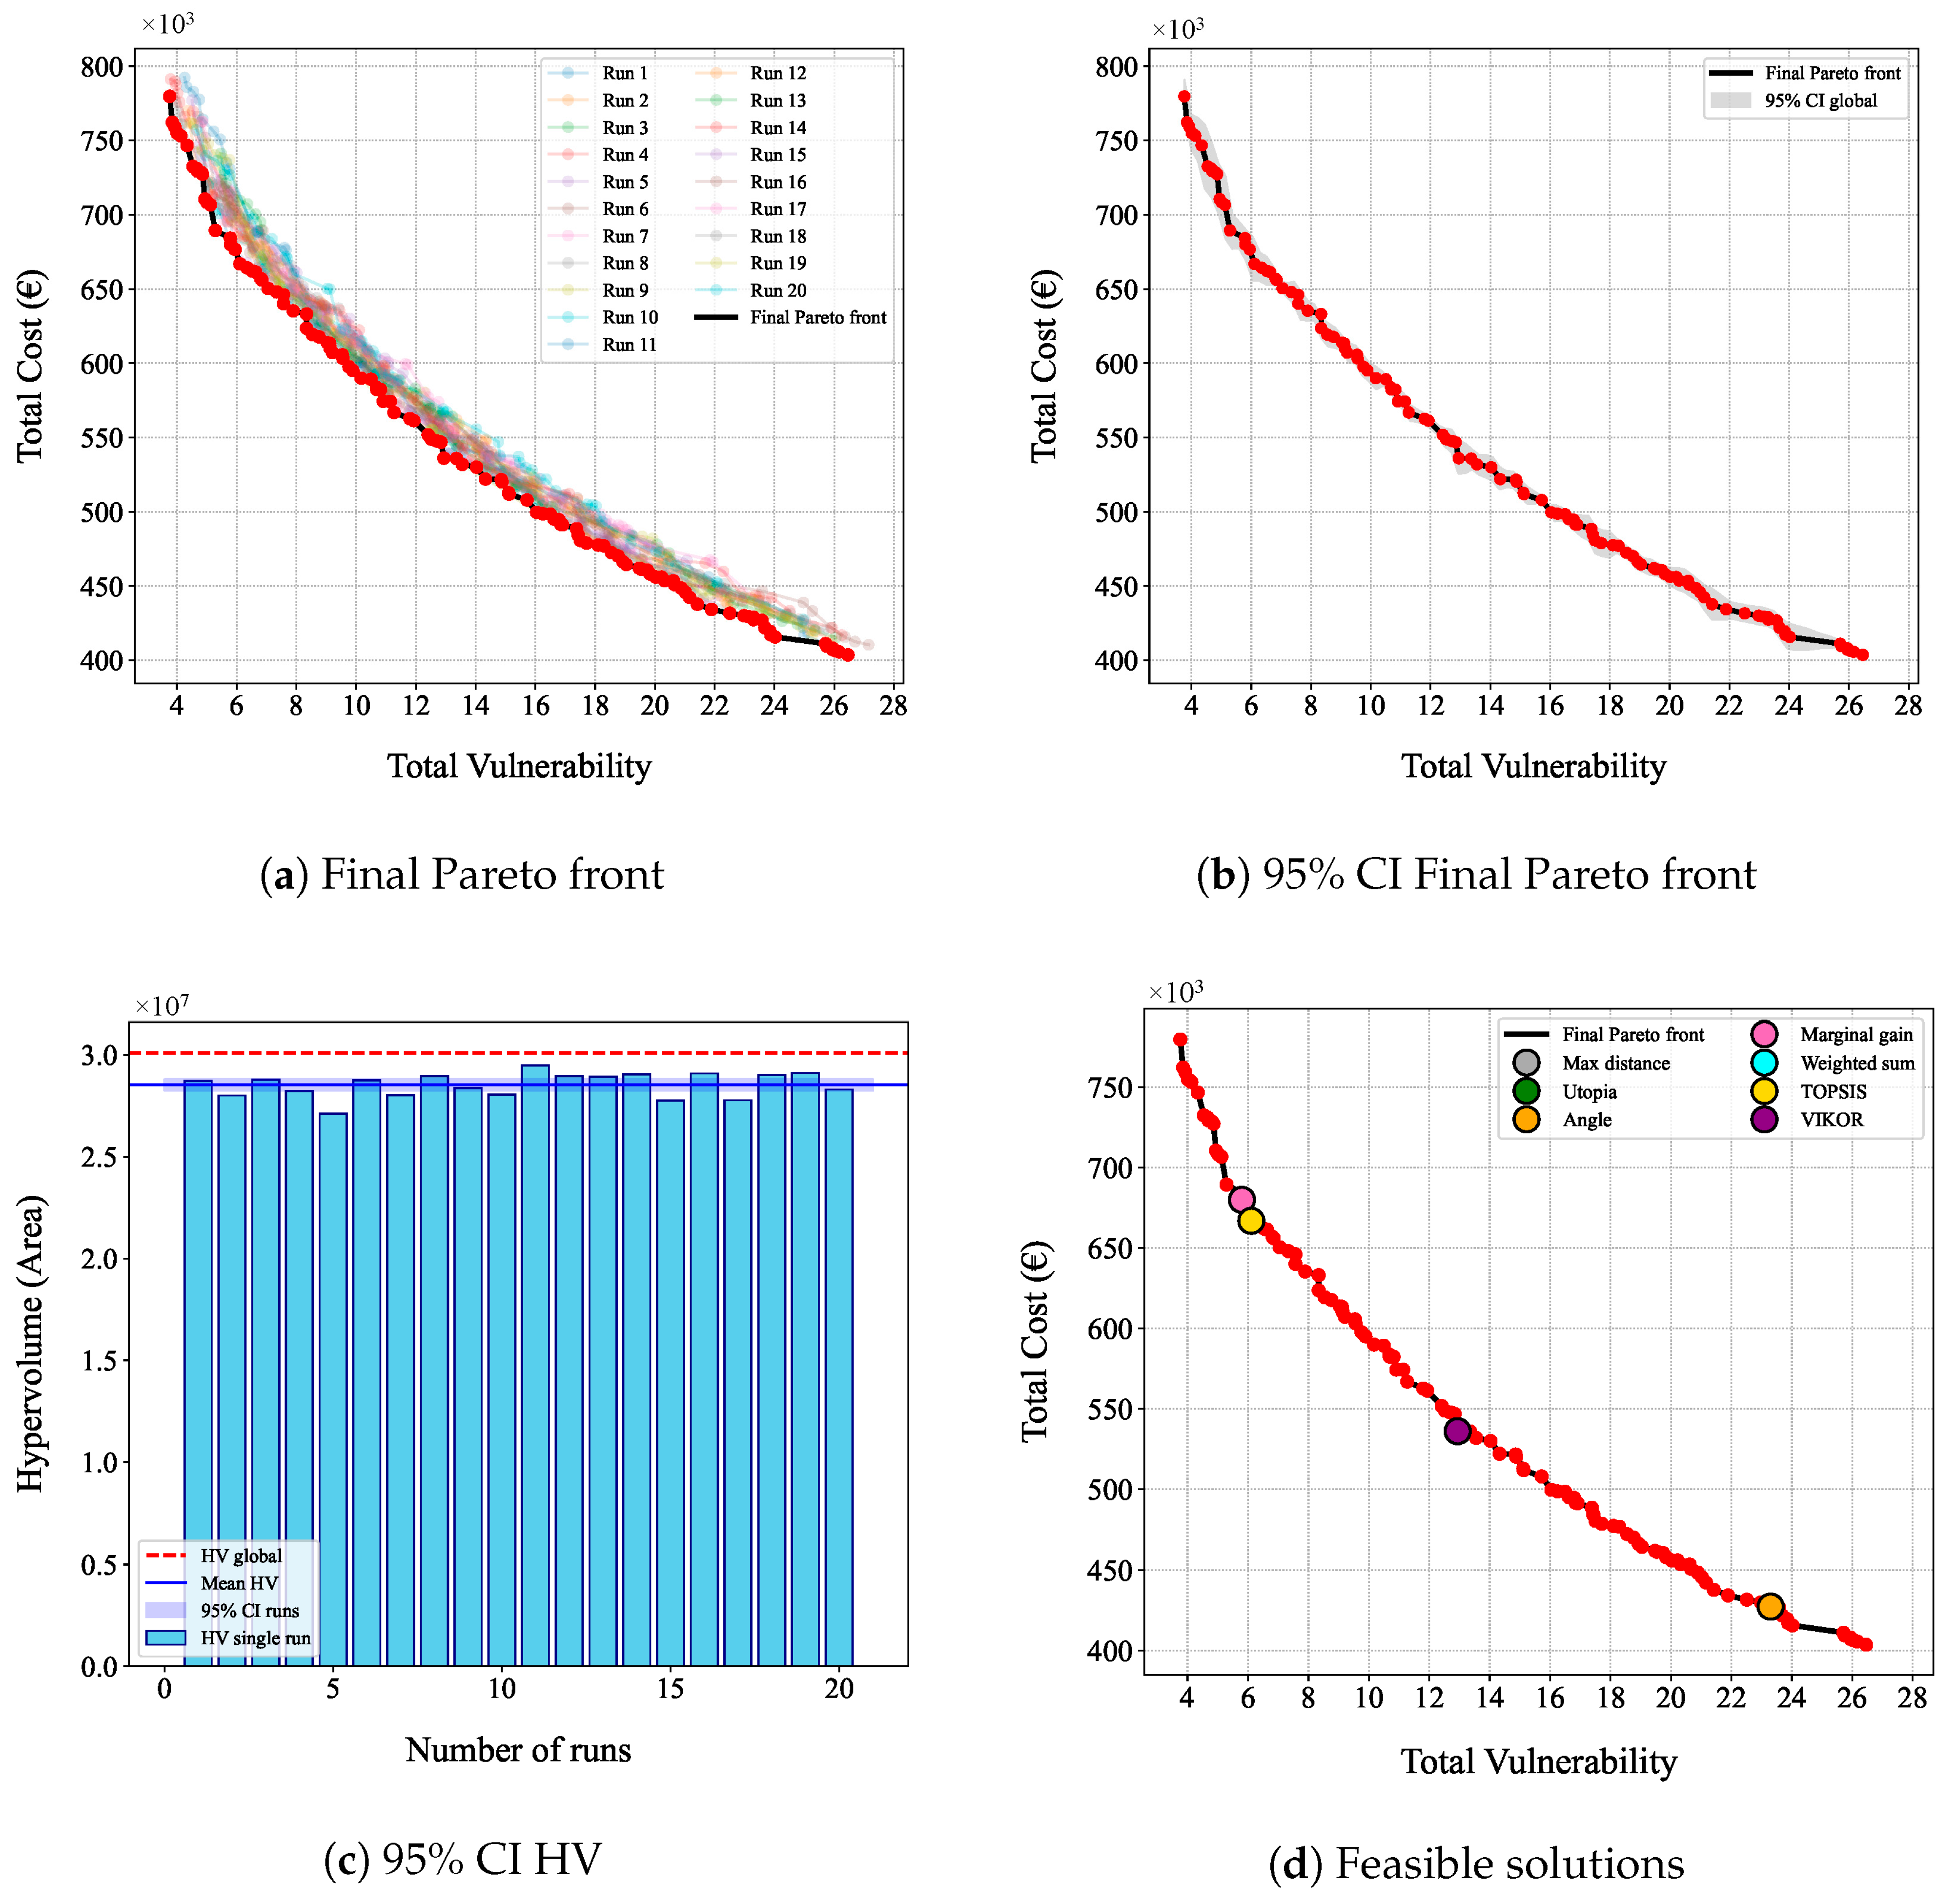
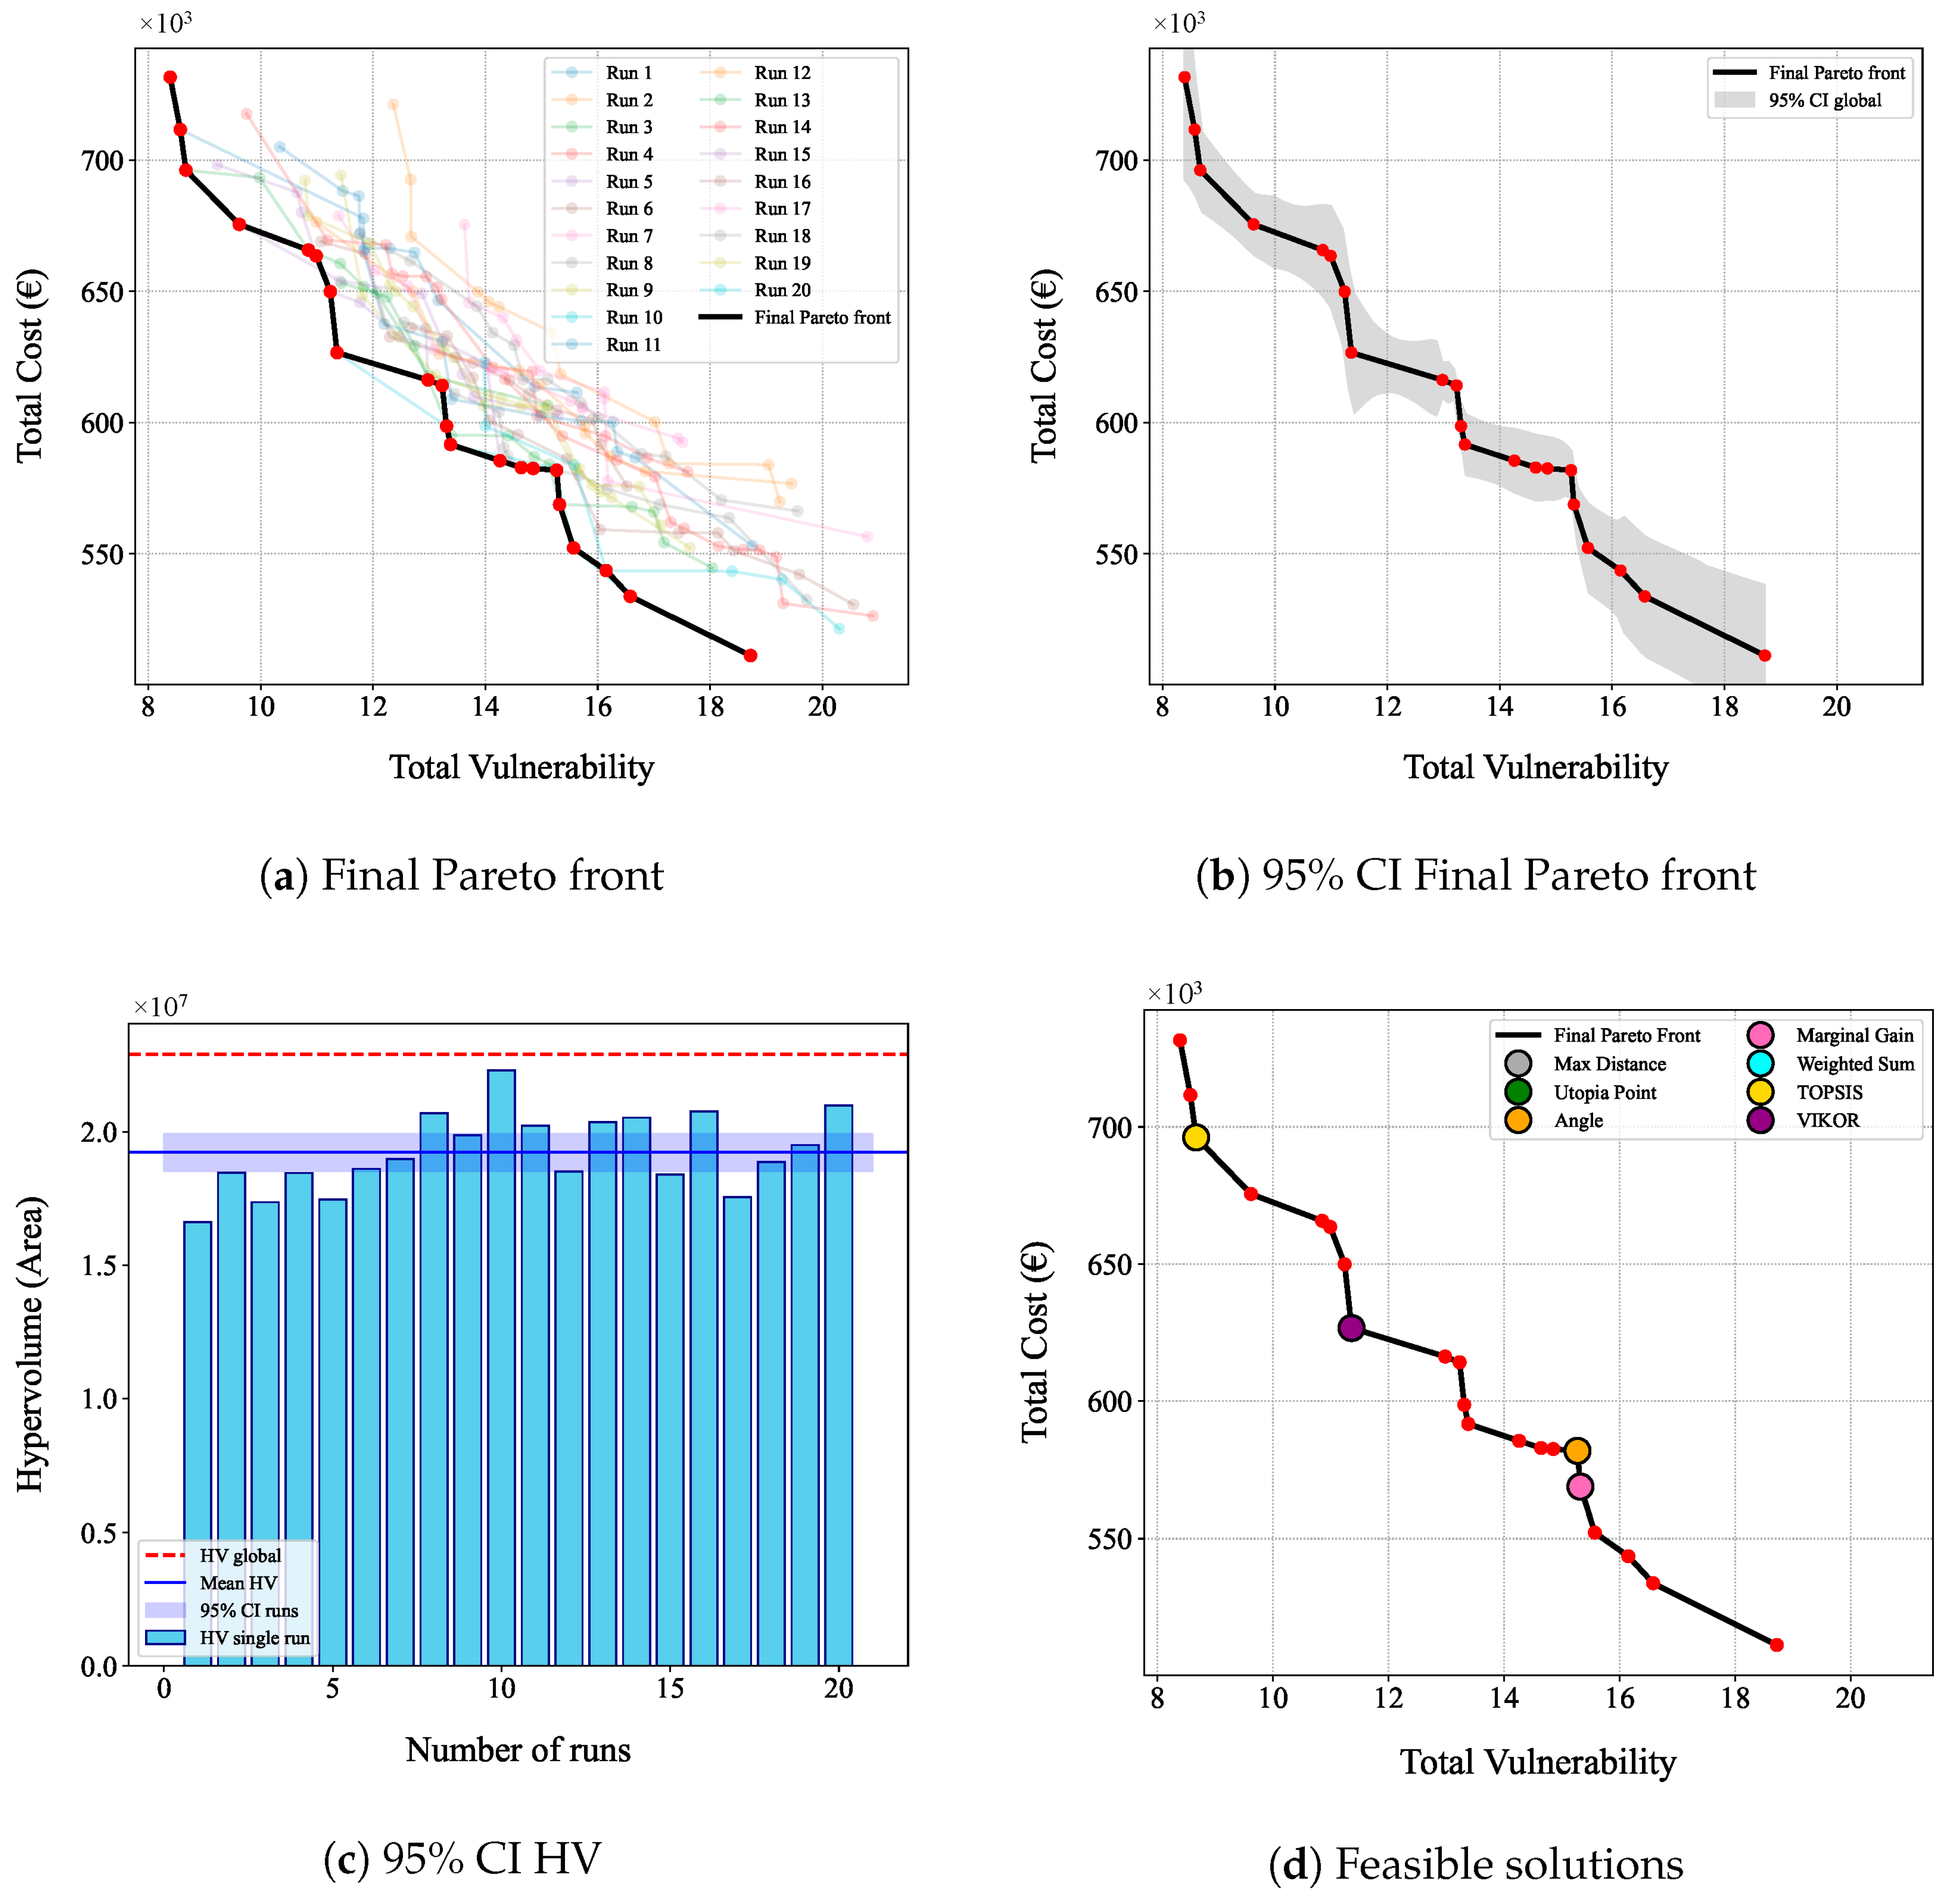
Section 2.2.3) were used. The performances of both optimizers were evaluated using a series of stress tests, each consisting of 20 independent runs, as shown in
Figure 4a and
Figure 5a. Subsequently, the final Pareto front was obtained by applying Pareto dominance to select feasible points from each run. This was conducted to avoid losing feasible solutions and trying to reach the global Pareto front.
The obtained results reveal that, in the case of MO-IWO (see
Figure 4a), the range of the final Pareto front varies from 3.76 to 24.46 for
, and from 403,654 to 779,683 for
; while in the case of MO-GWO (
Figure 5a), it changes from 8.39 to 18.72 for
and from 511,206 to 731,612 for
.
Subsequently, the uncertainty of the final Pareto front was assessed for both optimizers, illustrated by a gray band in
Figure 4b and
Figure 5b. The corresponding values are reported in
Table 5. Additionally, the average uncertainty of each run is taken into account and visible in
Figure 4c and
Figure 5c. In these figures, the HV global (red dashed line), which represents the occupied area in the objective space of the final Pareto front from the reference objective point (set at 10% worst of maximum total vulnerability and total cost), is compared with the HV mean, which defines the mean value of the occupied are in each run and the its corresponding 95% CI runs (purple band). Considering the significant need to provide transparent alternatives for decision-makers, the optimal solution from the results generated by optimizers needs to be selected. It is important to note that existing mathematical models cannot replace end-users’ judgments when evaluating these results. Therefore, the geometric (e.g., max distance, angle, and utopia methods), economic (e.g., marginal gain and weighted sum methods), and decision-making (e.g., TOPSIS and VIKOR methods) methods introduced in
Section 2.2.3 were employed to select the feasible solution from the final Pareto front and assess their robustness and suitability for identifying the most balanced trade-off solution, as illustrated in
Figure 4d and
Figure 5d. In particular, some of them are oriented toward finding the so-called knee point, the solution at which improvements in one objective would entail large sacrifices in the other [
71], especially for geometric and economic approaches. To select a feasible solution, ensure fair comparison, and avoid scale distortions arising from different units of measurement (total cost [EUR] vs. dimensionless total vulnerability index
), all objective values were normalized to the [0, 1] interval using Min–Max scaling before applying the selection methods.
In the case of MO-IWO, the convergence of four distinct methods (max distance, utopia, weighted sum, and VIKOR) toward the same solution ( = 12.94; = 536,055) identifies a robust knee point on the Pareto front. From an engineering and economic perspective, it represents the most efficient investment strategy. In fact, the vulnerability reduction is minimized relative to the capital expenditure. Conversely, the marginal gain ( = 5.80 and ) and TOPSIS ( = 6.11 and = 666,877) methods prioritize high reduction in vulnerability, pushing toward a resilient approach with higher budgets. In contrast, the angle ( = 23.30 and = 427,323) method identifies a conservative financial scenario. This spectrum of alternatives demonstrates that the framework supports different policy goals: balanced efficiency, maximum protection, and strategic economy.
Regarding the MO-GWO, the decision-making landscape appears more diversified. While the max distance, utopia, weighted sum, and VIKOR methods still align toward a central compromise ( = 11.36; = 626,631), the marginal gain ( = 15.32 and = 568,769) converges toward a significantly different area of the front. As stated previously, the TOPSIS ( = 8.67 and = 696,164) and angle methods ( = 15.27 and = 581,804) selected the higher financial cost and lower financial cost, respectively. From a planning perspective, the MO-GWO output emphasizes the need for the final choice to be made again, based on the specific decision-making metric adopted.
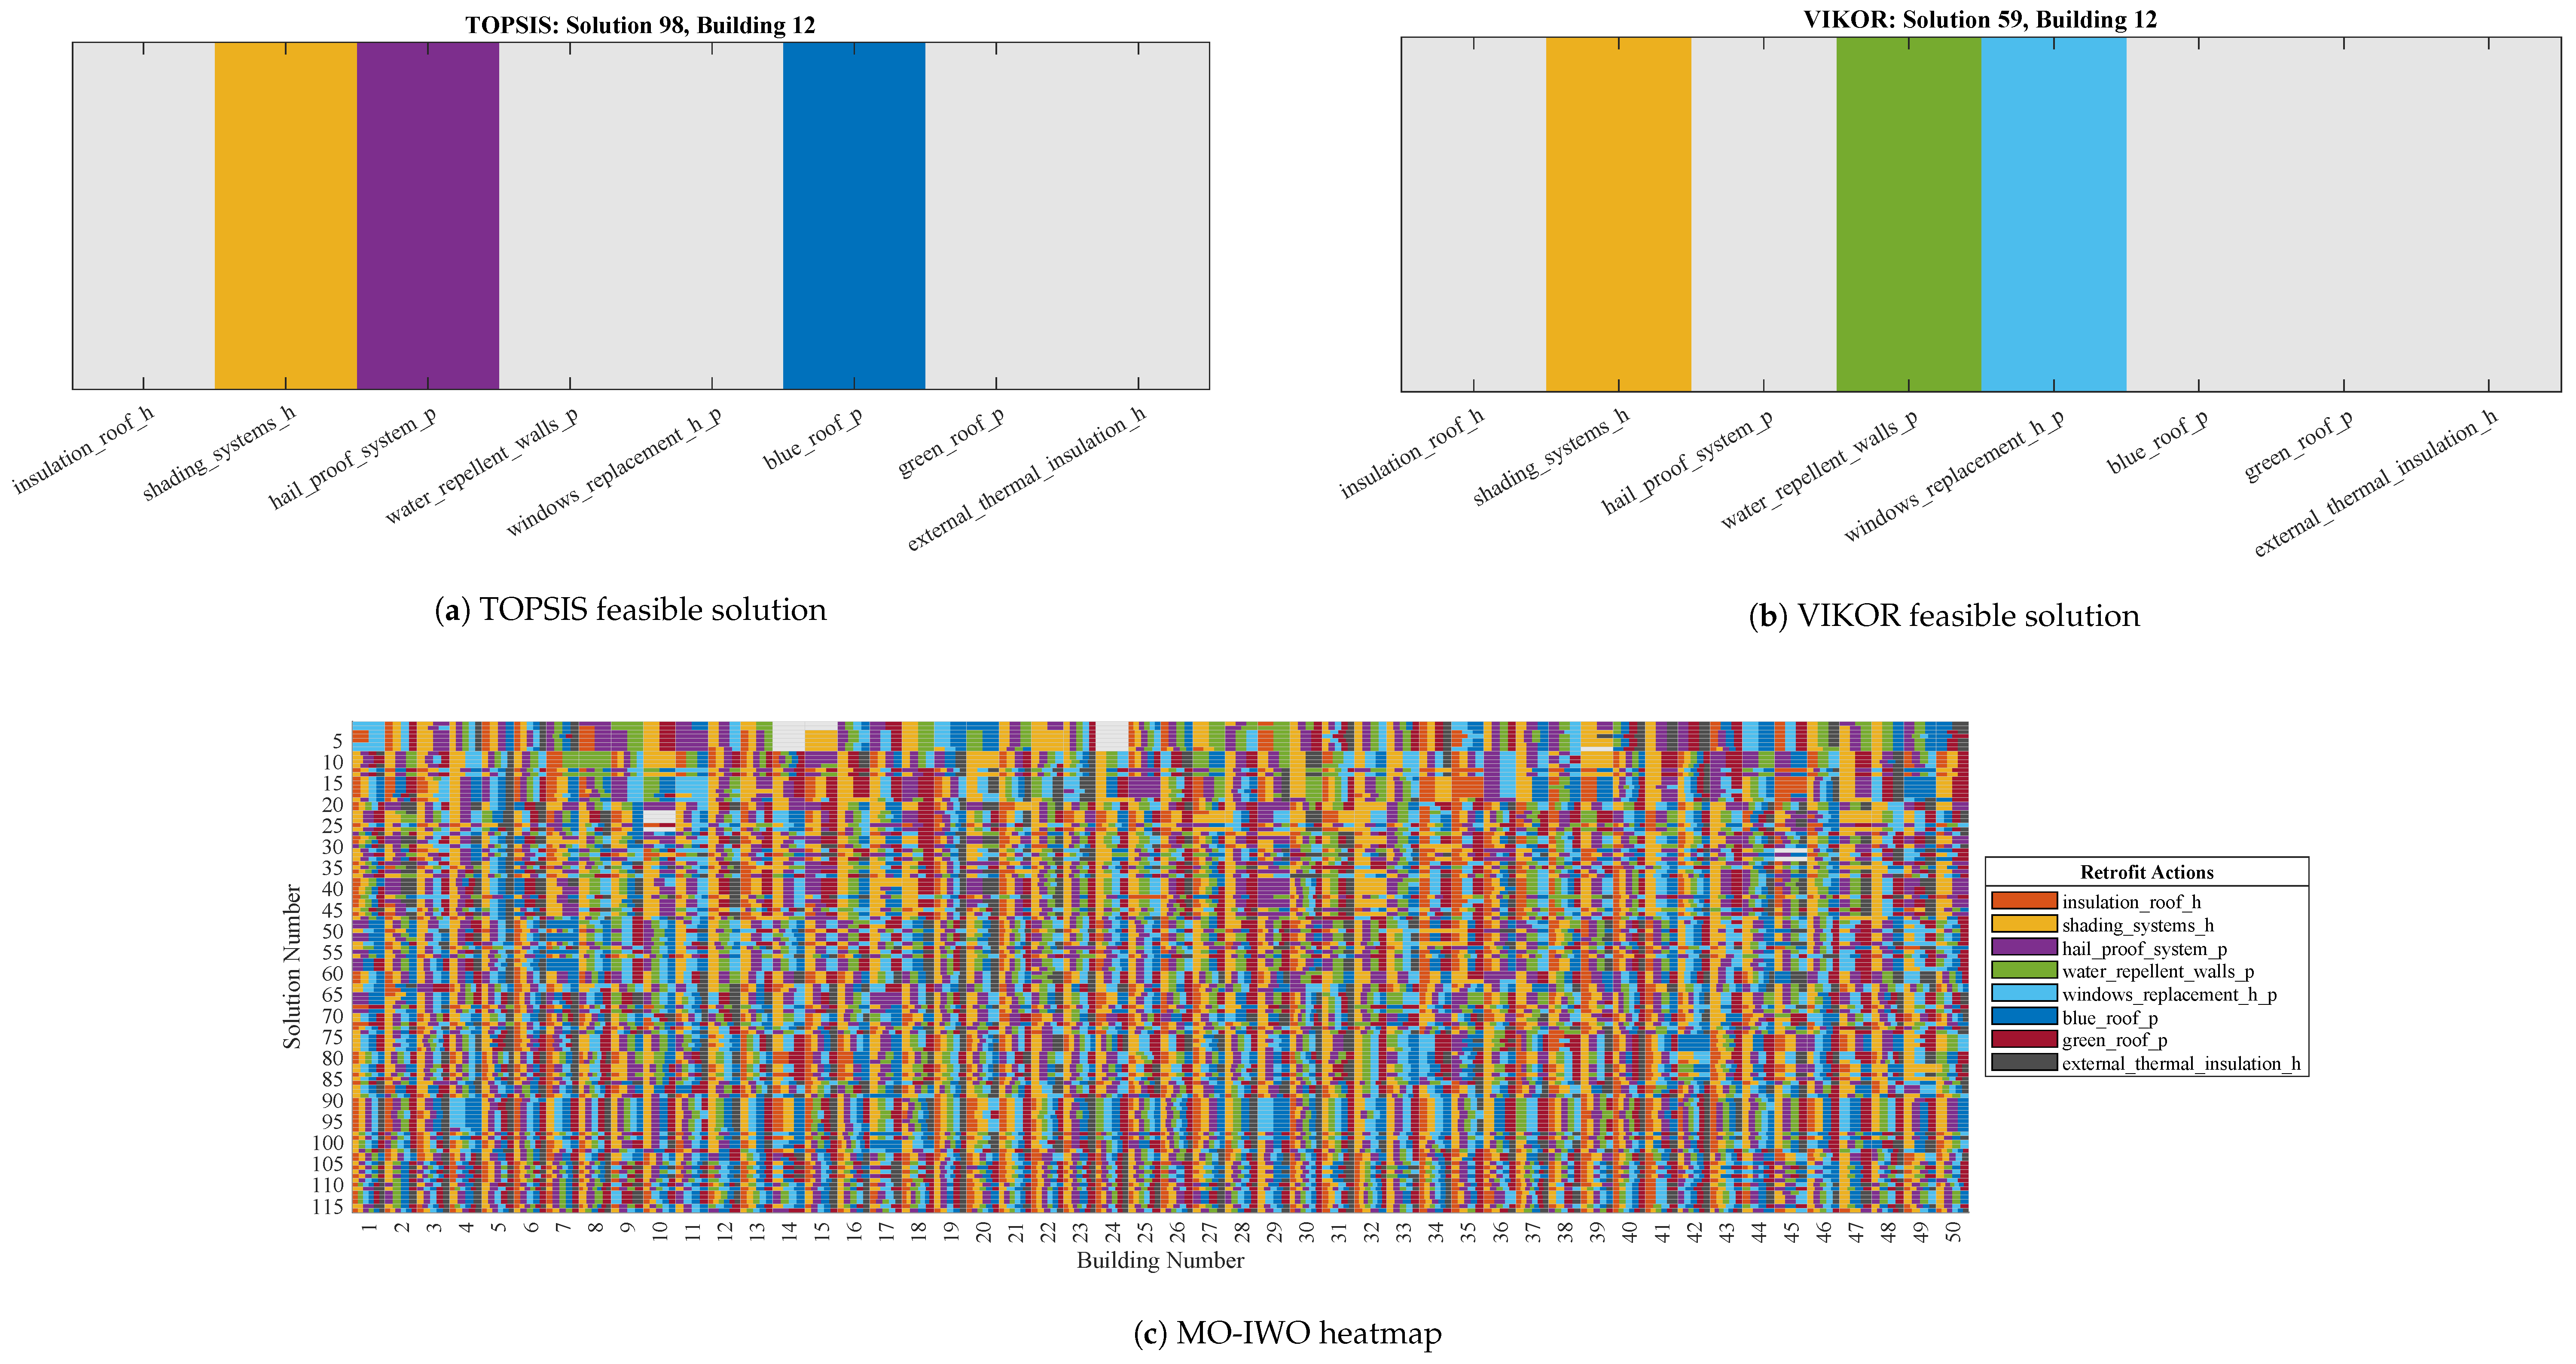
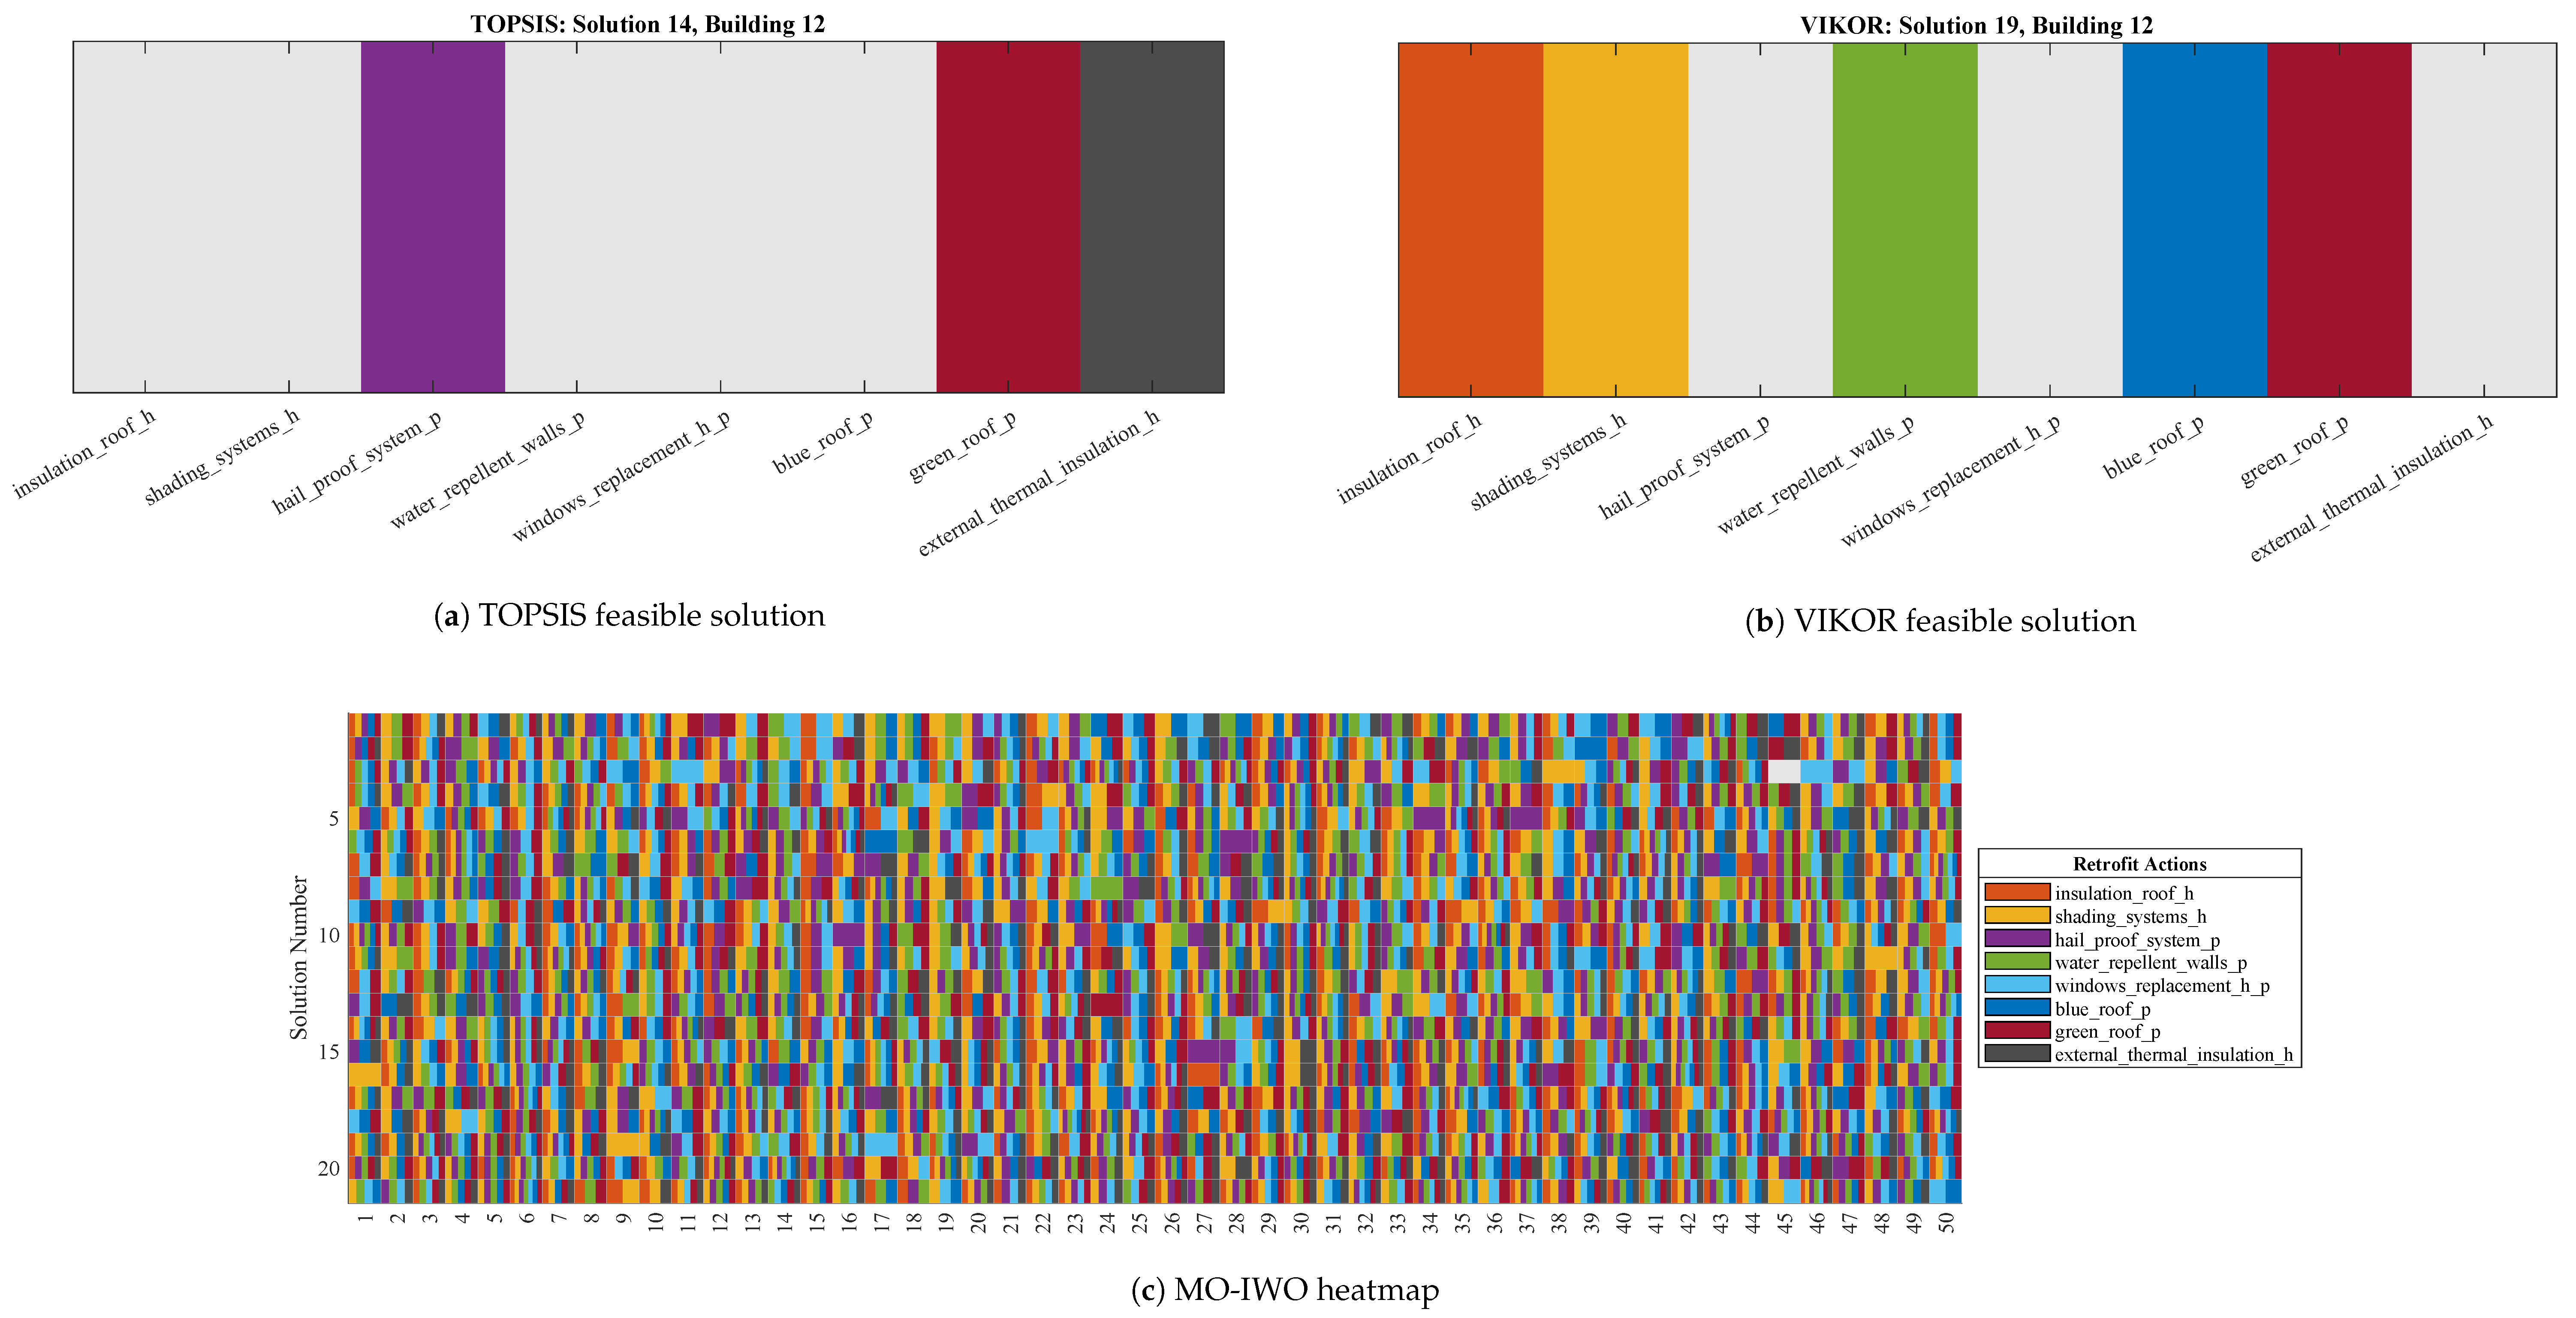
The details of each feasible solution corresponding to each building generated by MO-IWO and MO-GWO are illustrated in
Figure 6 and
Figure 7. In these heatmaps, the y-axis represents the solution number, while the x-axis indicates the building ID. Each cell represents a combination of retrofit actions, shown in different colors, that vary across feasible solutions and buildings. Since several methods were used to identify the best feasible solutions, decision-makers can more easily choose options that match stakeholder needs. For instance, as shown in
Figure 6, for building 12, if the end-user chooses the TOPSIS model, the optimizer recommends a shading system to protect against heatwaves, a hail-protection system, and a blue roof to manage heavy precipitation.
A closer look at the results revealed that, for both optimizers, the final feasible solutions across the four methods, max distance, utopia, weighted sum, and VIKOR, overlap and fall within the same value range. Moreover, the TOPSIS solution consistently identified points with lower total vulnerability and higher total cost across both optimizers, whereas the angle method identifies points with higher total vulnerability and lower total cost. In contrast, the marginal gain method selected different feasible solutions in both optimizers because it inherently targets the specific maximum local discontinuity, where the marginal financial penalty for further vulnerability reduction is at its maximum.
Regarding the overall performance of optimizers, MO-IWO outperforms MO-GWO across almost all performance indicators, with the sole exception of CPU time. Results of this analysis are reported in
Table 5. In fact, MO-IWO achieves higher-quality convergence (as demonstrated by HV global and IGD run values) with lower statistical variability. Although the computational cost is higher, MO-IWO (363.30 s) is much slower than MO-GWO (91.27 s). Subsequently, in terms of solution quality based on HV global, MO-IWO yields a significantly higher value (∼30.1 M) than MO-GWO (∼22.9 M), corresponding to an improvement of approximately 31.44%. A larger HV indicates that the Pareto front found by MO-IWO covers a substantially greater portion of the solution space and lies closer to the theoretical optimum. This can be attributed to the reproduction mechanism, where the weed colonization strategy allows for a more diverse exploration. Additionally, MO-IWO exhibits a markedly lower IGD value of 5934 compared to 17,366 for MO-GWO, representing a 65.83% reduction. Since IGD measures the distance between the obtained front and the reference front, this reduction confirms that MO-IWO solutions are more precise and more uniformly distributed. In terms of stability and robustness (95% CI runs, 95% CI global), the MO-IWO intervals are nearly half those of MO-GWO, both in individual runs (±0.98% versus ±3.57%) and global runs (±1.30% versus ±2.73%). Lastly, with 94.74% system stability, MO-IWO demonstrates a superior ability to converge to the same Pareto front in each run compared to MO-GWO (83.94%), representing an improvement of 10.80%.
To ensure the full reproducibility of the reported results, all simulations were conducted under a controlled computational environment. As specified in
Table 4 and
Table 5, for the final results, a fixed pseudo-random seed (Seed = 42) was applied. At the same time, the detailed disclosure of hyperparameters (
Table 4) enables the replication of the exact Pareto fronts presented in this study. This was conducted to eliminate stochastic drift and ensure replicability of the work.
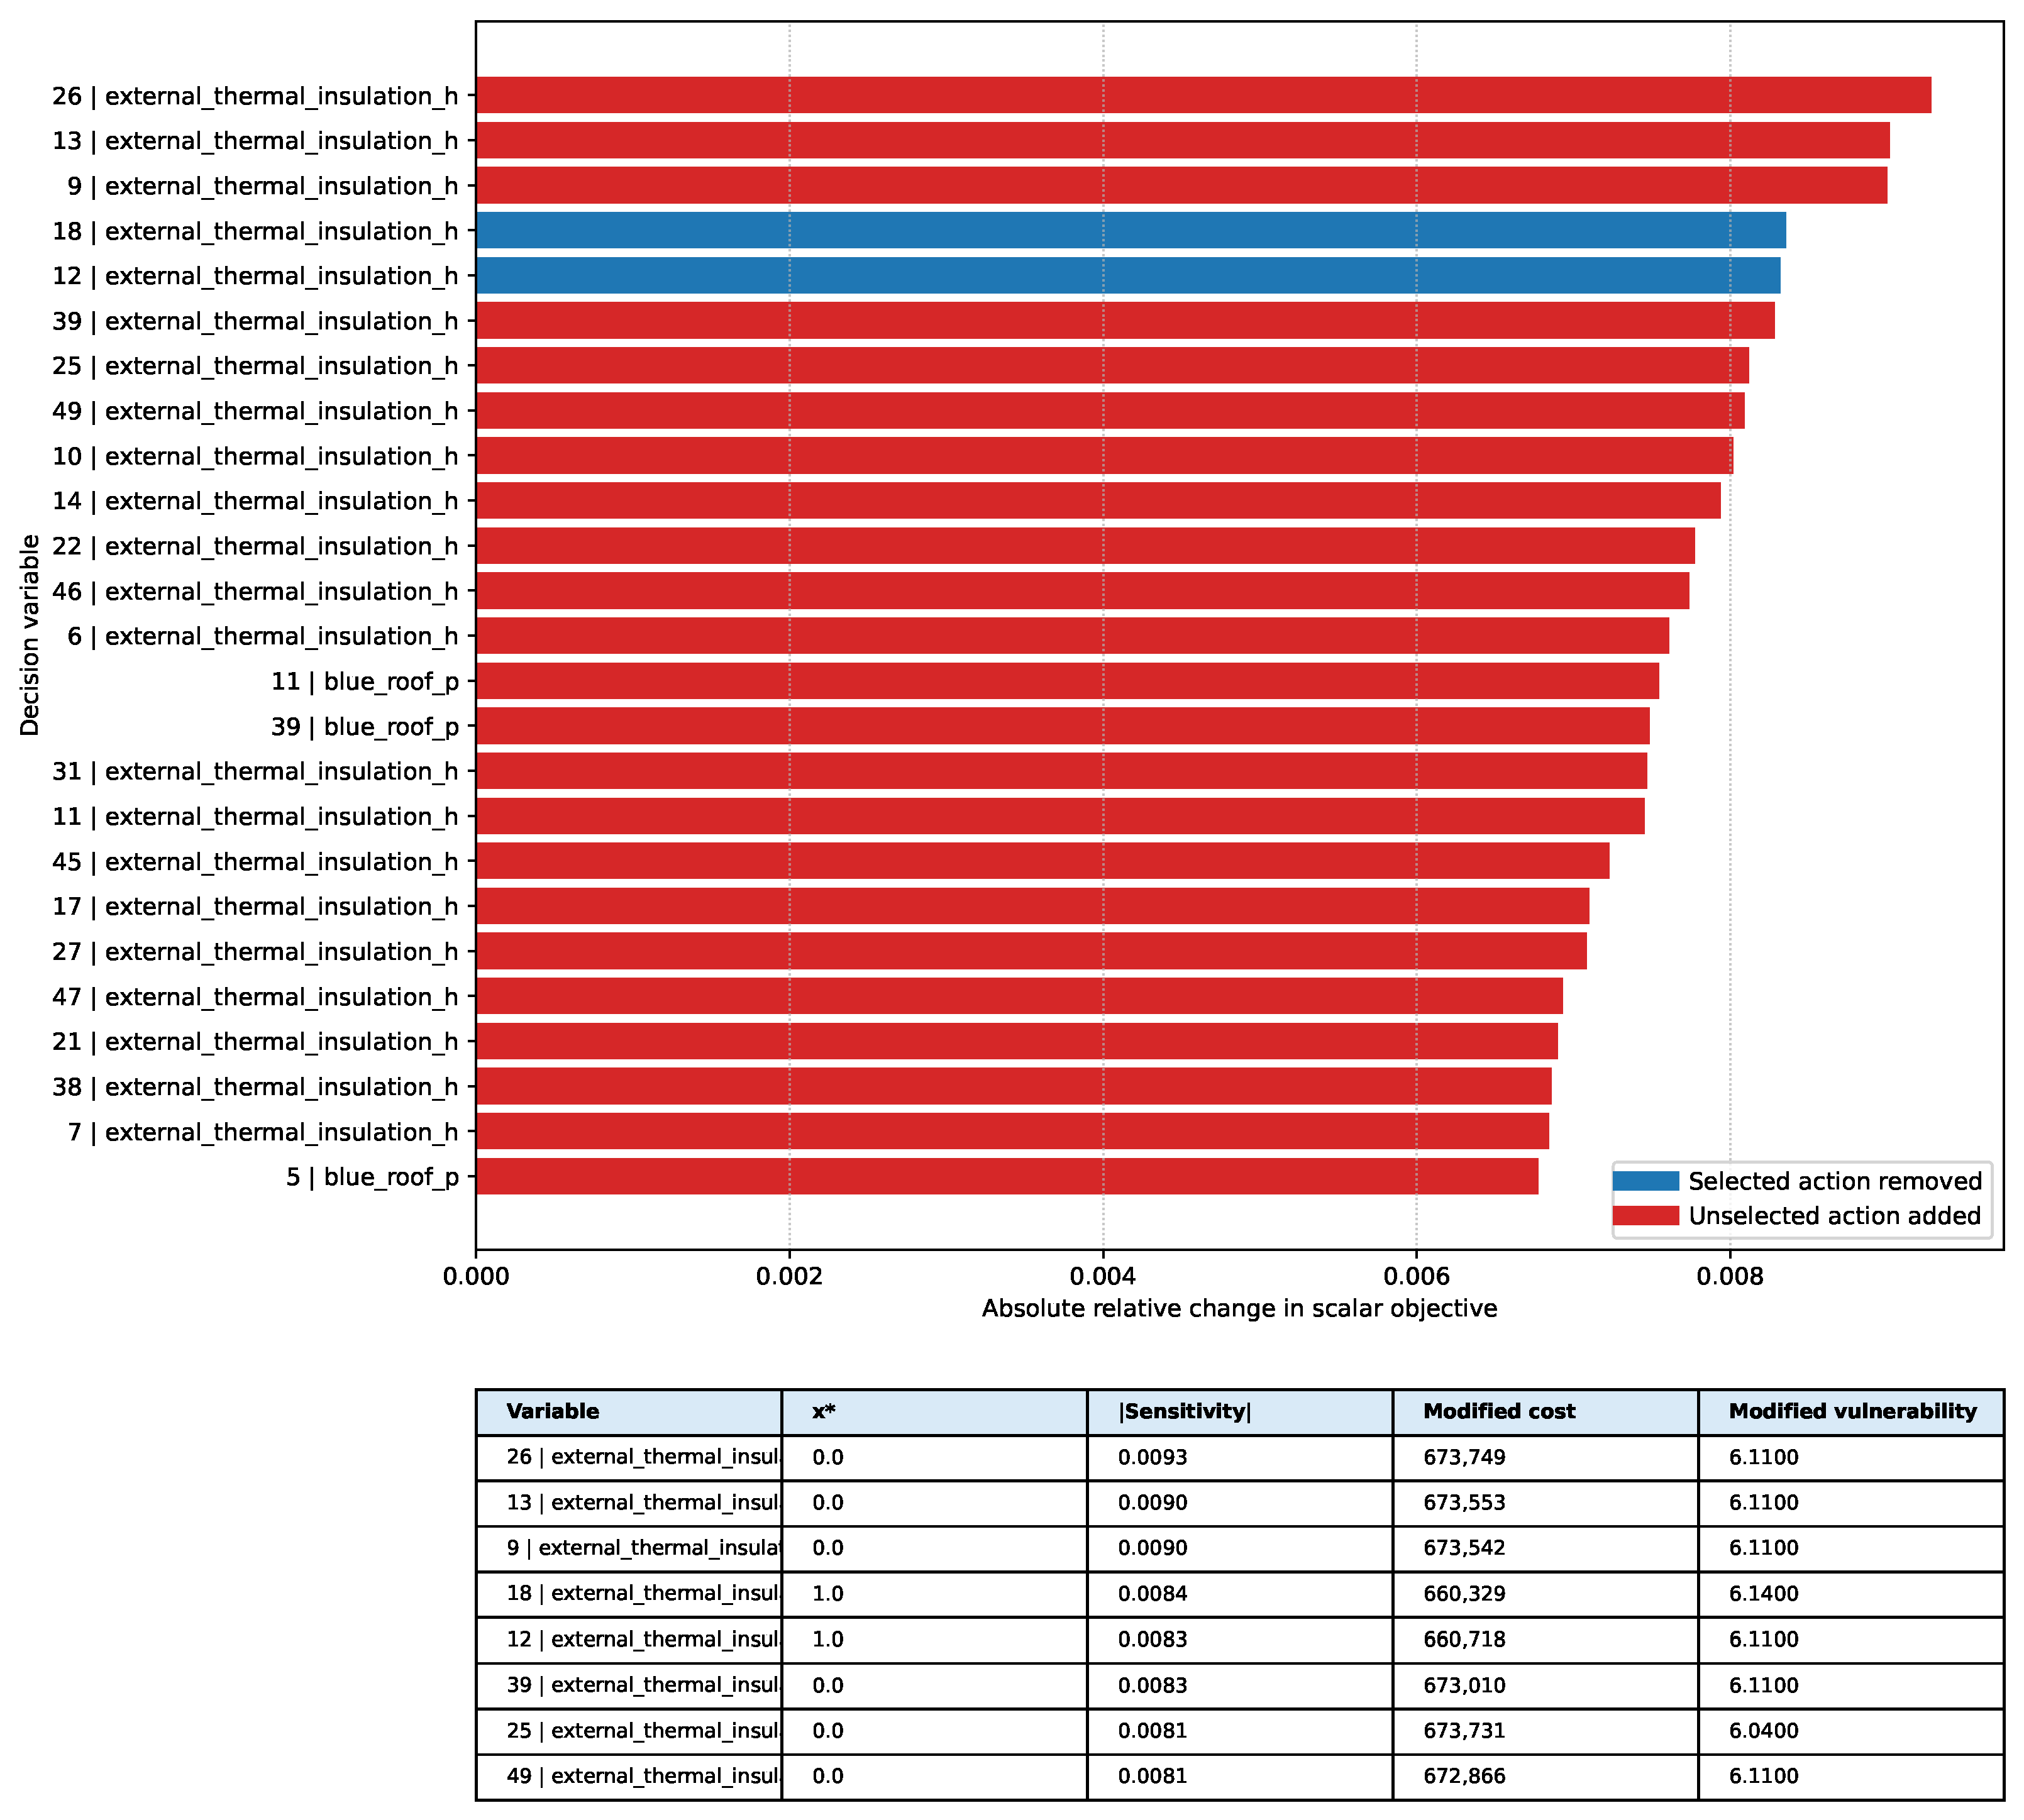
Then, the sensitivity analysis focused on the solutions generated by the MO-IWO algorithm, as it demonstrated superior convergence and diversity in the Pareto front for this specific case study. By selecting the TOPSIS feasible point and analyzing the local neighborhood, the retrofit actions were ranked by their influence on the scalarized objective. As shown in
Figure 8, the decision variables are classified through the binary flip analysis. The graph distinguishes between substituting an optimal action (blue bars) with a previously excluded action (red bars). The results highlight that
external thermal insulation (h) is the main driver of the framework, with buildings 9, 21, and 26 topping the rankings. The blue bars identify the critical retrofit actions, where exclusion would drastically reduce the plan’s efficiency. The red bars instead indicate the best alternatives currently excluded from the budget. The predominance of wall insulation over roof-related measures suggests that the building envelope is the most effective adaptation lever in this context. Finally, the low sensitivity to continuous percentage changes (
) under continuous relaxation confirms the stability of the MO-IWO solution with respect to uncertainties in costs or technical effectiveness, ensuring reliable decision support.
3.2. Autonomous Meta Heuristic Optimization Within the Agentic AI Framework
The optimization results presented in the previous section demonstrate the capability of the MO-IWO-based framework to generate stable and high-quality Pareto fronts under different budget constraints and decision-making strategies. However, these results were obtained under predefined configurations, where the optimization parameters, building subsets, and decision criteria were explicitly specified. In real-world decision-making scenarios, such structured inputs are rarely available, and users typically interact with the Agentic AI through NLP queries that may be incomplete, ambiguous, or iterative. To bridge this gap, the proposed Agentic AI framework introduces a multi-agent architecture that translates user intent into a consistent optimization configuration.
In this context, the evaluation presented in
Table 6 aims to assess not only the numerical performance of the optimizer, but also the system’s ability to (i) correctly interpret user-defined constraints (e.g., building subsets and budget limits), (ii) adapt the optimization depth through dynamic control of hyperparameters, (iii) ensure computational efficiency via memory reuse, and (iv) maintain human-in-the-loop governance for critical operations such as database modification. By looking at the following sequence tests, where the Orchestrator and its specialized subagents collaboratively produce consistent and explainable responses, the framework’s robustness and practicability are validated.
To validate the behavior of the proposed Agentic AI framework, representative user interactions were executed according to the scenarios outlined in
Table 6. The following illustrates the user queries interpretation, subagents activation, system state changing, and generated outcomes (including optimization results and explainable reports). This demonstration focuses on different scenarios, such as database modification and subsequent analysis. This allows for highlighting the framework’s ability to maintain traceability, enabling human-in-the-loop control, and producing reproducible results.
As illustrated in
Table 7, the Agentic AI correctly interprets user modification requests and holds changes in a pending state until explicit confirmation of the user is provided. Upon confirmation, the dataset is updated and versioned (
inputdataV1), preserving the original dataset (
inputdataV0). Subsequent analysis works on the updated dataset, and the Agentic AI generates an explainable report summarizing the optimization results. Finally, the reset operation successfully restores the system to its initial state, confirming robust state management and reliable execution across iterative NLP interactions.
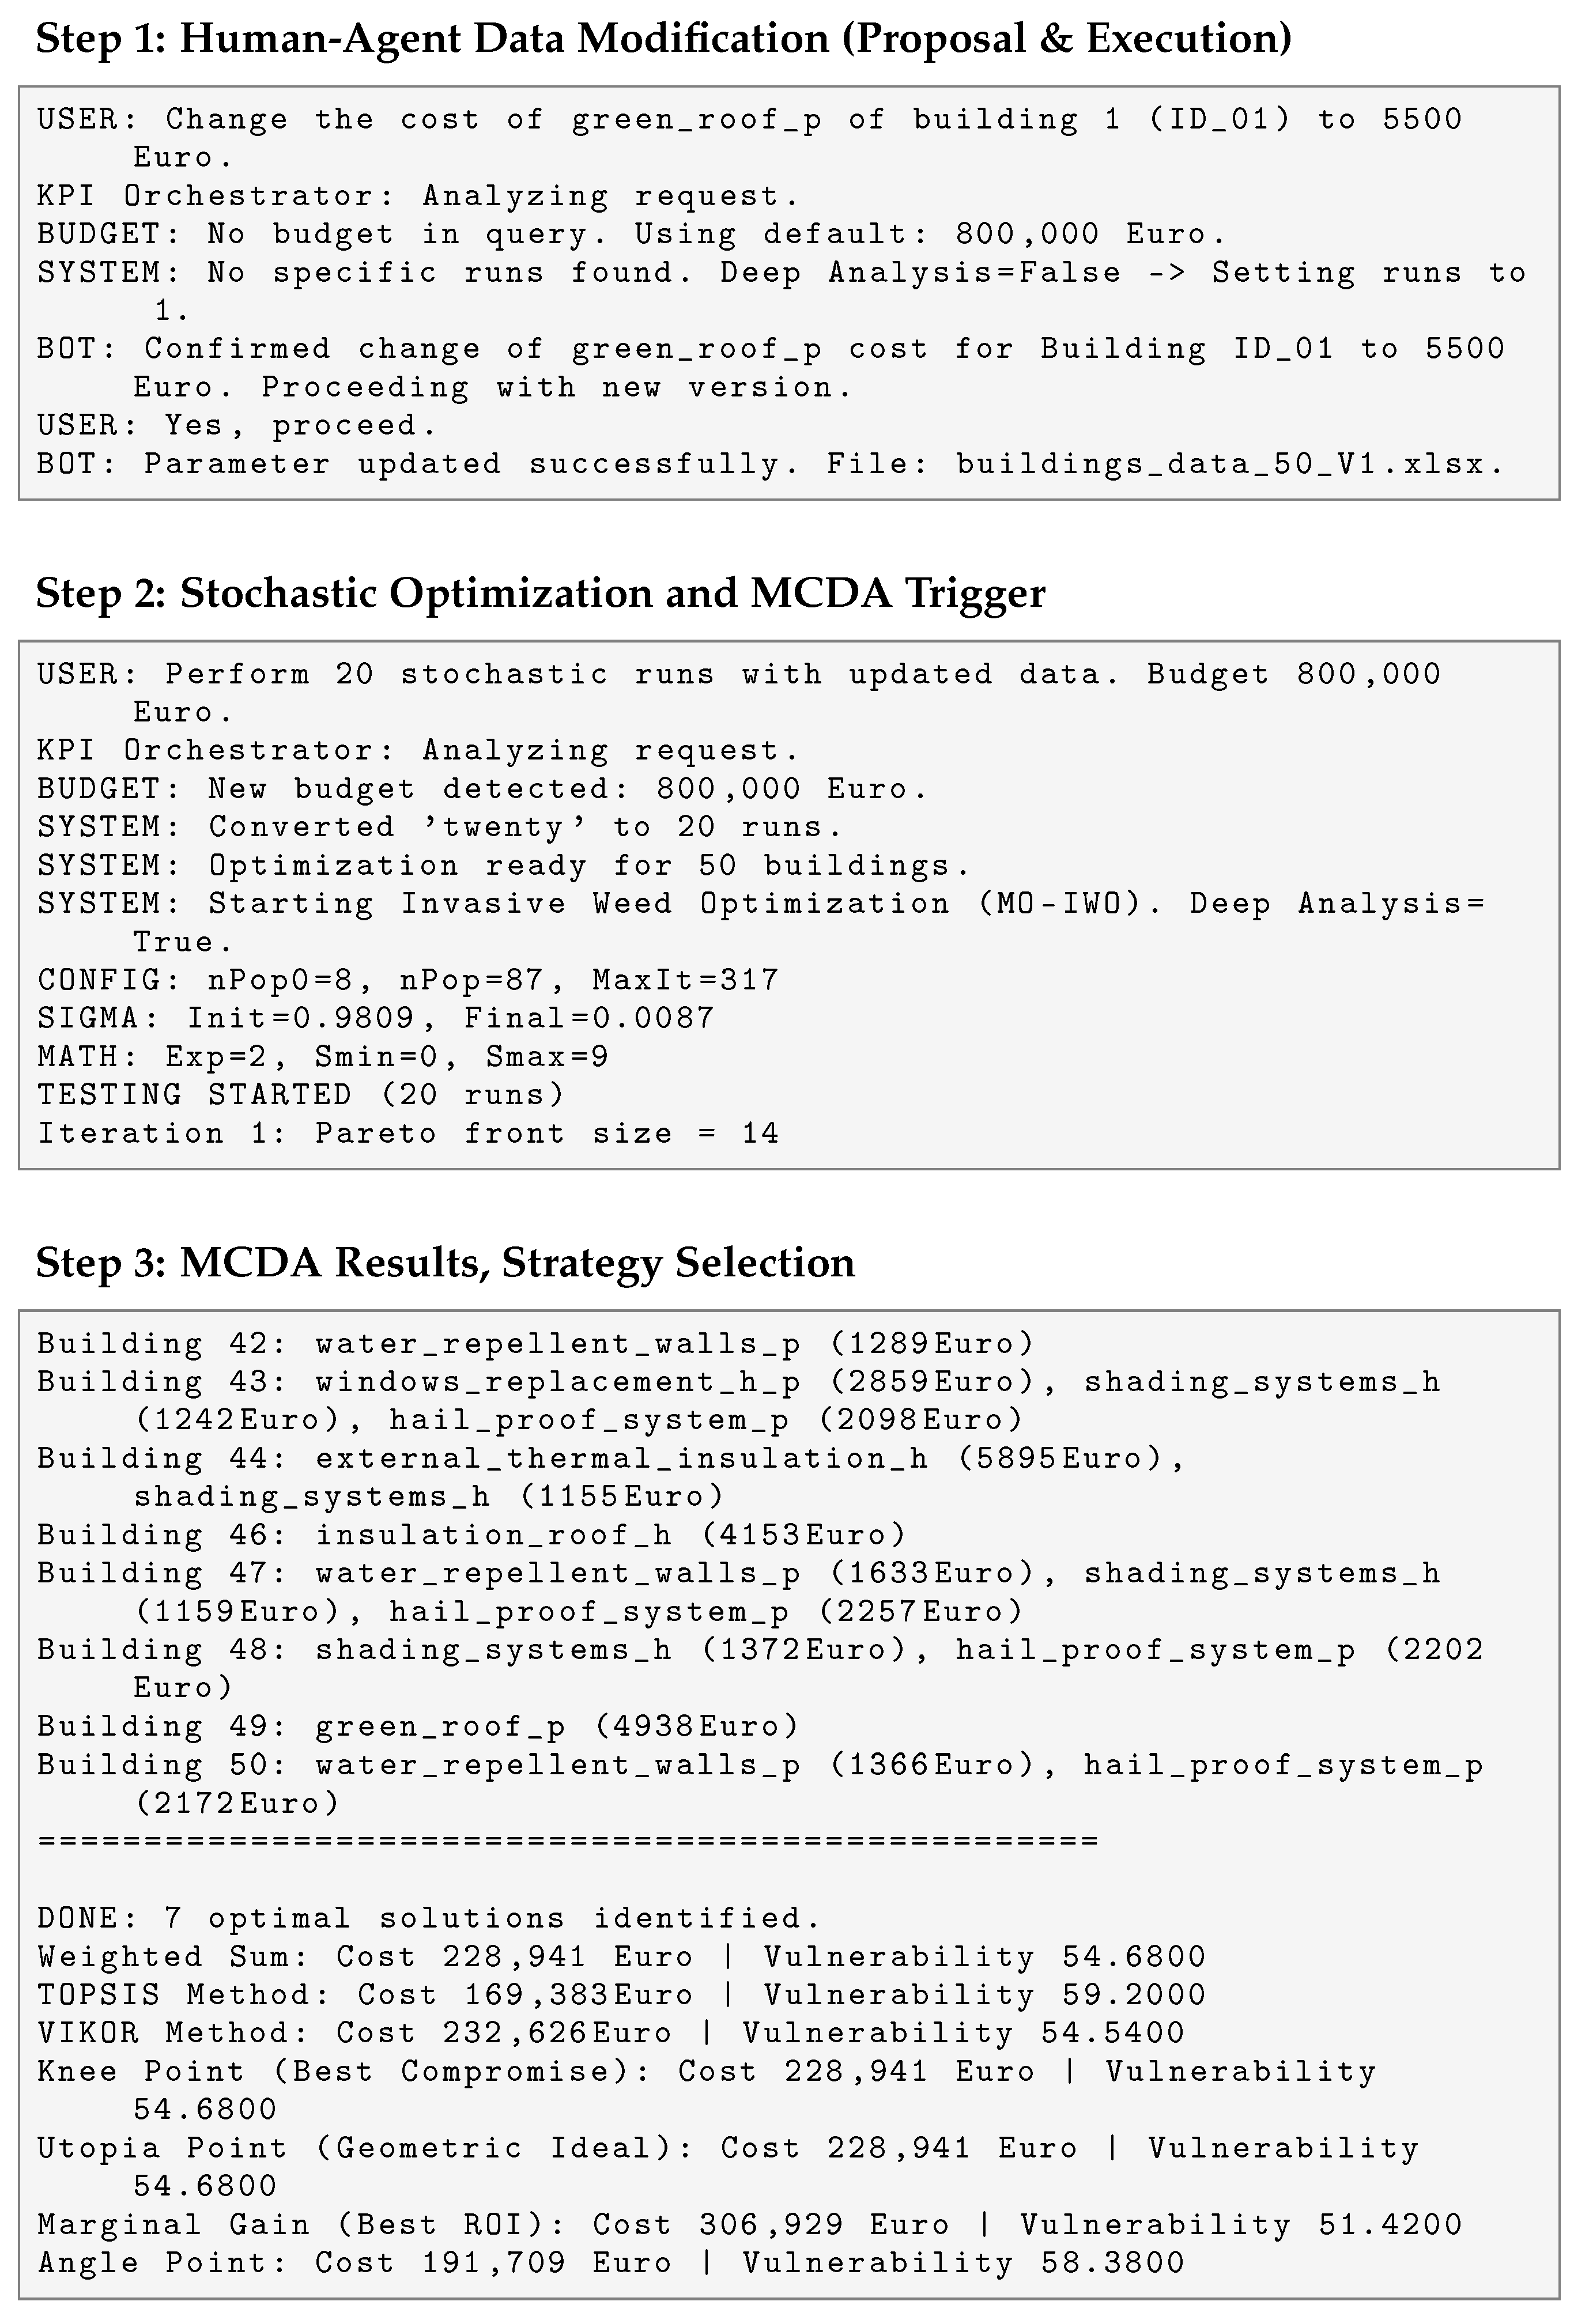
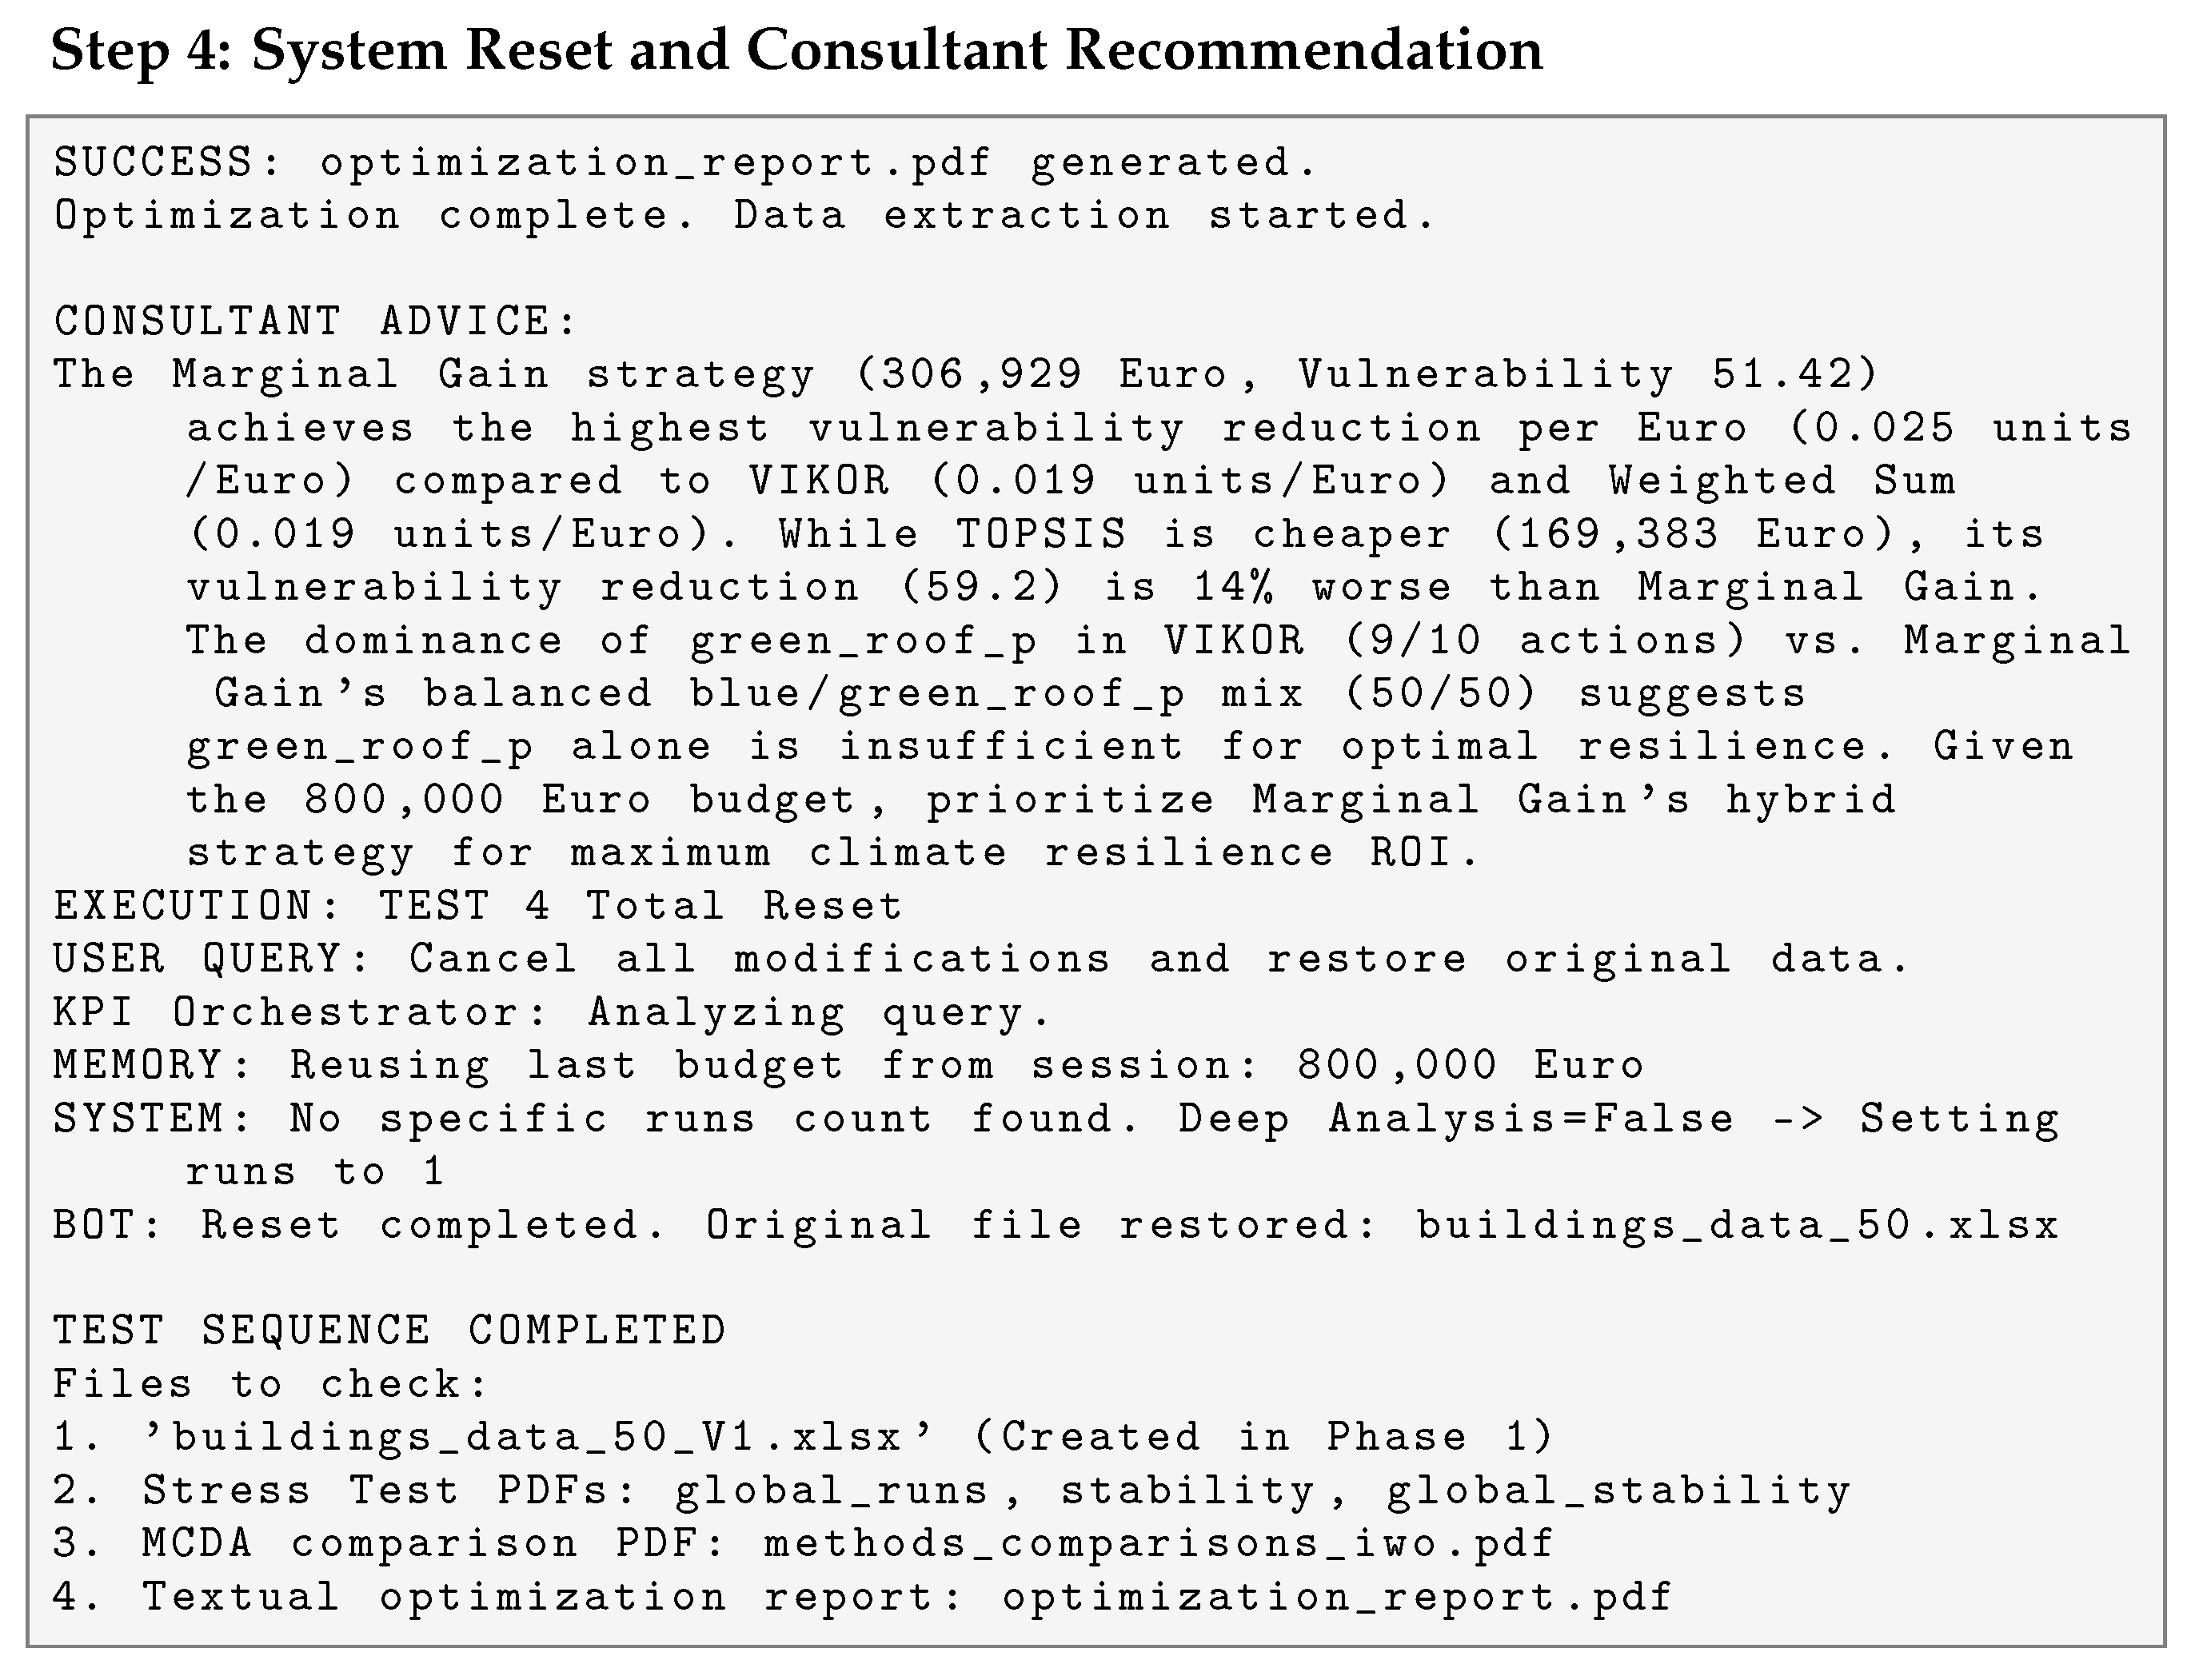
Figure 9 illustrates the framework’s operational flow, demonstrating the multi-agent system’s ability to bridge unstructured human requests with complex optimization algorithms. It can automatically change data, adjust MO-IWO settings based on the conversation, and show the results using MCDA or other approaches. In this way, it handles the whole optimization process. Also, the framework provides explainable recommendations acting as a consultant, and it can maintain human control by allowing restoration to the original input data version. Overall, this shows that the framework can take step-by-step user questions in NLP and turn them into clear and reliable optimization strategies.
Figure 10 presents the final results generated through the Agentic AI framework in response to user queries. As demonstrated in the system logs (
Figure 10), every interaction is recorded in an audit trail that links user queries to specific system output. Moreover, the Orchestrator operates on a deterministic logic-gate system, ensuring that the same NLP intent consistently triggers the same sequence of subagent activations. This systemic transparency effectively mitigates the black-box risk typically associated with complex AI systems.
Additionally,
Table 8 details the feasible solutions extracted from the MO-IWO and their subsequent implementation within the Agentic AI environment (MAO). Specifically, running the two approaches with the same MO-IWO hyperparameters (
Table 4)) shows different behavior because MAO adds a decision-support layer on top of the numerical optimizer. When analyzing the results under a specific constraint (e.g., a EUR 800 K budget for the entire portfolio), MO-IWO identifies solutions that minimize vulnerability by exhausting nearly the entire available budget. Conversely, the MAO demonstrates a more conservative and context-aware logic, selecting strategies that stabilize around 50% budget utilization (EUR 317 k–EUR 400 k). This suggests that the multi-agent architecture does not merely solve a mathematical problem; it interprets the budget as a safety ceiling rather than a target to be reached. This allows the system to prioritize retrofit actions that provide substantial vulnerability reduction without depleting financial resources. This conservative behavior of Agentic AI suggests a threshold on the cost–benefit curve. Beyond the EUR 317 k–EUR 400 k range, the system identifies diminishing returns where further investments yield only marginal benefit in terms of reduction in vulnerability. While a static optimizer treats the budget as a space to be fully explored to reach the absolute minimum vulnerability, the Agentic AI operates as a rational consultant. For instance, using the TOPSIS method, MO-IWO retrieves a solution with
= 6.11 and
= 666,877, whereas the Agentic-AI converges to
= 56.90 and
= 317,776. Similarly, for VIKOR, the results shift from
= 12.94 and
= 536,055 in the IWO, while
= 52.60 and
= 400,856 in the MAO environment.
Beyond the numerical outcomes, the stability of performance metrics reveals a key distinction between the two approaches. Although the standalone MO-IWO polylines (
Figure 4) appear compact, they exhibit higher fluctuations in HV compared to the Agentic AI (
Figure 10). This is due to the HV’s sensitivity to boundary solutions. In fact, in the standalone engine, minor stochastic gaps at the Pareto front’s edges lead to significant variance in the dominated area. Conversely, the MAO acts as a systemic regularizer. By anchoring the optimization to specific user requirements, it ensures a more consistent exploration of the objective space. This coordination delivers superior statistical reliability, effectively mitigating the stochastic instability of standalone metaheuristic engines.
To quantify the uncertainty inherent in the metaheuristic engines, each optimization process is repeated for 20 independent runs. The standalone MO-IWO demonstrates high system stability (94.74%) with a dispersion of results about ±0.98% in 95% CI runs and ±1.30% in 95% CI global. The Agentic AI engine shows superior performance, achieving a system stability of 95.43% with respect to ±0.63% in 95% CI runs and ±2.21% in 95% CI global. These results indicate that both systems remain below an approximate 5% uncertainty threshold, while MAO provides more consistent cost-oriented decision support.
It is important to clarify that the primary objective of integrating Agentic AI is not to benchmark raw numerical improvements relative to static optimization. Instead, the focus is on extending the optimization engine’s capabilities by providing context-awareness. As illustrated in
Figure 9, the Agent AI acts as a reliable partner, handling qualitative constraints and enabling explainable decision-making that static optimization models alone cannot provide.
3.3. Discussion, Limitations, and Future Directions
Despite its success in bridging the gap between complex optimization and user intent, the framework has limitations that warrant a critical perspective.
First, the Agentic AI’s tendency to use only ∼50% of the budget reflects a logic of marginal efficiency. Although this means shifting from mathematical minimization to efficiency, this may conflict with political or social agendas that prioritize minimum asset vulnerability.
Second, the framework relies on static cost databases, avoiding market volatility and fluctuating costs.
Next, as emphasized by EU Best Practice [
11], climate adaptation is rarely a win–win strategy. Specifically, certain retrofit actions designed to mitigate some hazards may unintentionally increase vulnerability to others. For instance, wall thermal insulation can lead to humidity imbalances during heavy precipitation events. Quantifying these cross-hazard interactions remains a challenge that requires experimental data to refine the objective functions.
As PoC, this study used stochastically generated data for 50 building archetypes. This was realized to validate the multi-agent orchestration under a controlled yet diverse range of building characteristics. This methodological choice ensured architectural stability and stress-tested the framework’s logic before real-world deployment. To evolve from this PoC, future work will involve a full-scale validation integrated with Building Information Modeling (BIM) to extract realistic quantities and link them to government construction price databases.
Furthermore, the current Vulnerability index () will be evolved into a Risk index () to better integrate social aspects and building functions (e.g., hospitals vs. warehouses). While measures the susceptibility of the physical asset to hazards, accounts for the magnitude of the consequences associated with a failure or damage. This can incorporate the following: population density (prioritize buildings with higher human exposure), strategic importance (critical and non-critical assets), and socio-economic impacts (indirect costs of service interruption).
Although this study introduces a deterministic approach, the MOO process inherently helps manage uncertainty. By providing a spectrum of solutions (Pareto front) rather than a single result, it allows decision-makers to navigate varying priorities and economic needs. Additionally, the Agentic AI architecture is modular by design. It would eventually incorporate Monte Carlo simulations or Fuzzy logic to formally quantify stochastic uncertainties (e.g., / indices; price market).
Lastly, economic feasibility is a cornerstone of sustainable maintenance. Future research will include a comprehensive Life Cycle Cost Analysis (LCCA). A promising direction involves the integration of advanced financial performance indicators, such as Net Present Value (NPV), Internal Rate of Return (IRR), and Payback Period (PBP). By applying these metrics as a post-optimization step, the Agentic AI could further refine the selection of feasible solutions. This approach would allow decision-makers to identify retrofit strategies that are not only resilient but also economically sustainable throughout the building’s life cycle.
Finally, a promising direction involves the integration of self-decision Agentic AI. This approach can define new problem-specific decision variables and constraints. It would enable the development of more innovative, out-of-the-box objective functions, allowing end-users to tailor the optimization to highly specific local contexts.
4. Conclusions
This study developed a new framework for the Agentic-AI Optimization to adapt the existing building stocks to climate change. By operationalizing the Guidance [
10] and the Best Practice Guidance [
11] into a multi-agent architecture, the framework bridges the gap between high-level policy objectives and practical actions.
To achieve this, the MO-GWO and MO-IWO were used to optimize the conflicting objectives of total vulnerability and total cost. The comparison between the two metaheuristic optimizers revealed that MO-IWO significantly outperformed MO-GWO, achieving a 31.5% higher HV and 65.8% lower IGD. This highlights MO-IWO’s superior ability to explore the discrete decision space of building retrofits. For this reason, MO-IWO is integrated as a mathematical engine into the Agentic AI. This integration shifted the focus from a purely mathematical problem to a decision-making problem. While traditional optimizers tended to exhaust the total budget, the Agentic AI stabilized at approximately 50% budget utilization. This means it identified the point of diminishing returns where additional investment yielded negligible vulnerability reduction. In addition, the inclusion of an XAI Agent and system audit trails mitigated the black-box nature of AI. The framework provides not only optimal Pareto fronts but also human-readable justifications, ensuring that decisions are traceable and aligned with user intent.
Furthermore, the sensitivity analysis confirmed the robustness of the proposed strategy. The smooth degradation of sensitivity values across the building portfolio indicated a well-balanced distribution of retrofit actions. The results demonstrated that the decision-making hierarchy remains consistent even in the presence of minor cost fluctuations or technical uncertainties.
From a scientific perspective, this work introduces a novel approach in adaptive maintenance of building stocks. Unlike traditional black-box models, MAO allows for the dynamic translation of qualitative user requirements (NLP) into quantitative optimization input. In fact, this research contributes to the field of Civil Engineering by demonstrating how LLM-orchestrated agents can manage and support decision-makers in the complexity of multi-hazard scenarios (heatwaves and heavy precipitation) at a portfolio scale.
Notably, the proposed framework operates as a scalable Decision Support System (DSS). Actually, public authorities and asset managers need to prioritize climate adaptation across extensive building portfolios. By providing a structured approach to managing hundreds of assets, this framework directly supports EU regulatory requirements and sustainability targets.
Despite these advances, this study is a PoC with recognized limitations. The current framework relies on static cost databases and stochastic vulnerability evaluation of buildings. Future research will focus on integrating with BIM to automate data extraction and assessment and improve cost accuracy. Then, it will involve moving from a index to a socio-economic index. Lastly, incorporating long-term financial metrics like NPV, IRR, and PBP will ensure economic sustainability beyond initial capital expenditure.
In conclusion, the Agentic AI framework represents a significant step for managing climate adaptation of the built environment. By providing a robust, explainable, and policy-aligned tool for the challenges of the 21st century, especially under uncertain future conditions.




 ,
,