1. Introduction
Breast cancer is among the most commonly diagnosed cancers and a leading cause of cancer-related death in women worldwide, underscoring its continuing public-health relevance [
1]. Beyond its clinical toll, breast cancer contributes to the substantial and growing macroeconomic burden of cancer, an impact emphasized by the World Health Organization’s report on cancer economics and projected to intensify through mid-century in cross-country cost estimates for 29 cancers [
2,
3]. According to recent global estimates, more than 2.3 million new cases and approximately 685,000 deaths were recorded in 2020 alone, with incidence and mortality rising particularly in low- and middle-income countries. Early detection and accurate prognosis prediction are therefore essential for optimizing treatment strategies, improving long-term survival, and guiding resource allocation across healthcare systems [
4].
Traditional prognostic tools in oncology, such as clinical staging systems or linear regression models, often fail to capture nonlinear interactions among multiple clinicopathological variables and may suffer from collinearity, feature redundancy, and limited generalizability. In recent years, machine learning (ML) and artificial intelligence (AI) methods have demonstrated promising results for identifying complex patterns in large clinical and imaging datasets [
5,
6]. However, these advanced models frequently lack interpretability and transparency, complicating their translation into routine clinical practice, particularly in structured tabular data typical of population-based cancer registries [
7,
8]. Furthermore, deep learning methods often underperform or show limited gains over regularized linear models in medium-sized tabular datasets, raising questions about their practical advantage for registry-based prediction tasks. Recent work has explicitly argued that, in clinical prediction modeling, emphasis should shift from “model debates” (e.g., ML versus logistic regression) toward data quality, transparent preprocessing, and robust validation protocols, because these factors often dominate performance differences and determine downstream reliability [
9].
The U.S. National Cancer Institute’s Surveillance, Epidemiology, and End Results (SEER) Program provides high-quality, population-level data that enable reproducible benchmarking of predictive models across diverse patient cohorts. Previous SEER-based studies have applied algorithms such as support vector machines, deep neural networks and random forests, reporting area-under-the-curve (AUC) scores typically ranging from 0.70 to 0.80 [
10,
11,
12]. However, many omit critical aspects such as calibration assessment, handling of class imbalance, or transparent model comparison under identical preprocessing pipelines. In addition, most prior work treats SEER outcomes as cross-sectional endpoints, despite the fact that the dataset fundamentally represents censored time-to-event information, which calls for fixed-horizon definitions or explicit survival modeling. Beyond oncology-specific registries, recent mortality-prediction studies in other clinical domains continue to report strong discrimination while motivating careful evaluation of calibration and clinical decision utility, reinforcing that probability reliability is central to actionable risk stratification [
13,
14,
15].
Recent registry-based works illustrate these challenges. Ganggayah et al. compared several classifiers for breast cancer survival and reported high accuracies for random forests and deep learning but omitted PR-AUC and calibration, making class imbalance effects difficult to evaluate [
16]. Jin et al. developed logistic and random forest models to predict adverse events in breast cancer, achieving test AUCs of 0.886 and 0.874, respectively, yet without reporting calibration or recall-based measures [
17]. In a related SEER-based study, Jin et al. (2025) modeled multiple primary cancers using similar predictors and found comparable AUC values but focused primarily on accuracy rather than probability quality [
18]. Beyond breast cancer, Moncada-Torres et al. demonstrated that explainable ML can outperform Cox regression for survival prediction while providing interpretable insights through SHAP analysis, reinforcing the need for transparency and calibration in survival modeling [
19]. Collectively, these studies show that high ROC metrics alone may overestimate clinical utility when probability calibration, decision thresholds, and fairness are ignored.
In clinical settings, models with well-calibrated probabilities are essential for reliable decision support. For instance, in breast cancer management, predicted mortality risk can guide treatment aggressiveness, follow-up frequency, or early palliative interventions. A model optimized solely for discrimination but lacking calibration may over-triage low-risk patients or overlook high-risk cases, leading to resource misallocation and potential harm. Thus, risk prediction tools must balance sensitivity and specificity while maintaining trust and interpretability. Equally important, translational value depends on whether a model can be implemented, monitored, and updated in real-world workflows; recent systematic evidence on implementation and updating of clinical prediction models emphasizes that calibration drift, maintenance, and transparent updating procedures are prerequisites for sustainable deployment [
20].
Methodologically, this work contributes a reproducible and statistically rigorous pipeline for fair model comparison in tabular clinical data. Both models—L1-regularized logistic regression and a feedforward artificial neural network (ANN)—are trained under identical splits, normalization procedures, and evaluation metrics, including ROC-AUC, PR-AUC, and calibration curves (Brier and expected calibration error). Bootstrap confidence intervals and stratified five-fold cross-validation ensure robust statistical estimates, while feature pruning assesses the impact of removing hierarchical or derived variables on performance and interpretability. In addition, we reformulate mortality prediction as fixed-horizon classification at 3 and 5 years to align with clinical relevance and to properly address censoring within SEER.
Although several prior works have reported moderate AUC values using registry data, few have addressed model calibration, reproducibility, or interpretability within a unified experimental framework. In this context, the present study aims to (i) establish a transparent and reproducible baseline for fixed-horizon mortality prediction using large-scale clinical registries, (ii) evaluate the effect of hyperparameter-optimized neural networks relative to regularized linear models under controlled preprocessing, (iii) quantify discrimination and calibration differences between interpretable and non-linear architectures, and (iv) assess the impact of feature pruning on model robustness and stability. By integrating statistical rigor, open methodology, and clinical relevance, this work bridges the gap between technical model performance and actionable medical decision support.
2. Related Work
Machine learning in oncology spans imaging, genomics, and clinical prediction. In breast screening, deep learning readers can approach radiologist-level detection and reduce reading workload in randomized settings, although opacity, data requirements, and limited external generalization still constrain routine use [
21,
22,
23].
For prognostic modeling on clinical tabular data such as SEER, prior work emphasizes practices tailored to imbalanced outcomes. It is customary to report ROC-AUC together with PR-AUC, since precision–recall curves are more informative under skewed class distributions [
24]. For operating-point selection, a frequent choice is Youden’s index J = Sensitivity + Specificity − 1, which yields a single threshold with balanced trade-offs [
25]. Probability quality is typically summarized by the Brier score as an overall measure of calibration and discrimination [
26], and by expected calibration error to quantify bin-wise miscalibration [
27]. When miscalibration is present, post hoc Platt scaling is commonly applied to adjust predicted probabilities [
28]. Reporting conventions generally follow guidance for transparent prediction-model studies [
29].
Recent work using SEER and similar population-based registries has explored multiple strategies for mortality and survival prediction in breast cancer. Manikandan et al. [
30] proposed an integrative ML framework combining feature selection through variance filtering and principal component analysis, followed by ensemble learners such as random forests and gradient boosting. Their model achieved high accuracy (around 98%), but the authors acknowledged limited calibration and imbalance handling, which may overestimate clinical usefulness. Similarly, Li et al. [
31] analyzed breast cancer with bone metastases using XGBoost, SVM, and decision trees, reporting ROC-AUC values between 0.80 and 0.84 for 1-, 3-, and 5-year survival. However, the lack of PR-AUC or calibration assessment makes sensitivity–specificity trade-offs difficult to interpret in practical terms.
In another SEER-based investigation, Wu et al. [
10] employed a random survival forest (RSF) model for second primary breast cancer, obtaining a time-dependent AUC of approximately 0.805 and an integrated Brier score near 0.12. Their results highlight that survival-specific approaches may handle censoring effectively but often sacrifice interpretability. Li et al. [
11] reached similar conclusions while focusing on young breast cancer patients: although RSF delivered the highest concordance index among models tested, its complexity limited clinical interpretability. Baidoo and Rodrigo [
12] conducted a broader comparison including Cox proportional hazards, RSF, and DeepSurv models, reporting C-index values around 0.72 for RSF and demonstrating that deep learning may improve discrimination but not necessarily calibration or explainability.
Beyond survival-oriented models, other studies have emphasized reproducibility and transparency. Hegselmann et al. [
32] highlighted reproducible workflows for SEER-based survival tasks using logistic regression and multilayer perceptrons, stressing consistent cohort definitions and preprocessing to ensure comparability across studies. Javanmard et al. [
6] conducted a meta-analysis of AI methods for breast cancer survival prediction and found that although high discrimination metrics were frequently achieved, calibration and interpretability were seldom addressed. These findings underscore the need for rigorous statistical validation and reporting standards in oncology ML.
To position our contribution within closely related SEER/tabular studies,
Table 1 contrasts methods and reporting practices. In particular, we highlight whether prior work reports PR–AUC, calibrates probabilities, includes external validation, and releases reproducible artifacts.
Taken together, these comparisons motivate our focus on PR–AUC, calibrated probabilities (Brier/ECE with Platt scaling), fixed-sensitivity operating points, paired ΔAUC bootstrap, and fully scripted outputs under identical preprocessing.
Complementary research outside SEER provides additional insights. Lotfnezhad Afshar et al. [
33] showed that missing-data handling and feature selection often influence results as strongly as algorithm choice, an issue highly relevant to registry data. Premalatha et al. [
34] compared several classifiers (RF, SVM, NN, AdaBoost) for detection rather than mortality, demonstrating that focusing solely on accuracy can mask poor recall in imbalanced settings. Similarly, Chen et al. [
35] used LightGBM for ovarian cancer prognosis on SEER data, achieving strong ROC-AUC performance but emphasizing the importance of external validation and generalizability for clinical translation.
Overall, the literature reveals three consistent patterns. First, most SEER-based breast cancer models report strong ROC-AUCs yet omit probability calibration, decision-threshold analysis, or precision–recall evaluation, limiting their interpretability in screening or triage contexts. Second, redundancy among hierarchical features such as AJCC stage, T and N categories, and lymph node counts is rarely addressed, potentially inflating model performance. Third, few studies ensure identical preprocessing, sampling, and validation protocols when comparing interpretable linear methods with nonlinear “black-box” models, making fair benchmarking difficult.
The present study directly addresses these limitations by implementing a statistically rigorous, transparent comparison between L1-regularized logistic regression and a feedforward neural network under identical experimental conditions, explicitly evaluating both discrimination and calibration to support clinically meaningful, explainable mortality prediction. In this sense, our methodological design is not only a comparative exercise but a reproducible framework aimed at bridging the gap between statistical rigor, clinical interpretability, and equitable deployment of predictive models in population-level cancer data.
3. Materials and Methods
3.1. Data Source, Cohort, and Outcome
Data were obtained from the November 2017 release of the SEER Program (NCI), which provides population-based cancer statistics for the United States. We included female patients diagnosed between 2006 and 2010 with infiltrating duct and lobular carcinoma (ICD-O-3 histology 8522/3). Clinical exclusion criteria were unknown tumor size, unknown number of examined regional lymph nodes, unknown number of positive lymph nodes, or survival time below one month. These filters removed 35 records from the original 4059 entries (0.86%). During preprocessing, 19 additional incomplete rows were removed using case-wise deletion (0.47% of the filtered dataset). The final analytical cohort comprised 4005 patients, representing a total reduction of 54 cases (1.33%).
This same cohort has been used in the U-BRITE “AI Against Cancer” Hackathon (
https://cancer.ubrite.org/hackathon-2021/, accessed on 15 July 2025) and is mirrored on IEEE Dataport [
36]. SEER data are fully de-identified and were used under the standard SEER Research Data Use Agreement; institutional review board approval was not required.
For modeling, we analyzed a SEER-derived table containing the following variables: Age, Race, Marital Status, T Stage, N Stage, 6th Stage, differentiate, Grade, A Stage, Tumor Size, Estrogen Status, Progesterone Status, Regional Node Examined, Regional Node Positive, Survival Months, and Status. The endpoint Status was binarized as 1 (deceased) and 0 (alive). Since the cohort exclusively targets breast cancer, sex was not included as a predictor. Survival months were later used to construct horizon-specific outcomes (
Section 3.2), replacing the original cross-sectional formulation.
3.2. Outcome Definition Under Fixed Time Horizons
To address the methodological limitation highlighted by reviewers regarding the absence of a well-defined prediction target and the improper handling of censoring, we reformulated the problem as fixed-horizon mortality prediction. Two clinically meaningful horizons were selected: 3 years (36 months) and 5 years (60 months). For a given horizon
H, patients were labeled as
Patients who died after the horizon or who were censored before H were excluded. This procedure yields clean horizon-specific binary outcomes without requiring survival modeling or assumptions about censoring mechanisms. Separate pipelines were run independently for and months. For the 3-year horizon, 448 patients (11.13% of the cohort) were excluded due to indeterminate outcome status, including 67 patients alive with follow-up shorter than 36 months and 381 patients who died after the 36-month horizon. For the 5-year horizon, exclusions increased to 912 patients (22.66%), comprising 754 living patients with follow-up shorter than 60 months, and 158 patients who died beyond the 60-month horizon.
3.3. Preprocessing, Feature Engineering, and Data Split
Column names were normalized to handle whitespace, case differences, and minor misspelings (e.g., Regional Node Positive). After import, variable types were checked for consistency, unused categorical levels were removed, and completeness was assessed row-wise. To avoid imputation-related bias, incomplete rows were removed, yielding the 4005 records used throughout the study.
Categorical predictors (Race, Marital Status, T Stage, N Stage, 6th Stage, differentiate, Grade, A Stage, Estrogen Status, Progesterone Status) were one-hot encoded. Numeric predictors (Age, Tumor Size, Regional Node Examined, Regional Node Positive) were kept as continuous variables. We derived the lymph node ratio (LNR) as
to avoid division by zero. All predictors were standardized using z-score scaling based on training-set statistics only, ensuring methodological consistency.
Random seed rng(42) ensured reproducibility. We created a fixed 60/20/20 train/validation/test split via index permutation, reused for each horizon and for all models. Stratification was not imposed on this single split to preserve comparability with prior literature, but all cross-validation procedures were stratified.
3.4. Grid Search, Models, and Training
We compared L1-regularized logistic regression with feedforward artificial neural networks (ANNs) implemented in MATLAB using patternnet (R2025a).
To avoid relying on a single, arbitrarily chosen ANN topology, we performed an explicit grid search over network capacity and training budget. Candidate architectures included both single- and two-hidden-layer networks:
combined with epoch budgets
. All models used trainscg (scaled conjugate gradient), early stopping based on the validation partition, and softmax outputs for probabilistic prediction.
Because mortality prevalence is low, we used class weights fixed a priori (not tuned) and computed from the training data only. Specifically, we applied inverse-frequency weighting so that each class contributes approximately equally to the loss:
where
is the number of training samples in class
c. The same weighting rule was used for every ANN architecture, for both horizons, and across all runs; thus, class weights were not treated as a hyperparameter in the grid search.
Although a global random seed was set for reproducibility at the pipeline level, ANN training remains stochastic due to random initialization and optimizer dynamics. Therefore, for each candidate architecture we repeated training across
random seeds while keeping the 60/20/20 split fixed, and summarized validation discrimination as mean ± SD ROC–AUC across seeds. This repeated-seed protocol quantifies variability attributable to ANN stochasticity and supports the stability claims reported in the
Section 4 (
Figure 1 and
Figure 2).
For each horizon (3-year and 5-year), the final ANN configuration was selected by maximizing the mean validation ROC–AUC across the repeated runs (with SD retained as a stability indicator). The selected architecture was then used for downstream evaluation under the unified preprocessing and reporting pipeline.
3.5. Model Selection Rationale and Feature Pruning
Because horizon-specific exclusion alters the feature distribution, pruning was guided by clinical interpretability and redundancy removal rather than p-values. Composite or hierarchical staging variables (6th Stage, A Stage, T Stage, N Stage, Regional Node Examined) were removed; directly measured predictors (Age, Tumor Size, Regional Node Positive, LNR, Grade, differentiate, Estrogen Status, Progesterone Status, Race, Marital Status) were retained. The pruning mask was applied identically across horizons to ensure consistency.
The ANN architecture was selected empirically from the grid search, not predetermined. This departs from the original specification of a fixed network and yields demonstrable improvements in validation AUC, particularly at the 3-year horizon.
3.6. Evaluation, Thresholds, and Uncertainty
Discrimination was quantified with ROC-AUC and PR–AUC. Accuracy, precision, recall, specificity, negative predictive value (NPV), and F1 were computed at threshold 0.50 and at the Youden J optimum. Confusion matrices were normalized. PR–AUC was integrated by trapezoids.
Calibration was assessed with Brier score and expected calibration error (ECE; 10 bins), supplemented by reliability diagrams. Platt scaling was applied using validation predictions and evaluated exclusively on the test partition.
For each horizon, paired nonparametric bootstrap (1000 resamples) was used to estimate confidence intervals for the AUC difference . Significance was assessed only for AUC differences, consistent with recommendations for imbalanced outcomes.
Clinically oriented operating points were computed by fixing sensitivities of 0.80 and 0.90 and extracting specificity, precision, NPV, and F1 from ROC coordinates.
3.7. Cross-Validation and Computational Artefacts
Five-fold stratified cross-validation (CV) was used to quantify model stability under sampling variation, not to tune hyperparameters. For each horizon, folds were generated by stratifying on the binary outcome, and both models were retrained from scratch in each fold using identical preprocessing (one-hot encoding and z-score standardization computed on the corresponding training fold only).
To avoid information leakage from hyperparameter selection, the ANN architecture and the L1-logistic regression regularization strength were treated as fixed during CV (i.e., the configurations selected on the hold-out validation split for each horizon were not re-optimized inside each fold). Thus, cross-validation is reported strictly as a stability analysis under resampling.
Because artificial neural network (ANN) training remains stochastic due to random initialization and optimizer dynamics, a single training run per fold is insufficient to characterize variability. Therefore, within each fold we repeated ANN training using multiple random seed initializations ( seeds per fold). For each fold we report the mean ± SD of ROC–AUC across seeds, and we summarize overall ANN stability across all fold × seed runs. In contrast, L1-regularized logistic regression is effectively deterministic given the training data and fixed , so it was trained once per fold.
This repeated-seed CV protocol enables a decomposition of ANN variability into (i) between-fold variation (sampling variability induced by different training subsets) and (ii) within-fold variation (initialization variability induced by random seeds). We report this decomposition to clarify whether observed instability is primarily driven by resampling or by stochastic optimization.
All computational artefacts were generated automatically by the MATLAB 2025a pipeline, including CSV tables containing per-fold and per-seed metrics (e.g., ROC–AUC) and publication-ready EPS figures. To facilitate reproducibility, all experiments used fixed random seeds for data partitioning and for the repeated-seed training protocol, and all exported artefacts follow consistent naming conventions by horizon and scenario.
We note that this cross-validation was not nested with the hyperparameter search; thus, validation-set performance used for ANN architecture selection is potentially optimistic. Cross-validation is reported to quantify stability under resampling (and, for ANN, under initialization), and the validation AUC is interpreted only as a selection criterion rather than an unbiased final performance estimate.
4. Results
The final analytical cohort consisted of 4005 patients with 31 predictors and an overall mortality prevalence of 15.2%. Both models were trained and evaluated using identical 60/20/20 train–validation–test splits to ensure fair comparison under controlled preprocessing conditions. In response to reviewer concerns, both the ANN architecture and the logistic regression regularization strength () were selected using the validation set within each horizon, ensuring a symmetric model-selection protocol.
Our analysis reveals three primary findings. First, L1-regularized logistic regression consistently outperforms neural networks in probability calibration—a critical property for clinical deployment—despite comparable discrimination metrics. Second, the ANN exhibits marked sensitivity to training stochasticity, and validation-selected performance can substantially exceed cross-validation estimates (optimization bias). Third, prediction difficulty increases at the 5-year endpoint: both models degrade, but logistic regression preserves superior stability and calibration quality. Together, these results support interpretable linear models as the preferred architecture for tabular oncology registries when well-calibrated risk estimates are required for decision support. Repeated-seed cross-validation further confirmed that ANN performance variability is dominated by stochastic initialization effects rather than resampling alone, whereas logistic regression exhibited consistently narrow dispersion across folds.
To assess potential selection bias introduced by excluding patients with indeterminate fixed-horizon outcomes (alive with follow-up shorter than the horizon, or deaths occurring after the horizon), we quantified exclusions and re-ran the full modeling pipeline under two extreme labeling assumptions. Starting from the original cohort (), the 3-year horizon ( months) retained 3576 usable cases (events = 235, controls = 3341) and excluded 448 cases (11.13%), comprising 67 patients alive with follow-up months and 381 deaths occurring after 36 months. The cleaned analytical set used for modeling contained cases with prevalence . Under the optimistic assumption (all indeterminate cases treated as non-events), the dataset size increased to with prevalence ; under the pessimistic assumption (all indeterminate cases treated as events), with prevalence . Across these scenarios, logistic regression preserved better probability calibration (3-year: Brier and ECE in the base scenario; optimistic: Brier , ECE ; pessimistic: Brier , ECE ), while the ANN remained substantially miscalibrated (3-year base: Brier , ECE ; optimistic: Brier , ECE ; pessimistic: Brier , ECE ). Discrimination varied with prevalence as expected but the qualitative model comparison remained consistent (3-year AUC: LR vs. ANN in the base scenario). For the 5-year horizon ( months), 3112 usable cases were retained (events = 458, controls = 2654) and 912 cases were excluded (22.66%), comprising 754 patients alive with follow-up months and 158 deaths occurring after 60 months. The cleaned analytical set contained with prevalence ; the optimistic and pessimistic scenarios yielded with prevalences and , respectively. Logistic regression again showed consistently superior calibration (5-year base: Brier , ECE ; optimistic: Brier , ECE ; pessimistic: Brier , ECE ) compared with the ANN (5-year base: Brier , ECE ; optimistic: Brier , ECE ; pessimistic: Brier , ECE ). These results indicate that our main conclusion—logistic regression provides more clinically reliable probability estimates than the ANN on this registry-derived tabular task—does not critically depend on the fixed-horizon exclusion strategy and remains robust under extreme censoring assumptions.
4.1. Hyperparameter Exploration
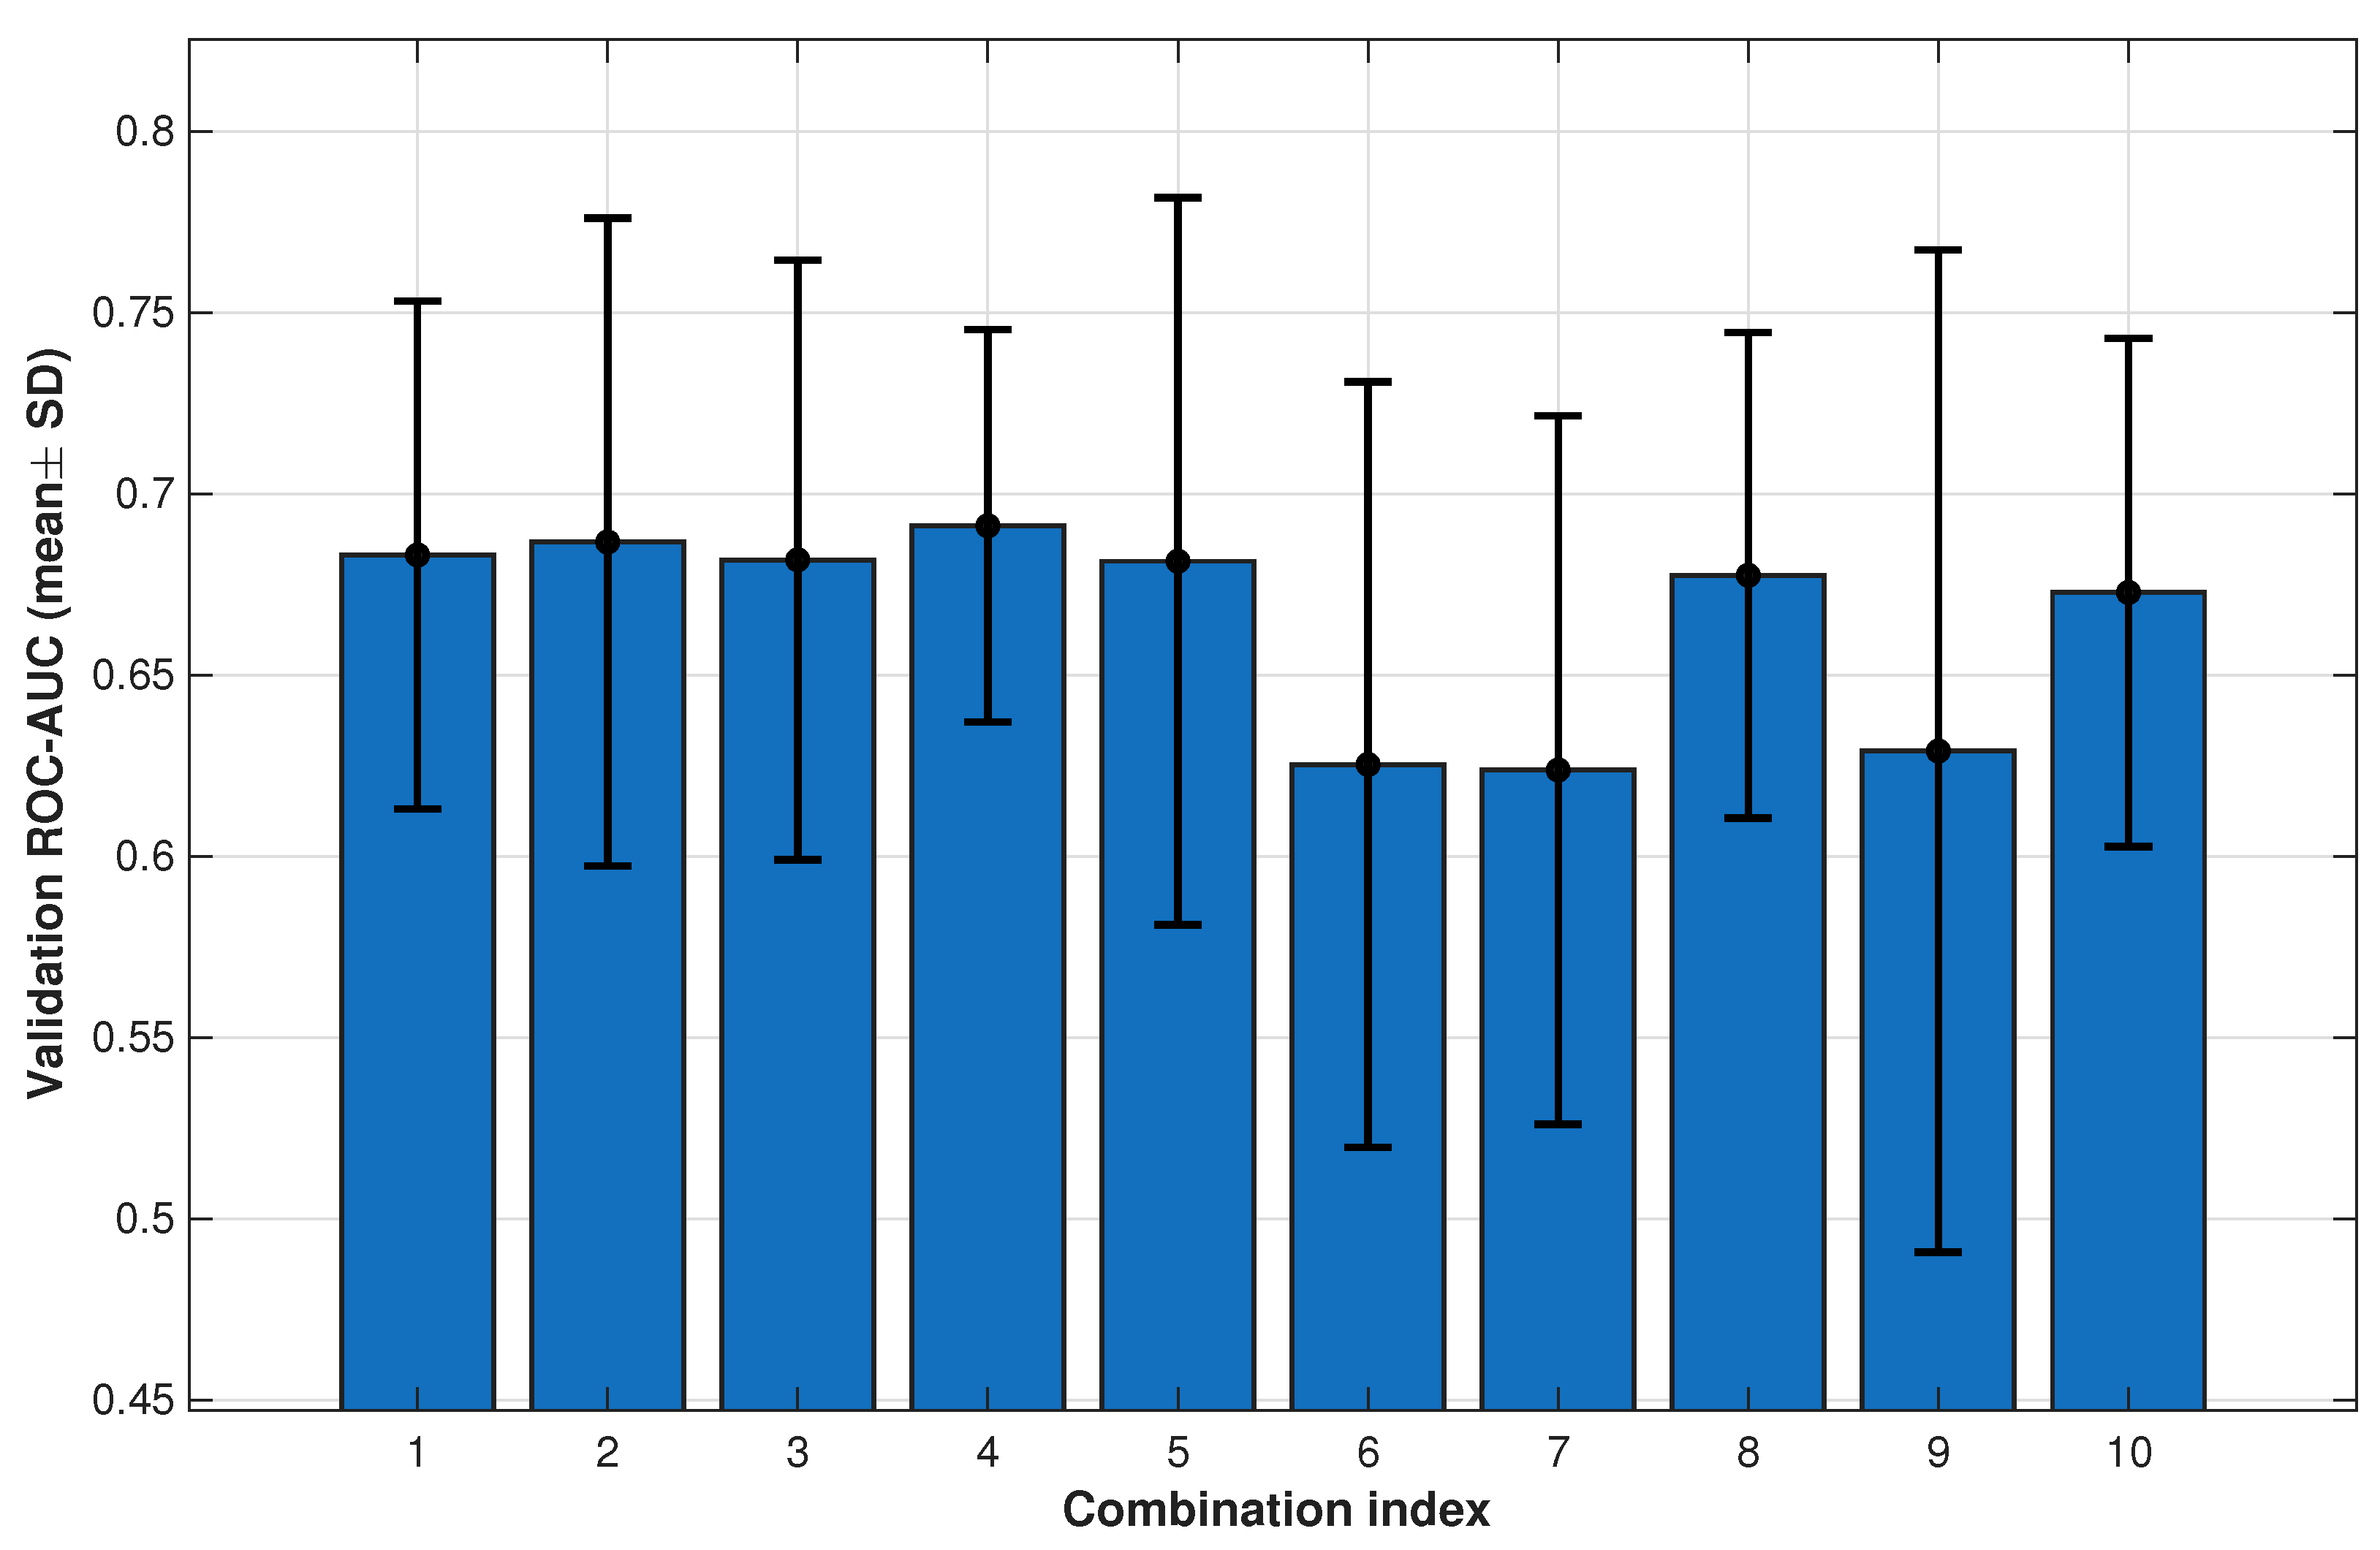
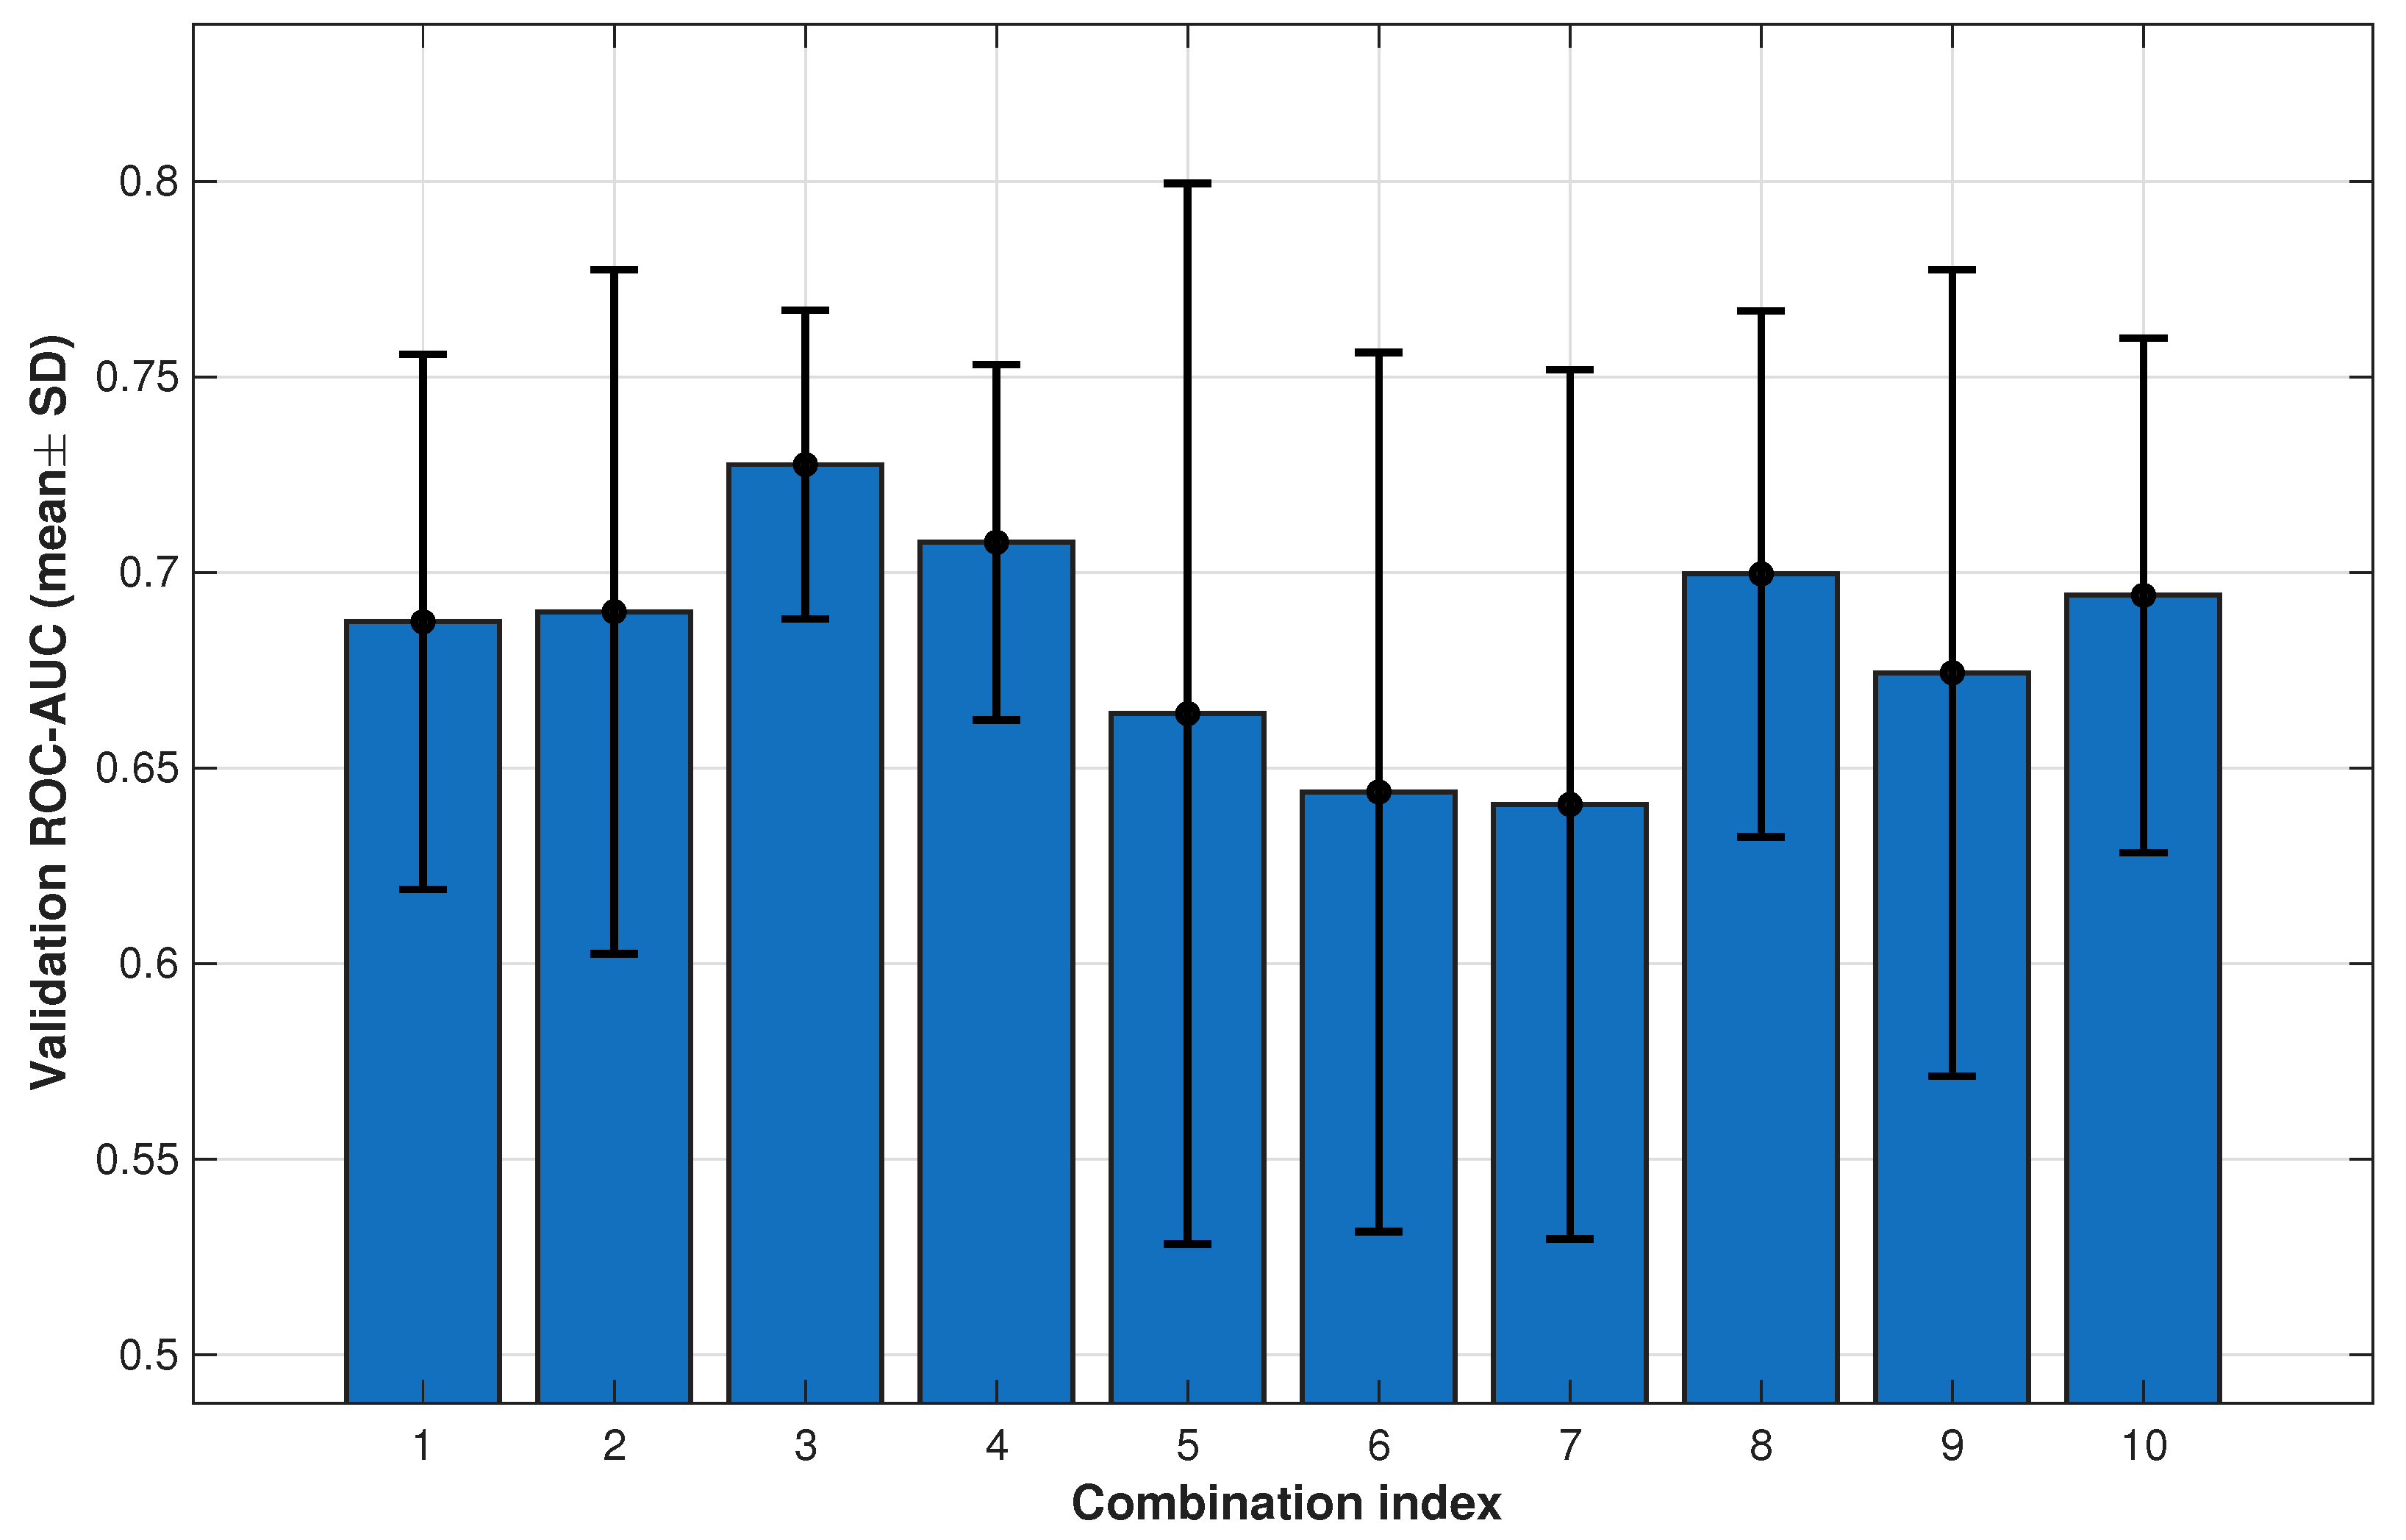
To address methodological concerns regarding ANN architecture selection, we conducted a structured grid search across 10 configurations combining shallow-to-moderate architectures (8–64 units per layer, 1–2 hidden layers) with training budgets of 300–400 epochs. Importantly, for each architecture, we repeated training across
fixed random seeds (keeping the 60/20/20 split fixed) and summarized the validation ROC–AUC as mean ± SD to quantify optimization variability.
Figure 1 and
Figure 2 show a consistent pattern: modest networks (typically 16–32 neurons) achieve the best mean validation performance, whereas larger architectures degrade, consistent with overfitting in imbalanced tabular data. At the 3-year horizon, mean validation ROC–AUC values concentrate in a narrow range (approximately 0.68–0.69 across architectures), but exhibit substantial variability across random initializations, with standard deviations spanning roughly 0.05–0.10, indicating sensitivity to training stochasticity even under a fixed data split. At the 5-year horizon, moderate-capacity networks again dominate, with the best configuration (32 neurons) achieving the highest mean validation ROC–AUC (around 0.73) and noticeably lower variability (SD ≈ 0.04), while deeper or wider architectures show both reduced mean performance and, in some cases, markedly higher dispersion (SD exceeding 0.13). Overall, the error bars highlight that architectural ranking is influenced not only by mean discrimination but also by stability across seeds, reinforcing that increased network capacity does not translate into more reliable generalization for this tabular registry dataset.
Over the three-year horizon, mean validation performance concentrates within a relatively narrow AUC band, with the best-performing architecture achieving the highest mean validation ROC–AUC. At five years, several moderate architectures again attain the highest mean validation AUC values, while larger configurations remain inferior on average. These results indicate that increasing capacity does not improve generalization for this registry-derived tabular cohort.
Critically, even with repeated-seed averaging, validation performance during architecture selection can exceed subsequent cross-validation estimates, indicating selection-induced optimism. This train–test gap—common in hyperparameter tuning workflows—underscores the importance of nested cross-validation or independent validation cohorts for unbiased model assessment.
The pronounced validation–CV discrepancy for the ANN is consistent with optimization bias: architectural choices are made by maximizing validation ROC–AUC under a single split, so the selected configuration is biased toward that validation partition. Consequently, validation AUC from grid search should not be interpreted as an unbiased estimate of generalization. In this work, we therefore treat 5-fold stratified cross-validation results as the primary indicator of model stability under sampling perturbations, and report single-split test performance as a controlled point estimate under a fixed preprocessing pipeline.
A standard remedy would be nested cross-validation, where an outer loop estimates generalization and an inner loop performs hyperparameter selection (architecture and regularization) to prevent information reuse. While nested CV would further reduce optimism, it multiplies computational cost substantially for a multi-architecture ANN grid across two horizons. We therefore explicitly acknowledge this optimism effect and interpret ANN discrimination results conservatively, emphasizing that the calibration conclusions (LR consistently lower Brier/ECE) remain stable across horizons and censoring assumptions.
4.2. Horizon-Specific Performance Comparison
Because mortality risk evolves nonlinearly over time, we evaluated both models at clinically relevant 3-year and 5-year endpoints. We assessed discrimination (ROC–AUC, PR–AUC) and calibration quality (Brier score, expected calibration error; ECE). Importantly, to ensure fairness, logistic regression was also tuned per horizon by selecting the L1 regularization parameter on the validation partition, matching the ANN selection protocol.
4.2.1. Fair Selection for Logistic Regression
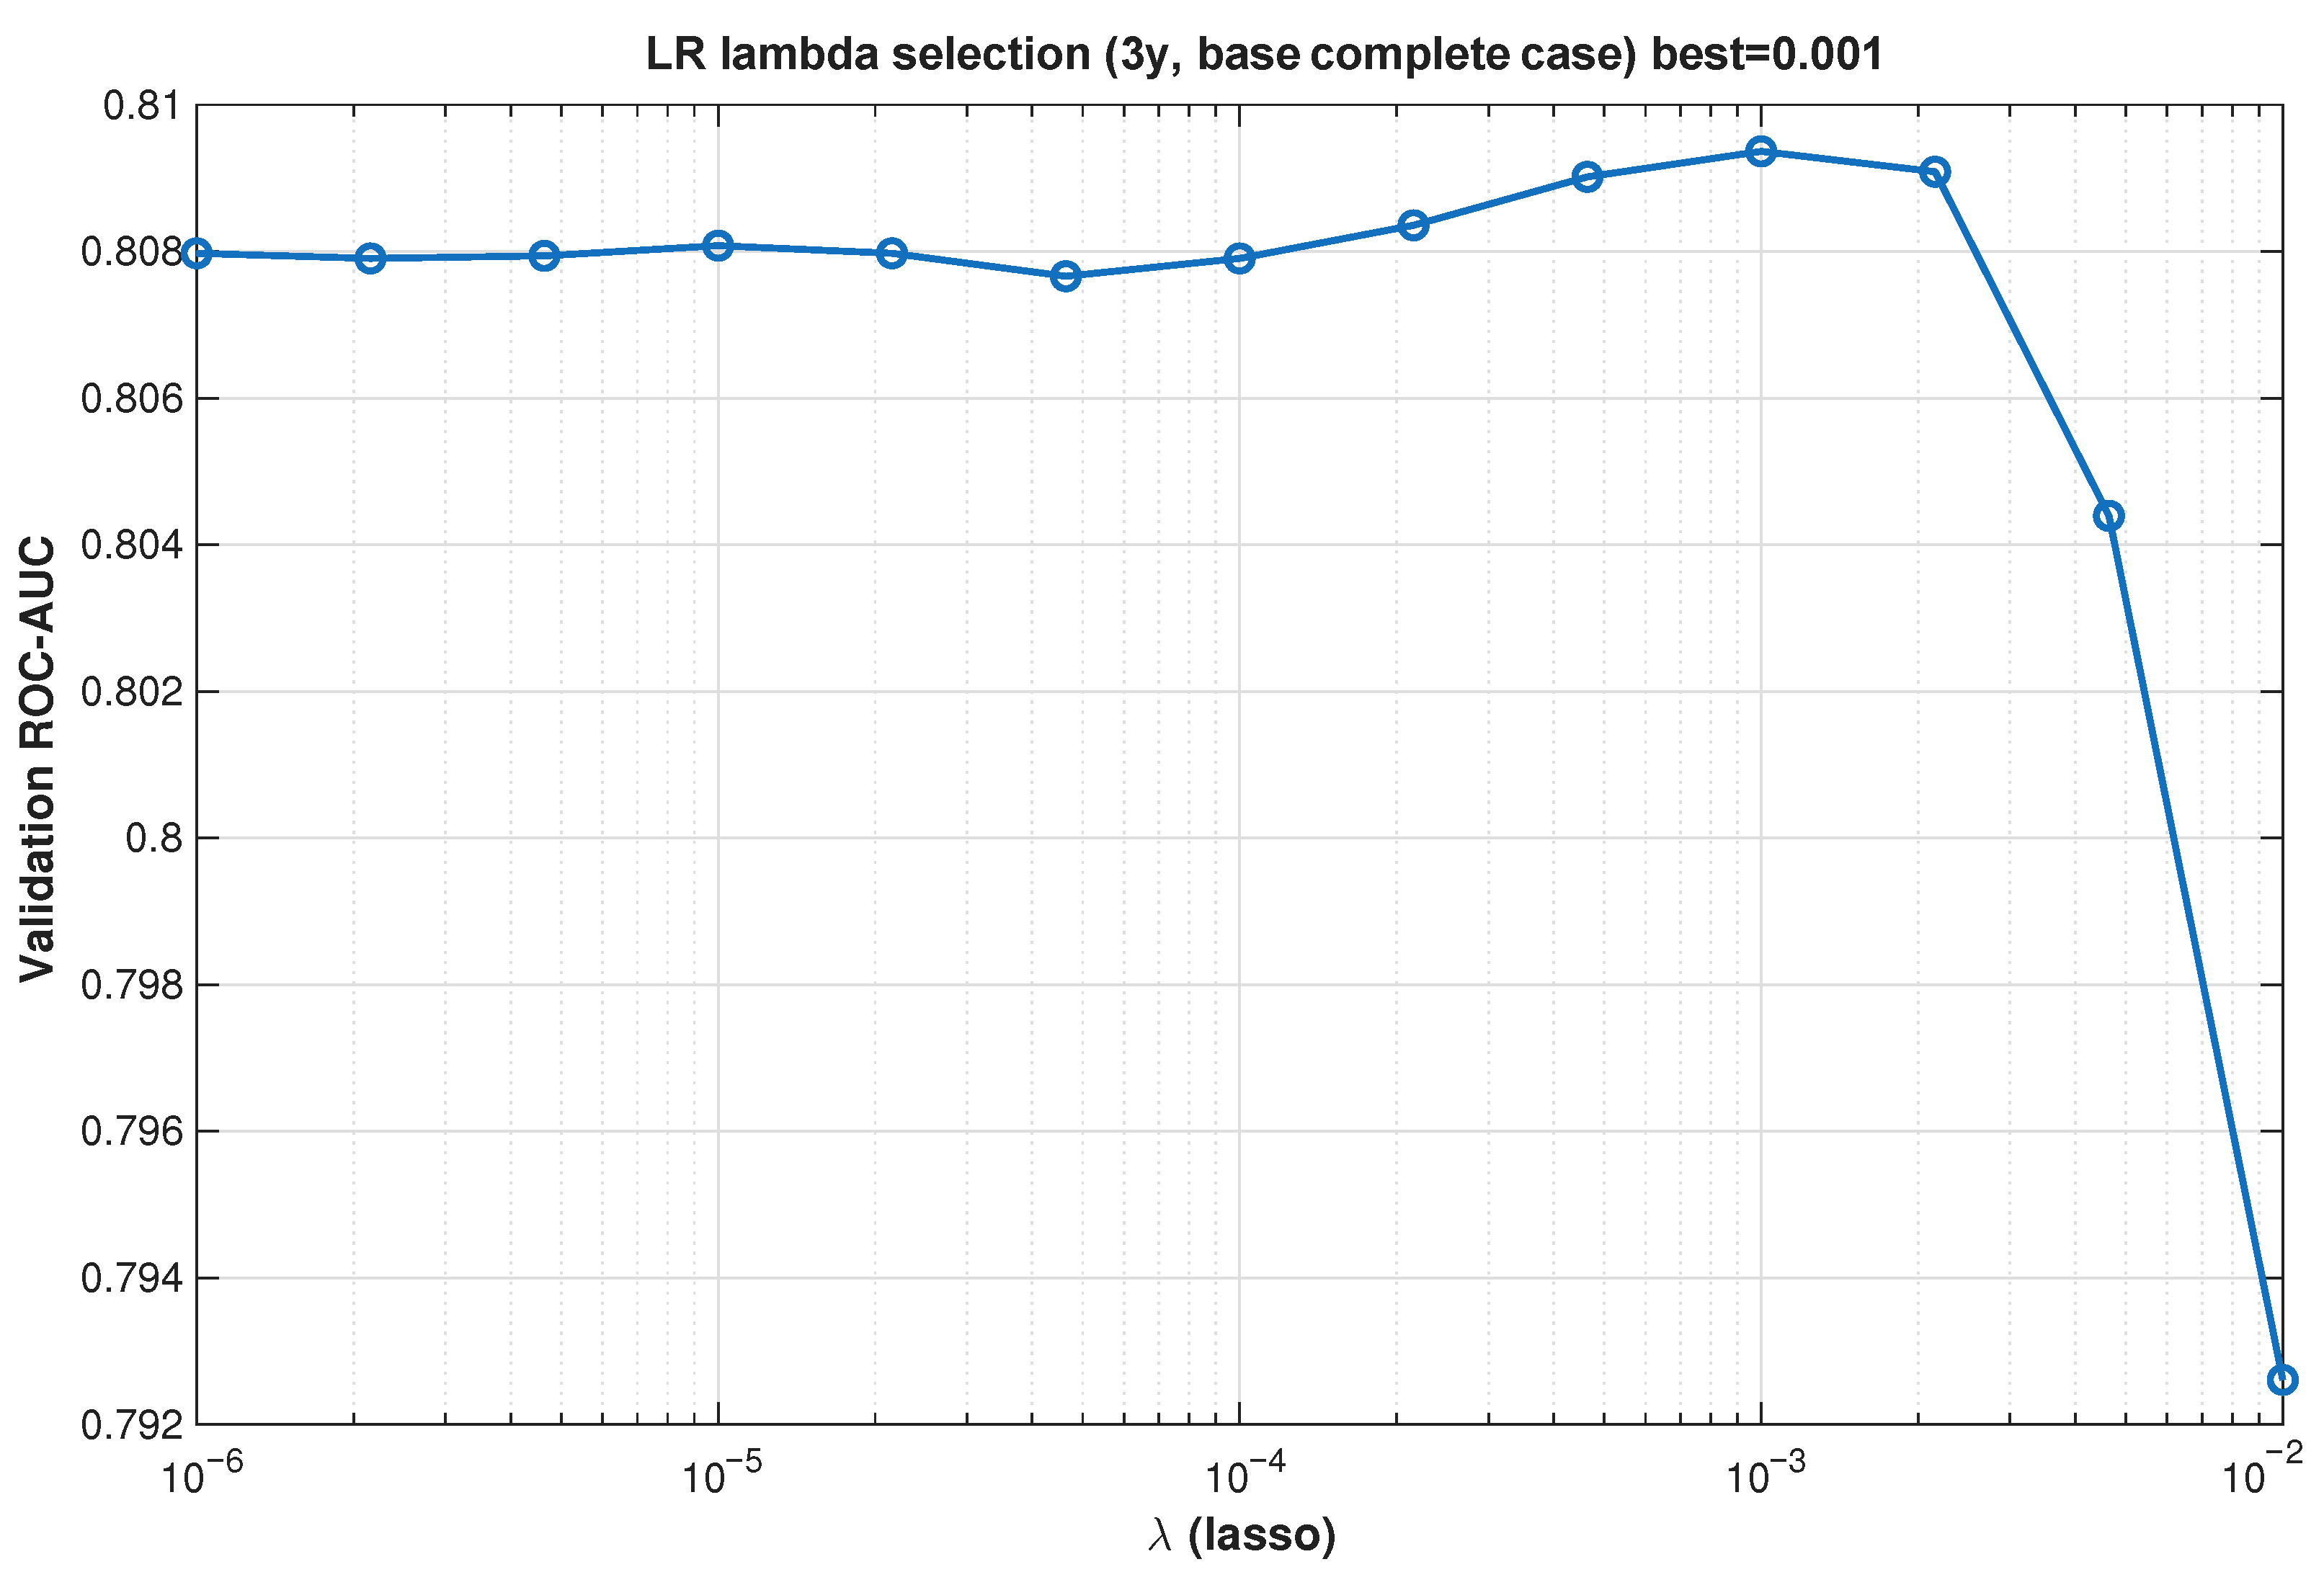
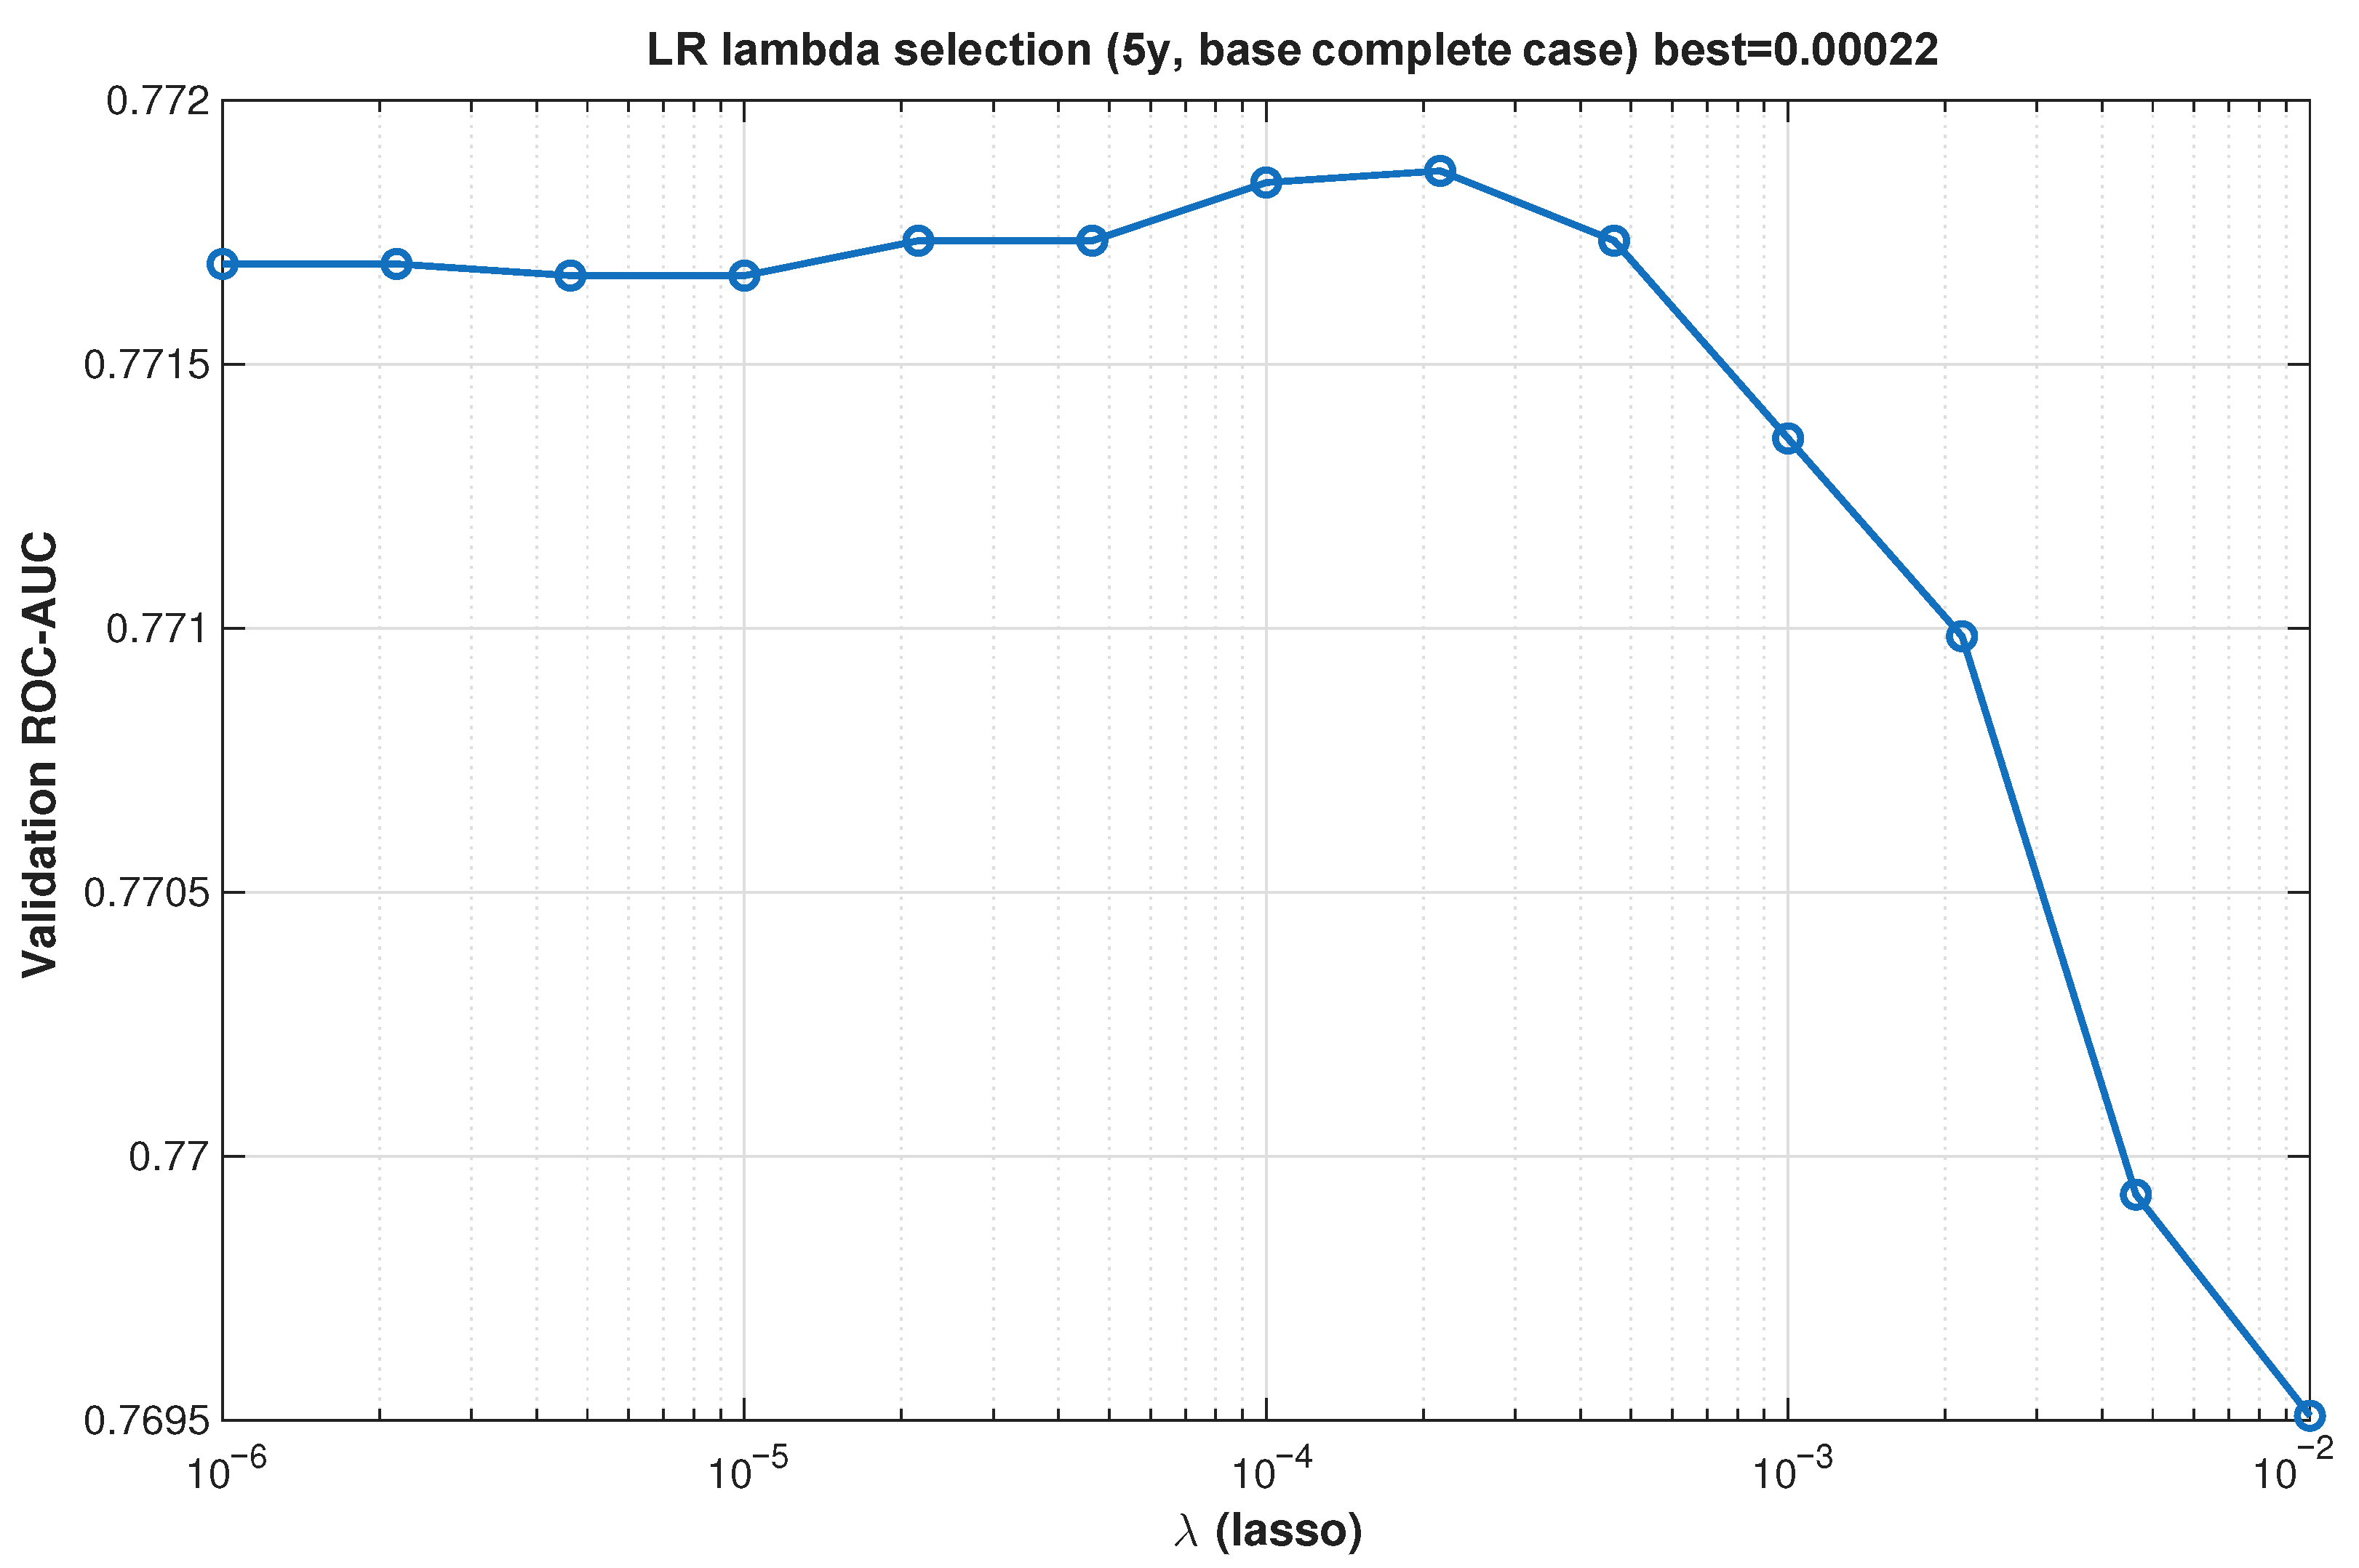
Figure 3 and
Figure 4 show validation ROC–AUC as a function of
(L1 penalty). In both horizons, performance exhibits a broad plateau across several orders of magnitude, indicating that discrimination is relatively robust to moderate regularization changes. The best
was selected by maximizing validation ROC–AUC and subsequently fixed for test evaluation.
4.2.2. Three-Year Mortality Prediction: Comparable Discrimination, Divergent Calibration
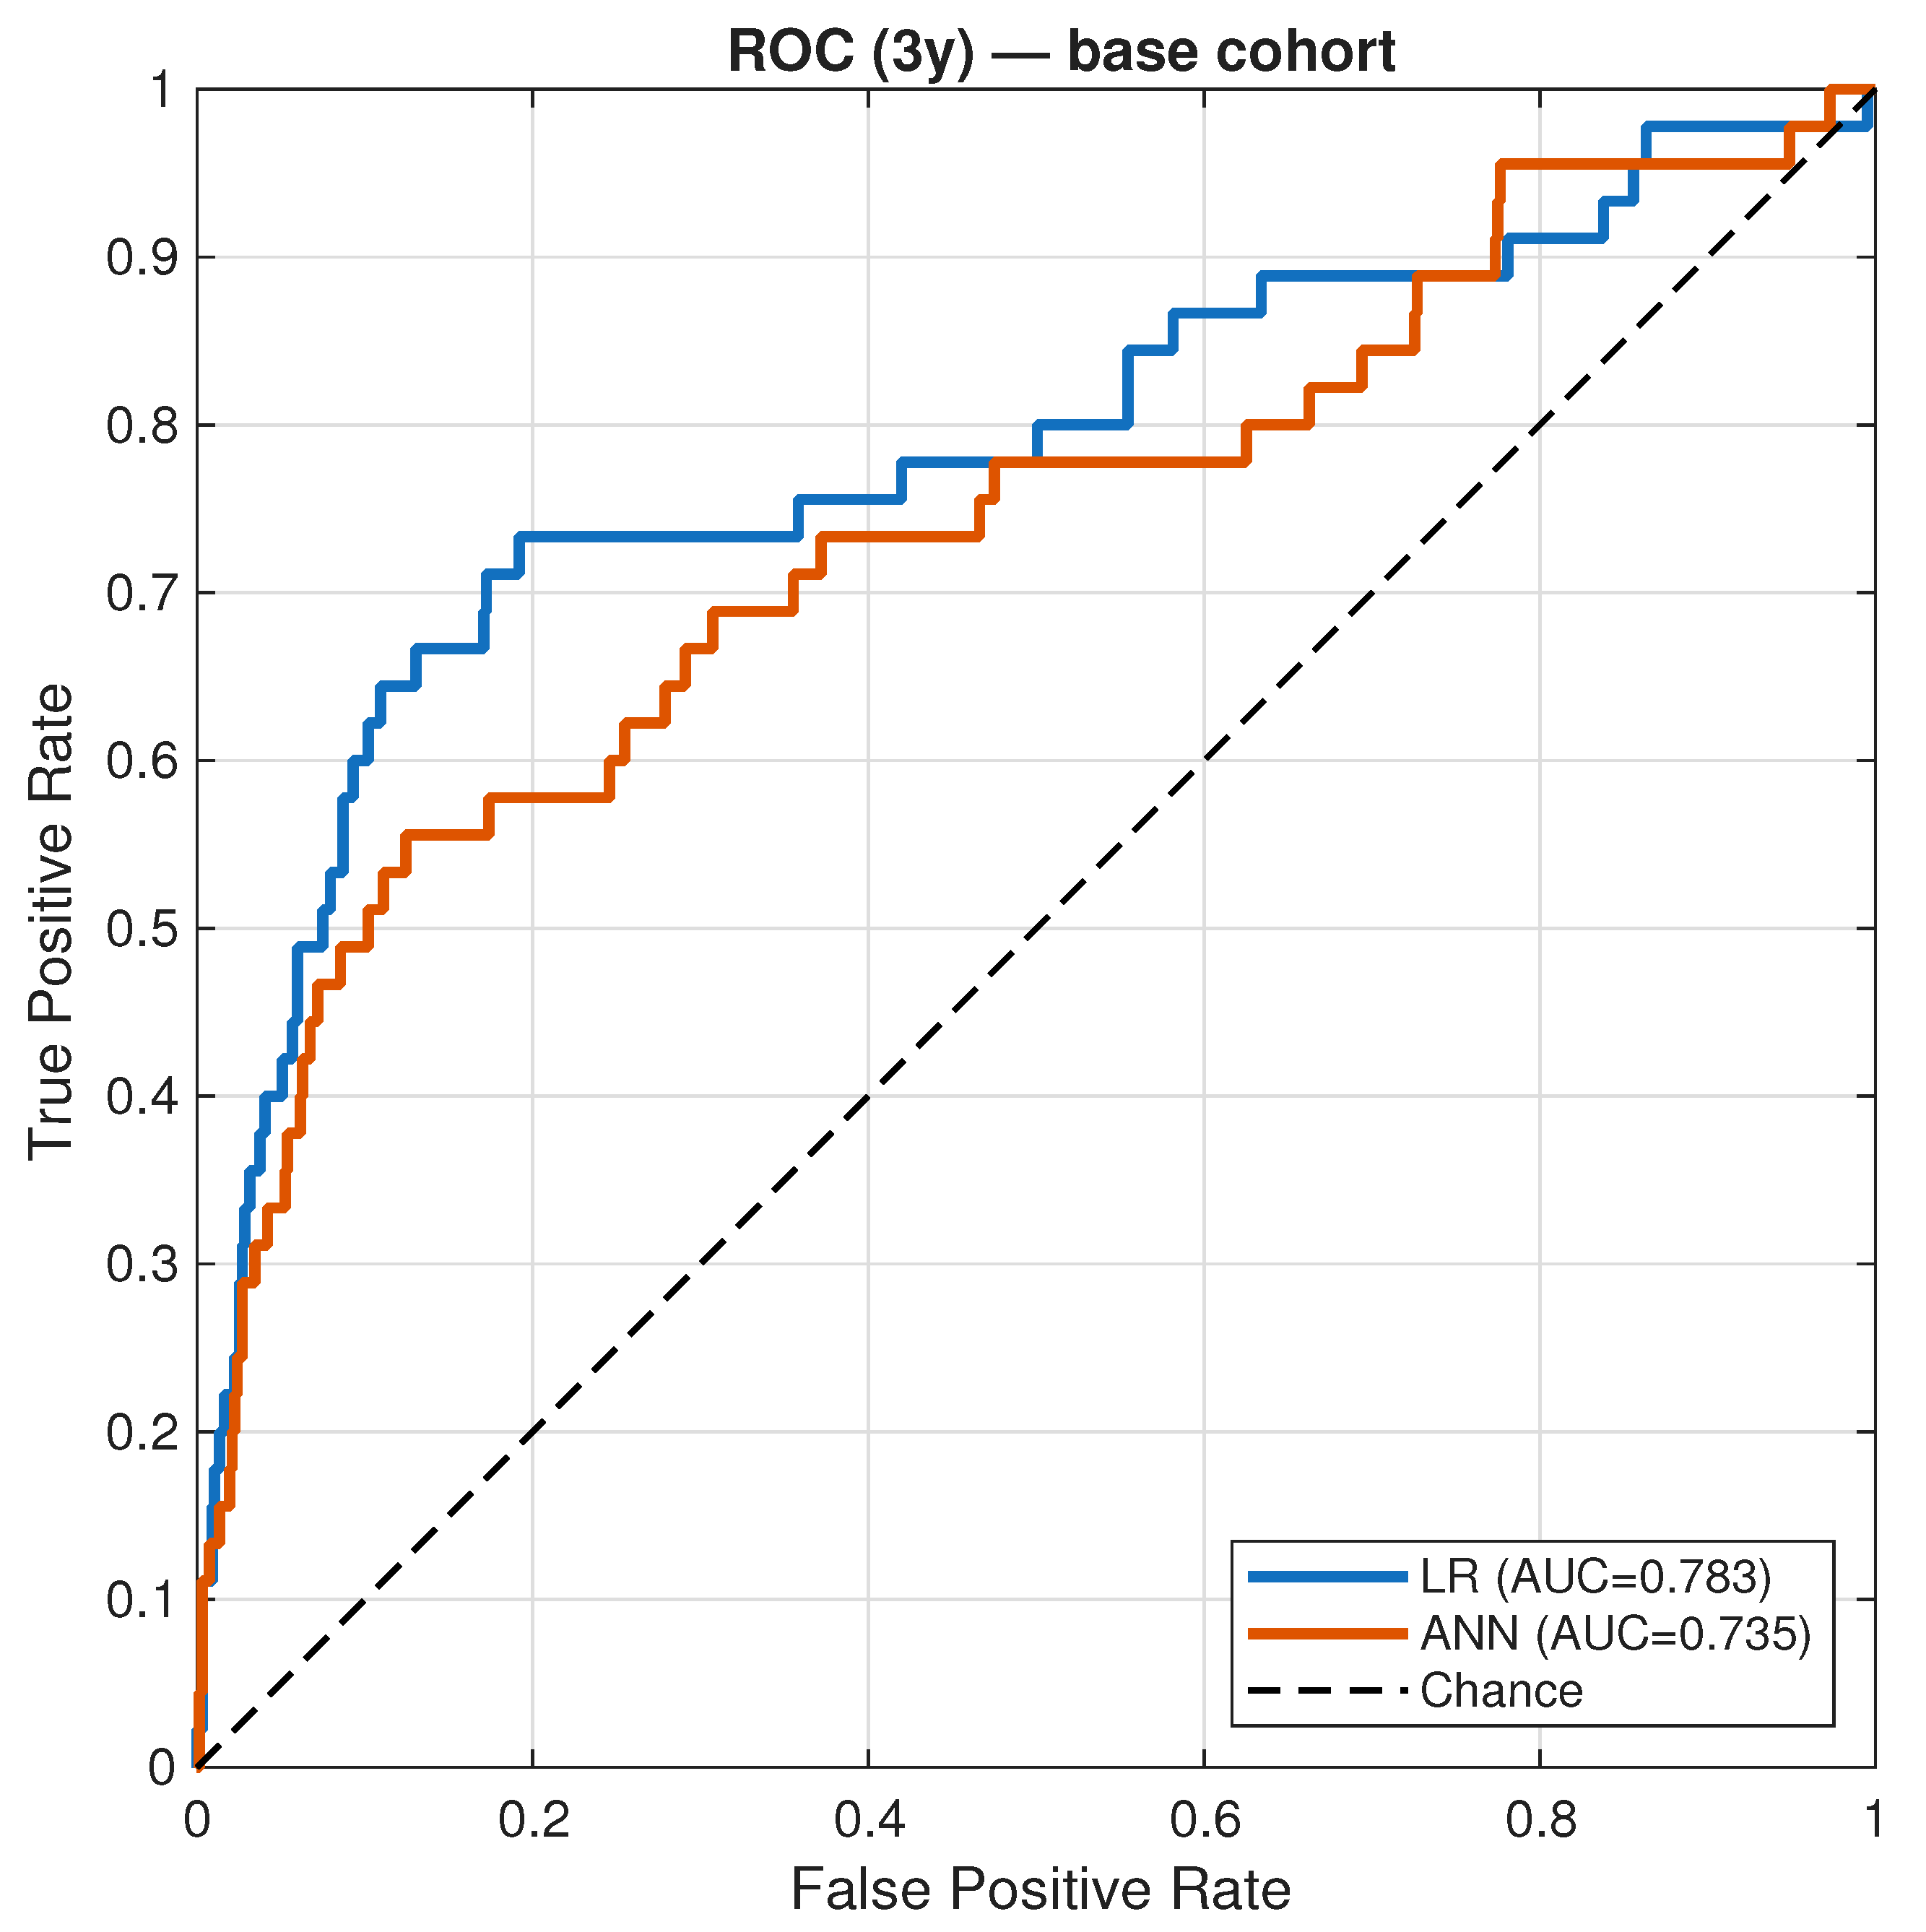
At the 3-year horizon, both models achieved similar discrimination.
Figure 5 shows ROC curves for logistic regression and ANN on the same axes.
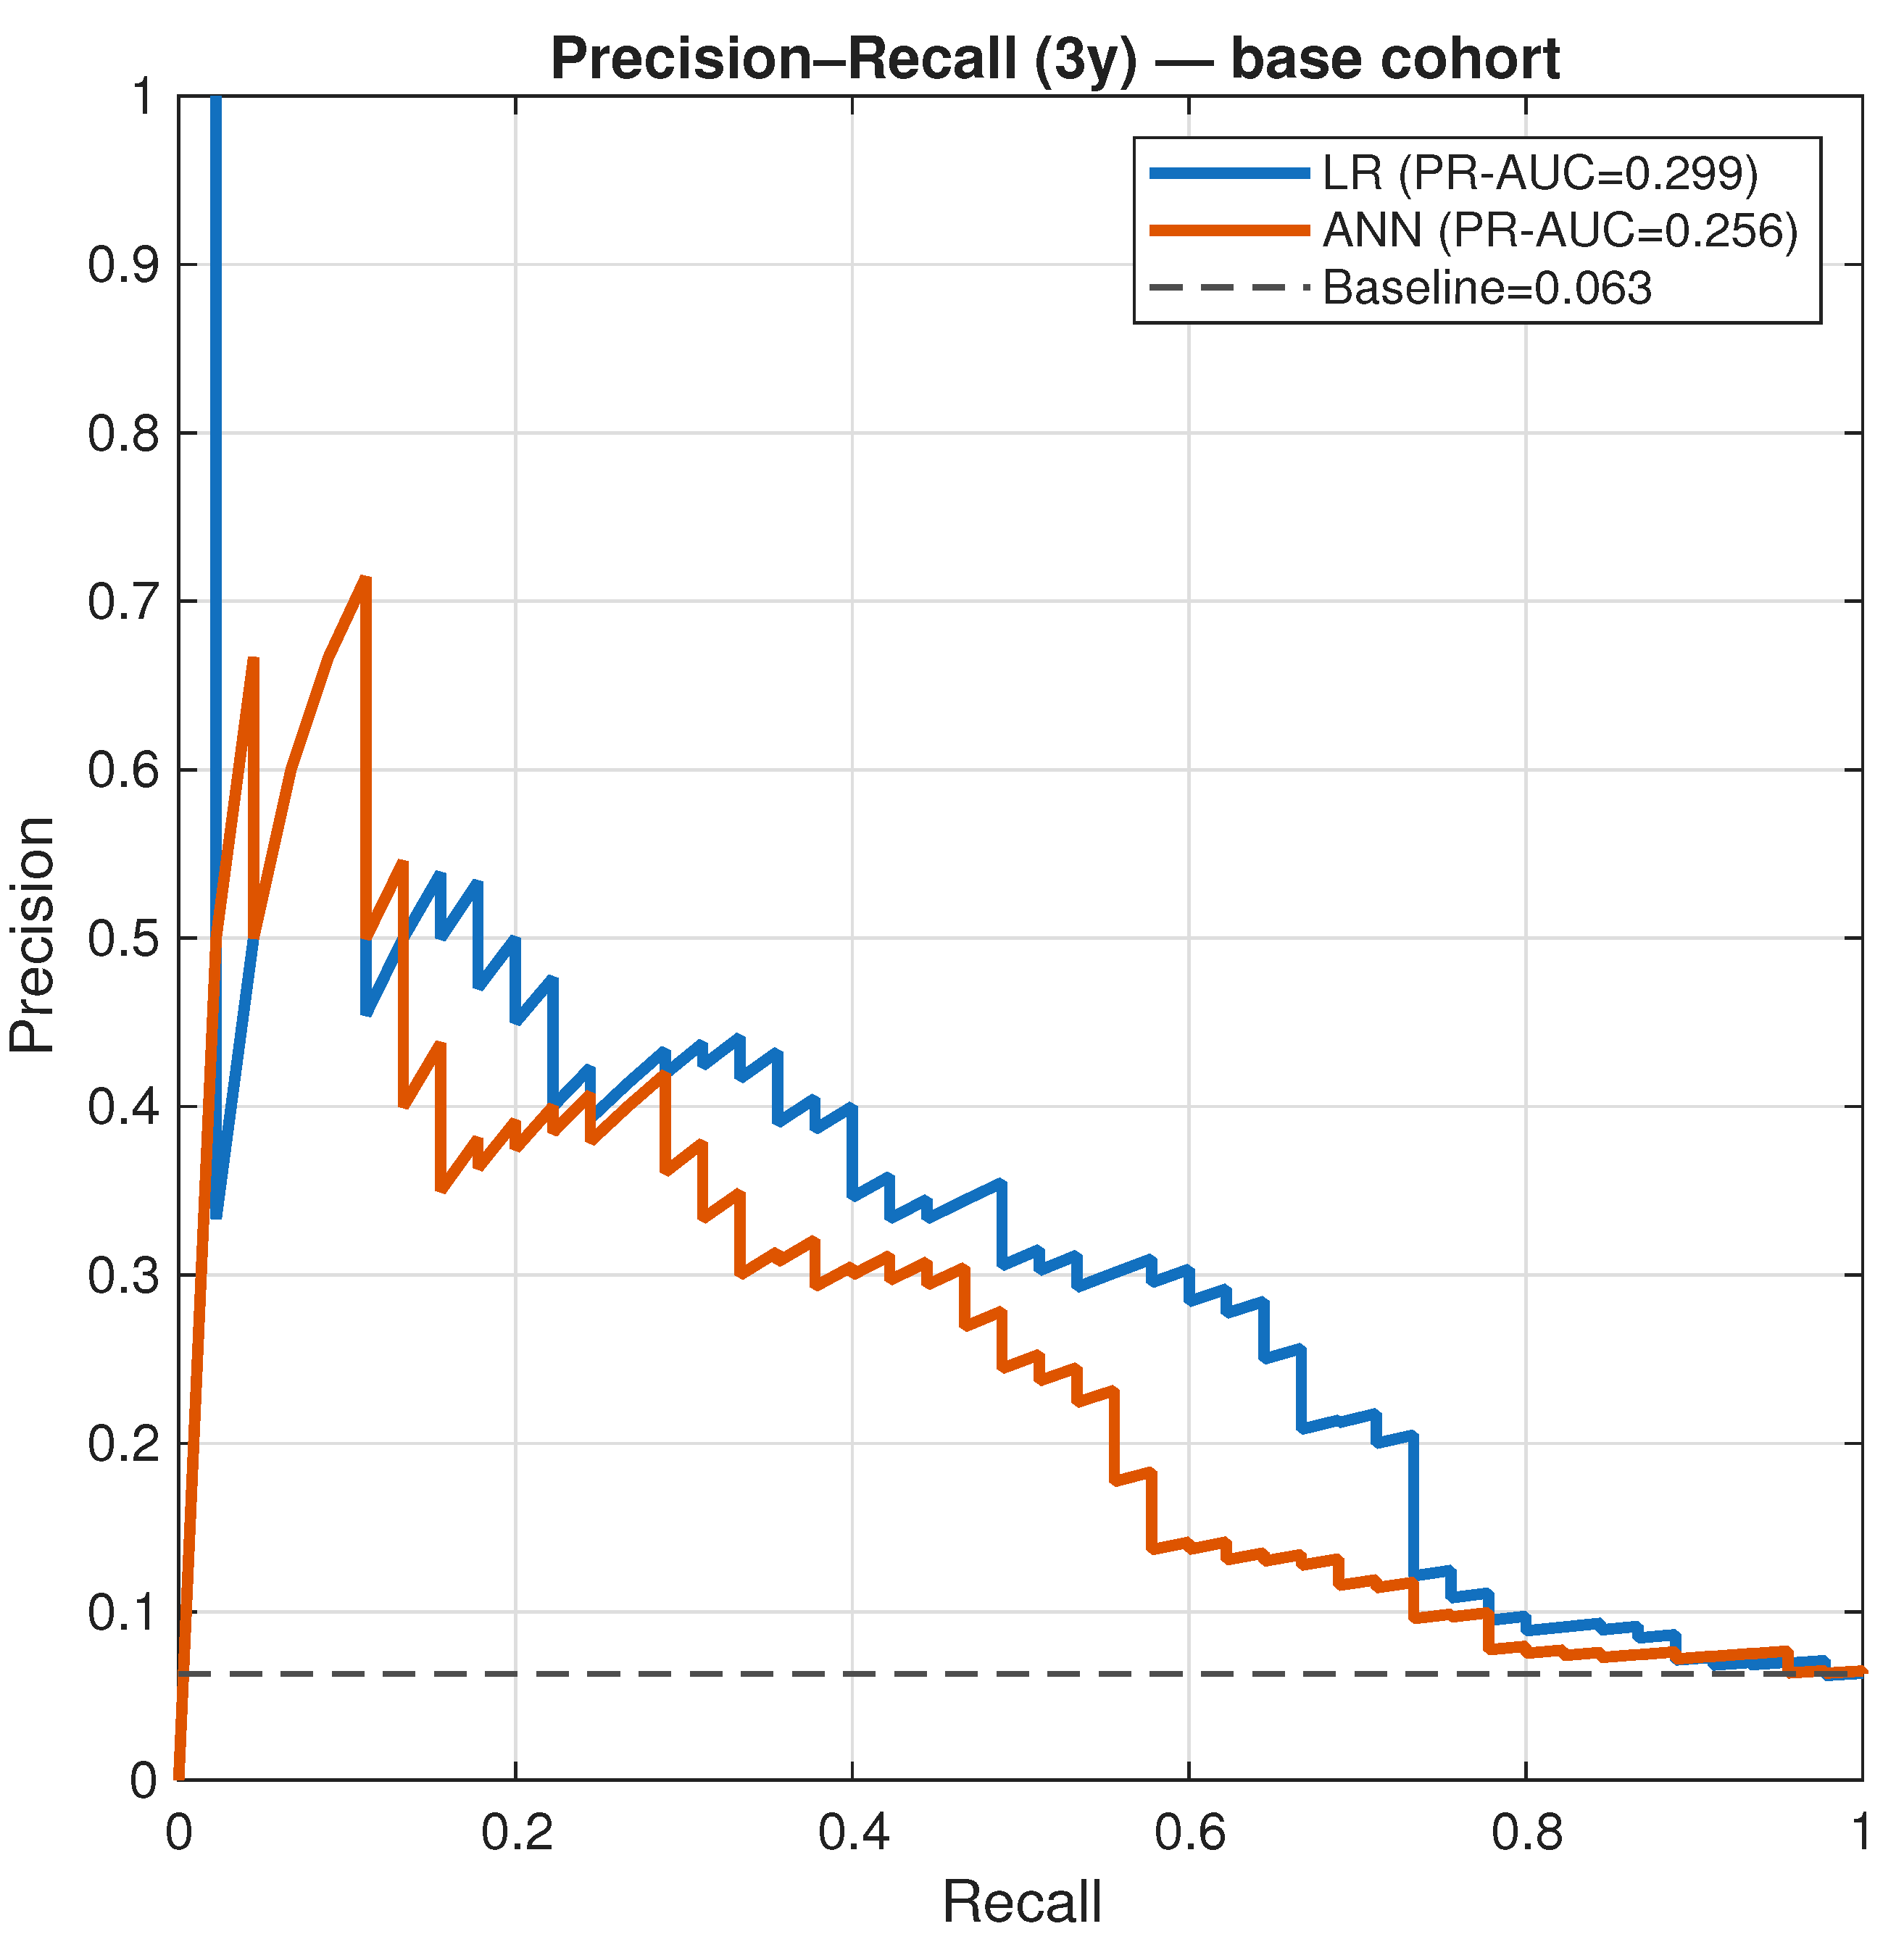
Figure 6 presents the corresponding precision–recall curves; both remain above the prevalence baseline.
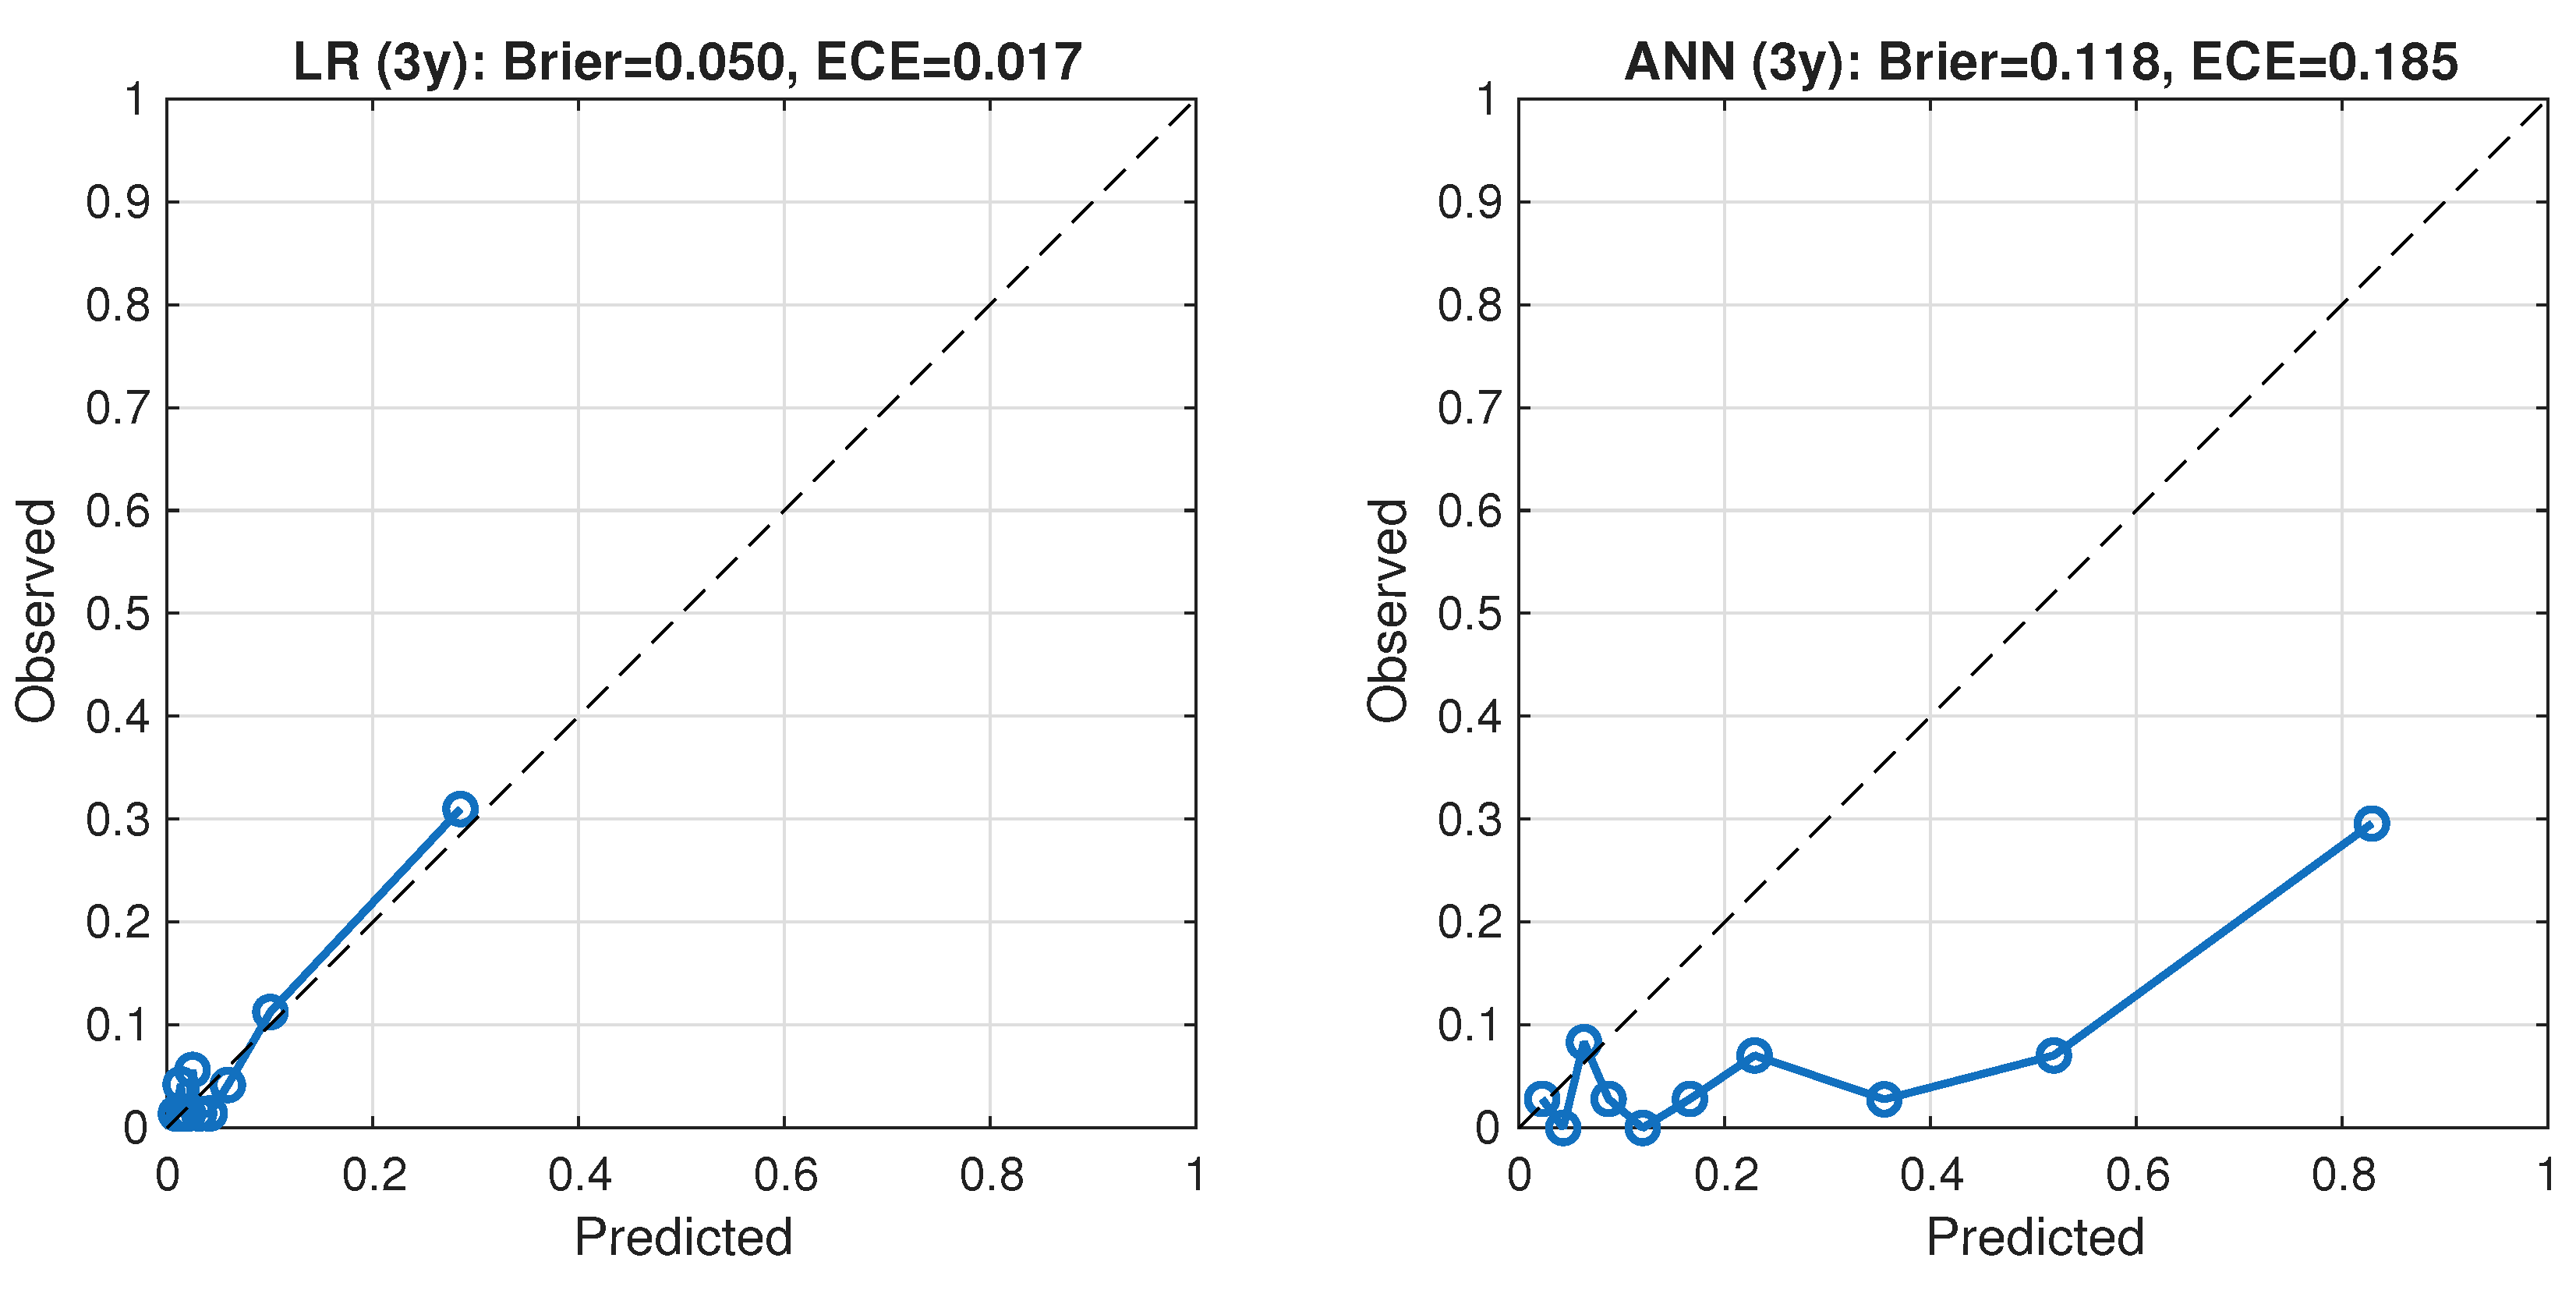
The critical divergence emerges in calibration quality.
Figure 7 visualizes this disparity: logistic predictions align more closely with the diagonal identity line (lower ECE), whereas ANN probabilities deviate substantially, indicating systematic miscalibration.
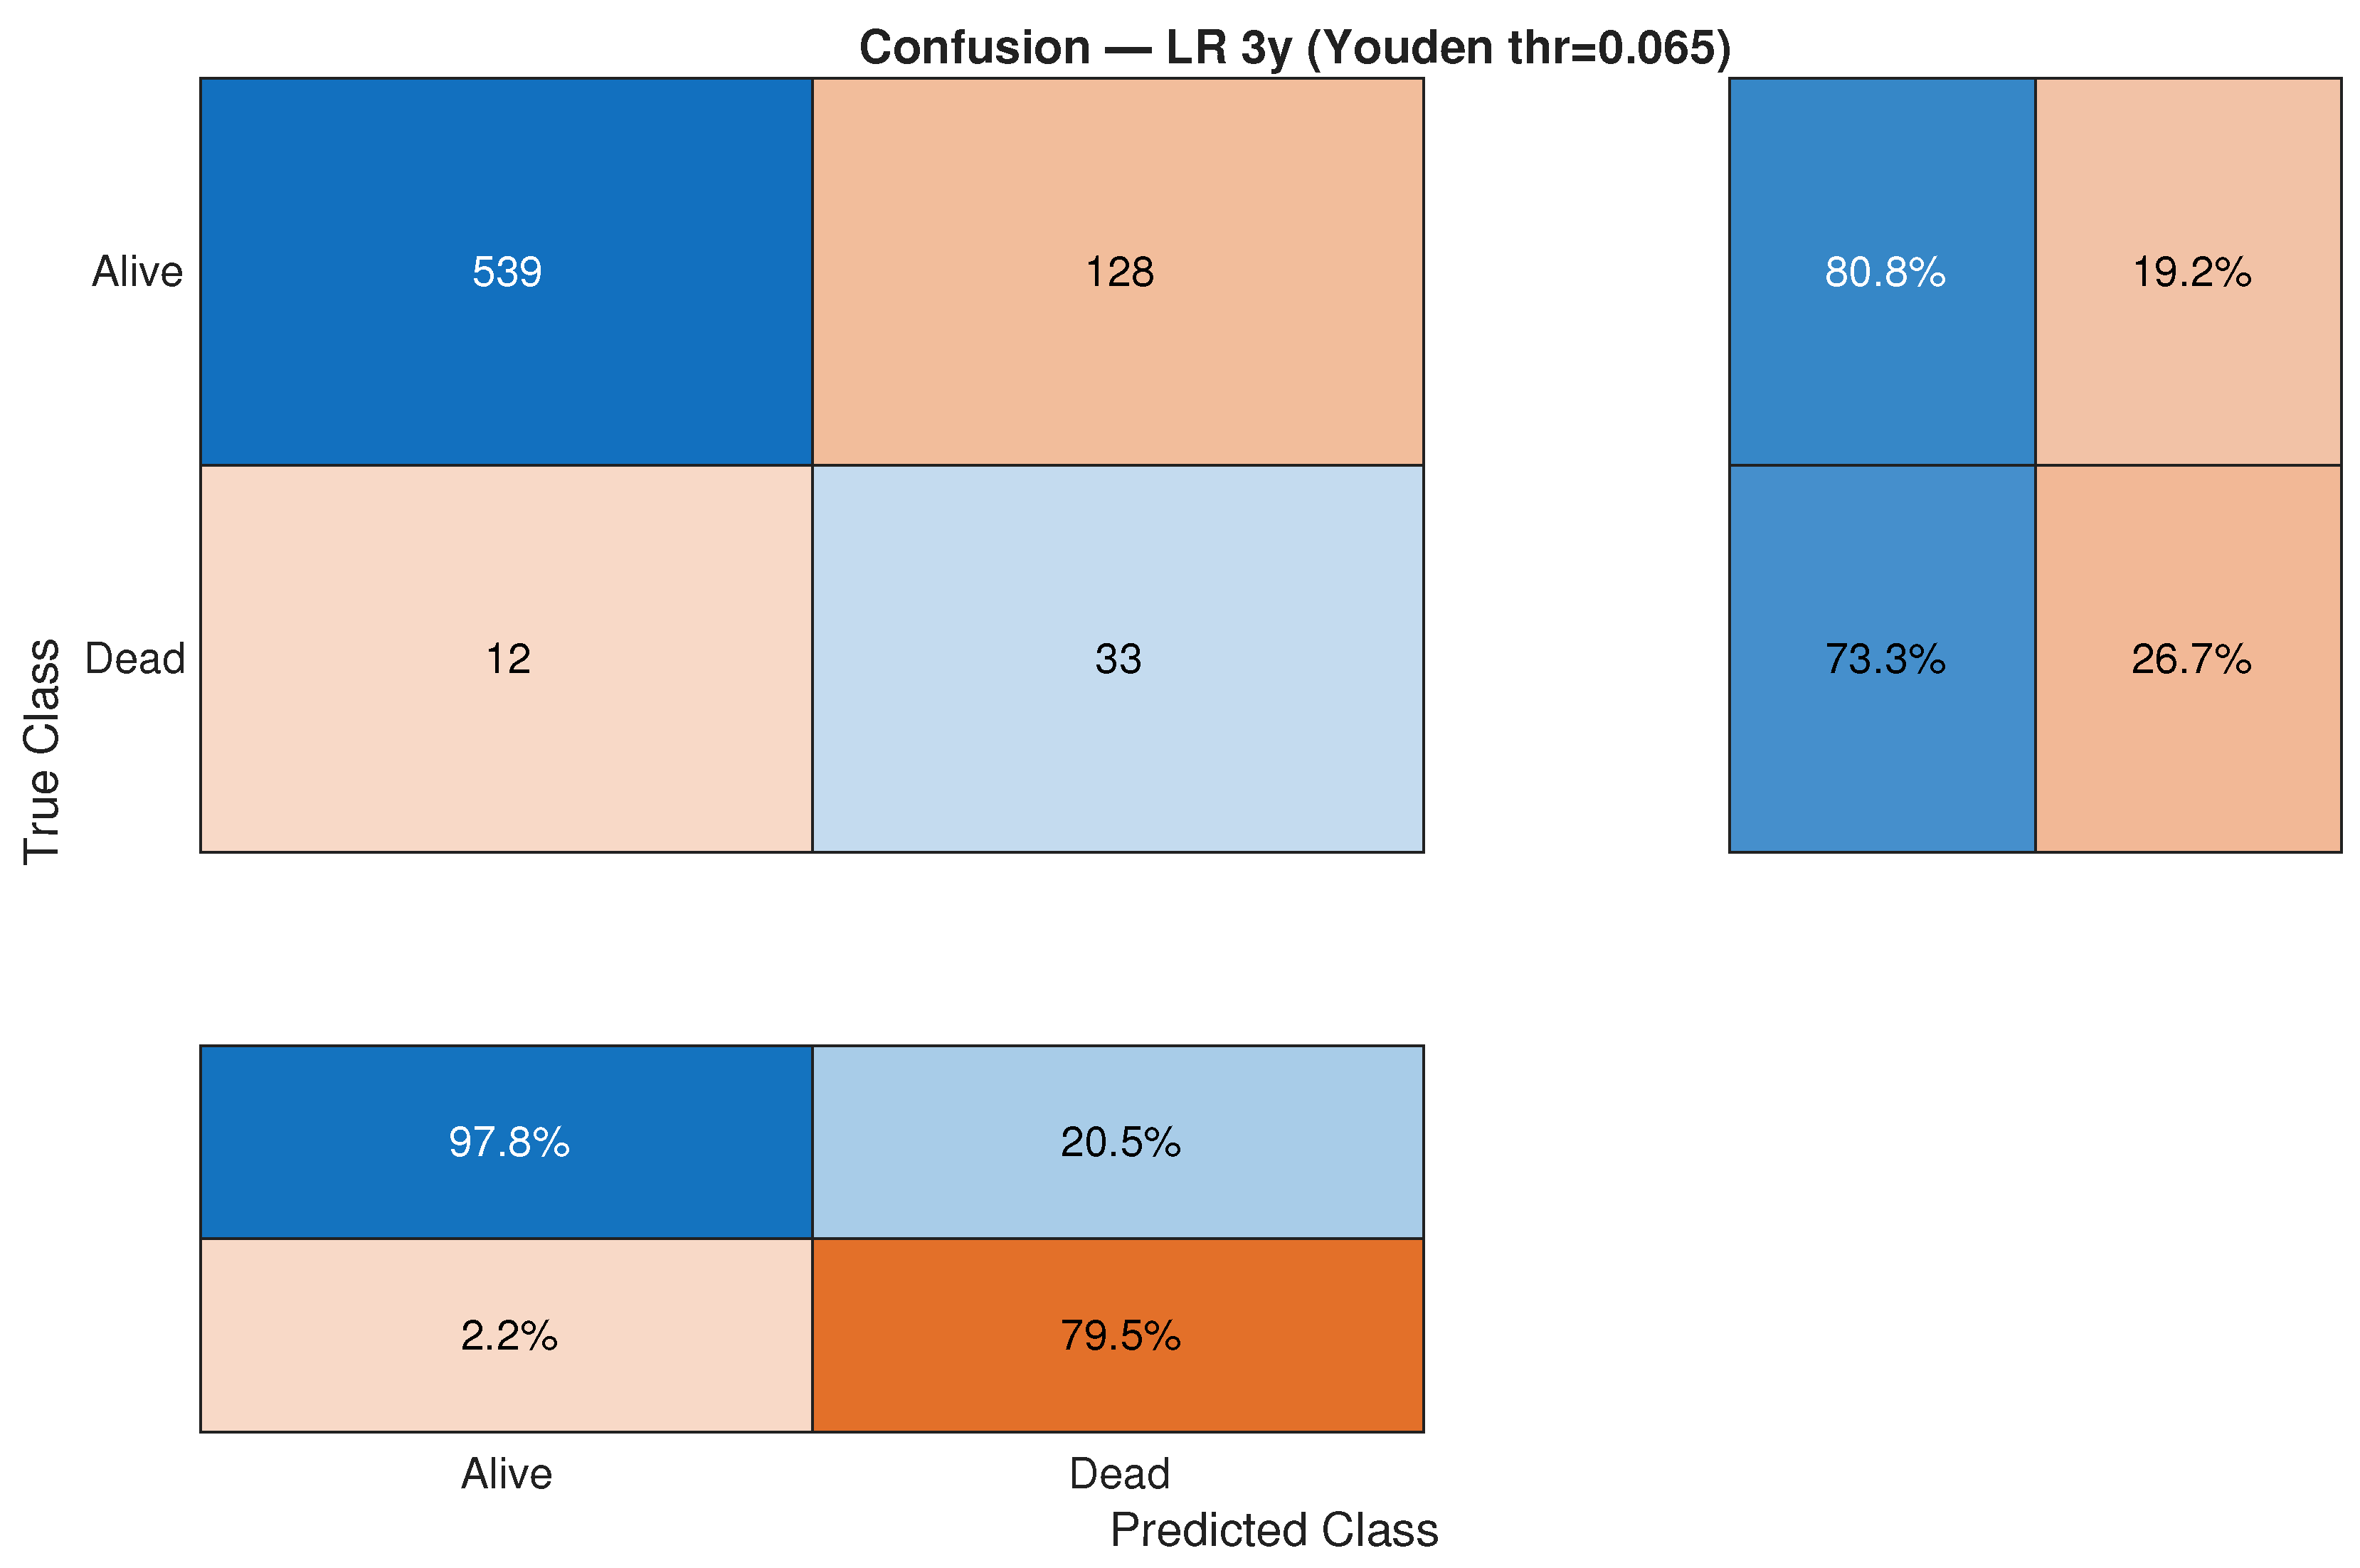
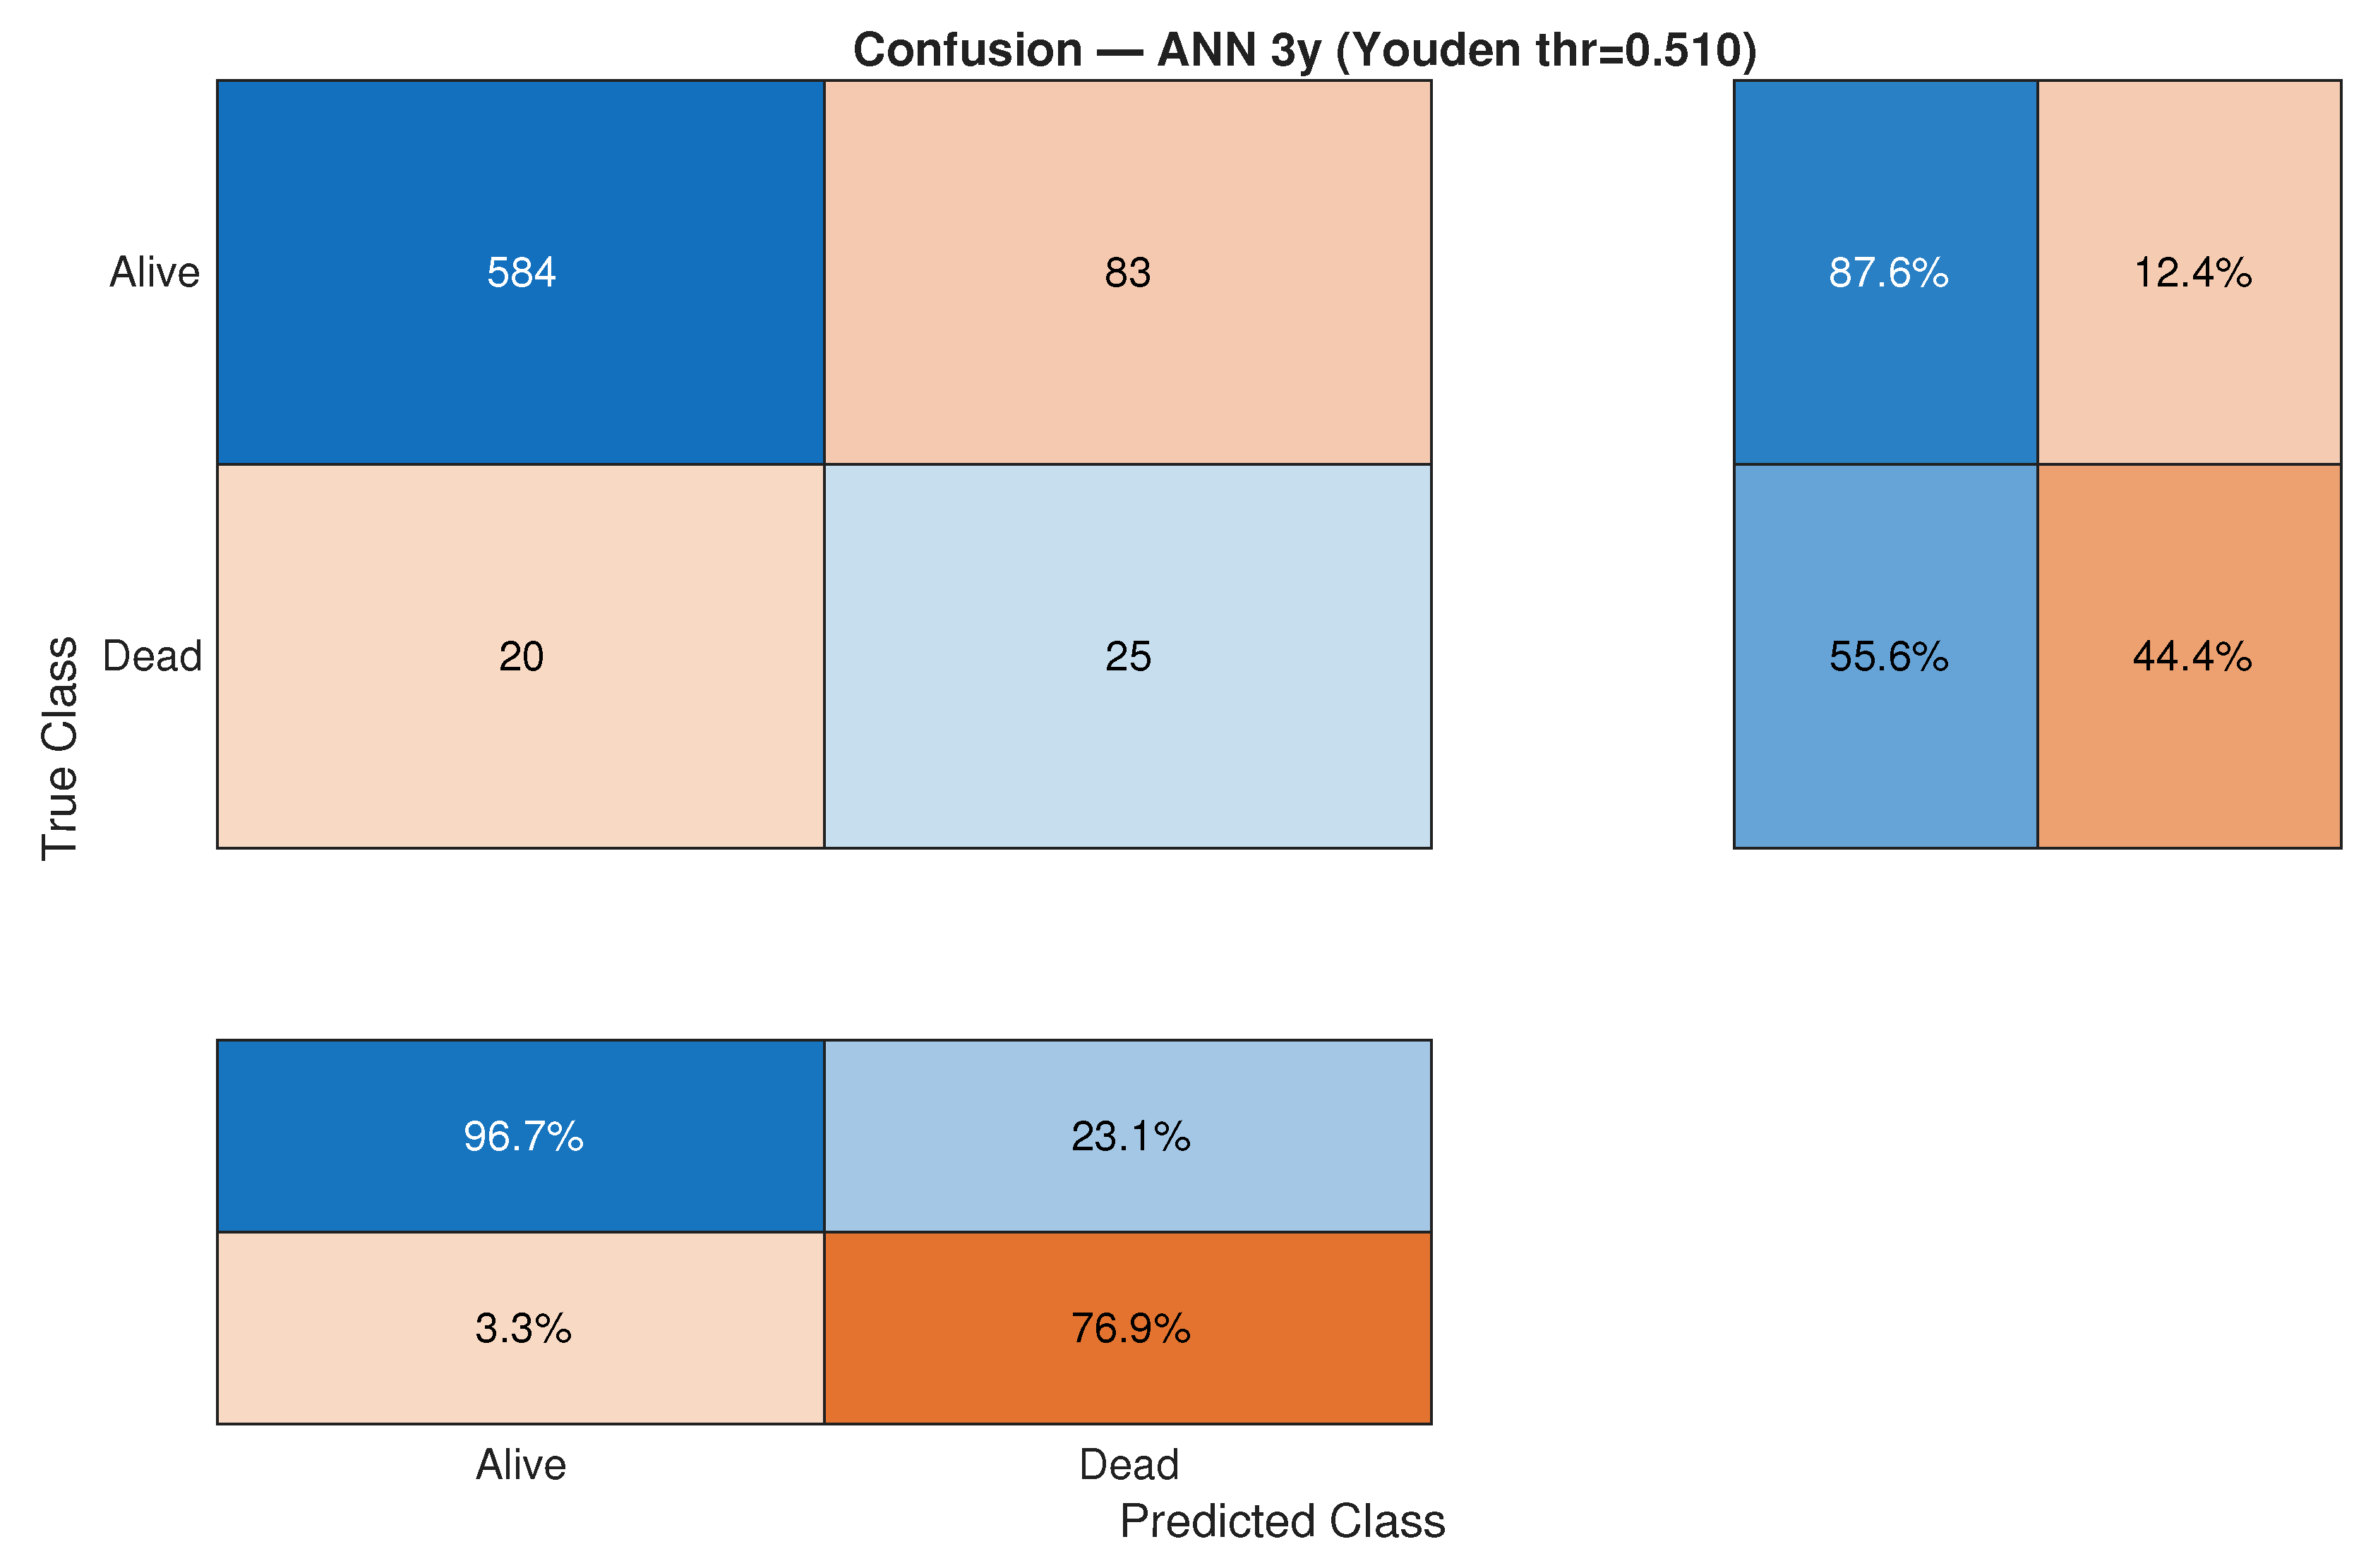
Confusion matrices computed at Youden-optimal thresholds (
Figure 8 and
Figure 9) illustrate operational behavior under a fixed operating point.
4.2.3. Five-Year Mortality Prediction: Logistic Regression Dominance
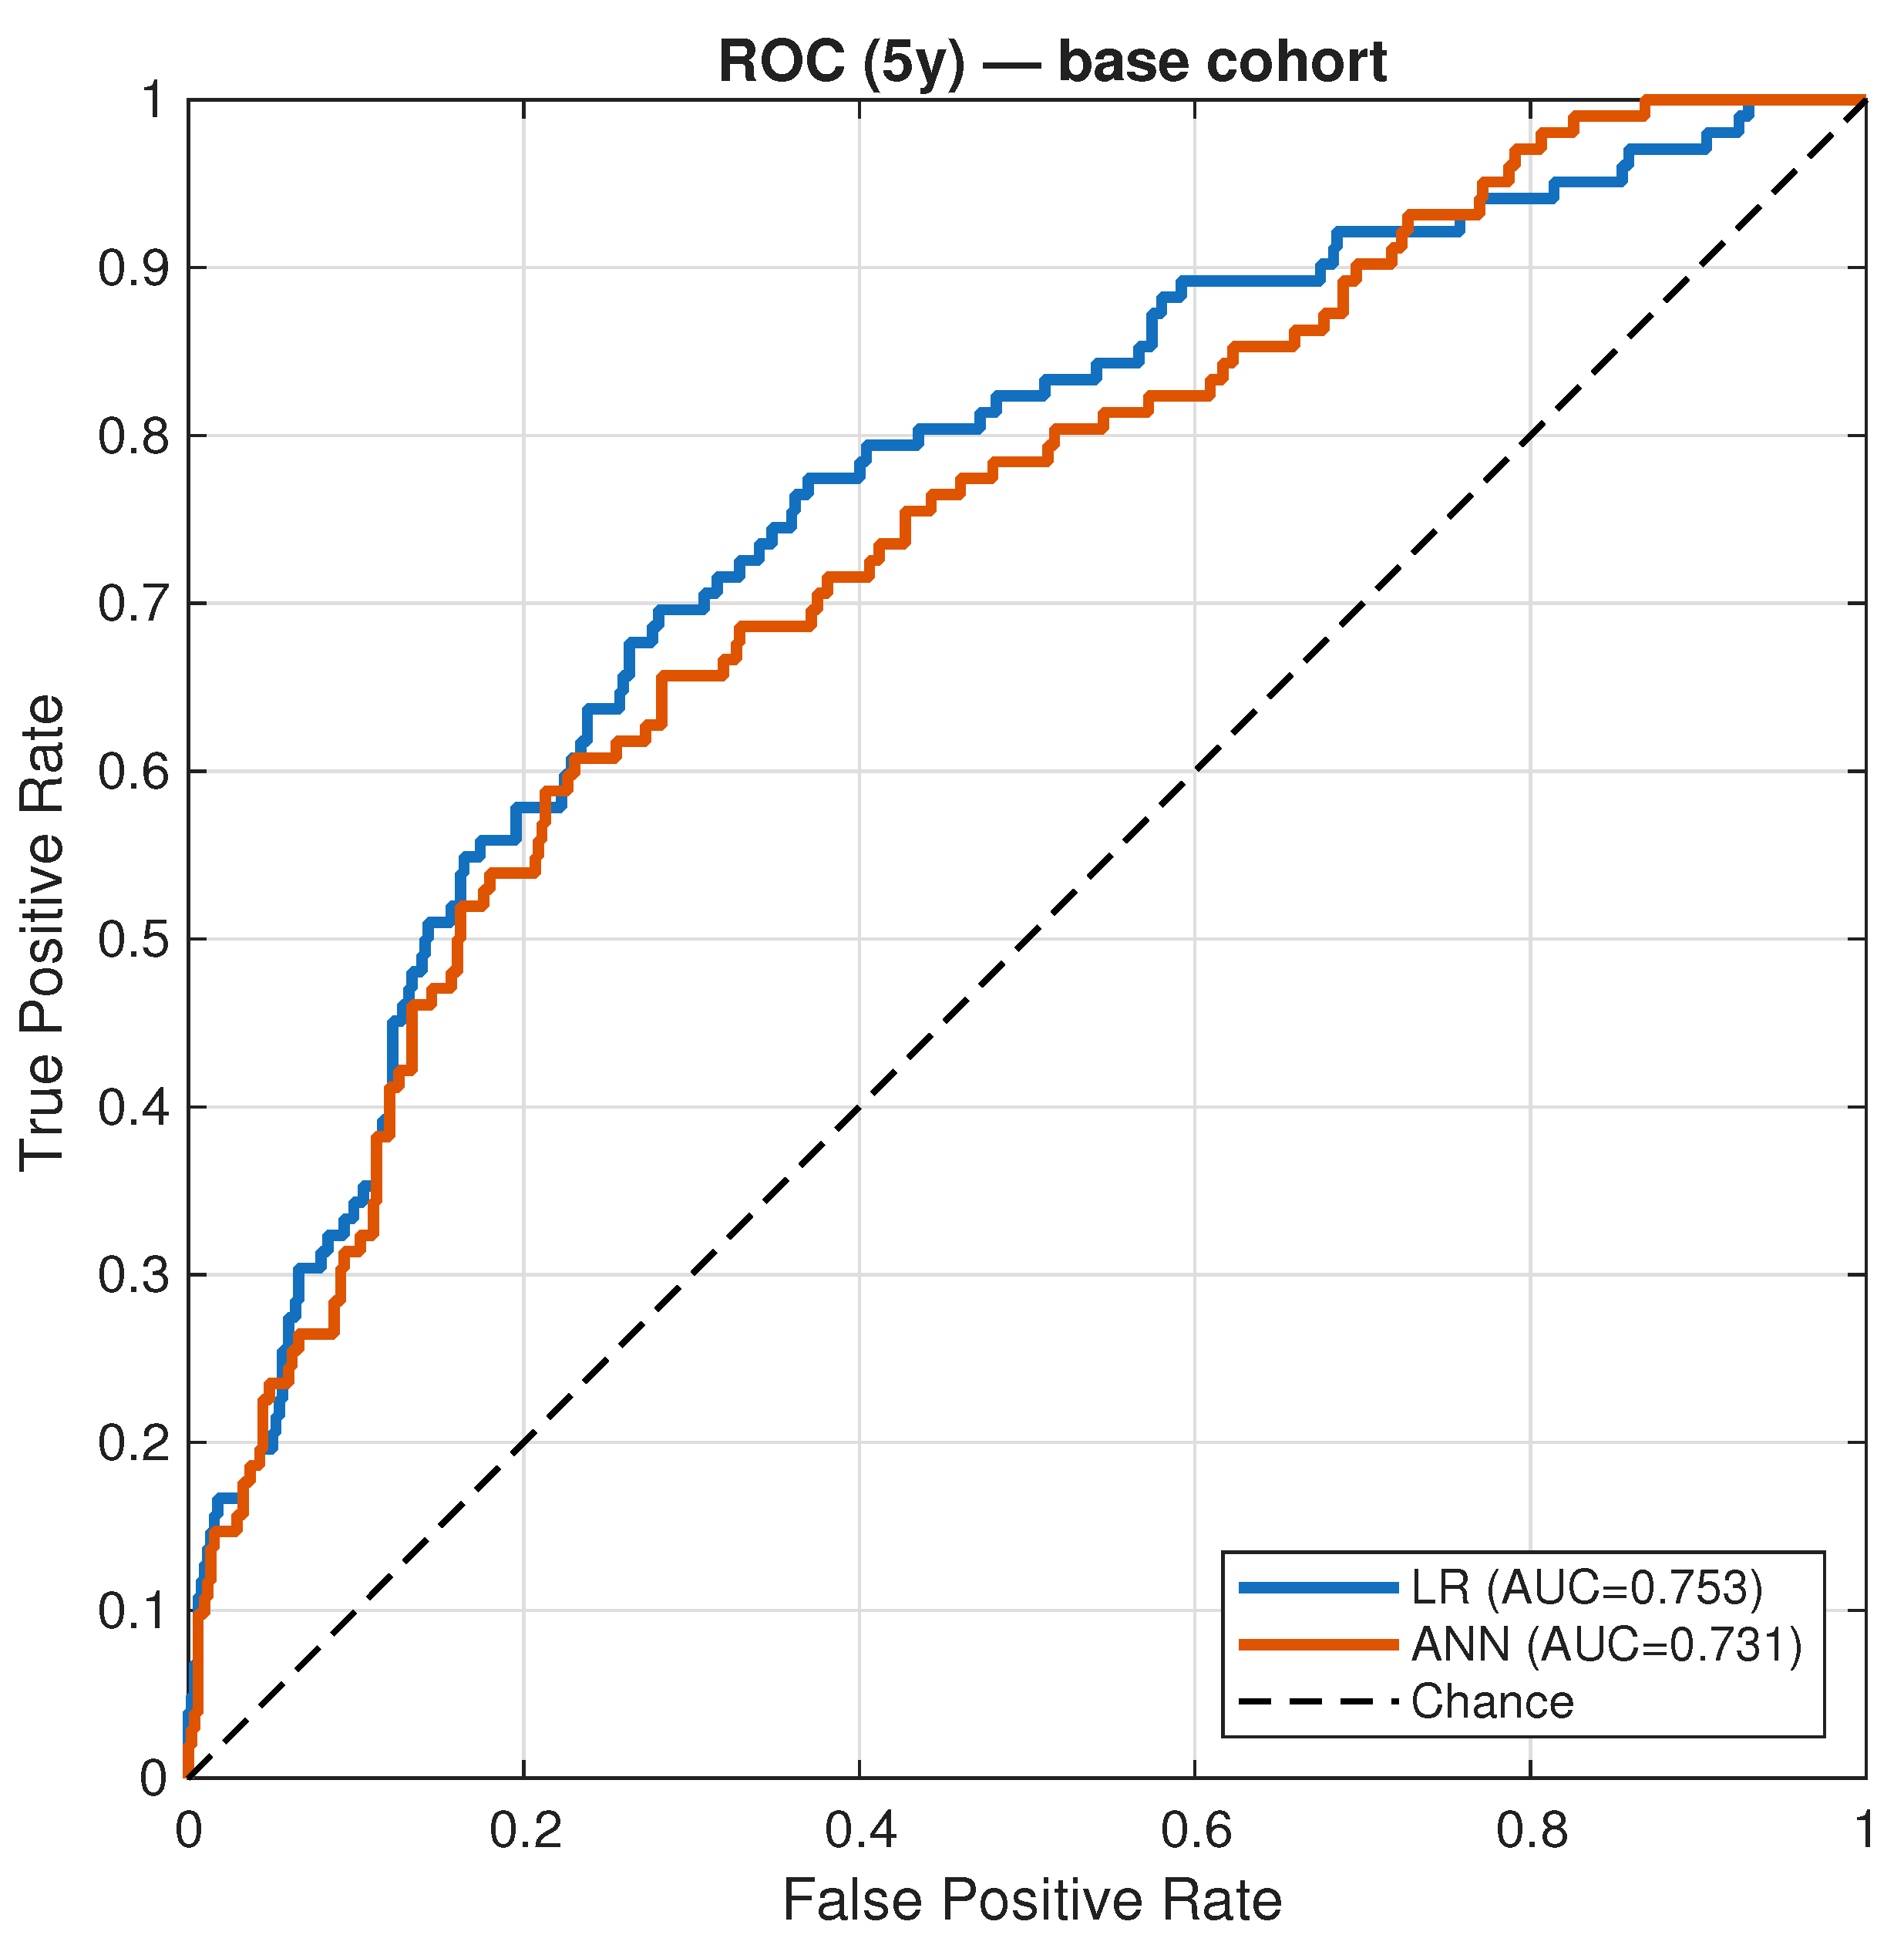
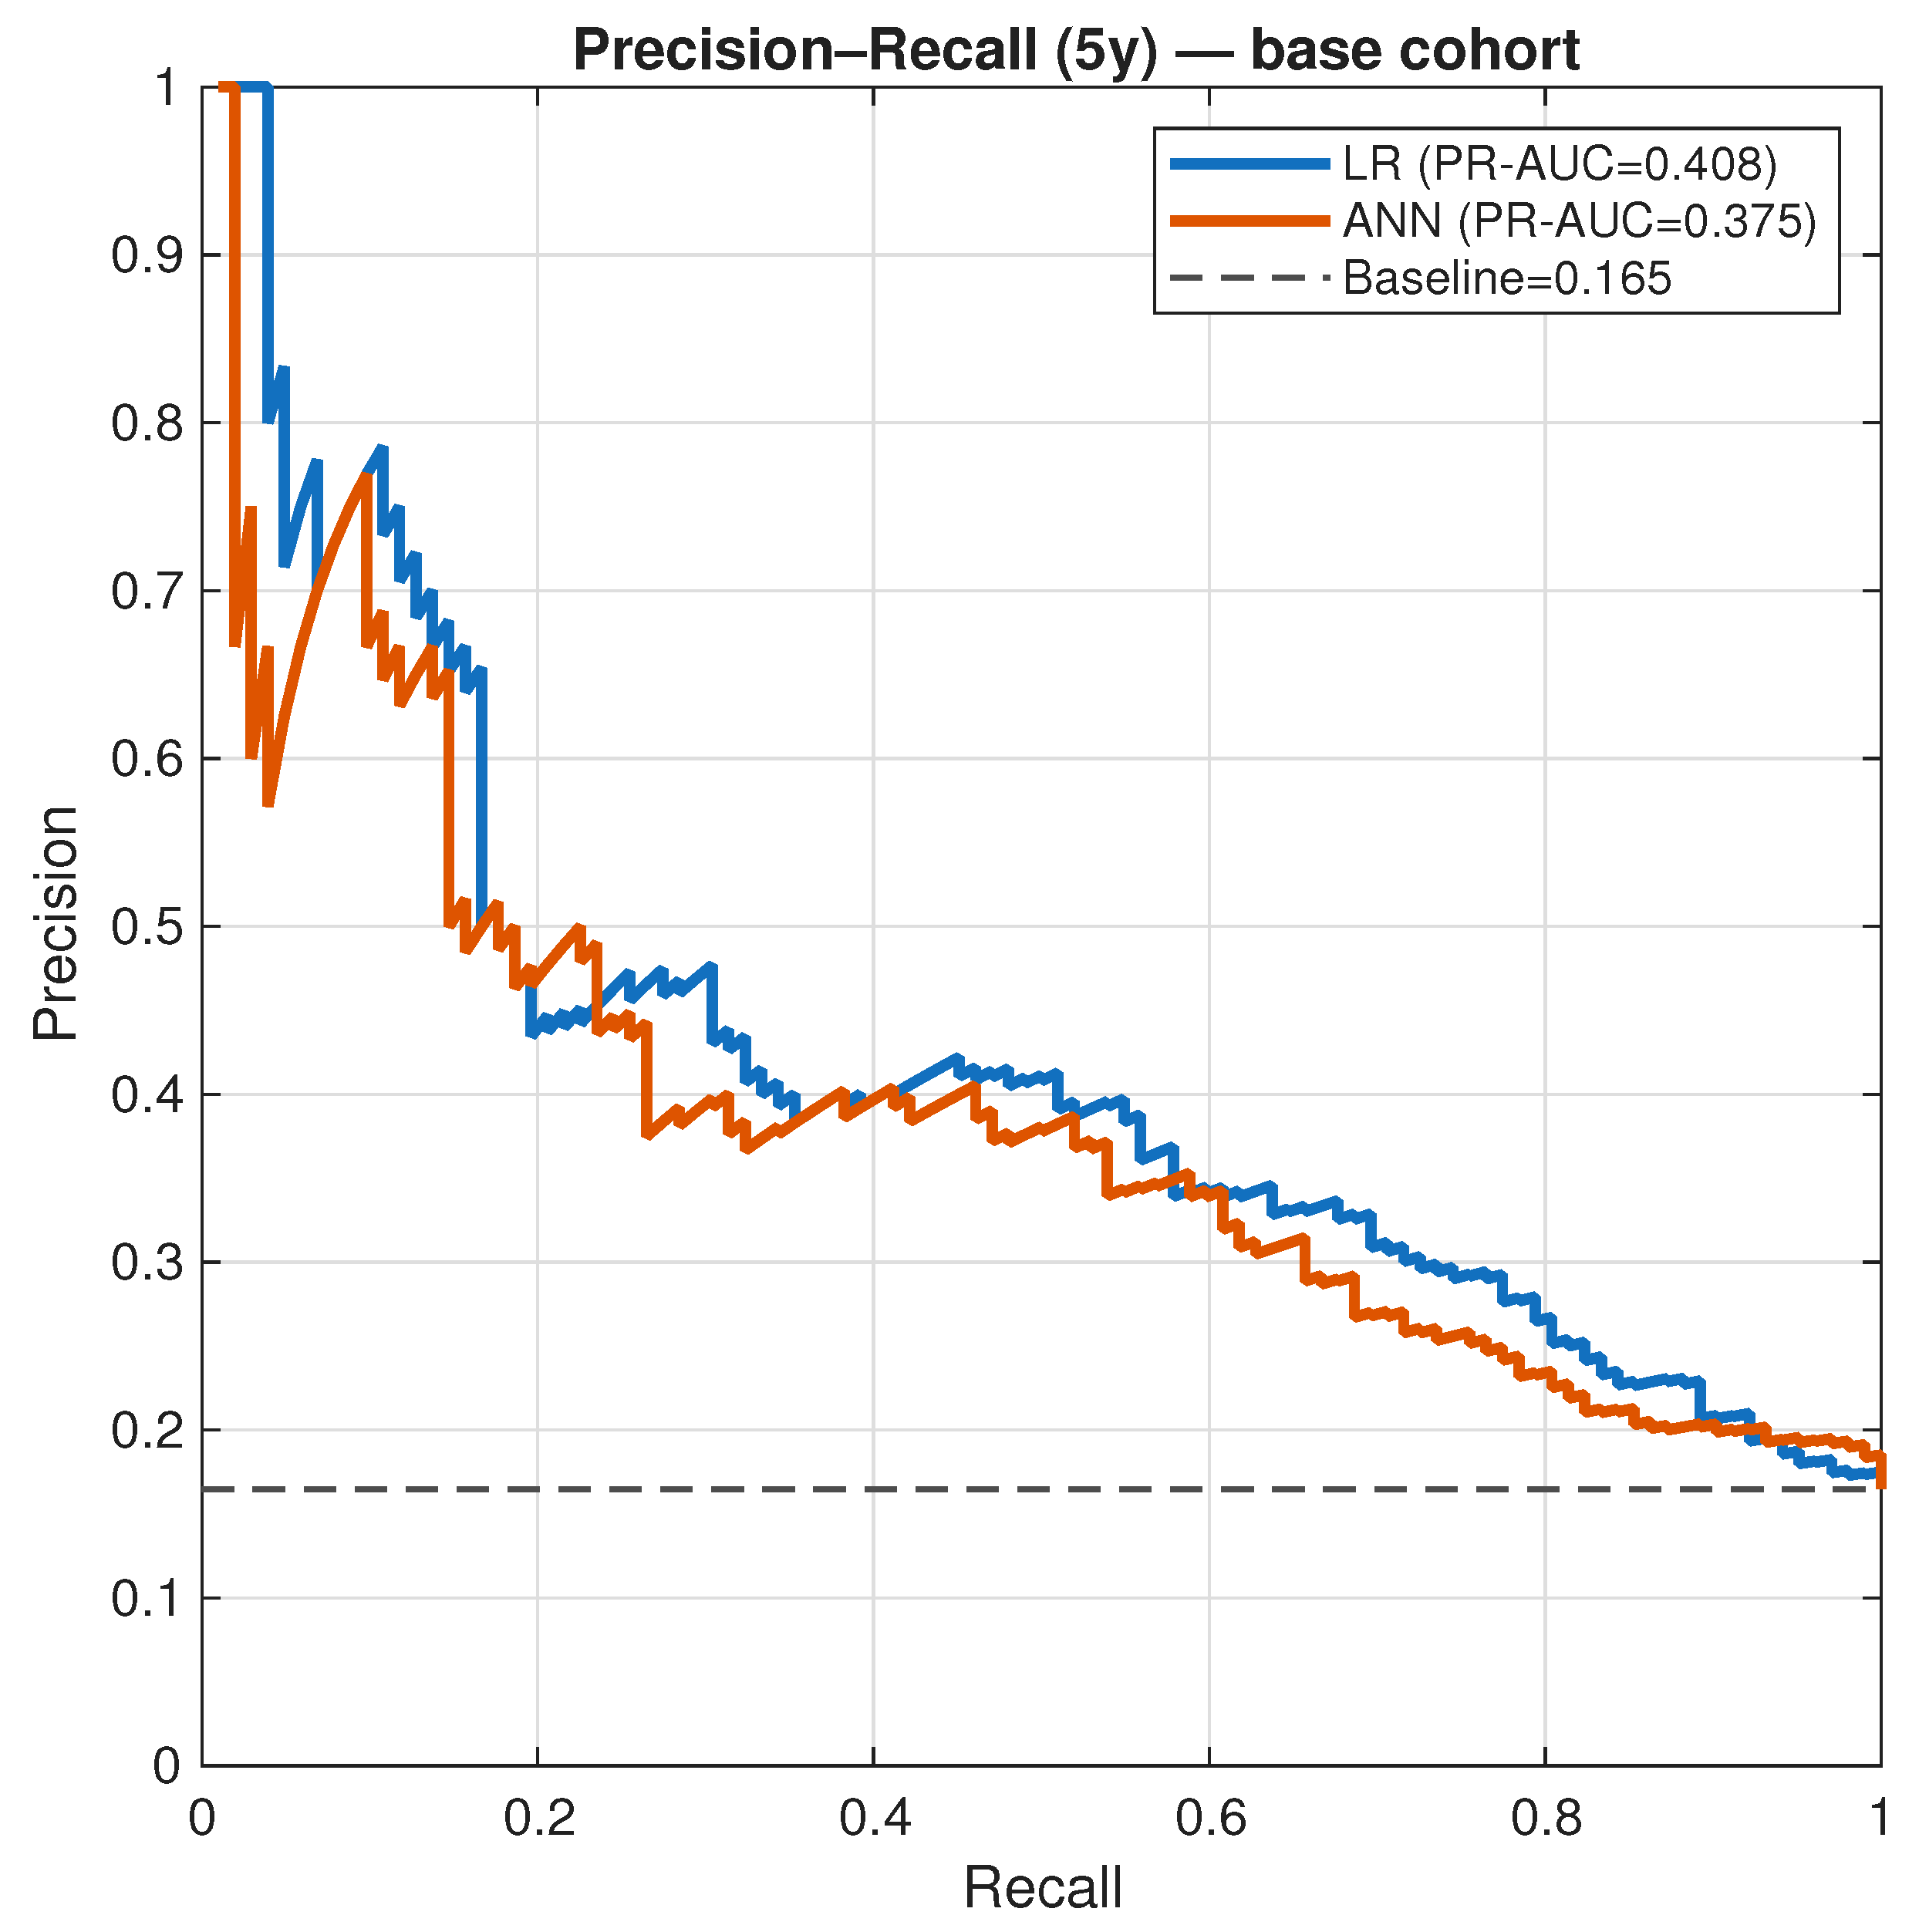
At the 5-year horizon, logistic regression outperformed the ANN across discrimination and calibration.
Figure 10 shows the ROC comparison.
Figure 11 shows precision–recall performance under longer follow-up.
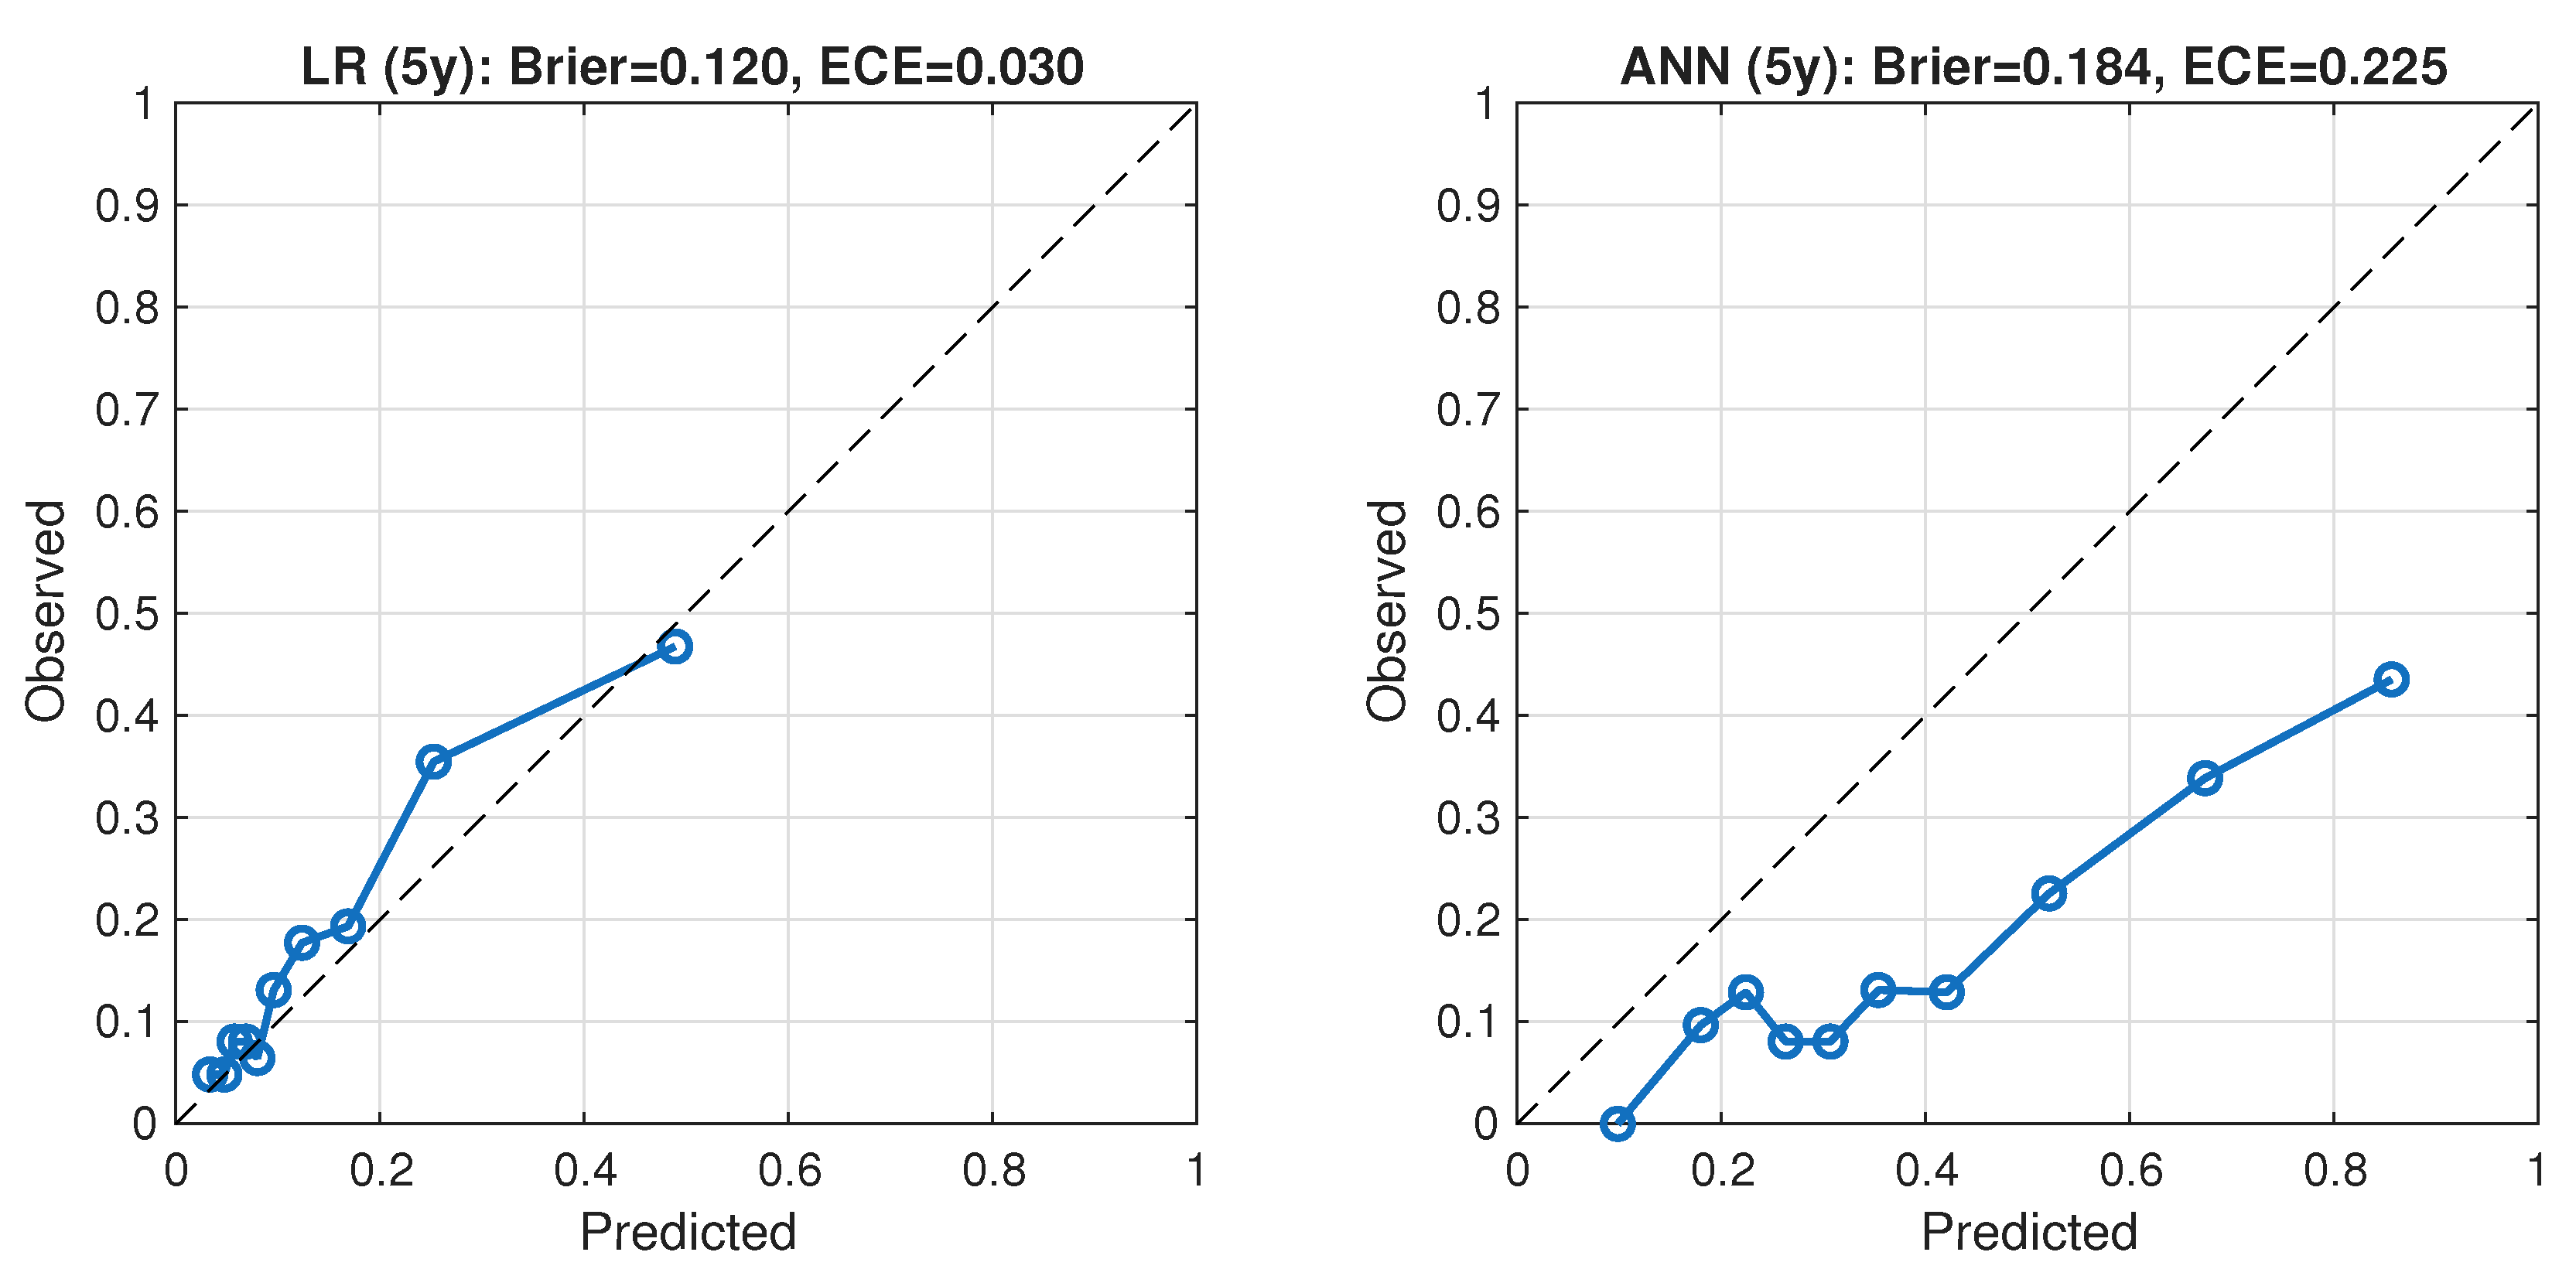
Calibration quality remained superior for logistic regression, while ANN miscalibration persisted.
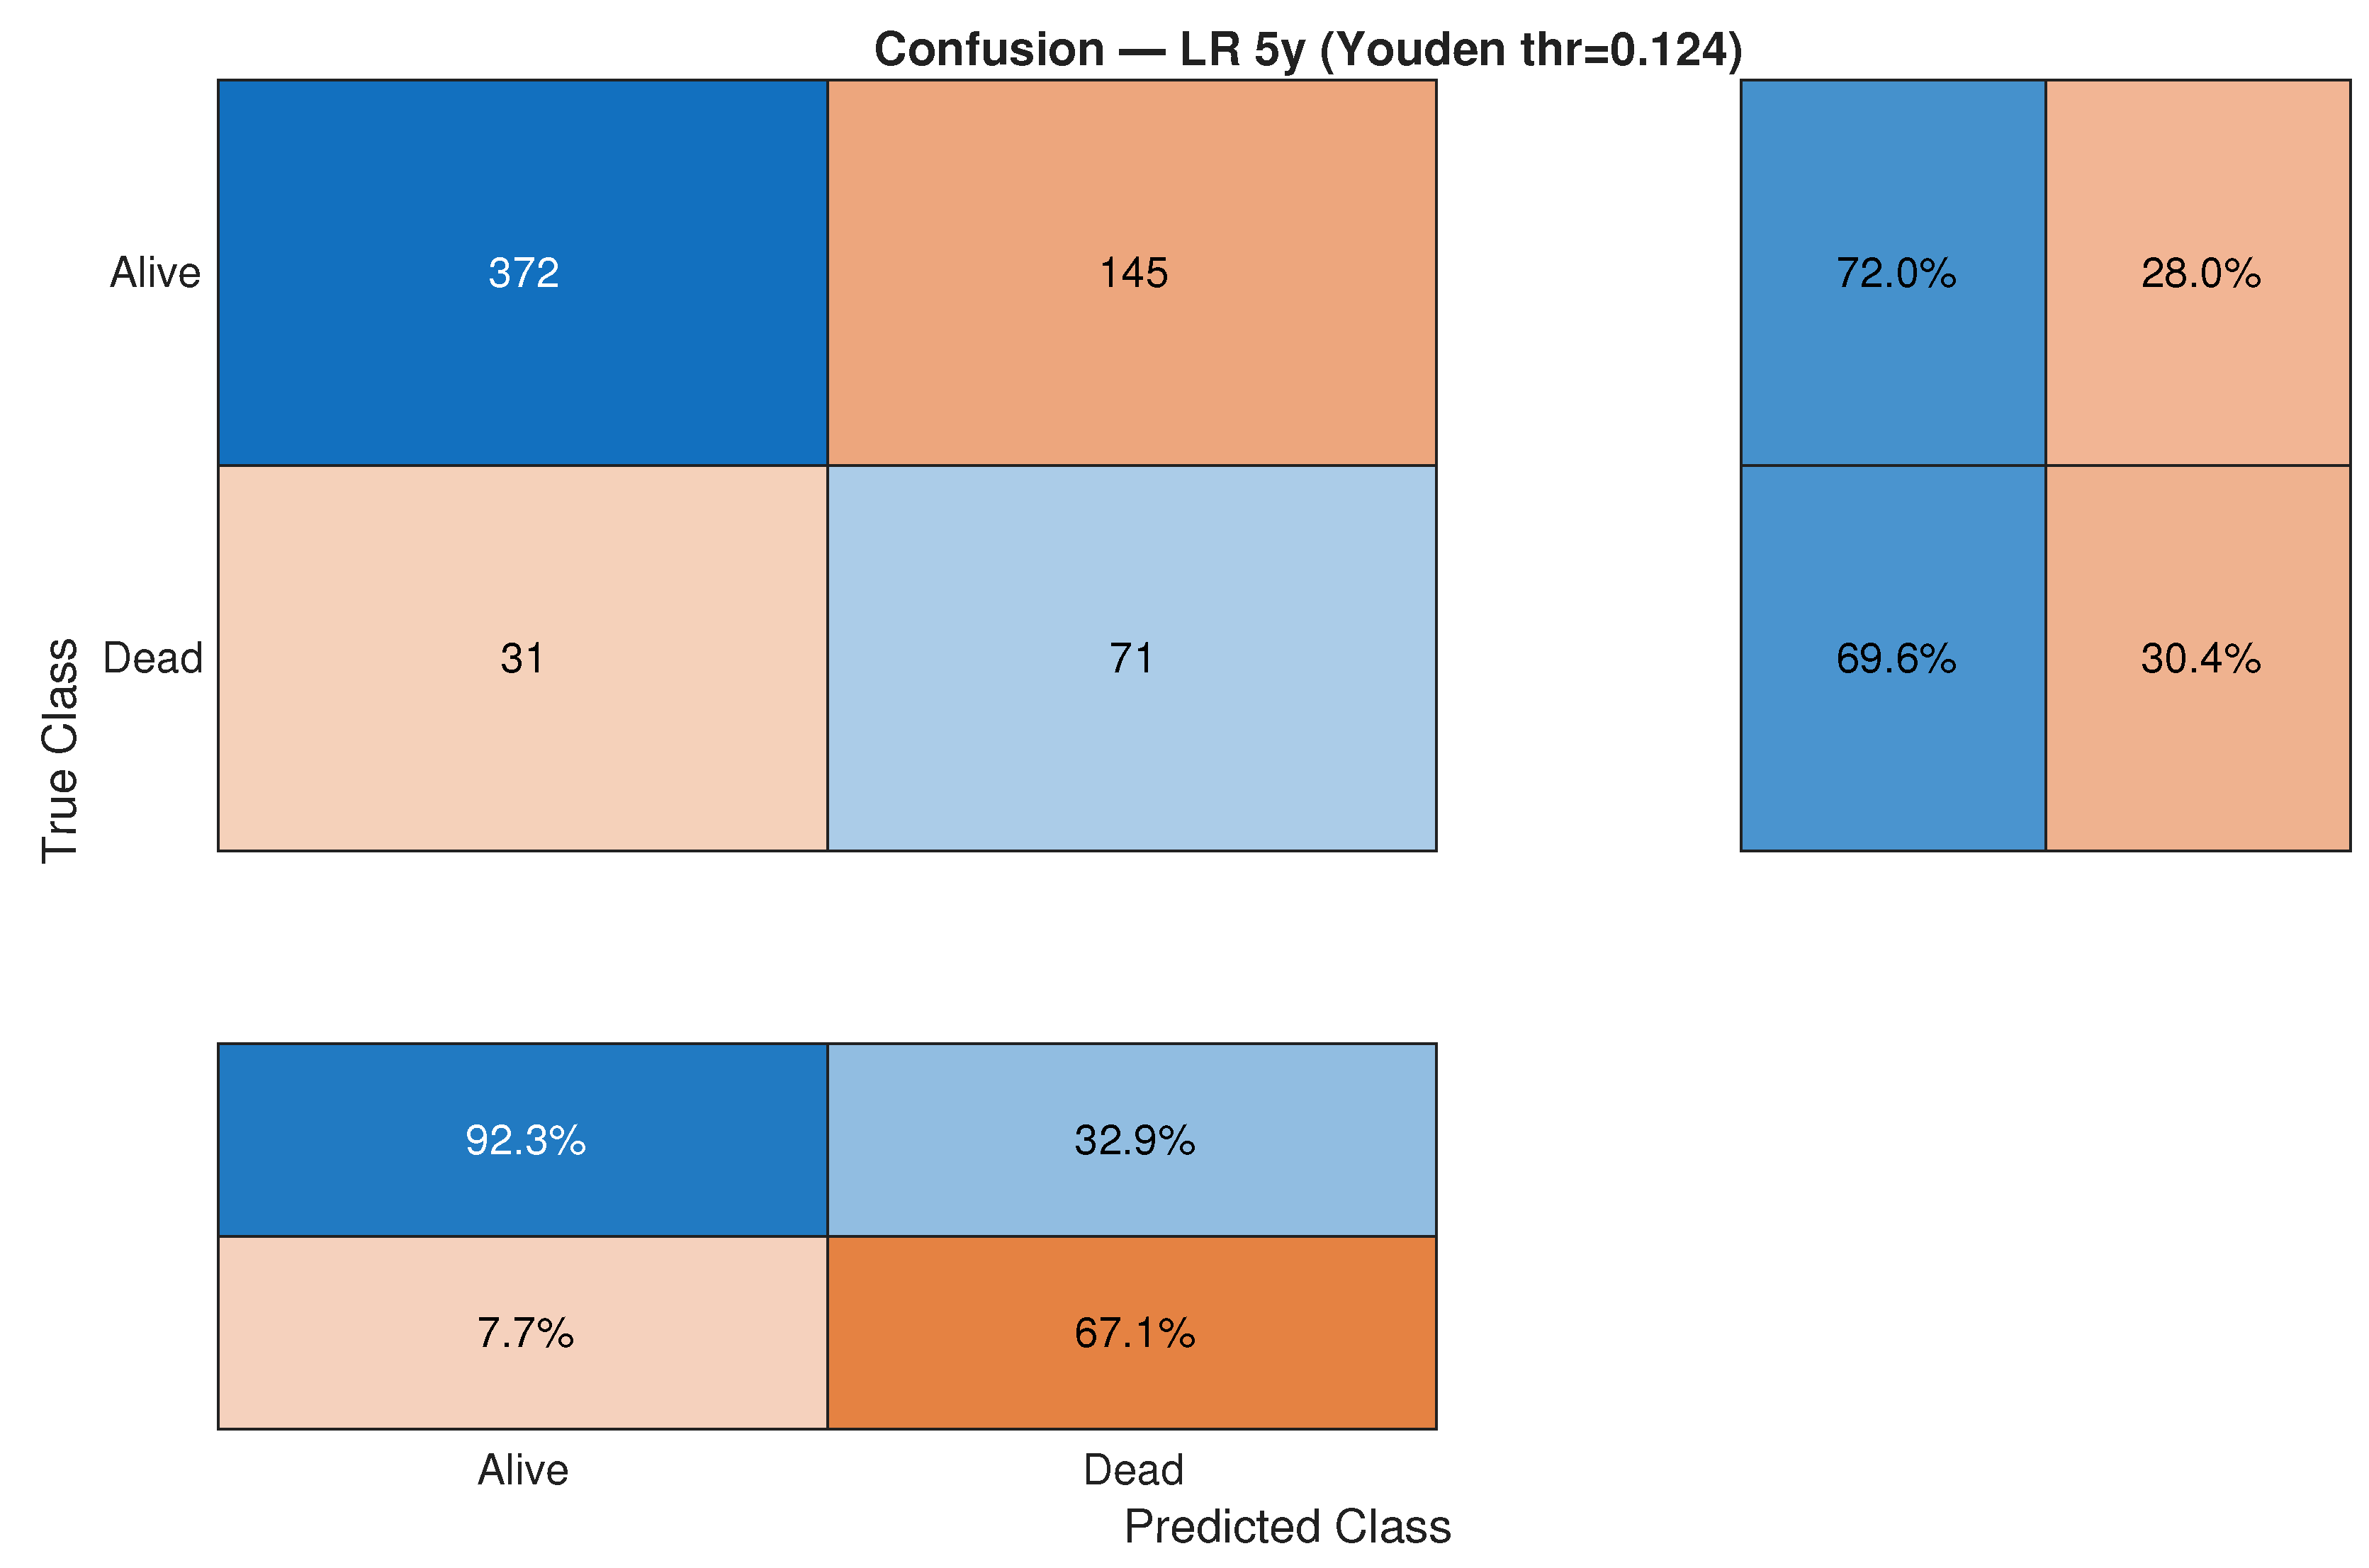
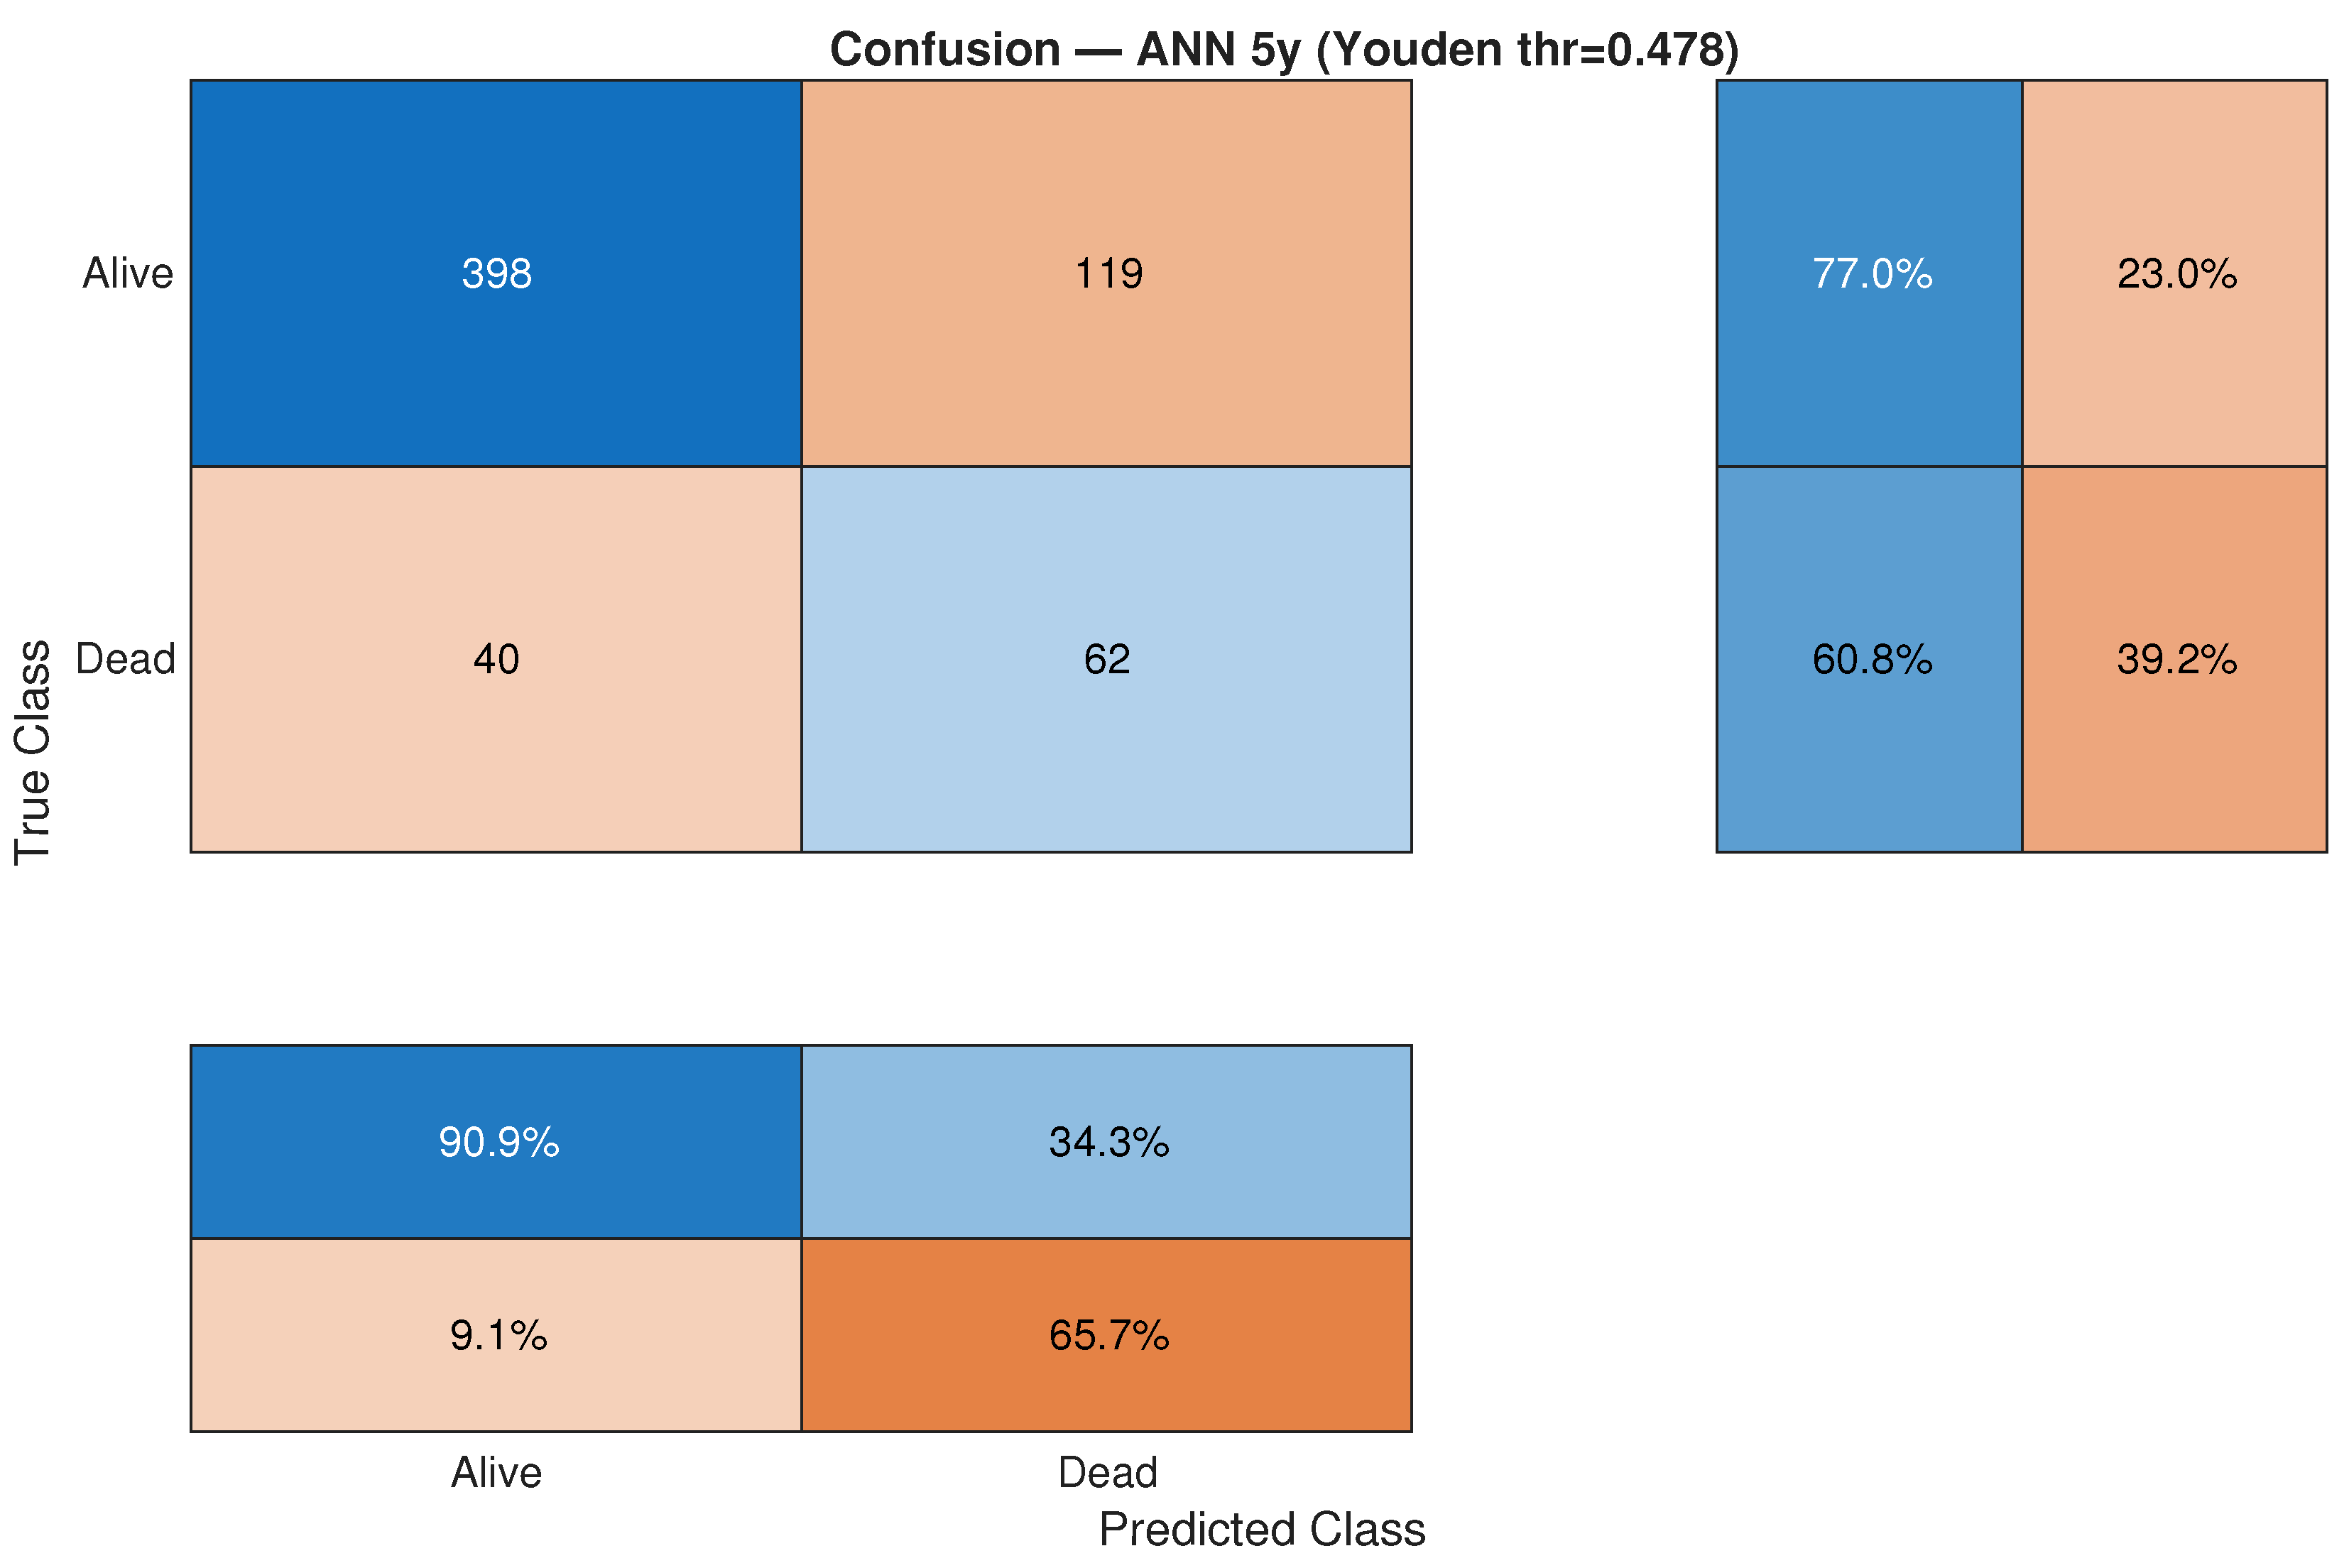
Figure 12 confirms systematic deviation of ANN probabilities from observed frequencies.
Confusion matrices at Youden thresholds (
Figure 13 and
Figure 14) show the resulting classification trade-offs.
5. Overall Findings and Conclusions
This study compared L1-regularized logistic regression and feedforward neural networks for breast cancer mortality prediction using SEER data. Under a unified preprocessing pipeline based on one-hot encoding and z-score normalization, both models were evaluated not only in the original cross-sectional setting but also under clinically meaningful fixed-horizon formulations. Specifically, we reframed the prediction task into 3-year and 5-year mortality classification problems, enabling a well-defined clinical endpoint and a principled handling of censoring through horizon-based cohort filtering.
A major methodological extension of this work was the redesign of the prediction task into these fixed 3-year and 5-year horizons, which produced cohorts with different statistical properties. The 3-year horizon benefited from a larger effective sample size and higher event rate, whereas the 5-year horizon introduced more censoring and increased heterogeneity. Logistic regression demonstrated strong robustness across both horizons, achieving ROC–AUC values of approximately 0.78 (3-year) and 0.75 (5-year), while the neural network exhibited a more pronounced degradation at longer horizons.
A second extension was the introduction of a structured hyperparameter search for the neural network. Ten architectures were evaluated, varying in depth (one or two hidden layers), width (8 to 64 neurons), and training budgets. This strategy improved neural network performance relative to the original fixed architecture, particularly for 3-year mortality, where the best model reached a test ROC–AUC of 0.7927, compared with 0.7808 for logistic regression. Despite these gains, logistic regression remained competitive in discrimination and consistently superior in calibration, reinforcing the importance of probability reliability in clinical applications.
Cross-validation further highlighted differences in model stability. Logistic regression maintained narrow dispersion, achieving cross-validated ROC–AUC values around , whereas the neural network showed substantially higher variability, with cross-validated ROC–AUC around at 3 years. This discrepancy reflects sensitivity to initialization and sampling effects, indicating that neural networks may require larger datasets or stronger regularization to achieve robustness comparable to linear models in medium-sized tabular clinical data.
Across all configurations, calibration was the strongest differentiating factor. Logistic regression achieved near-ideal reliability curves, with expected calibration error below , while the neural network displayed persistent overconfidence with expected calibration error close to , even after hyperparameter optimization. This finding is particularly relevant because poorly calibrated models can lead to under-treatment of high-risk patients or over-treatment of low-risk individuals.
The horizon-based redesign also confirmed that the 3-year endpoint is statistically more reliable due to higher event prevalence, whereas the 5-year horizon, although clinically important, introduces additional methodological challenges due to censoring and reduced effective sample size.
Methodologically, this work provides a reproducible pipeline for benchmarking transparent and black-box models under identical preprocessing, fixed data splits, matched feature sets, and paired uncertainty analyses. The results underscore that interpretable models can match or surpass neural networks on structured clinical data, particularly when calibration and interpretability are prioritized.
This study has several limitations. Experiments were conducted on a single SEER cohort, which limits external generalizability. When cross-validation was repeated using multiple random seeds within each fold, ANN performance at the 5-year horizon averaged approximately ROC–AUC ≈ 0.6 across all fold × seed runs, with variance decomposition indicating that a substantial fraction of total variability arises from stochastic initialization rather than sampling alone.
A further limitation is that we did not evaluate discrimination or calibration across demographic and pathological subgroups (e.g., race, age, tumor stage, or hormone receptor status). Such subgroup-level analyses are essential to detect potential fairness issues and heterogeneity in model performance. However, after fixed-horizon filtering, several clinically relevant strata—particularly minority racial groups and advanced-stage categories—contain limited sample sizes, which can lead to unstable or misleading performance estimates if analyzed separately. For this reason, we did not conduct a formal subgroup analysis in the present work. Addressing fairness and subgroup robustness in a statistically reliable manner will require either larger external cohorts or temporal validation across diagnosis years, and is therefore left for future investigation.
A comprehensive subgroup and fairness analysis would require either substantially larger effective sample sizes within each subgroup or dedicated statistical techniques for uncertainty-aware comparison. As such, we deliberately focused this work on global model performance, calibration, and stability under controlled experimental conditions. Future work will explicitly investigate subgroup-specific discrimination and calibration, as well as formal fairness metrics, to assess whether model performance is consistent across clinically and demographically relevant populations.
An additional consideration regarding external generalizability concerns temporal drift within the SEER registry. Although this study relied on a single cross-sectional cohort, breast cancer case-mix, diagnostic practices, and treatment patterns have evolved across calendar years. A temporal validation strategy—training models on earlier SEER cohorts and testing on later diagnosis years—would likely reduce discrimination, particularly for the ANN, which showed greater sensitivity to sampling perturbations and feature-distribution shifts. In contrast, we would expect L1–logistic regression to maintain more stable performance under such temporal shifts due to its sparsity and reduced reliance on complex feature interactions. Incorporating temporal validation in future work would therefore strengthen the translational relevance of the proposed benchmarking framework.
Overall, integrating fixed-horizon mortality prediction with explicit neural network hyperparameter optimization reinforces the central conclusion of this study: interpretable linear models remain strong baselines for oncology registries. They offer competitive discrimination, substantially superior calibration, and higher stability, all essential properties for deployment in population-level clinical settings. Logistic regression can be implemented without specialized hardware, recalibration requires only modest validation data, and coefficient-based explanations align with regulatory expectations for clinical decision support. Thus, in medium-sized tabular oncology datasets such as SEER, regularized linear models provide a pragmatic and equitable foundation for scalable cancer risk stratification.
From a translational perspective, the practical deployment value of the proposed models differs substantially. The L1-regularized logistic regression provides sparse and stable coefficient estimates that can be directly mapped to clinically interpretable risk factors, enabling transparent risk stratification at the individual patient level. In practice, predicted probabilities can be used to define low-, intermediate-, and high-risk groups to support follow-up scheduling, referral prioritization, or population-level screening strategies. Importantly, such a model can be implemented using standard clinical software without specialized computational infrastructure, making it feasible for deployment in primary care or resource-constrained settings. In contrast, although neural networks can achieve competitive discrimination, their lack of intrinsic interpretability and persistent calibration instability necessitate additional post hoc explanation and recalibration steps, which complicate clinical integration. These considerations reinforce the suitability of regularized linear models as pragmatic decision-support tools for large-scale oncology registries.




 ,
,