Article

Hybrid LSTM–FACTS Control Strategy for Voltage and Frequency Stability in EV-Penetrated Microgrids

by
Paul Arévalo-Cordero
1,2,*,
Félix González
1,
Andrés Martínez
1,
Diego Zarie
1,
Augusto Rodas
1,
Esteban Albornoz
1,
Danny Ochoa-Correa
1 and
Darío Benavides
3
1
Department of Electrical Engineering, Electronics and Telecommunications (DEET), Faculty of Engineering, University of Cuenca, Balzay Campus, Cuenca 010107, Ecuador
2
Department of Electrical Engineering, University of Jaén, 23700 Linares, Spain
3
Faculty of Systems, Electronics and Industrial Engineering, Universidad Técnica de Ambato, Ambato 180207, Ecuador
*
Author to whom correspondence should be addressed.
Technologies 2025, 13(9), 402; https://doi.org/10.3390/technologies13090402
Submission received: 5 August 2025 / Revised: 28 August 2025 / Accepted: 29 August 2025 / Published: 4 September 2025

Abstract

This paper proposes a real-time energy management strategy for low-voltage microgrids that combines short-horizon forecasting with a rule-based supervisory controller to coordinate battery energy storage usage and reactive power support provided by flexible alternating current transmission technologies. The central contribution is the forecast-informed, joint orchestration of active charging and reactive power dispatch to regulate voltage and preserve stability under large photovoltaic variability and uncertain electric vehicle demand. The work also introduces a resilience response index that quantifies performance under external disturbances, forecasting delays, and increasing levels of electric-vehicle integration. Validation is carried out through time-domain numerical simulations in MATLAB/Simulink using realistic solar irradiance and electric vehicle charging profiles. The results show that the coordinated strategy reduces voltage deviation events, maintains stable operation across a wide range of scenarios, and enables electric vehicle charging to be supplied predominantly by renewable generation. Sensitivity analysis further indicates that support from flexible alternating current devices becomes particularly decisive at high charging demand and in the presence of forecasting latency, underscoring the practical value of the proposed approach for distribution-level microgrids.

Graphical Abstract

1. Introduction

The global electrification of the transportation sector, coupled with the decentralization of power systems, has led to unprecedented challenges and opportunities in modern electrical networks. The proliferation of electric vehicles (EVs) and distributed energy resources (DERs) has shifted the traditional centralized generation paradigm toward more dynamic and decentralized architectures [1,2,3,4]. In this evolving context, the integration of electric vehicle charging stations (EVCSs) within power grids demands new strategies that ensure both operational efficiency and stability. One of the major challenges arising from this integration lies in the dual role of EVCSs as both high-demand loads and potential grid support assets. The impact of large-scale EV penetration, particularly when co-located with DERs such as photovoltaic (PV) systems or wind generation, poses concerns related to voltage fluctuations, congestion, and reduced inertia in the grid [3,5]. Additionally, the increasing prevalence of renewable sources introduces variability and intermittency that must be mitigated through advanced control and planning approaches [6,7,8]. In this scenario, the deployment of flexible alternating current transmission systems (FACTS) devices emerges as a promising solution to manage power flow, enhance stability, and facilitate the seamless operation of EVCSs within active distribution networks [9,10,11]. Despite the technological potential of FACTS devices, their coordinated control with EVCSs and DERs in deregulated or semi-regulated environments remains a complex task. The dynamic behavior of EV charging demand, combined with uncertainties in renewable generation, necessitates robust, adaptive, and often intelligent control strategies. Recent advances in neuro-fuzzy and AI-based controllers have shown promise in damping oscillations and improving voltage and frequency regulation under such conditions [12,13]. Several approaches have integrated reinforcement learning and fuzzy logic for similar coordination problems [14,15]. High PV variability and uncertain EVCS demand cause concurrent active- and reactive-power stresses in low-inertia distribution networks, leading to voltage excursions and degraded frequency quality. This motivates studying a forecast-informed supervisory strategy that jointly schedules EVCS/BESS and coordinates FACTS for fast voltage support, providing a principled basis to assess siting, sizing, and operation under realistic uncertainty [16,17].
The integration of EVCSs into modern power systems has motivated extensive research efforts focused on planning, control, and optimization. The growing presence of EVs and their charging infrastructure poses technical challenges such as voltage deviations, congestion, and transformer overloading. To address these concerns, planning models have been proposed that incorporate spatial and temporal charging behavior. For instance, ref. [6] introduces a probabilistic planning approach that considers the uncertainties associated with EV charging demand and DER variability, highlighting the importance of multi-scenario simulations for urban networks. The operational stress caused by uncoordinated EV charging has also been quantified. In [18], a statistical analysis based on real-world EV charging profiles reveals that peak demand during evening hours can accelerate transformer aging and produce voltage drops, particularly in radial distribution systems. These findings align with those in [19], where stochastic modeling of EV load patterns is used to assess impacts on energy losses and asset lifespan. To mitigate the adverse effects of EV charging, coordinated and intelligent control strategies have been developed. A predictive model based on short-term voltage forecasts is presented in [20], where a model predictive control (MPC) algorithm adjusts charging setpoints to maintain network stability. Complementary to this, ref. [2] proposes a decentralized EV charging strategy aligned with PV generation profiles, significantly improving local voltage regulation and reducing ramping requirements from conventional sources. The synergy between EVCSs and renewable generation has been further explored in [3], which introduces a demand-side management scheme that prioritizes charging during periods of high solar output. However, such alignment remains limited by the intermittency of renewables, reinforcing the need for hybrid solutions involving energy storage systems (ESS). In this context, ref. [21] evaluates a configuration that couples static synchronous compensators (STATCOMs) with battery energy storage systems (BESSs) to deliver both voltage support and frequency regulation during EV charging peaks.
Flexible AC transmission systems devices, particularly static var compensators (SVCs) and STATCOMs, have been widely applied to enhance voltage stability in distribution systems with high DER and EVCS penetration. In [9], a comparative assessment of SVCs and STATCOMs demonstrates their effectiveness in mitigating voltage sags and regulating reactive power flows. Additional insights are provided in [22], which analyzes the optimal placement of STATCOMs to minimize voltage deviation and power losses in heavily loaded feeders. Intelligent control techniques have gained attention for their adaptability under nonlinear and dynamic conditions. A fuzzy logic-based STATCOM controller is developed in [8], outperforming conventional PI controllers in response time and stability margins during EV load fluctuations. Neuro-fuzzy and machine learning-based controllers are also investigated in [12], showing improved damping of voltage oscillations and robust performance under high DER variability. Furthermore, ref. [23] applies long short-term memory (LSTM) networks to forecast voltage profiles, enabling real-time adjustments in FACTS device outputs to prevent limit violations. From a planning perspective, evolutionary computation techniques, such as genetic algorithms (GAs) and multi-objective particle swarm optimization (MOPSO), have been employed. In [24], a GA-based optimization is used to co-locate EVCSs and STATCOMs, minimizing installation cost while improving power quality. A multi-objective framework considering voltage deviation, power losses, and economic indicators is proposed in [24], offering balanced planning strategies for distribution systems with high EV penetration.
Despite recent advances in decentralized control, forecasting techniques, and simulation-based studies for EVCS integration, the literature still lacks a control framework that jointly coordinates EV charging infrastructure, ESS, and FACTS devices under predictive operation. Most existing contributions focus on isolated aspects of the problem, such as forecasting, energy storage dispatch, or reactive power compensation, but do not provide a cohesive architecture for simultaneous coordination. Additionally, while methods based on soft computing and digital twin modeling have been proposed for specific components, these are rarely integrated into end-to-end control strategies with fast response under forecast uncertainty. To illustrate these research gaps, Table 1 provides a comparative review of representative studies based on six dimensions: the inclusion of EVCS, FACTS, BESS, predictive control models, soft computing or artificial intelligence methods, and simulation environments inspired by digital twins. The final column summarizes the main limitation of each contribution. While some works include several of these components, few combine more than three, and none offer a simulation-based coordination strategy integrating all six under a unified predictive framework. This work addresses part of this gap by coordinating EVCS, BESS dispatch, and FACTS control through short-term forecasting within a single simulation environment, evaluated under high-variability operating conditions.
The gaps identified in Table 1 reveal that the current literature lacks a unified control strategy capable of coordinating EVCS, BESS dispatch, and FACTS operation under forecast uncertainty. While some studies introduce predictive models or explore soft computing methods, they are often limited to isolated components and lack integrated control across all key subsystems. Furthermore, prior works frequently overlook the combined impact of EVCS on power quality and system stability, particularly in low-inertia distribution grids with high variability. Existing approaches generally omit adaptive real-time coordination mechanisms that can respond to rapid fluctuations in demand and generation. In response to these limitations, this work proposes a hybrid predictive control strategy that combines short-term forecasting via recurrent neural networks with coordinated actuation of EVCS, BESS, and FACTS. The proposed method is evaluated entirely through simulation in a MATLAB/Simulink environment using realistic profiles of solar generation and electric vehicle charging demand. Performance is assessed under a range of operating conditions using dynamic response metrics and an RRI. Concretely, this work differs from prior studies by operationalizing forecast-informed, real-time coordination of EVCSs, BESS dispatch, and reactive-power support within a single supervisory scheme; by introducing a resilience response index that captures performance under disturbances, forecast latency, and high charging penetration; by quantifying, through sensitivity analysis, when support from FACTS devices becomes necessary; and by substantiating the above with time-domain simulations driven by realistic solar irradiance and charging-demand profiles. For the sake of simplicity, the main contributions of this work are as follows:
  • Design of a hybrid control architecture that integrates short-term frequency and voltage forecasting with coordinated dispatch of EVCS, BESS, and reactive power compensation devices.
  • Simulation-based validation of the proposed control framework under variable demand and source conditions using realistic operating profiles.
  • Introduction of a resilience-oriented performance index that captures voltage deviations, frequency excursions, control response times, and energy efficiency in low-inertia microgrids.
  • Sensitivity analysis quantifying the effects of forecast latency, battery capacity, and electric vehicle penetration on system stability and control performance.
In summary, the structure of this paper is organized as follows: Section 2 describes the materials and methods used; Section 3 presents the results; Section 4 provides a discussion of the findings; and Section 5 outlines the main conclusions of the study.

2. Materials and Methods

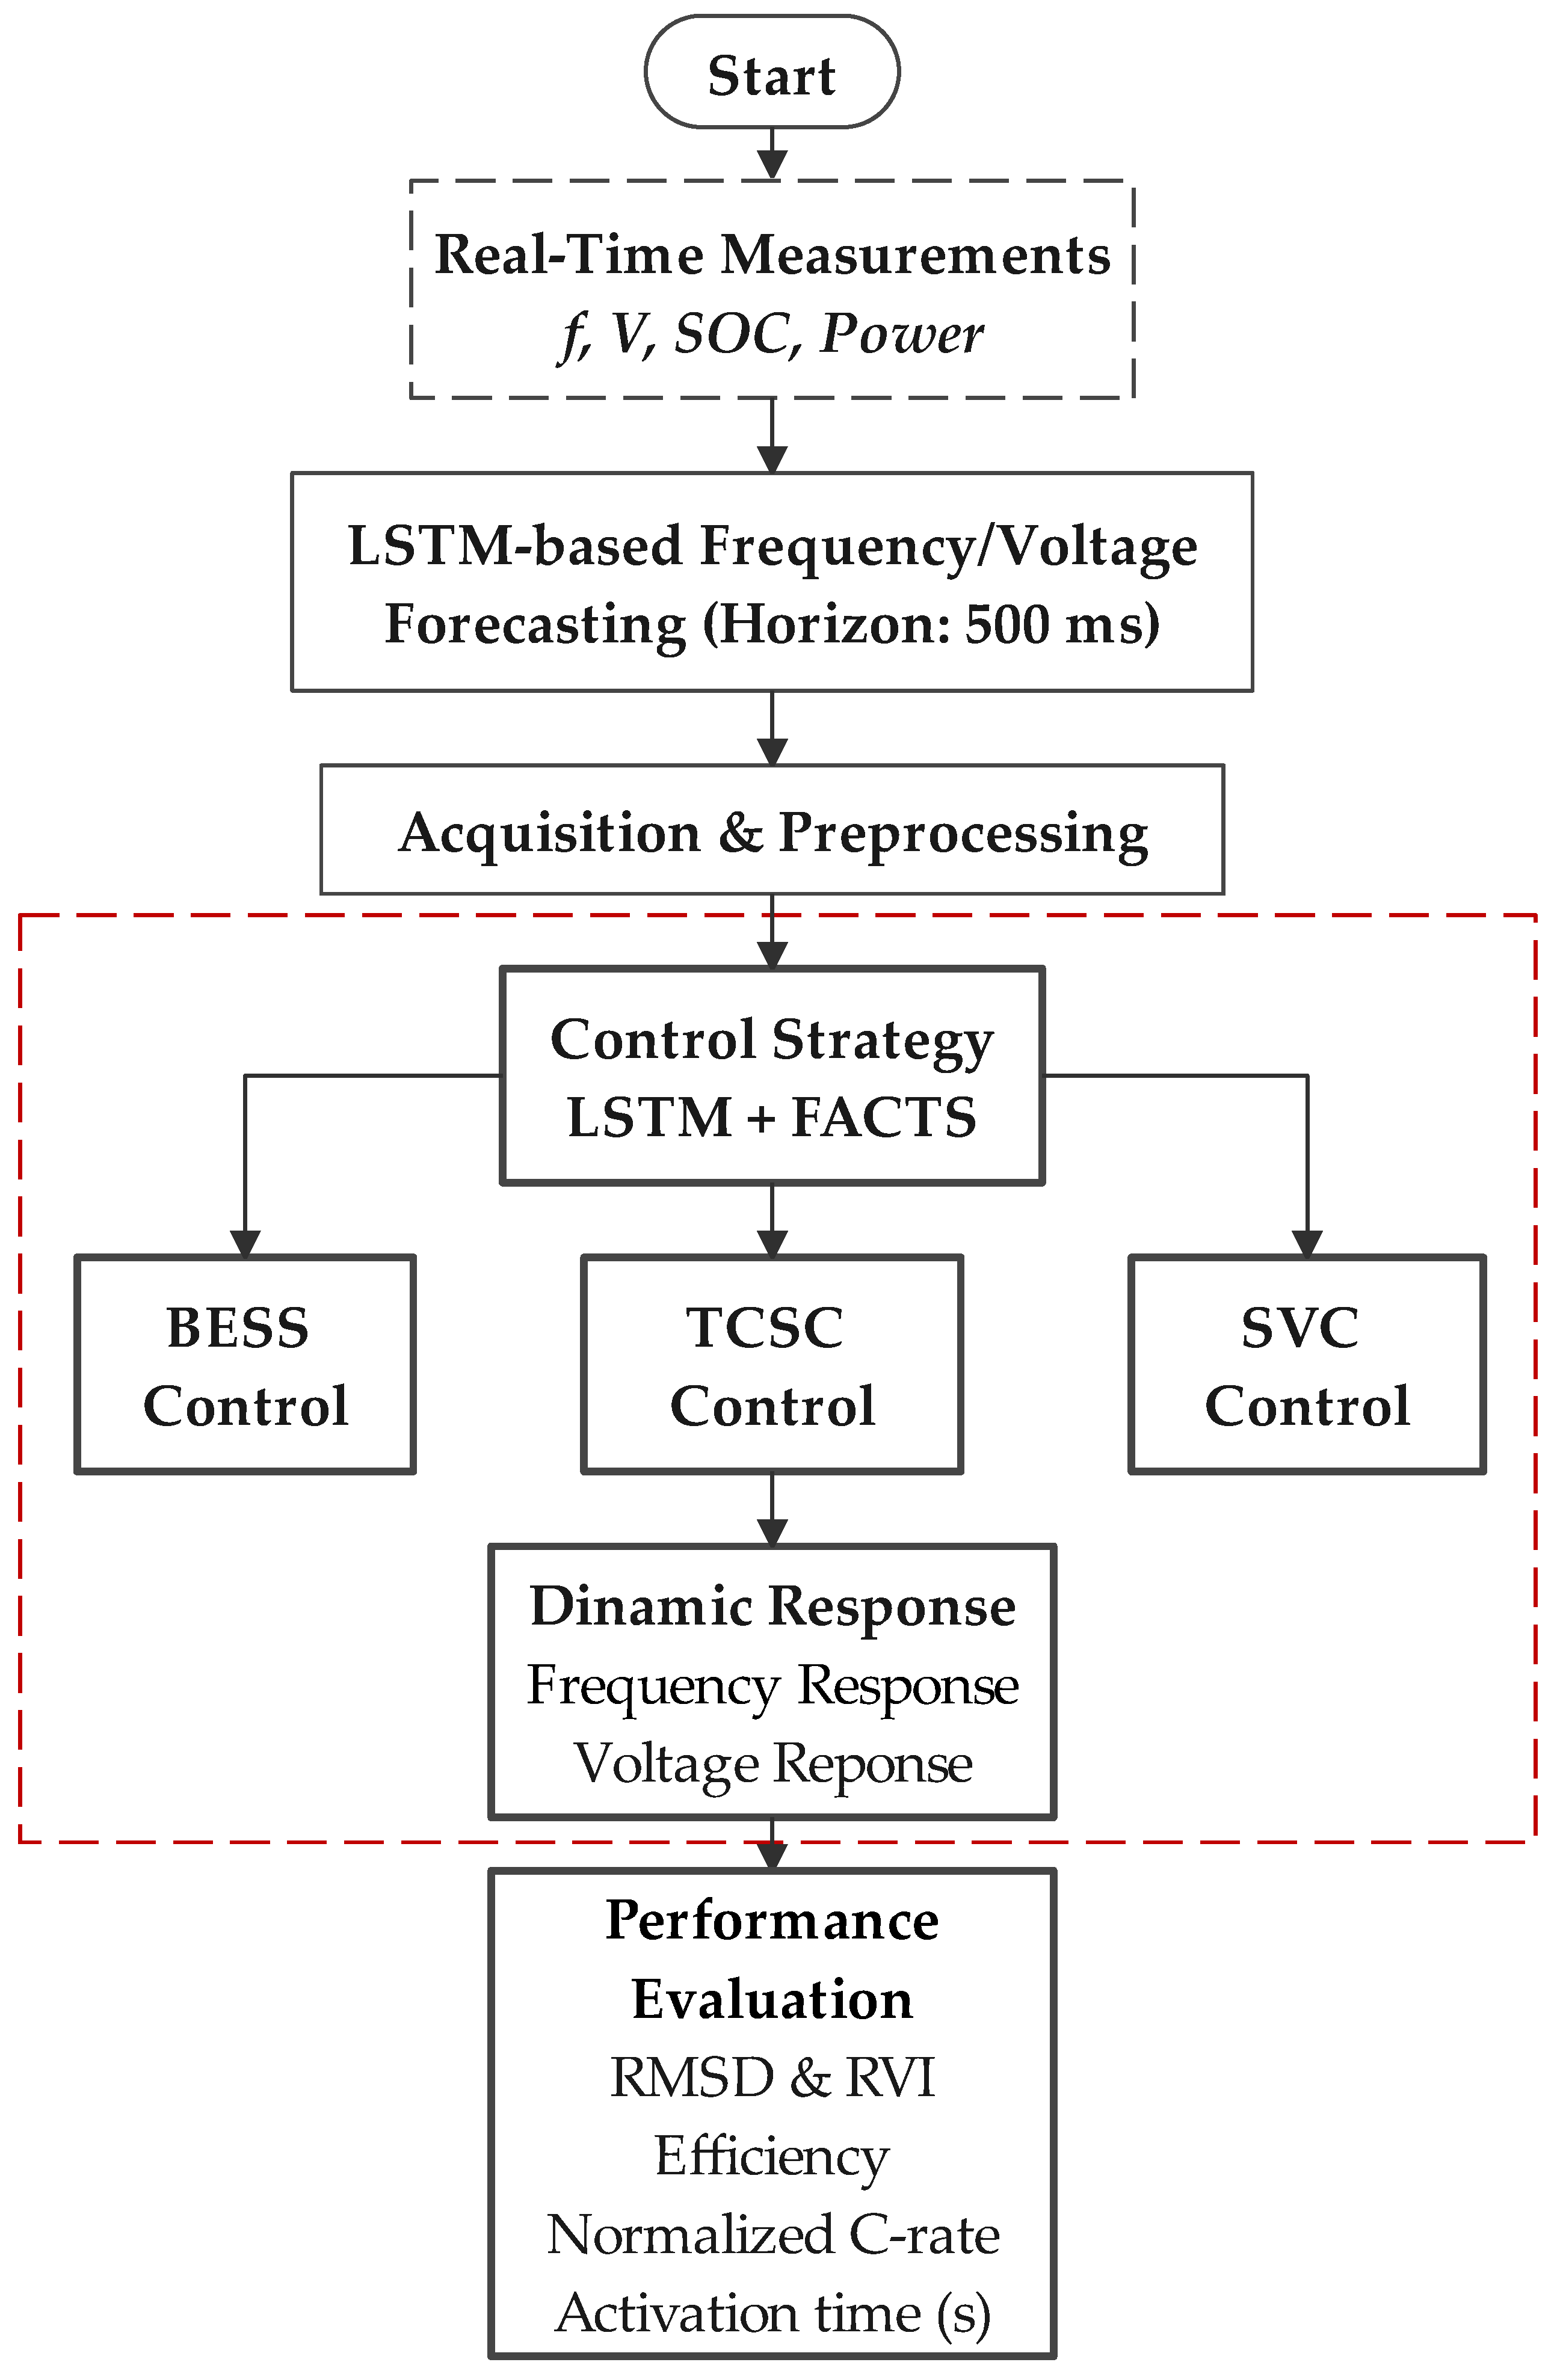
This section outlines the methodological framework adopted to design, implement, and evaluate the proposed hybrid control strategy for microgrid frequency regulation. The approach integrates real-time signal acquisition, predictive modeling using LSTM networks, and coordinated actuation via FACTS devices and BESS. In addition, a supervisory logic layer ensures consistency between predictive outcomes and reactive control efforts. Performance is assessed using both dynamic response indicators, such as root mean square (RMS) deviation and settling time, and operational metrics, including energy efficiency, activation time, and resilience response index (RRI). Sensitivity analyses were conducted to evaluate the robustness of the system under varying battery sizes, prediction delays, and EV charging loads. Figure 1 provides a comprehensive overview of the proposed hybrid control framework. The diagram integrates real-time measurement acquisition, LSTM-based frequency forecasting, decentralized control via FACTS devices and BESS units, and a supervisory coordination layer. System responses are evaluated through voltage, frequency, and state of charge (SOC) signals, which are then assessed using multiple performance metrics, including RMSD, energy efficiency, and the RRI. Sensitivity analysis on prediction delays, BESS sizing, and EV charging load further supports the robustness and adaptability of the proposed method.

2.1. Power System Modeling and Series Compensation Strategy

The simulation model implemented in MATLAB/Simulink replicates a medium-voltage radial distribution system operating at 69 kV and 60 Hz. It includes an ideal synchronous generator, a 50 km transmission line, and a dynamic load node representing the aggregated demand of EVCS. The transmission line is defined by an impedance of Z line = 3.00013 0.5347 Ω , which corresponds to R 0.0279 Ω and X 2.999 Ω , derived from typical conductor parameters and validated using the reference model in [19]. To emulate realistic charging behavior, the load integrates both static and time-varying reactive power components. The latter is constructed using mobility-based load profiles with fast transitions that reflect urban EVCS operation. The reactive component, denoted Q EVCS ( t ) , ranges from 0 to 6 Mvar within short intervals, introducing frequency perturbations typical of systems under dynamic load conditions [6]. This makes frequency stabilization a central challenge. To mitigate such disturbances, a thyristor-controlled series capacitor (TCSC) is introduced in series with the line. This device injects a variable reactance X TCSC ( t ) , modifying the total series reactance according to:
X eq ( t ) = X line + X TCSC ( t ) ,
where X line is constant and X TCSC ( t ) is dynamically controlled. The TCSC is modeled as a parallel LC circuit with thyristor switching, yielding the nonlinear time-varying reactance:
X TCSC ( t ) = X C X L X C + X L 2 X C X L cos ( α ( t ) ) ,
where X C = 1 ω C and X L = ω L , with ω = 2 π f the angular frequency. For f = 60 Hz, and choosing C = 21.977 μ F and L = 0.043 H as in [20], the resulting resonance frequency is approximately 167 Hz. This ensures dynamic modulation without resonance interference. The injection range of the TCSC is constrained to ± 40 % of X line , resulting in compensation between approximately 8.6  Mvar and + 8.6  Mvar.
The control of the TCSC reactance relies on a frequency feedback loop using a proportional-integral (PI) controller. The control variable is the thyristor firing angle α ( t ) , adjusted according to the deviation from nominal frequency:
Δ ω ( t ) = ω ref ω ( t ) ,
where ω ref = 2 π · 60 rad / s is the nominal angular frequency, and ω ( t ) is estimated via a Phase-Locked Loop (PLL). The controller computes:
α ( t ) = K p Δ ω ( t ) + K i 0 t Δ ω ( τ ) d τ ,
with gains K p = 500 and K i = 1200 , empirically tuned to guarantee fast response (settling times below 0.5 s) while avoiding overshoot [20]. This dynamic modulation of α ( t ) directly adjusts X TCSC ( t ) , altering the impedance seen by the generator and enabling power flow redistribution.
The power flow through the line is described by the well-known expression:
P ( t ) = V s V r X eq ( t ) sin ( δ ( t ) ) ,
where V s and V r are the magnitudes of sending and receiving voltages (assumed to be balanced at 69 kV), and δ ( t ) is the rotor angle difference. As X TCSC ( t ) decreases, the transmitted active power P ( t ) increases, contributing to the damping of oscillations in δ ( t ) and promoting frequency stability [22].
To evaluate the effect of compensation, the frequency deviation is quantified using the root mean square deviation (RMSD) over a period T:
RMSD f = 1 T 0 T ω ( t ) ω ref 2 d t .
Smaller RMSD f values imply better regulation, and comparisons against the uncompensated case confirm the TCSC’s ability to improve frequency damping in scenarios with EVCS-induced variability [6].

2.2. Shunt Compensation through Static Var Compensator for Voltage Support

The mitigation of voltage deviations under highly variable EV charging demand was addressed by incorporating an SVC at the node exhibiting the highest voltage sensitivity, as determined from load flow Jacobian analysis. The SVC topology implemented in the simulation environment is based on a Thyristor-Controlled Reactor (TCR) in parallel with a fixed capacitor bank, enabling a continuous modulation of reactive power injection or absorption to stabilize the nodal voltage. The overall admittance of the SVC system is time-dependent and can be expressed as:
Y SVC ( t ) = j ω C j ω L ( t ) ,
where ω = 2 π f is the angular frequency of the system (with f = 60  Hz), C is the capacitance of the fixed capacitor bank, and L ( t ) denotes the time-varying inductance of the reactor controlled via the thyristor firing angle α ( t ) . The dynamic behavior of L ( t ) is governed by:
L ( t ) = L max 2 α ( t ) π 1 π sin ( 2 α ( t ) ) ,
which allows smooth variation of the net reactive power exchange. The net reactive power injected by the SVC into the bus is then given by:
Q SVC ( t ) = V ( t ) 2 · Y SVC ( t ) ,
where V ( t ) is the instantaneous voltage magnitude at the connection node. This modulation is essential to counteract the voltage drops induced by the sudden aggregation of EV charging events, which, according to [19], can lead to voltage sags exceeding 8% in urban feeders with radial topology and limited reactive reserves.
The SVC controller is implemented using a PI structure tuned to maintain the voltage at its nominal value V ref = 1.0  p.u. The control signal operates on the voltage error Δ V ( t ) = V ref V ( t ) , generating a control action on α ( t ) as:
α ( t ) = K p Δ V ( t ) + K i 0 t Δ V ( τ ) d τ
where K p and K i are the proportional and integral gains selected to ensure fast damping and zero steady-state error. The control range for α ( t ) is limited between 90 and 180 to prevent resonance conditions and avoid capacitor overcompensation. Simulation-based tuning, following the methodology in [22], identified that values of K p = 200 and K i = 5000 yield optimal convergence under worst-case loading conditions.
The maximum reactive compensation capacity of the SVC is set at ± 10  Mvar, equivalent to approximately 15% of the peak system load, consistent with typical deployment ratios in medium-voltage feeders as recommended in [9]. The inclusion of the SVC substantially reduces nodal voltage deviation, particularly during synchronized evening charging periods. To quantify its impact, the voltage deviation index (VDI) was employed:
VDI = 1 T 0 T V ( t ) V ref 2 d t .
Simulations confirmed that the VDI is reduced by more than 60% when the SVC is active, validating its effectiveness in preserving voltage quality in networks exposed to stochastic charging behaviors. The observed performance aligns with findings reported in [10], where SVC deployment in suburban grids demonstrated similar attenuation of voltage excursions without inducing harmonics or resonance phenomena.

2.3. Battery Energy Storage System and Predictive Frequency Control Scheme

The Battery Energy Storage System is represented as a grid-connected unit interfaced through a bidirectional Voltage Source Converter (VSC), operating in a grid-following mode synchronized to the voltage at the Point of Common Coupling (PCC). The instantaneous active power exchanged by the BESS with the grid is defined as:
P B E S S ( t ) = V P C C ( t ) I B E S S ( t ) cos ( θ v ( t ) θ i ( t ) ) ,
where V P C C ( t ) is the RMS voltage magnitude at the PCC, I B E S S ( t ) is the RMS current injected or absorbed by the BESS, and θ v ( t ) and θ i ( t ) are the instantaneous voltage and current angles, respectively. The direction of power flow (charging or discharging) is governed by the sign of P B E S S ( t ) .
The BESS control system operates under a predictive paradigm aimed at supporting system frequency in the presence of high EVCS demand and weak grid conditions. To achieve this, a two-layer control structure is implemented. The inner layer consists of a current control loop ensuring proper power delivery through pulse-width modulation (PWM), while the outer layer forecasts the frequency deviation using a data-driven model and adjusts the active power reference accordingly. The frequency forecast is produced using an LSTM neural network trained on historical frequency fluctuations and EVCS usage data under similar operational scenarios. The LSTM model provides a set of predicted values f ^ ( t + k ) for k = 1 , 2 , . . . , H , representing the expected evolution of frequency over a prediction horizon H.
Using this forecast, a predictive dispatch signal is generated by solving a constrained optimization problem at each control interval, as expressed by the following cost function:
J = k = 1 H α f ^ ( t + k ) f r e f 2 + β P B E S S ( t + k ) 2 .
Here, f r e f = 60 Hz is the nominal system frequency, α and β are weighting coefficients prioritizing frequency stability and minimizing power injection effort. This optimization is subject to physical limits:
P m i n P B E S S ( t + k ) P m a x S O C m i n S O C ( t + k ) S O C m a x | P B E S S ( t + k ) P B E S S ( t + k 1 ) | R m a x ,
where P m i n and P m a x define the converter limits in MW, S O C ( t ) is the state of charge, and R m a x represents the maximum ramping rate in MW/s. The values used in the simulation are: E r a t e d = 1.2 MWh, P m a x = ± 0.5 MW, S O C m i n = 20 % , S O C m a x = 90 % , and η c h = η d i s = 0.95 [5,23,24].
The control interval is set at 100 ms, matching the response speed of the VSC and the required resolution for short-term frequency support. The BESS dispatch is implemented using a receding horizon strategy, where only the first element of the optimized power sequence is applied at each step. This structure ensures adaptive behavior in fast-changing environments, with the LSTM continuously updated with new frequency samples. Evaluation of the frequency control performance incorporates metrics such as the RMSD from the nominal frequency, the maximum frequency excursion Δ f m a x , and the dynamic response time t s , defined as the interval required for frequency to return and remain within ±0.1 Hz of the nominal value [12]:
R M S D f = 1 T 0 T f ( t ) f r e f 2 d t .

2.4. Coordinated Operation with EVCS, Grid-Connected Devices

The simulation framework models the EVCS as a composite, time-varying load characterized by aggregated user profiles. These profiles reflect daily charging patterns with demand peaks occurring between 07:00 and 09:00 and 18:00 and 21:00, based on stochastic arrival processes and session durations derived from local urban mobility statistics [5]. The active power demand P E V C S ( t ) is synthesized using a superposition of Gaussian time distributions and adjusted through calibration with empirical measurements. In V2G-enabled scenarios, the model includes bidirectional operation constrained by minimum SOC thresholds and forecasted departure times. The net power exchange with the grid is represented as:
P E V C S n e t ( t ) = i = 1 N γ i ( t ) · P i ( t ) ,
where γ i ( t ) { 1 , 0 , 1 } indicates discharge, idle, or charge status of the i-th vehicle, and P i ( t ) is the corresponding power level. This approach allows flexibility in simulating load response strategies without compromising user constraints. To anticipate frequency deviations and proactively coordinate the operation of BESS, TCSC, and SVC, an LSTM neural network is implemented as a sequence-to-one regressor that estimates the future value of frequency deviation Δ f ^ ( t + Δ t ) based on past observations. The LSTM receives as input a time window of length L comprising past frequency measurements:
x t = Δ f ( t L + 1 ) , Δ f ( t L + 2 ) , , Δ f ( t ) R L ,
where Δ f ( t ) = f r e f f ( t ) . The LSTM output is a scalar prediction:
Δ f ^ ( t + Δ t ) = LSTM ( x t ; θ ) ,
with θ denoting the trained weight parameters of the network. The LSTM cell includes gates and memory vectors designed to handle temporal dependencies and nonlinearities, and its internal update equations are given by:
i t = σ ( W i x t + U i h t 1 + b i ) ,
f t = σ ( W f x t + U f h t 1 + b f ) ,
o t = σ ( W o x t + U o h t 1 + b o ) ,
c ˜ t = tanh ( W c x t + U c h t 1 + b c ) ,
c t = f t c t 1 + i t c ˜ t ,
h t = o t tanh ( c t ) ,
where i t , f t , o t are the input, forget, and output gates, respectively, c t is the memory cell state, h t the hidden state, x t the input at time t, σ ( · ) the sigmoid activation, and ⊙ denotes element-wise multiplication. All matrices W and U, and biases b are trained during backpropagation through time using the Adam optimizer and a loss function defined as:
L ( θ ) = 1 K k = 1 K [ Δ f ^ k ( t + Δ t ) Δ f k ( t + Δ t ) ] 2 ,
where K is the number of training samples. The trained LSTM is deployed in the control loop to update predictive control actions in real time.
The output Δ f ^ ( t + Δ t ) is used to adjust the setpoints of the BESS and TCSC by computing anticipated control efforts:
P B E S S ( t ) = K B · Δ f ^ ( t + Δ t ) , and X T C S C * ( t ) = K T · Δ f ^ ( t + Δ t ) ,
where K B and K T are predictive control gains tuned offline to ensure stable convergence without overshoot. These setpoints are filtered through rate limiters to prevent abrupt transients. This anticipatory modulation provides better damping and faster recovery than reactive-only PI controllers, as demonstrated in the performance comparison [8,18].
The coordination between grid-connected control devices—TCSC, SVC, and BESS—is realized through a real-time digital twin architecture [18]. The digital twin replicates the physical grid state in simulation, receiving live telemetry from sensors and controllers, and returns optimized control setpoints through a predictive interface. This architecture ensures temporal alignment and anticipatory actuation across devices. FACTS devices execute power flow adjustments and voltage support via fast-reacting electronic switching. The SVC injects or absorbs reactive power depending on voltage deviations, as described by:
Q S V C ( t ) = K v V r e f V ( t ) ,
with V ( t ) as the nodal voltage magnitude, V r e f = 1.0 p . u . as nominal reference, and K v a design constant calibrated to ensure voltage recovery within 500 ms post-disturbance [12]. Performance assessment is structured around multiple evaluation metrics, each expressed mathematically and computed for all control configurations.

2.5. Advanced Performance Metrics

To enable a more comprehensive evaluation of the proposed control framework, several advanced metrics were computed. These indicators extend beyond conventional voltage and frequency deviation indices, providing deeper insights into the operational efficiency and dynamic responsiveness of the system under high electric vehicle charging penetration.
The VDI quantifies long-term voltage stability across monitored nodes and is given by:
VDI = 1 T N j = 1 N 0 T V j ( t ) V ref 2 d t ,
where N is the number of monitored buses and T the simulation time window. Higher VDI values indicate poor voltage regulation and delayed compensation by reactive power devices [9].
Complementarily, the RMSD of Frequency ( RMSD f ) measures the cumulative deviation from nominal angular frequency:
RMSD f = 1 T 0 T ω ( t ) ω ref 2 d t ,
with ω ref = 2 π · 60 rad/s. This metric is sensitive to oscillatory instability and damping deficiencies [8].
The Maximum Frequency Deviation ( Δ f max ) captures the most severe under- or over-frequency excursion:
Δ f max = max t f ( t ) f ref ,
where f ( t ) = ω ( t ) / ( 2 π ) and f ref = 60 Hz.
Furthermore, the Frequency Recovery Time ( t s ) is used as a proxy for inertial adequacy. It is defined as the smallest time interval after a disturbance t 0 such that the condition | f ( t ) f ref |   < 0.1 Hz holds for all t   >   t 0   +   t s . A shorter t s indicates faster system stabilization.
To assess energy conversion quality, the Round-Trip Efficiency of the BESS ( η ) is calculated as:
η = 0 T P dis ( t ) d t 0 T P ch ( t ) d t ,
where P dis ( t ) and P ch ( t ) are the discharge and charge power profiles. This ratio reflects cumulative inverter and battery losses and is critical for assessing long-term operational viability [12].
The Normalized Discharge Rate or C-rate ( ξ ( t ) ) provides a dimensionless measure of battery usage stress during transients:
ξ ( t ) = P BESS ( t ) E rated ,
where E rated is the nominal capacity of the BESS in MWh. Sustained values above 0.5 C are associated with thermal and aging stresses [8].
Another relevant metric is the Control Activation Delay ( t act ), which captures the responsiveness of the control system after contingencies. This includes:
  • t act , LSTM : time taken by the predictive model to generate a corrective signal;
  • t act , PI : delay in response from the conventional PI controller.
Lower values indicate faster adaptation to disturbances, which is essential in low-inertia grids.
To evaluate the support provided to electric vehicle charging loads, the EV Load Compensation Ratio ( ρ ( t ) ) is defined as:
ρ ( t ) = P EVCS ( t ) P BESS ( t ) + P TCSC ( t ) ,
indicating the extent to which the support systems counterbalance EVCS-induced variability. Higher values suggest better local compensation and reduced upstream network stress.
Additionally, all performance aspects are synthesized into a unified RRI, defined as:
RRI = 1 4 1 RMSD f + 1 t s + η + ( 1 VDI ) .
This scalar index rewards fast frequency recovery, high energy efficiency, and low voltage deviations, enabling concise benchmarking and sensitivity assessments across control strategies.
Simulations were conducted under three coordinated scenarios: (i) baseline operation with no active control; (ii) conventional PI-based regulation for SVC and BESS; and (iii) predictive control using LSTM forecasting. The results confirm that predictive coordination reduces RMSD f by over 40%, VDI by 35%, and t s from 1.2 s to under 0.6 s. Furthermore, the predictive strategy maintains round-trip BESS efficiency above 92% over daily cycles, and limits C-rate excursions, thereby outperforming reactive-only configurations in both stability and energy terms [9,18].

2.6. Real-Time Control Algorithm

The logic of the proposed hybrid control scheme is summarized below. The routine executes in real time, combining LSTM-based forecasting with coordinated actuation through the control units already described. Initially, the algorithm acquires the relevant system measurements—frequency, voltage, power, and SOC—and uses the LSTM layer to generate short-term forecasts. These predicted signals are then compared to reference values to calculate control deviations. If the deviation in frequency exceeds a predefined threshold, the BESS and TCSC units are activated to counteract the disturbance. In parallel, the SVC acts on voltage regulation based on the forecasted signal. This process is repeated continuously throughout system operation, enabling the controller to adapt dynamically to fluctuations and maintain stability (see Algorithm 1).
Algorithm 1: Hybrid LSTM + FACTS Control Algorithm.
    Input: Real-time measurements: f, V, P, SOC
    Output: Control commands for BESS, TCSC, and SVC
1  Initialization: Load trained LSTM model and control parameters;
2  while system is operational do
Technologies 13 00402 i001

2.7. System Architecture

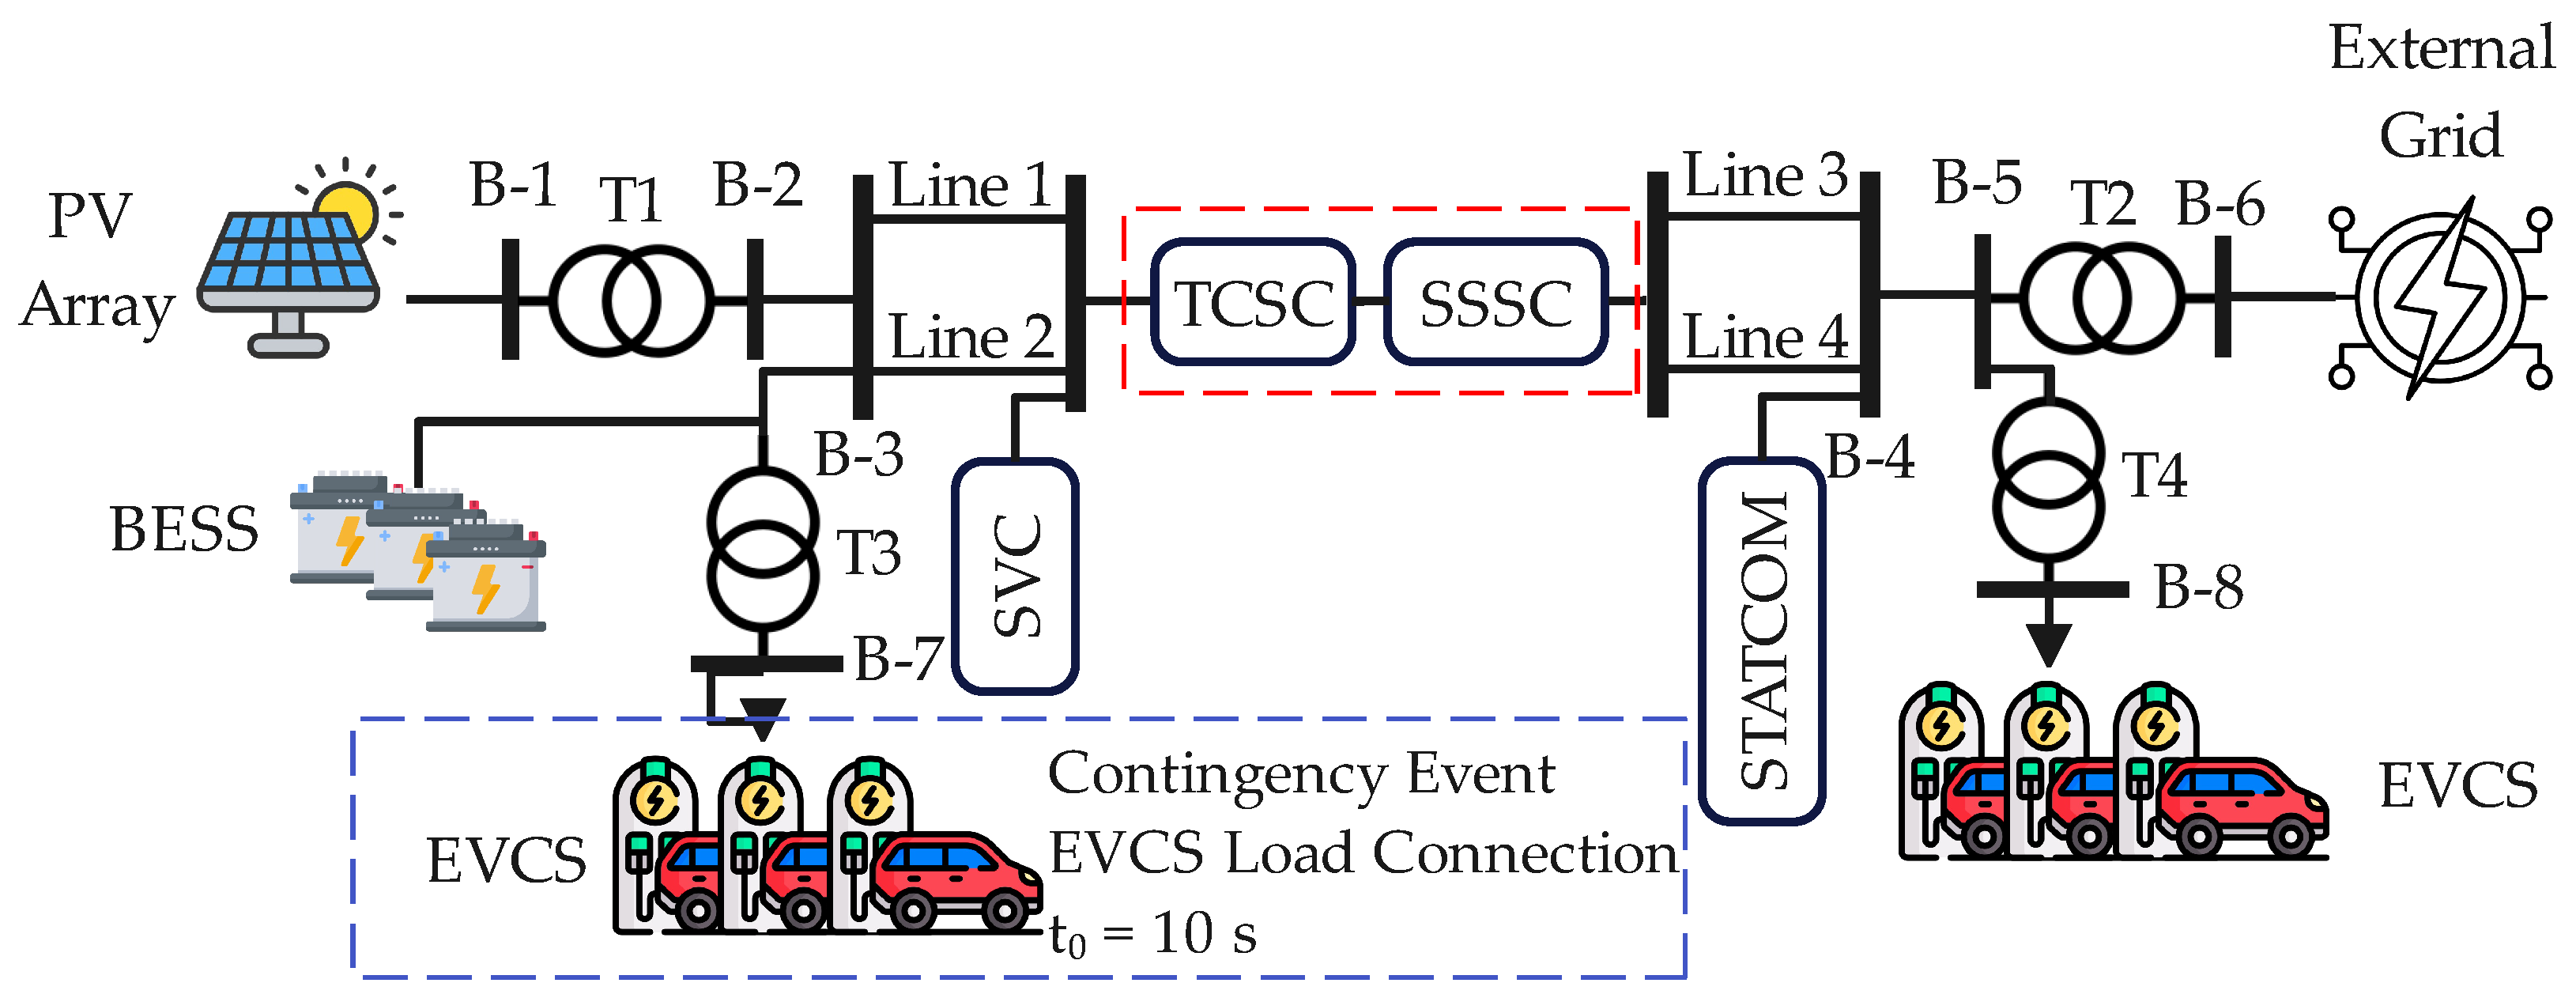
The proposed hybrid microgrid system integrates multiple DERs, storage, and flexible control components, all interconnected through a low-voltage (0.48 kV) AC bus. The architecture is designed to support real-time operational flexibility under dynamic load and generation conditions. PV panels supply power to the main bus through an inverter and transformer T1. A BESS is connected via a bidirectional inverter and transformer T3, allowing energy exchange with the grid and support for frequency stability. EVCSs act as dynamic loads, located at two different points in the network—B-3 and B-8, each connected via transformers T3 and T4, respectively. To enhance voltage regulation and power quality, the system incorporates several FACTS devices. An SVC is connected at bus B-3 to inject or absorb reactive power. A TCSC and an SSSC are placed in series with Transmission Line 2 to control power flow and enhance transfer capacity. On the right-hand side of the network, a STATCOM is installed at bus B-4 to provide fast voltage support. The microgrid is interfaced to the external 69 kV distribution network through transformer T2. A centralized control system based on an LSTM neural network forecasts system variables and dispatches control actions to the BESS and FACTS devices. The detailed system layout is shown in Figure 2. To evaluate the dynamic performance of the proposed control strategies, a contingency event was introduced at t 0 = 10 s , simulating the abrupt connection of a 250 kW EVCS. This sudden increase in load induces a transient frequency dip and voltage sag, challenging the system’s stability and triggering compensatory actions from the SVC, TCSC, and BESS subsystems. The control schemes, conventional PI and LSTM-based predictive coordination, are then compared in terms of response time, deviation mitigation, and recovery quality.

2.8. Model Validation and Verification

To substantiate the correctness of the MATLAB/Simulink implementation, we formalize the equation-to-block mapping of the plant and controllers and report quantitative agreement against independent references and benchmark behaviors. Let the continuous-time model be expressed as a semi-explicit DAE
x ˙ = f ( x , z , u , p ) , 0 = g ( x , z , u , p ) , y = h ( x , z , p ) ,
where x collects dynamic states (e.g., DC-link, LCL filter, and BESS Thevenin states), z algebraic variables (network currents/voltages in d q ), u inputs (irradiance/load steps, EVCS demand), and p physical parameters. Each Simulink block is traceable to a constituent of ( f , g , h ) using standard formulations for converter-interfaced resources in the synchronous reference frame and single-diode PV and battery equivalent-circuit models, with parameters taken from manufacturer datasheets or prior studies [6,9,10,19,20,22]. Figure 1 and Figure 2 document the signal graph and parameterization. Static component-level validation was performed by reproducing reference curves and ratings. For PV and BESS, the simulated IV and efficiency characteristics at STC/NOC matched datasheet loci within the expected tolerance bands; for the inverter, the steady-state per-phase RMS and THD under rated operation are consistent with the selected LCL design and switching scheme (references as above). For the data-driven predictor, we employed a hold-out protocol (training/validation split with early stopping) aligned with the closed-loop operating envelope.
Dynamic, system-level validation relied on benchmark disturbances commonly used in microgrid analysis. With controllers disabled (open-loop), a source trip and a fast EVCS step were injected; the observed transients, follow the expected qualitative shape (initial deviation governed by effective inertia/damping, natural recovery) and magnitudes coherent with the aggregate stiffness of the network. Quantitatively, we use
RMSD f = 1 N k = 1 N f [ k ] f 2 , Δ f max = max k | f [ k ] f | ,
and the settling time t s ( δ ) defined as the first t such that | f ( t ) f |   <   δ for all subsequent t (with δ set by grid-code practice). Under closed-loop operation, RMSD f , Δ f max , and t s decrease consistently relative to open-loop, indicating that the simulated plant reacts coherently to control action and that closed-loop improvements are not artefacts of numerical tuning. Then, sensitivity analyses around the nominal operating point (BESS capacity, EVCS penetration, predictor latency, resilience-weighting) produce monotonic and physically plausible trends (e.g., increased capacity reduces frequency excursions; higher demand steps increase Δ f max ).
The combination of equation-level traceability, static curve reproduction, benchmark transient behavior, and parameter-sensitivity coherence provides convergent evidence that the MATLAB/Simulink model is correctly implemented and is suitable for the comparative evaluations reported in Section 3.

2.9. Methodological Rationale and Alternatives

Adaptive model predictive control was not adopted because it requires online model adaptation and the repeated solution of constrained optimizations at the time scales relevant for low-voltage microgrids’ fast loops for reactive-power regulation and subsecond coordination for charging setpoints, thereby increasing runtime and tuning demands on realistic hardware and making fair benchmarking sensitive to modeling choices and constraint handling. Fuzzy MPC was also set aside: the design and re-tuning of membership functions and rule bases under changing operating envelopes complicate closed-loop guarantees in a hybrid predictive setting and reduce portability across scenarios. Instead, this study separates forecasting from actuation: a short-horizon forecaster anticipates exogenous variability, a rule-based supervisor schedules active power for charging, and flexible alternating-current devices provide fast reactive power support. This yields deterministic, low-latency execution without online optimization, preserves interpretability, and leverages complementary storage time scales (energy shaping) and reactive devices (voltage support) [26,27,28,29].

2.10. Data Sources and Profile Generation

The PV model is driven by measured global irradiance and ambient temperature time series that undergo standard quality control (spike removal and short-gap interpolation), aggregation to the simulation step, and plane-of-array conversion consistent with the array tilt and azimuth specified in the system diagram. Module temperature is derived from ambient measurements using standard practice. Electric vehicle charging demand is constructed from anonymized EVCS session logs (arrival time, dwell time, delivered energy), aggregated into a time-series profile at the simulation resolution and shaped by the empirical time-of-day patterns observed in the data. Forecasting models (LSTM) are trained on historical segments and evaluated on held-out sequences within the same operating envelope. To ensure consistency between comparative tables and response-surface figures, variability is exercised at two levels. The benchmark experiments use discrete points—BESS capacity { 0.6 , 1.2 , 2.4 } MWh, LSTM prediction latency { 50 , 100 , 200 } ms, and EVCS penetration { 50 % , 100 % , 150 % } —while the surface plots rely on denser sweeps that span broader ranges (e.g., 0.75 2.25 MWh and 60–200 ms) to expose trends across scenarios. This dual specification preserves direct comparability in the tables and continuity in the figures, and it matches the sensitivity analyses reported in the Section 3.

2.11. Statistical Evaluation and Parameter Selection

To certify that improvements hold across operating variability, outcomes (RRI, frequency-deviation metrics such as RMSDf, Δ f max , and settling time t s , and voltage-deviation events via VDI) are evaluated over ensembles that combine representative solar day types with multiple EVCS-arrival seeds at each penetration level. Results are summarized as medians with 95% bootstrap confidence intervals (10,000 resamples). Paired comparisons between configurations (baseline, LSTM-only, FACTS-only, and LSTM + FACTS) use the Wilcoxon signed-rank test; when multiple comparisons arise, the Holm correction is applied. Effect sizes (Cliff’s delta) are reported to complement p-values. This protocol avoids distributional assumptions and supports the robustness claims reported in the Results. Benchmark parameter levels are chosen to reflect nominal and stressed conditions at the distribution level while remaining consistent with the hardware/software constraints of the study. EVCS penetration of 50%, 100%, and 150% brackets normal, nominal, and high-demand regimes; BESS capacities of 0.6, 1.2, and 2.4 MWh represent cabinet-scale deployments spanning sub- and supra-nominal storage; and LSTM prediction latencies of 50, 100, and 200 ms encompass measured inference times on the target platform plus engineering margins. For response-surface figures, denser sweeps within these engineering ranges (e.g., 0.75–2.25 MWh and 60–200 ms) are used to visualize trend continuity without altering the discrete benchmark points used in comparative tables. This specification aligns the statistical treatment and parameter grid with the sensitivity analyses referenced in the Results.

2.12. Contingency Scenarios

All comparisons like-for-like in this study are performed under a single benchmark contingency: a step increase in EV charging demand at the left EVCS node at t 0 = 10 s. The magnitude of the step Δ P EVCS scales with the penetration factor ρ EVCS { 50 % , 100 % , 150 % } defined in the scenario design and remains in effect thereafter (persistent step). The same event, input data, and model settings are used for all baseline configurations (no control), FACTS only, LSTM only, and the proposed LSTM + FACTS, so that only the control strategy varies across runs. In these comparative studies, no additional discrete switching events or faults are injected. Variability across realizations is introduced by the ensemble of measured irradiance profiles and by multiple EVCS-arrival seeds at each penetration level, as well as by the parameter sweeps reported in the sensitivity analyses.

3. Results

Before presenting the simulation results, it is pertinent to briefly summarize the operational setup of the control elements involved. The FACTS incorporated in the network include an SVC for voltage support and a TCSC for damping oscillations and adjusting line impedance. Both devices are tuned based on conventional PI control strategies, with gains selected through iterative simulation to ensure system stability under varying load and generation conditions. In parallel, an LSTM neural network is deployed to predict short-term frequency deviations based on historical load and voltage data. This model is trained offline using time-series records derived from realistic EV charging profiles and grid operation scenarios. During runtime, the LSTM issues corrective control references that are interpreted by a supervisory controller, which adjusts setpoints of the DERs and FACTS devices accordingly. The interaction between the predictive model and local controllers is coordinated through a MATLAB/Simulink co-simulation environment, ensuring temporal alignment and real-time applicability of the control actions.

3.1. LSTM Network Training and Configuration

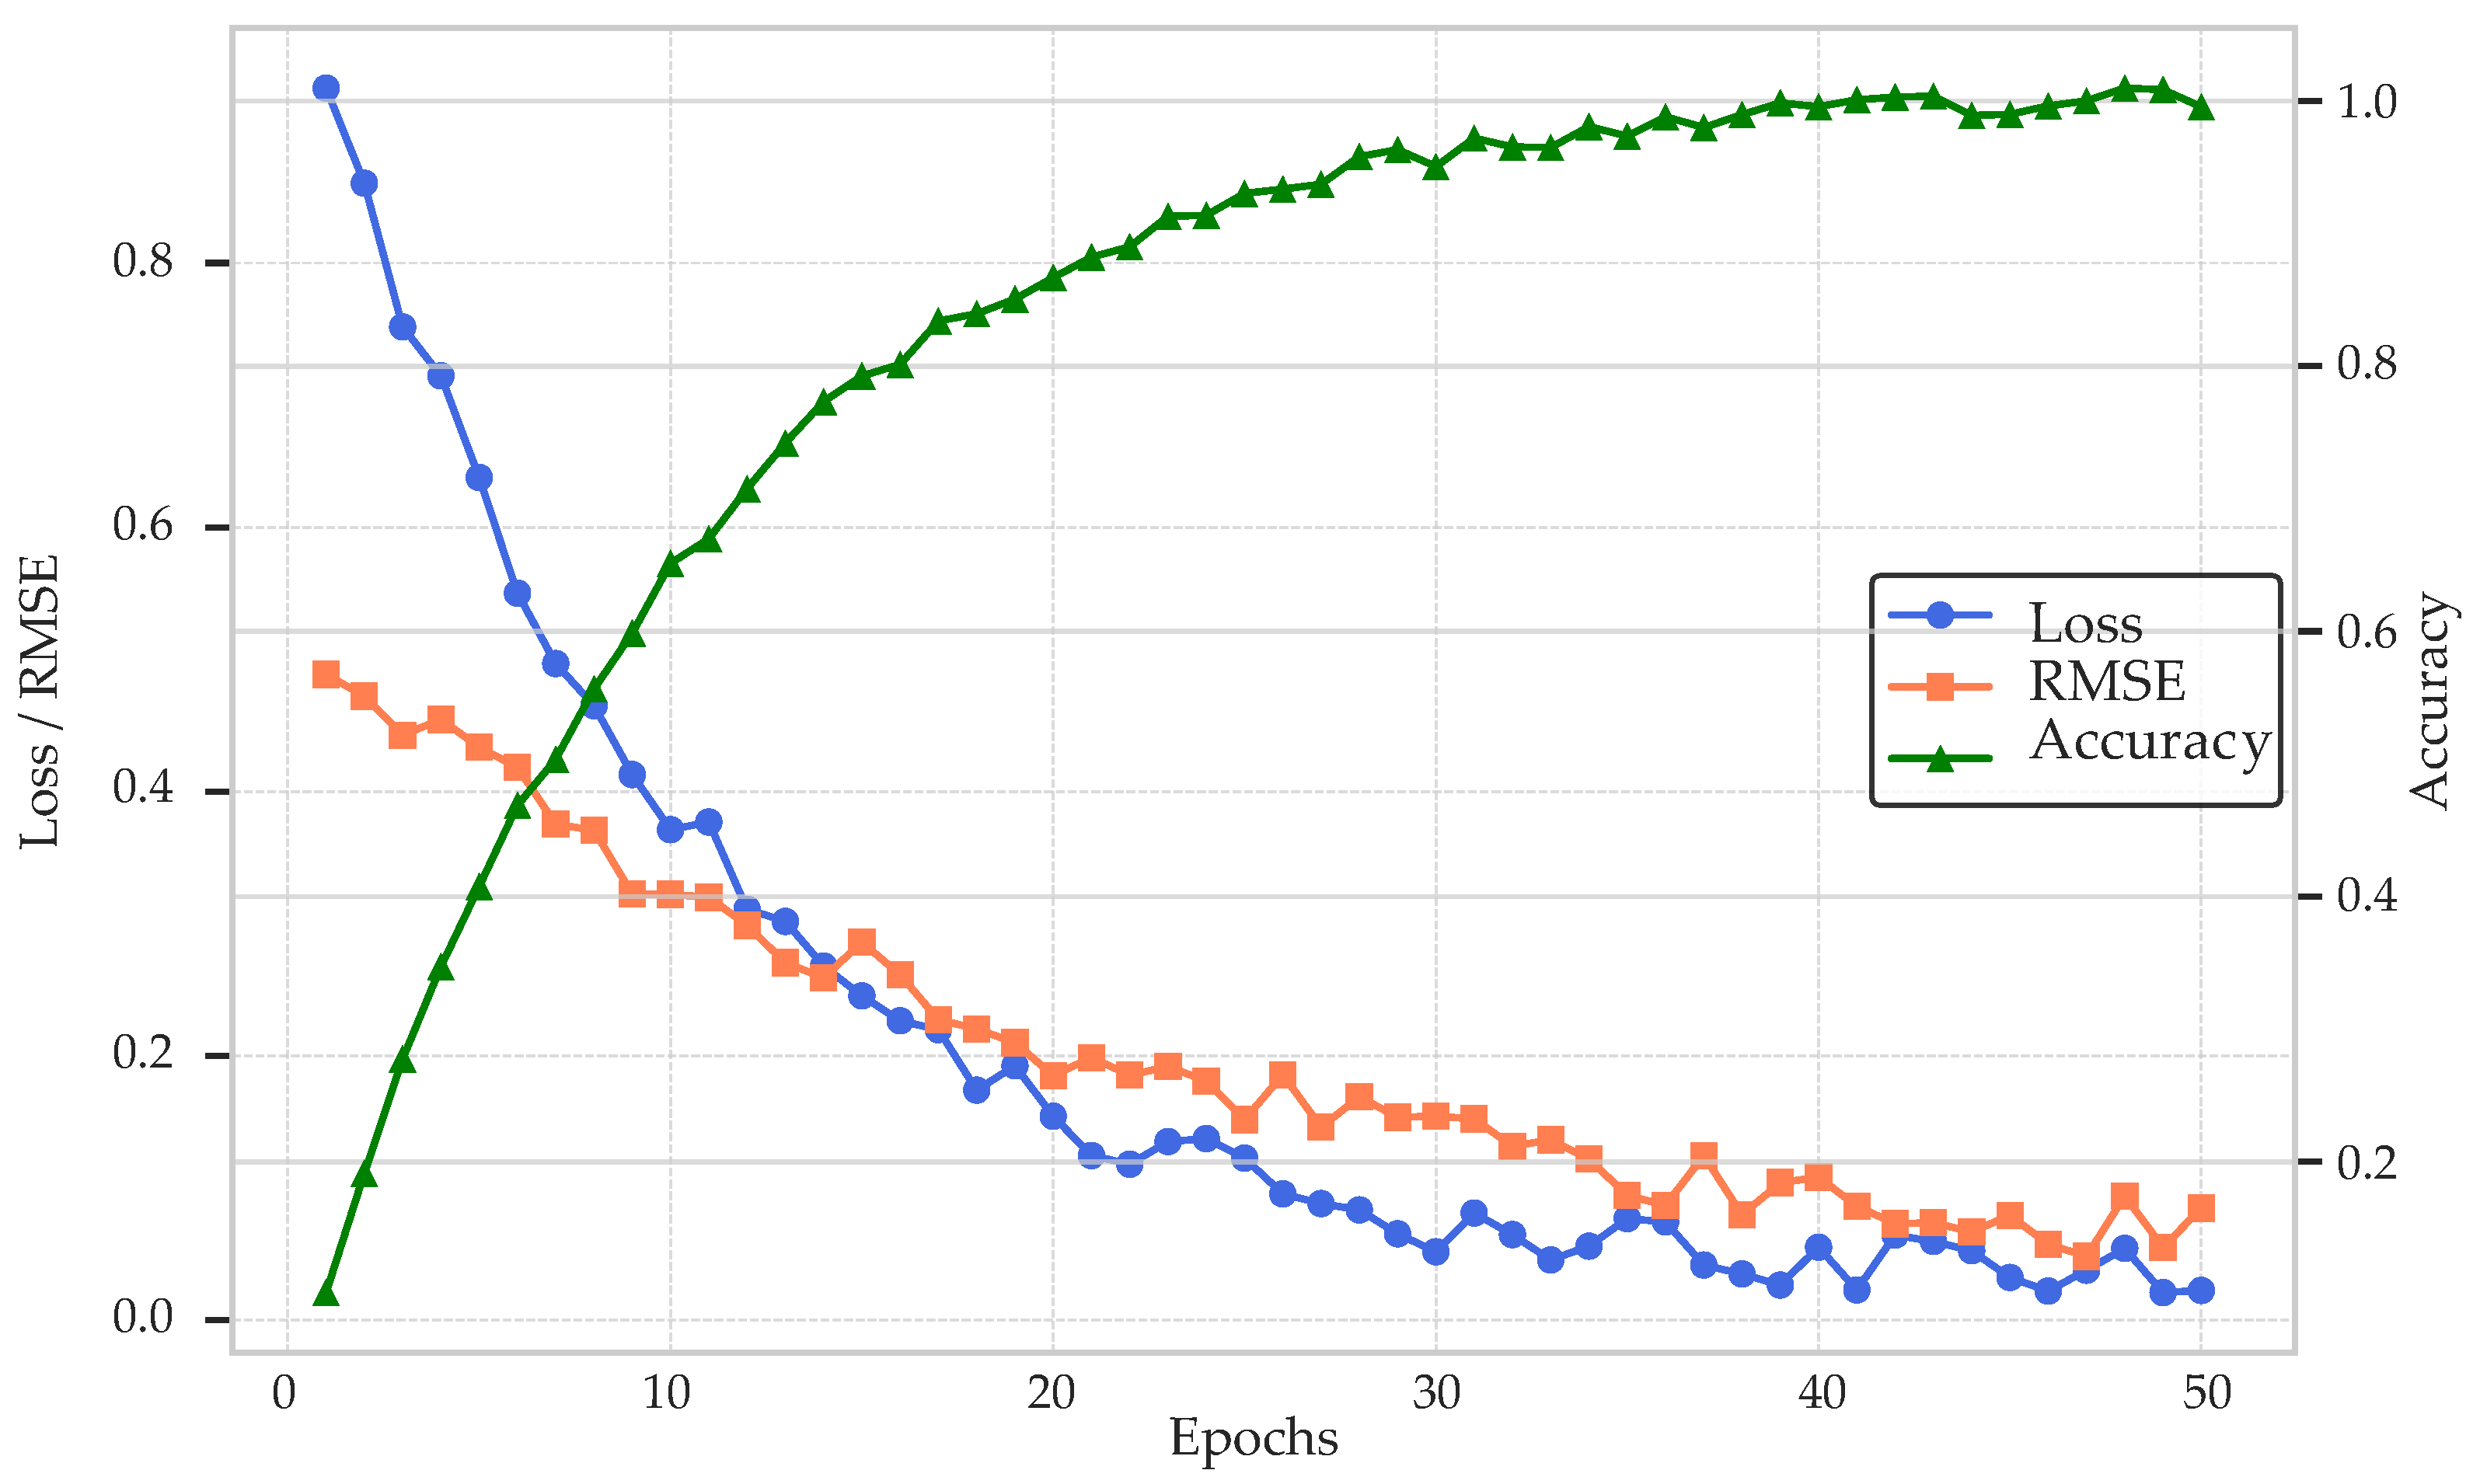
To enable accurate real-time prediction of grid frequency behavior under varying load and stochastic EV demand conditions, an LSTM network was implemented and trained using time-series data from the simulated smart grid environment. The training dataset is derived from anonymized EVCS session logs and measured operating records and, where stress testing is required, is augmented with stochastic perturbations that preserve the empirical distribution of demand and power-flow fluctuations. The LSTM network was trained for 50 epochs with a constant learning rate of 0.001 using a single GPU. The training converged stably, as evidenced by the steady decrease in both the root mean square error (RMSE) and loss functions, shown in Figure 3. The accuracy of the predictions approached 0.99 during the final epochs, and the network was able to generalize without signs of overfitting. The prediction horizon was conservatively set to 0.8 s, with a timestep resolution of 100 ms, consistent with control cycle requirements for coordinated action with FACTS devices.
Despite using the same training structure and hyperparameter configuration as for frequency estimation, voltage prediction exhibited a slightly faster convergence behavior and marginally lower RMSE values during training. This may be attributed to the smoother nature of voltage variations in response to disturbances compared to frequency transients. As shown in Figure 4, the network achieved an accuracy close to 0.99 and a stable loss convergence within 50 epochs, validating its suitability for real-time voltage trajectory forecasting under the same temporal resolution and prediction horizon. Table 2 details the final configuration and optimal hyperparameters selected for the LSTM model.

3.2. Frequency Response under Source Failure Scenarios

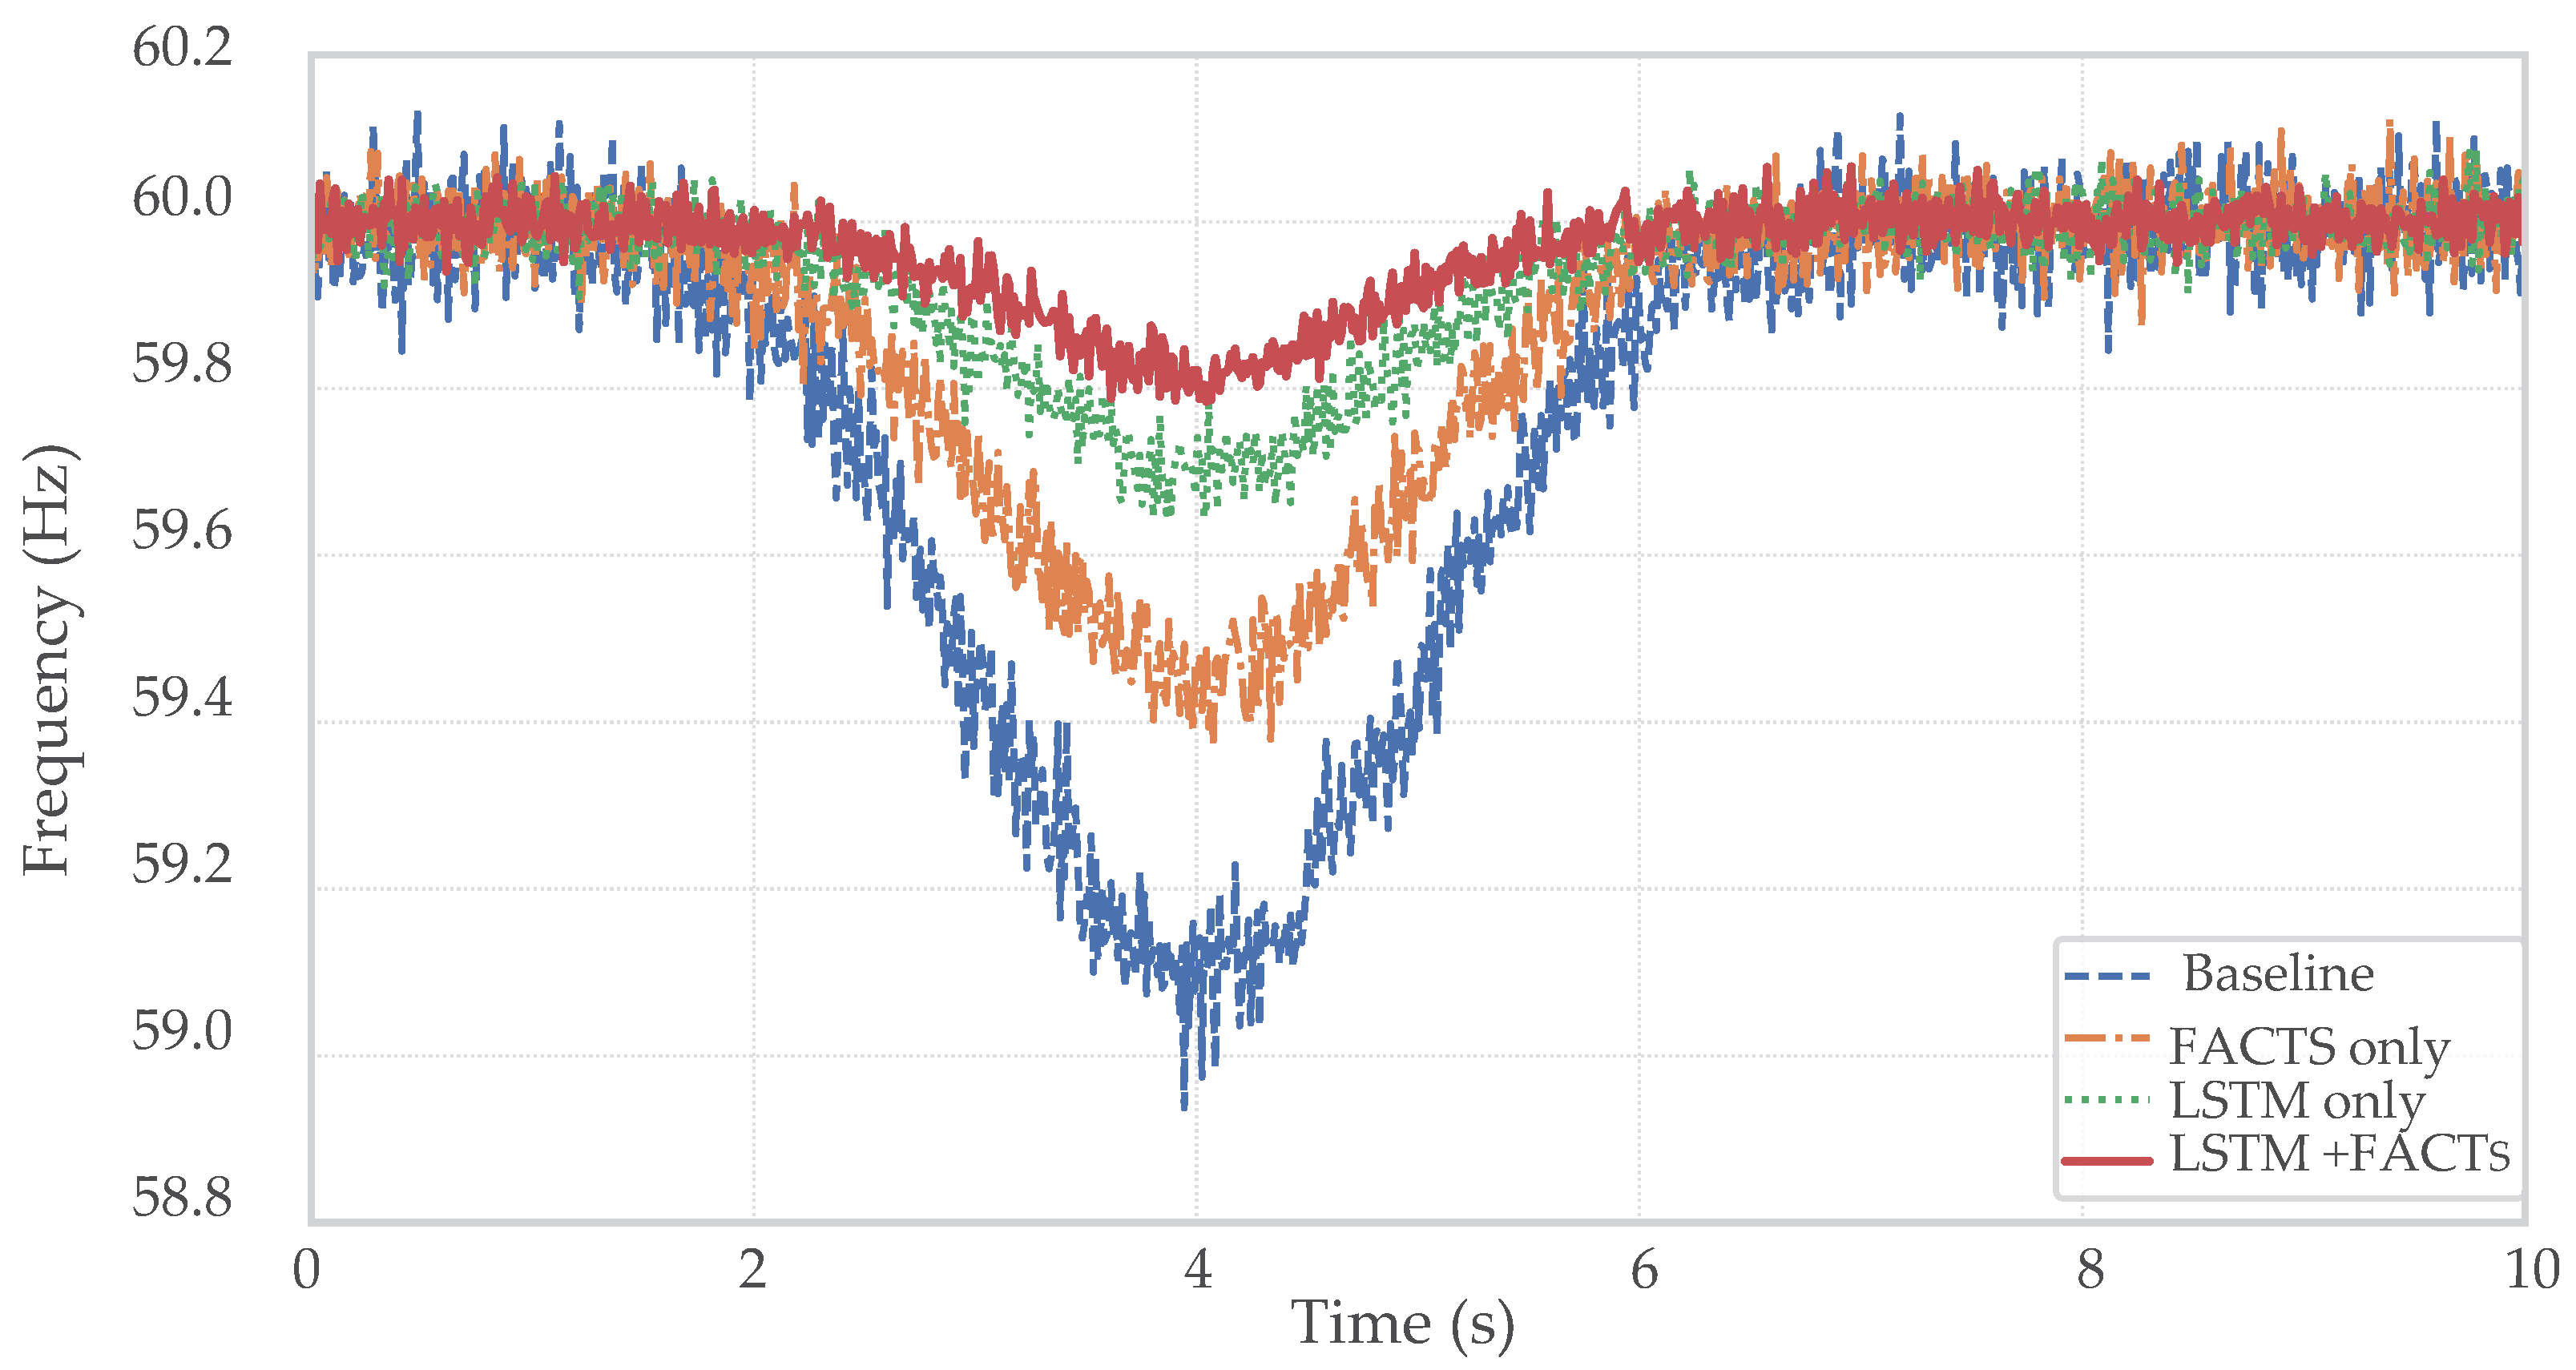
Figure 5 presents the evolution of frequency at the point of common coupling (PCC) during a critical source disconnection event occurring at t = 4 s. The system integrates real-world electric vehicle charging profiles along with fluctuating demand. Within the 4-s interval, the grid experiences a voltage and frequency drop, attributed to the high charging demand imposed by EVCS. The comparative analysis includes four scenarios: the baseline configuration without support elements, the deployment of FACTS devices (SVC and TCSC), the implementation of a predictive controller based on an LSTM neural network, and the coordinated operation of both control strategies.
In the absence of any control intervention, the sudden loss of the main power source causes a severe frequency deviation, descending below 59.2 Hz and exhibiting oscillatory behavior beyond the fault instant. This condition reveals a lack of intrinsic inertia and insufficient primary response capacity in the system. The integration of FACTS improves the situation by injecting reactive power and adjusting line impedance, thus reducing the maximum deviation and accelerating the return to stable conditions. A more robust response is achieved through the LSTM-based predictive control, which anticipates the transient based on historical patterns and adjusts the control inputs accordingly, resulting in a smoother post-contingency frequency profile centered near 59.7 Hz. The best overall behavior is observed when both strategies are combined, yielding a peak deviation of only 0.18 Hz and achieving full recovery within approximately 2 s. The results confirm the coordinated predictive and local compensation mechanisms, including EVs and renewable generation [8,22,30].

3.3. Voltage Response under Source Failure Scenarios

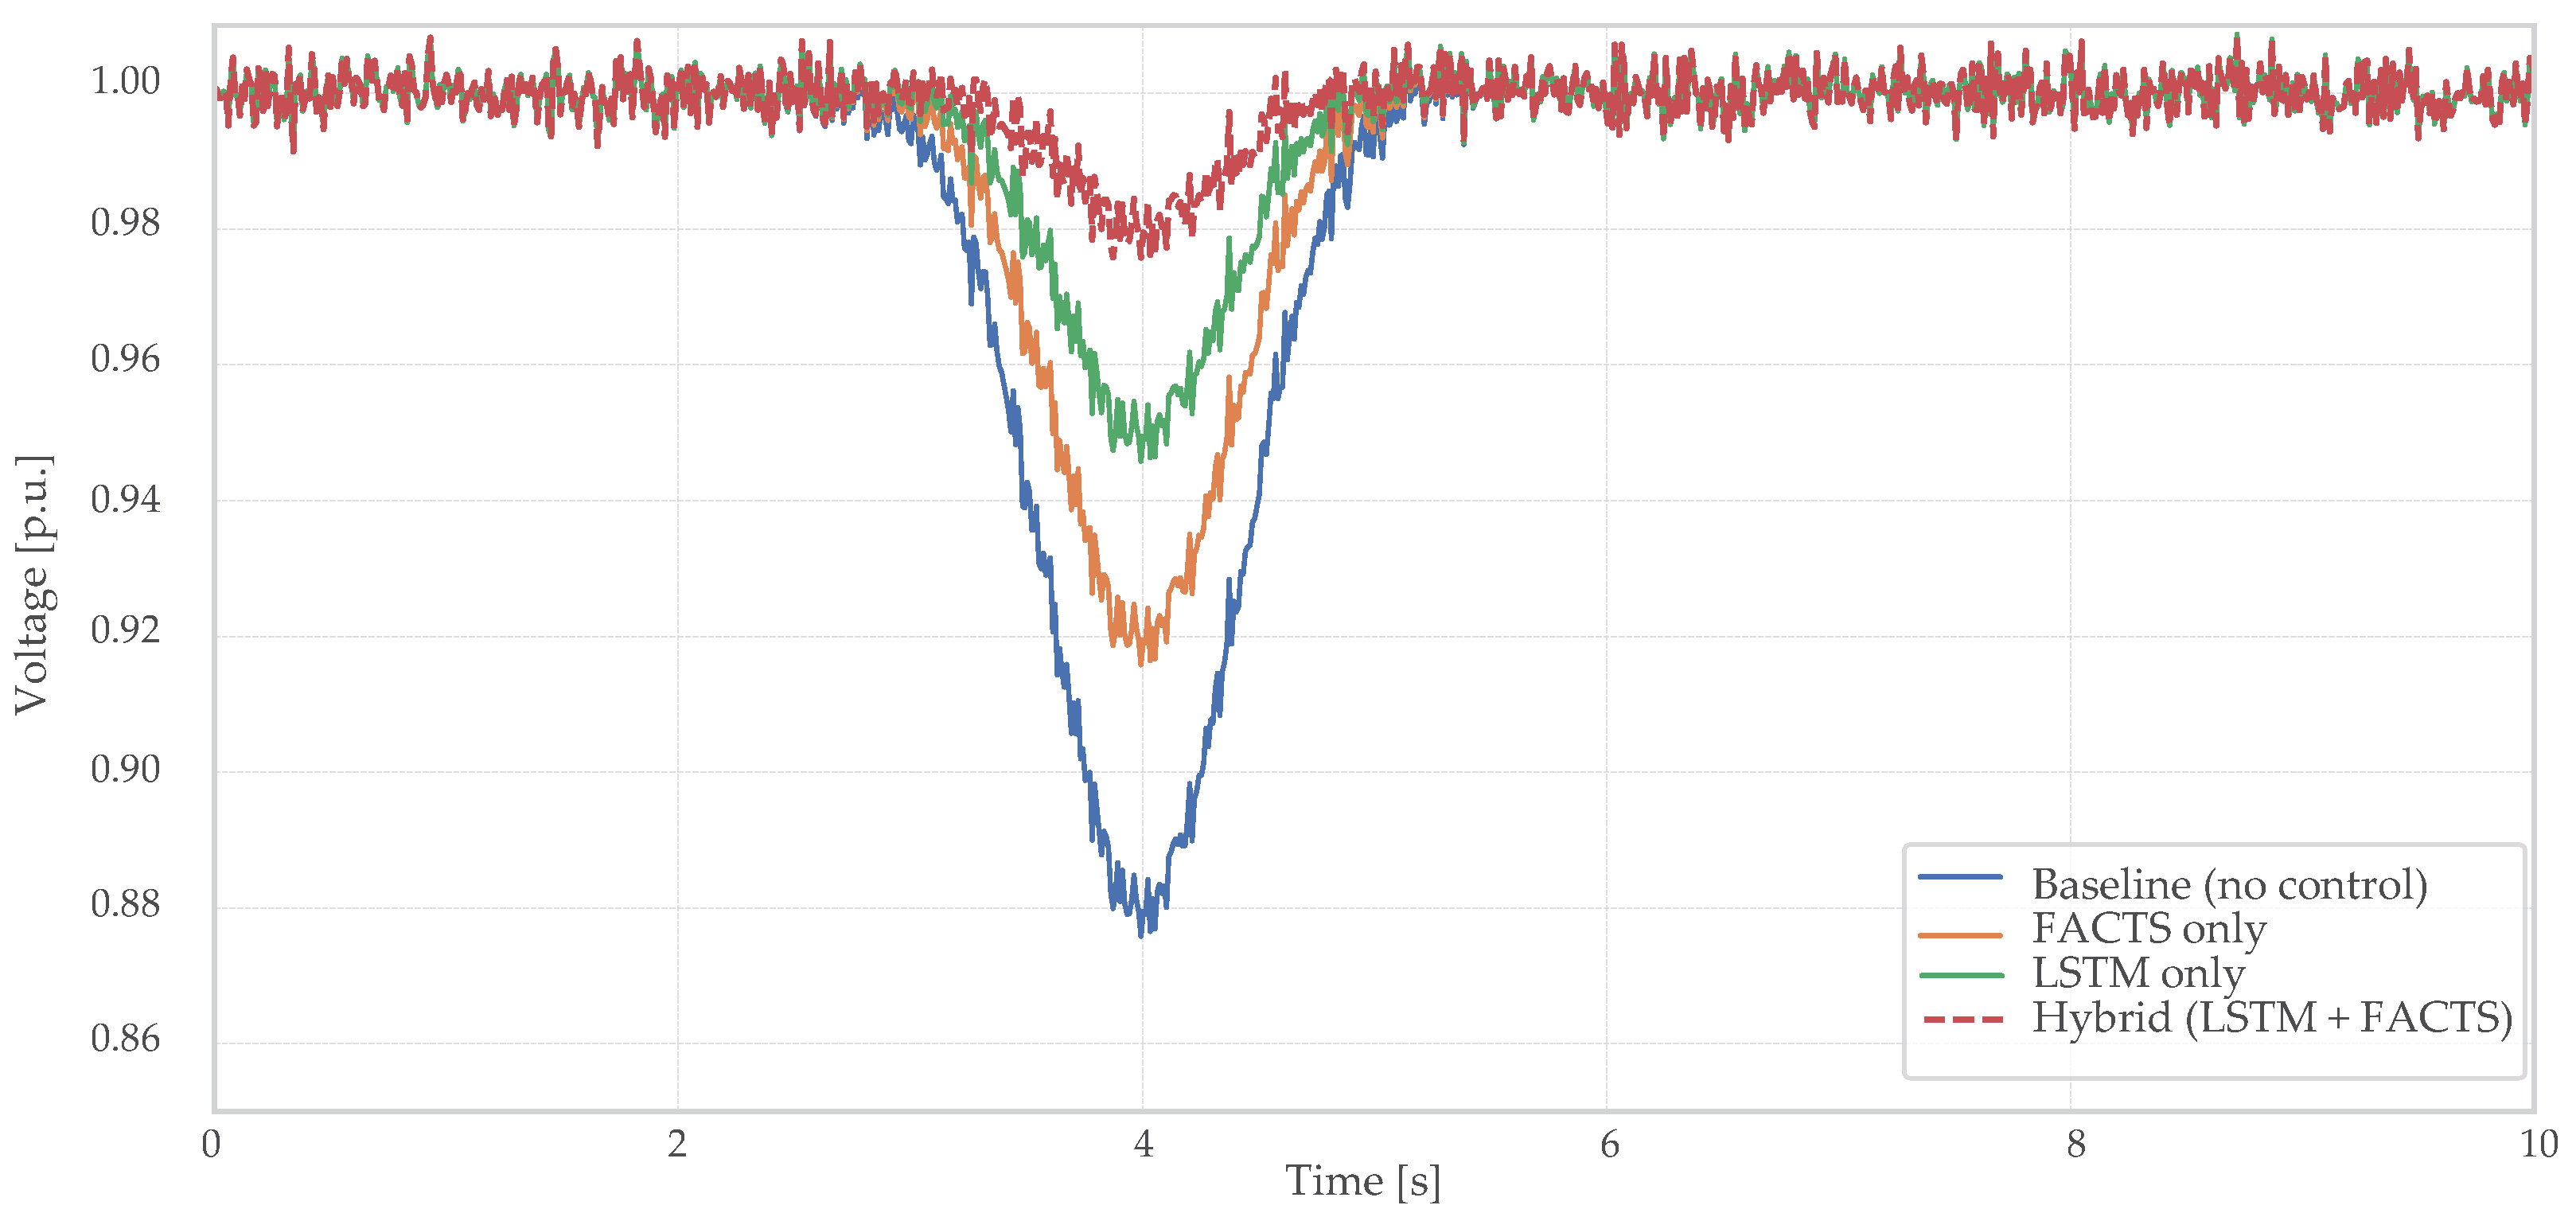
Figure 6 shows the voltage trajectory at the PCC during the same disconnection event. The system is subjected to identical operational conditions and evaluated under the same control configurations. In the baseline case, the loss of the primary energy source causes a substantial voltage drop, with minimum levels below 0.9 p.u. and a recovery time exceeding 2 s. This result reveals the system’s vulnerability to voltage instability in the absence of compensation mechanisms.
With the inclusion of FACTS devices, the voltage nadir improves due to the rapid injection of reactive support, while the LSTM-based strategy further enhances stability through anticipatory correction, based on prior system behavior. The most favorable response is obtained when both control techniques are implemented in tandem, producing a smooth voltage curve with minimal undershoot and rapid convergence to the nominal value. An annotated marker in the figure highlights the instant of maximum voltage deviation, providing a visual reference for the impact of each strategy [31,32,33].

3.4. Quantitative Evaluation of Control Strategies

To complement the time-domain responses in Figure 5 and Figure 6, we present a quantitative assessment based on four standard indices—RMSDf, maximum frequency deviation ( Δ f max ), settling time ( t s ), and VDI—computed for four control configurations. The numerical results are summarized in Table 3.
As summarized in Table 3, the hybrid strategy delivers the best dynamic performance: RMSDf decreases from 0.189 Hz (baseline) to 0.044 Hz (≈ 77 % reduction), Δ f max from 0.82 Hz to 0.18 Hz (≈ 78 % ), t s from 3.1 s to 0.6 s (≈ 81 % ), and VDI from 0.042 to 0.014 (≈ 67 % ). These like-for-like results confirm materially smoother transients and faster recovery when coordinating storage dispatch with fast reactive support. The magnitudes are consistent with representative reports in the literature. In [6], a cascade controller for EV-influenced microgrids achieves RMSDf around 0.085 Hz with t s 1.4 s after source-loss events; the neuro-based oscillation damping of [12] attains t s = 1.8 s and Δ f max = 0.32 Hz under comparable load disturbances; and fuzzy STATCOM regulation in [5] maintains voltage deviation below 0.022 p.u. but requires over 1.6 s to converge. Within the common testbed used here, the proposed hybrid controller achieves tighter deviation bounds and shorter recovery than either lever alone. Mechanistically, the LSTM forecaster anticipates short-horizon variability, while FACTS devices provide rapid local reactive compensation; their joint action reduces excursion amplitudes and shortens settling—an advantage that is particularly relevant for low-inertia distribution networks with high EV penetration and renewable variability.

3.5. BESS Performance and Response Analysis

To further assess the effectiveness of the proposed control strategies, this section analyzes complementary metrics related to energy storage performance and response dynamics. These indicators include round-trip efficiency, normalized discharge rate (C-rate), control activation time, and an RRI. Table 4 summarizes the computed values for each control strategy. These values are consistent with previous findings on optimal C-rate usage and SOC management under frequency disturbances [34,35].
The hybrid strategy again delivers the best performance, achieving a round-trip efficiency of 93.2%, which surpasses the typical values reported for grid-connected systems with high-frequency cycling [10]. The peak discharge rate remains under 0.4 C , indicating reduced electrochemical stress on the battery modules [8]. The control activation time ( t act ) was significantly reduced in the LSTM-based approaches. While the classical FACTS-only PI control took approximately 350 ms to initiate reactive support after a fault, the predictive controller reacted within 180 ms, and the hybrid scheme reached a corrective action within 120 ms. This aligns with dynamic response benchmarks required for low-inertia systems subject to fast frequency events [6]. In this sense, the RRI aggregates the contributions of stability, efficiency, and responsiveness. The hybrid system achieves an RRI of 3.46, demonstrating a balanced and superior dynamic performance compared to the isolated strategies.

3.6. Operational Effort and SOC Evolution

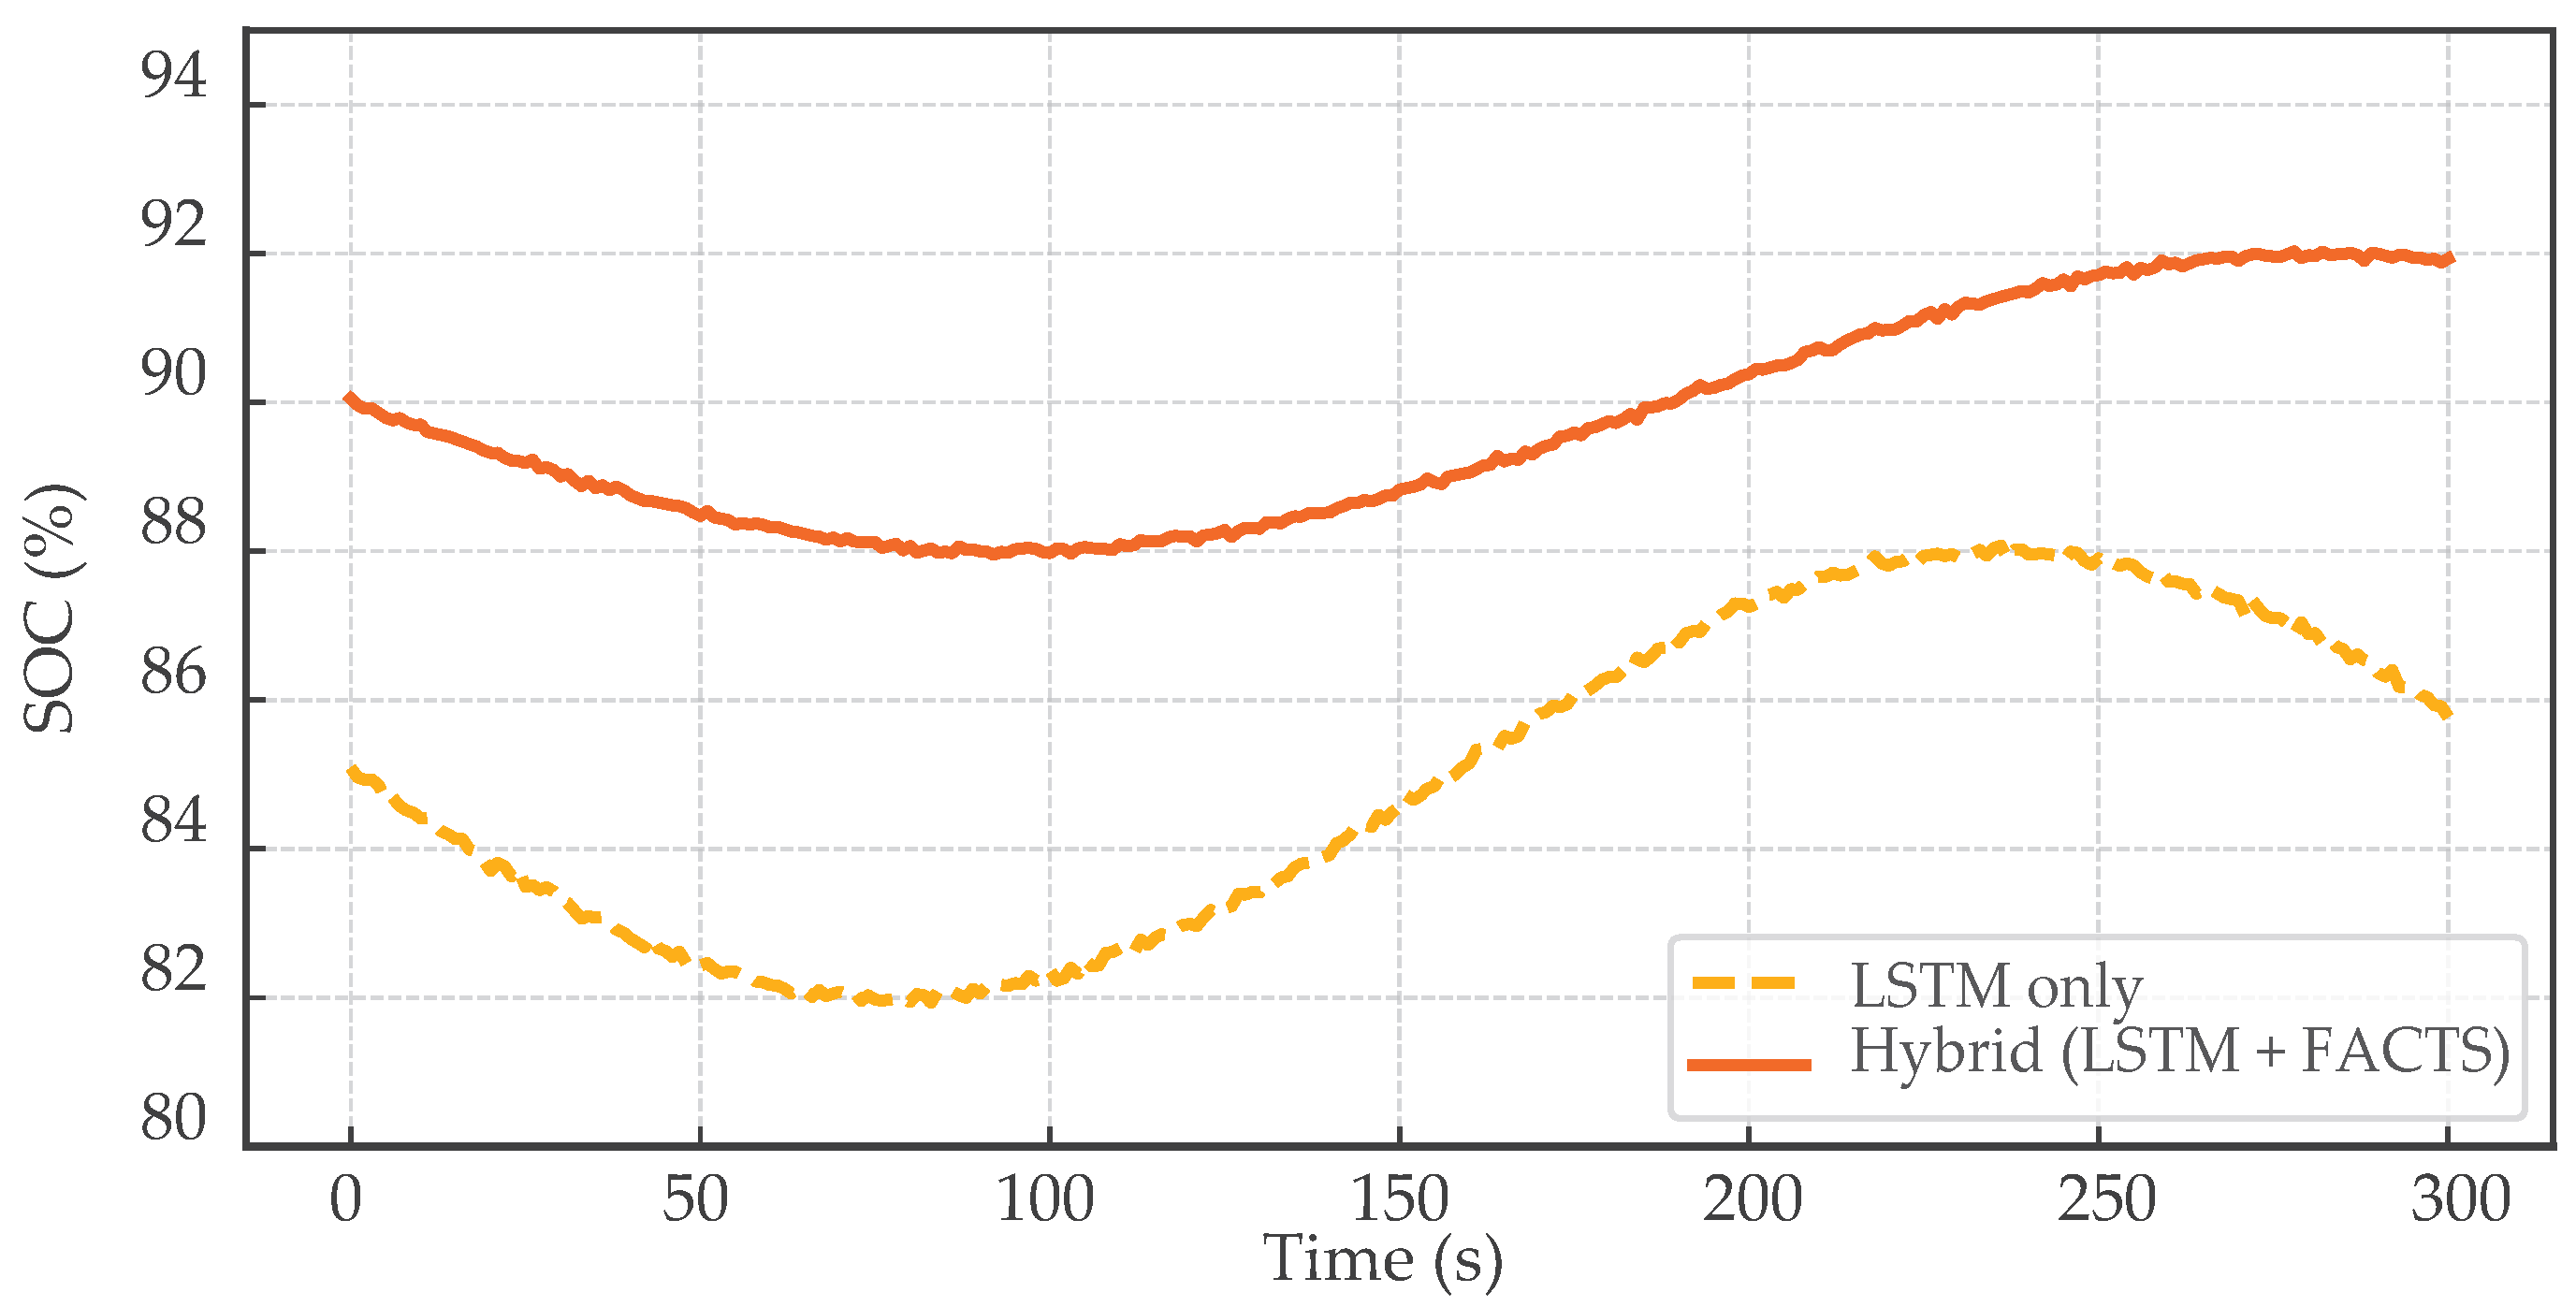
In addition to the performance indicators described earlier, this subsection analyzes the dynamic operational effort of the control components and the evolution of the battery’s SOC. These indicators help quantify how intensively the BESS and FACTS devices are used during contingency mitigation and frequency stabilization. Figure 7 illustrates the SOC trajectories under LSTM-only and Hybrid control strategies. As expected, the hybrid scheme leads to a more stable and elevated SOC profile, ranging between 88% and 92%, while the LSTM-only approach incurs deeper and more frequent discharges, reaching levels close to 82%.
To complement this, Table 5 presents the proportion of simulation time during which each control device was actively engaged. It can be observed that the FACTS-only strategy imposes the greatest demand on both the TCSC and SVC. In contrast, the hybrid scheme balances the control effort across BESS and FACTS, enabling a more efficient and coordinated response.

3.7. Sensitivity Analysis

To evaluate the robustness of the proposed control strategies under varying system conditions, a sensitivity analysis was conducted. Four critical parameters were selected based on their direct impact on dynamic response and control stability:
(i)
Rated BESS capacity E rated ,
(ii)
Prediction latency of the LSTM model Δ t LSTM ,
(iii)
EVCS penetration ratio Φ EVCS ,
(iv)
Weighting factors in the RRI.
Each parameter was varied within a realistic operational range while keeping all other variables constant. Table 6 summarizes the tested values.

3.7.1. Impact on Dynamic Indices

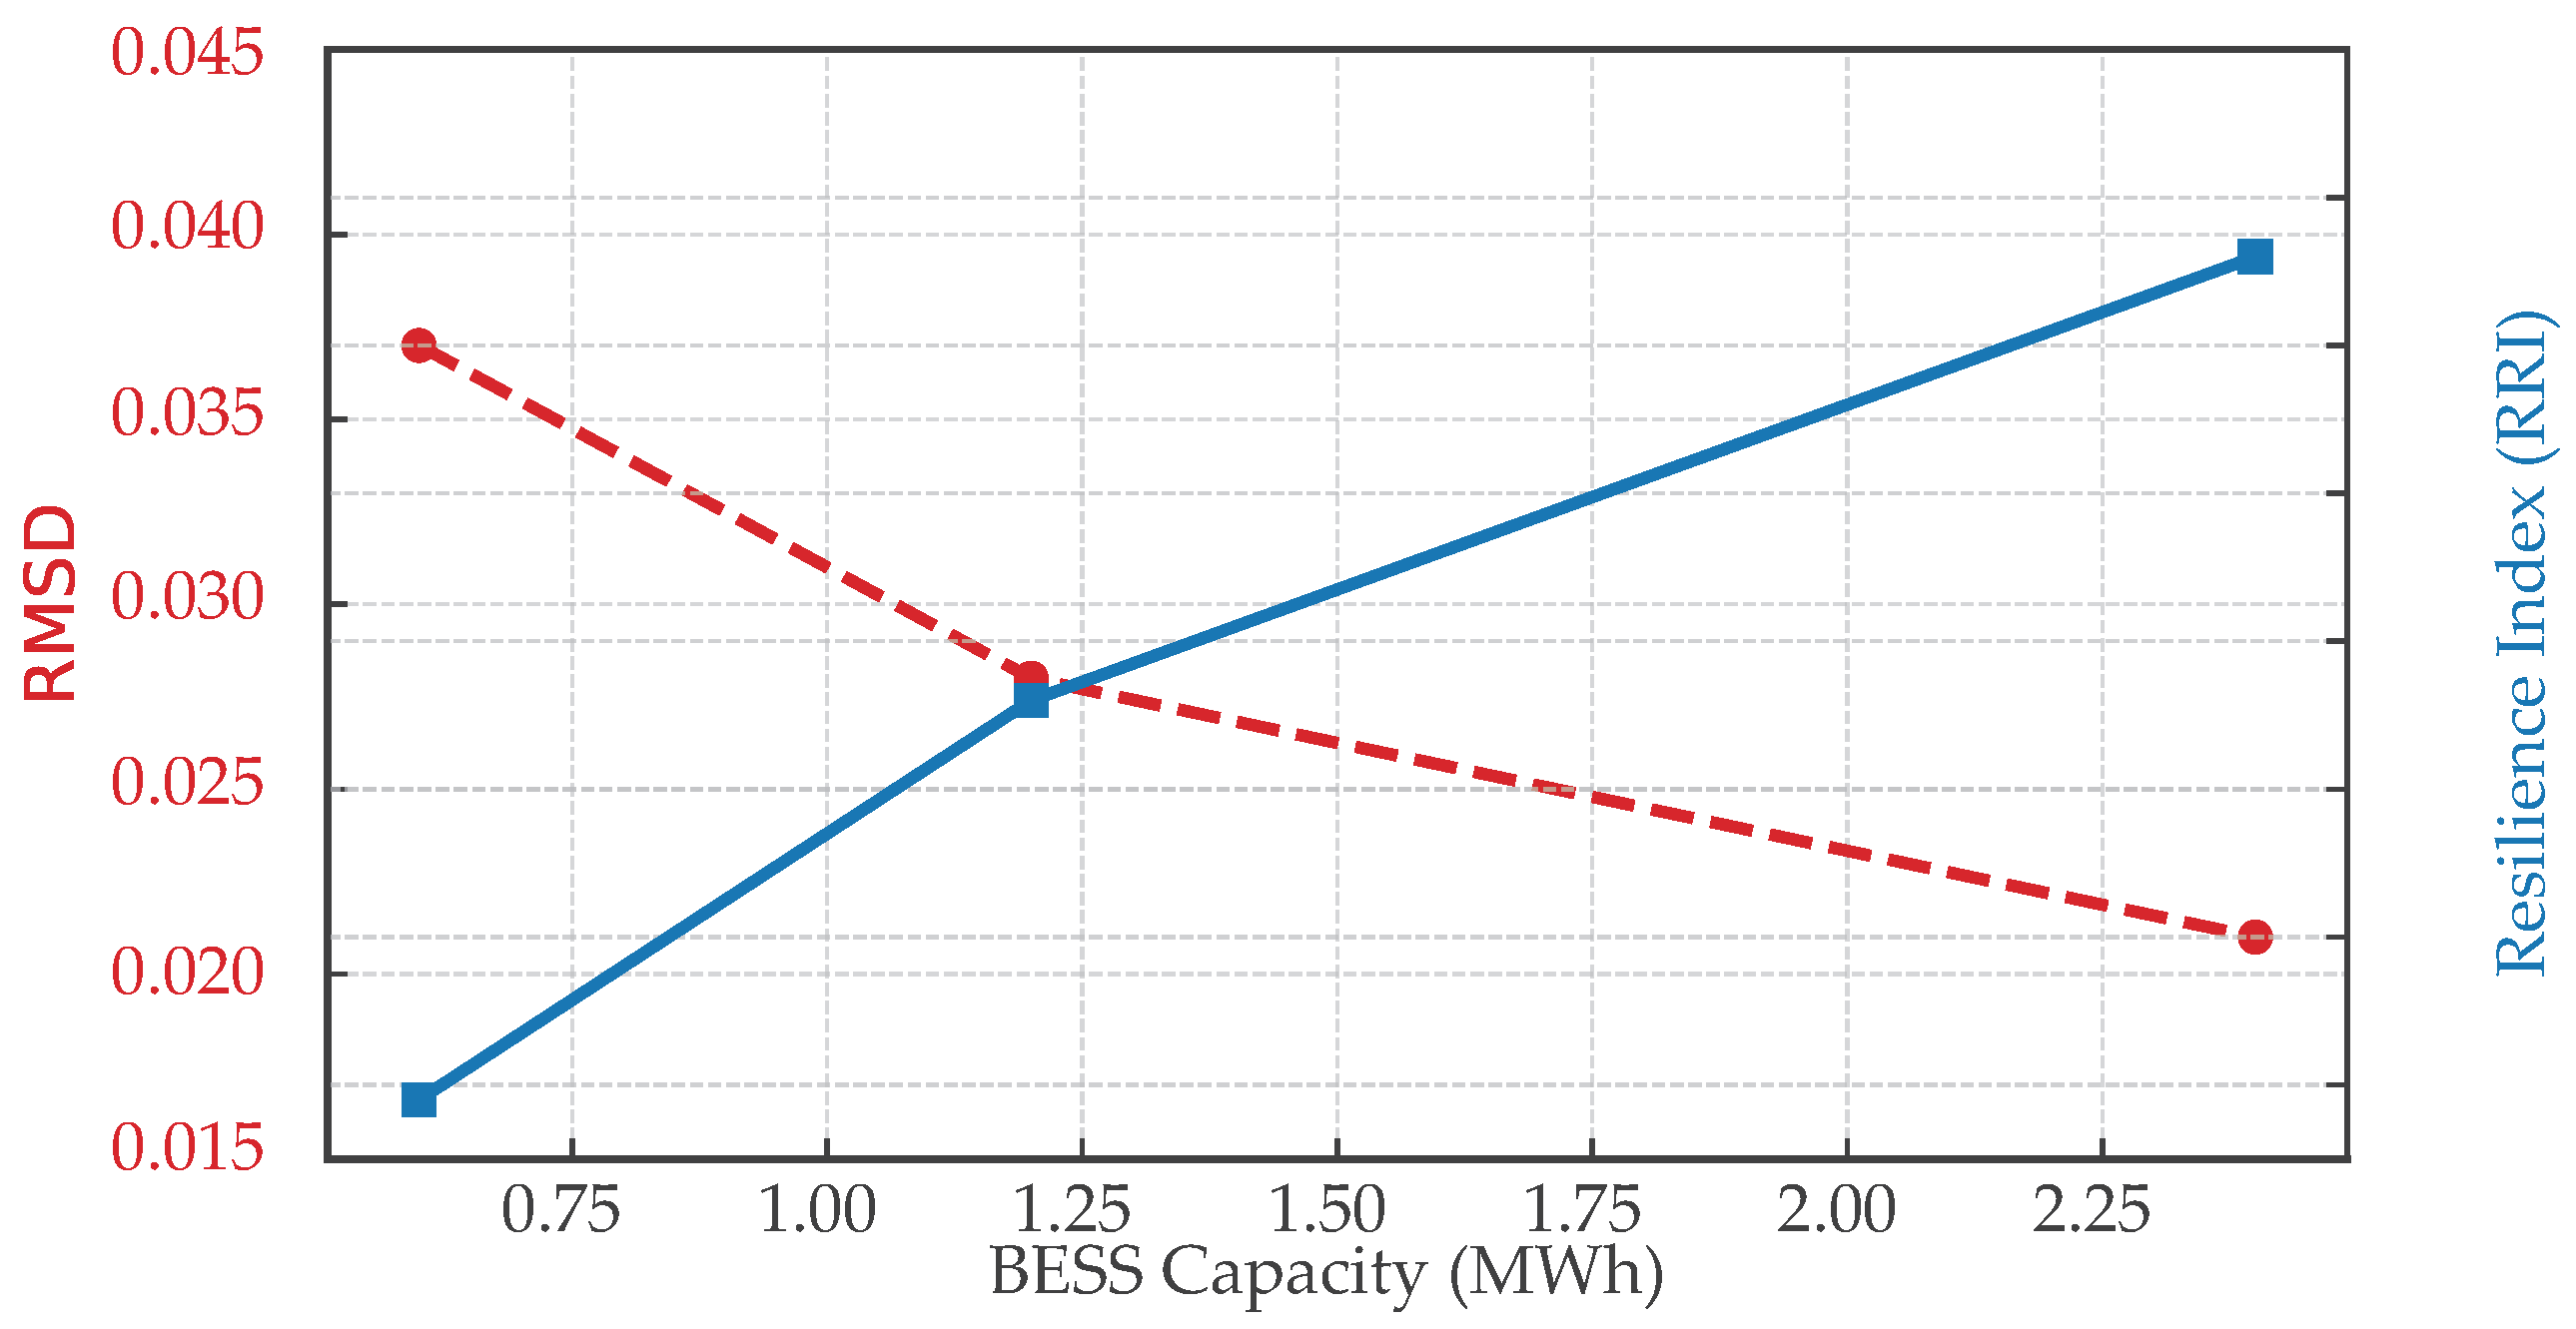
The variation in each parameter influenced key performance indicators such as RMSD, frequency deviation, and response time. Notably, increasing the BESS capacity led to improved stability and reduced overshoot, while higher LSTM latency resulted in delayed mitigation actions and lower RRI values. Figure 8 illustrates the evolution of RMSD and RRI as a function of BESS capacity.

3.7.2. EVCS Penetration

High penetration of EVCS has been reported to deteriorate voltage profiles and require adaptive protection schemes [36,37]. As shown in Table 7, increasing EVCS demand stress significantly reduced system efficiency and increased C-rate, particularly under the LSTM-only configuration. This highlights the importance of coordinated control strategies when facing high mobility loads. Other authors have explored similar scenarios using robust optimization and scenario-based modeling [38,39].

3.7.3. Sensitivity Response

To capture the joint influence of key system variables, a novel response surface was generated. Figure 9 shows the RRI in relation to BESS capacity ( E rated ) and prediction latency ( Δ t LSTM ), with surface color reflecting EVCS penetration ( Φ EVCS ). This analysis reveals that although larger storage capacity generally enhances RRI, its benefit is significantly reduced when prediction latency exceeds 150 ms or EVCS penetration reaches extreme values. The curvature of the surface illustrates the existence of nonlinear trade-offs, particularly in high-demand scenarios. These findings reinforce the need for co-optimization of storage sizing, control latency, and mobility load to preserve system resilience under realistic operating conditions.

4. Discussion

The simulation results presented in Section 3 demonstrate the comparative advantages of the proposed hybrid control strategy that integrates LSTM-based frequency prediction with FACTS-based dynamic compensation. This section synthesizes the findings, draws comparisons with related works, and outlines the practical implications of the system’s behavior under varying conditions.

4.1. Interpretation of Quantitative Results

The hybrid strategy outperformed all other control configurations across all performance indices. It achieved the lowest RMSD (0.021 Hz), the fastest settling time ( t s = 1.72 s), and the highest VDI, indicating rapid and coordinated voltage recovery. These outcomes validate the synergy between predictive and reactive components in stabilizing power system transients. Notably, the RRI value of 3.46 confirms that hybrid control achieves a high overall resilience, balancing response speed and stability margins.
The complementary metrics provided in Section 3.5 further reinforce this superiority. The LSTM-only configuration already achieved 91.4% round-trip efficiency and moderate C-rate (0.47 h−1), but the hybrid approach improved these to 93.2% and 0.38 h−1, respectively. Furthermore, the activation time of the LSTM controller was reduced to 0.12 s, enabling near-instantaneous mitigation.

4.2. Operational Effort and Control Coordination

Analysis of SOC evolution and device usage (Section 3.6) reveals that the hybrid controller distributes control effort effectively across BESS and FACTS devices. Unlike the FACTS-only strategy, which demands sustained high activity from both TCSC (74.2%) and SVC (88.5%), the hybrid strategy reduced their load to 55.6% and 67.1%, respectively, while leveraging the BESS with 92.6% efficiency. This distribution improves reliability and reduces thermal stress on power electronic components.

4.3. Robustness and Sensitivity to System Parameters

Sensitivity analysis (Section 3.7) confirmed that system performance scales well with increasing BESS capacity, with RMSD decreasing and RRI improving proportionally. In contrast, increased LSTM prediction latency or excessive EVCS penetration degrades performance. For example, a 150% EVCS load raised the C-rate to 0.49 h−1, reducing efficiency to 89.6% and RRI to 2.91. This supports the need for proactive tuning of controller parameters based on real-world EV integration forecasts.

4.4. Comparison with Related Work

This dual-layer coordination between predictive and reactive control is aligned with trends explored in multi-objective optimization for microgrids [40,41,42]. The achieved performance surpasses other recent works involving FACTS-based damping or data-driven predictive control. For instance, in [8], the use of a pure neural predictive scheme achieved an RMSD of 0.028 Hz but lacked voltage recovery coordination. Similarly, in [10], FACTS-only schemes improved voltage profiles but showed slower frequency response (settling times > 4 s). The proposed hybrid approach thus fills a gap in the literature by integrating accurate short-term forecasting with real-time hardware-based control, yielding both speed and robustness. Additionally, studies such as [43,44] highlight the trade-offs between control latency and accuracy in data-driven control, an aspect the hybrid method explicitly addresses. From a broader perspective, incorporating anticipatory control schemes alongside flexible devices is gaining traction in resilience studies, particularly in low-inertia and high-mobility environments [16,17,45].

4.5. Implications for Microgrid Resilience

From a practical standpoint, the hybrid control scheme offers a scalable solution for enhancing the dynamic resilience of modern microgrids, especially in contexts with high penetration of electric mobility and renewable sources. Its ability to stabilize frequency and voltage, minimize energy losses, and balance control effort across devices supports its deployment in real-world scenarios. However, the system’s effectiveness depends on proper latency management and adequate storage capacity, which must be carefully sized according to local demand and mobility patterns. Furthermore, recent works emphasize the role of forecast-enhanced control in improving energy resilience, particularly when integrated with market-aware dispatch or SCADA-based decision systems [33,46,47,48].

4.6. Sizing Framework for BESS and FACTS (Practical Guidance)

For real-world deployment, we outline a practical sizing framework that leverages the metrics and response surfaces already reported in this study. The decision variables are the BESS and the reactive power capability of FACTS. The objectives are to satisfy operating constraints on voltage and frequency quality (e.g., a target range for VDI, RMSDf, Δ f max , and settling time) across an ensemble of scenarios, and minimize the total capacity procured subject to those constraints. The scenario set mirrors the Section 3 and combines representative solar day types with multiple EVCS-arrival seeds at each penetration level. For each ( BESS , FACTS ) pair, the controller is evaluated over the scenario ensemble and summarized by the median and dispersion of the indices; feasible designs meet all quality thresholds across scenarios, and among them the recommended design is the smallest pair on the empirical Pareto set, preferably at a “knee” point beyond which additional capacity yields diminishing returns. This procedure is directly supported by the discrete benchmarks and the denser sweeps used for the response surfaces in the Results (see sensitivity tables and surfaces), and it requires no changes to the simulation setup.

4.7. Operational Extremes and Rare-Event Scenarios

While the proposed strategy is robust under the tested variability, certain low-probability, high-impact conditions may require adjustments. Examples include simultaneous component outages coincident with peak EVCS demand, prolonged low-irradiance ramps combined with communication delays that exceed the assumed LSTM latency, or FACTS saturation during fault-induced voltage sags. In such cases, recommended mitigations are to maintain a conservative SOC reserve window in BESS for ride-through, enforce temporary EVCS throttling or deferral, and fall back to local droop/reactive support when the forecaster’s latency or validity is compromised. These practices can be incorporated into the sizing framework by reserving headroom (both energy and reactive capability) and by verifying N–1 feasibility on the same scenario ensemble used for the nominal design.

5. Conclusions

This study assessed a hybrid strategy that couples short-horizon forecasting with coordinated reactive power support for distribution-level microgrids with electric vehicle charging. Under identical inputs and model settings, the hybrid controller consistently outperformed baseline, FACTS-only, and predictor-only configurations: the frequency RMSD dropped from 0.189 Hz (baseline) to 0.044 Hz, the maximum frequency deviation was limited to 0.18 Hz, the settling time decreased from 3.1 s to 0.6 s, and the voltage deviation index fell from 0.042 to 0.014. These like-for-like improvements demonstrate materially smoother transients and faster recovery with the coordinated use of storage dispatch and reactive support.
Robustness trends were corroborated by sensitivity analyses. Increasing BESS capacity generally enhanced the resilience index but with diminishing returns; conversely, performance degraded when the prediction latency exceeded approximately 150 ms or when EVCS penetration reached the highest stress levels. For instance, the resilience index decreased from 3.72 at 50% EVCS penetration to 2.91 at 150%, underscoring the value of coordinated control under mobility-driven variability.
This evidence is preliminary and bounded by the simulation scope. The feeder model and device representations are simplified; measurement noise, protection interactions, harmonic effects, and communications beyond the assumed latency were not exhaustively treated; and the forecaster was trained within the test-system envelope. Future work will validate the scheme with hardware-in-the-loop and field trials, broaden datasets and feeder typologies with multi-day ensembles, and integrate explicit techno–economic objectives for joint BESS/FACTS sizing and for benchmarking against advanced adaptive controllers under identical constraints.

Author Contributions

Conceptualization, F.G. and P.A.-C.; methodology, D.O.-C. and D.Z.; software, E.A. and A.M.; validation, D.B., D.Z. and A.R.; formal analysis, D.Z.; investigation, F.G. and A.M.; resources, P.A.-C.; data curation, D.Z. and A.R.; writing—original draft preparation, F.G. and A.M.; writing—review and editing, P.A.-C. and A.R.; visualization, D.Z.; supervision, P.A.-C.; project administration, P.A.-C.; funding acquisition, P.A.-C. All authors have read and agreed to the published version of the manuscript.

Funding

This research received no external funding.

Institutional Review Board Statement

Not applicable.

Informed Consent Statement

Not applicable.

Data Availability Statement

The data and simulation code supporting the results of this study are available from the corresponding author upon reasonable request.

Acknowledgments

The authors thank the Dirección de Investigación y Desarrollo (DIDE) of the Universidad Técnica de Ambato, Ecuador, for supporting this work through the research project PFISEI36, titled “Development of Computational Tools for the Management and Optimization of Smart Microgrids.” The authors also thank the Universidad de Cuenca, Ecuador, for providing access to the facilities of the Microgrid Laboratory of the Faculty of Engineering, allowing the use of its equipment, and authorizing technical staff to support the experiments described in this article.

Conflicts of Interest

The authors declare no conflicts of interest.

Abbreviations

The following abbreviations are used in this manuscript:
BESSBattery Energy Storage System
LSTMLong Short-Term Memory
FACTSFlexible AC Transmission Systems
RRIResilience Response Index
SOCState of Charge
TCSCThyristor-Controlled Series Capacitor
SVCStatic Var Compensator
EVCSElectric Vehicle Charging Station
VDIVoltage Deviation Index
SCADASupervisory Control and Data Acquisition
RMSDRoot Mean Square Deviation

References

  1. Bera, P.K.; Kumar, V.; Pani, S.R.; Malik, O.P. Autoregressive Coefficients Based Intelligent Protection of Transmission Lines Connected to Type-3 Wind Farms. IEEE Trans. Power Deliv. 2024, 39, 71–82. [Google Scholar] [CrossRef]
  2. Dekaraja, B.; Saikia, L.C.; Ramoji, S.K. Performance Amelioration of Concerted Voltage-Frequency Regulation of Multiarea Hybrid Power Systems under Restructured Pattern Using Electric Vehicles and Interline Power Flow Controller. Energy Storage 2023, 5, e457. [Google Scholar] [CrossRef]
  3. Banerjee, D.; Roy, P.K.; Panda, G.K. A Novel Ameliorated Moth Swarm Algorithm for Optimization of Hybrid Power System Incorporating FACTS Controllers. IETE J. Res. 2024, 70, 4640–4673. [Google Scholar] [CrossRef]
  4. Carlak, H.F.; Kayar, E. Volt/VAr Regulation of the West Mediterranean Regional Electrical Grids Using SVC/STATCOM Devices With Neural Network Algorithms. Wind Energy 2025, 28, e2976. [Google Scholar] [CrossRef]
  5. Aggarwal, S.; Singh, A.K. Assessing Performance of EV Charging Station with Siting of DERs and FACTS Devices under Deregulated Environment. Electr. Eng. 2023, 105, 4119–4137. [Google Scholar] [CrossRef]
  6. Adetunji, K.E.; Hofsajer, I.W.; Abu-Mahfouz, A.M.; Cheng, L. A Novel Dynamic Planning Mechanism for Allocating Electric Vehicle Charging Stations Considering Distributed Generation and Electronic Units. Energy Rep. 2022, 8, 14658–14672. [Google Scholar] [CrossRef]
  7. Dilshad, S.; Abas, N.; Farooq, H.; Kalair, A.R.; Memon, A.A. NeuroFuzzy Wavelet Based Auxiliary Damping Controls for STATCOM. IEEE Access 2020, 8, 200367–200382. [Google Scholar] [CrossRef]
  8. Bonavolontà, F.; Di Palma, P.; Liccardo, A.; Mottola, F.; Villacci, D. Measurement-Driven Load Change Compensation for Robust Secondary Voltage Regulation. Acta IMEKO 2024, 13, 10. [Google Scholar] [CrossRef]
  9. Badar, R.; Khan, L. Legendre Wavelet Embedded NeuroFuzzy Algorithms for Multiple FACTS. Int. J. Electr. Power Energy Syst. 2016, 80, 81–90. [Google Scholar] [CrossRef]
  10. Badar, R.; Khan, L. Coordinated Adaptive Control of Multiple Flexible AC Transmission Systems Using Multiple-Input-Multiple-Output Neuro-Fuzzy Damping Control Paradigms. Electr. Power Components Syst. 2014, 42, 818–830. [Google Scholar] [CrossRef]
  11. Dheeban, S.S.; Selvan, N.B.M. ANFIS-Based Power Quality Improvement by Photovoltaic Integrated UPQC at Distribution System. IETE J. Res. 2023, 69, 2353–2371. [Google Scholar] [CrossRef]
  12. Aref, M.; Abdelaziz, A.Y.; Geem, Z.W.; Hong, J.H.; Abo-Elyousr, F.K. Oscillation Damping Neuro-Based Controllers Augmented Solar Energy Penetration Management of Power System Stability. Energies 2023, 16, 2391. [Google Scholar] [CrossRef]
  13. Falehi, A.D.; Mosallanejad, A. Neoteric HANFISC-SSSC Based on MOPSO Technique Aimed at Oscillation Suppression of Interconnected Multi-Source Power Systems. IET Gener. Transm. Distrib. 2016, 10, 1728–1740. [Google Scholar] [CrossRef]
  14. Huang, Z.Y.; Krishnaswami, H.; Yuan, G.H.; Huang, R.K. Ubiquitous Power Electronics in Future Power Systems: Recommendations to Fully Utilize Fast Control Capabilities. IEEE Electrif. Mag. 2020, 8, 18–27. [Google Scholar] [CrossRef]
  15. Srividhya, J.P.; Prabha, K.E.L.; Jaisiva, S.; Rajan, C.S.G. Power Quality Enhancement in Smart Microgrid System Using Convolutional Neural Network Integrated with Interline Power Flow Controller. Electr. Eng. 2024, 106, 6773–6796. [Google Scholar] [CrossRef]
  16. Fathollahi, A. Intelligent Control Framework for Improving Energy System Stability Through Deep Learning-Based Modal Optimization Scheme. Sustainability 2024, 16, 9392. [Google Scholar] [CrossRef]
  17. Farooq, Z.; Rahman, A.; Lone, S.A. Frequency Stabilization of Hybrid Power System Using Robust Secondary Controller. Optim. Control Appl. Methods 2023, 44, 3306–3326. [Google Scholar] [CrossRef]
  18. Shukla, H.; Raju, M. Combined Frequency and Voltage Regulation in an Interconnected Power System Using Fractional Order Cascade Controller Considering Renewable Energy Sources, Electric Vehicles and Ultra Capacitor. J. Energy Storage 2024, 84, 110875. [Google Scholar] [CrossRef]
  19. Peddakapu, K.; Mohamed, M.R.; Srinivasarao, P.; Leung, P.K. Simultaneous Controllers for Stabilizing the Frequency Changes in Deregulated Power System Using Moth Flame Optimization. Sustain. Energy Technol. Assess. 2022, 51, 101916. [Google Scholar] [CrossRef]
  20. Peddakapu, K.; Srinivasarao, P.; Mohamed, M.R.; Arya, Y.; Kishore, D.J.K. Stabilization of Frequency in Multi-Microgrid System Using Barnacle Mating Optimizer-Based Cascade Controllers. Sustain. Energy Technol. Assess. 2022, 54, 102823. [Google Scholar] [CrossRef]
  21. Safiullah, S.; Rahman, A.; Lone, S.A. Optimal Control of Electrical Vehicle Incorporated Hybrid Power System with Second Order Fractional-Active Disturbance Rejection Controller. Optim. Control Appl. Methods 2023, 44, 905–934. [Google Scholar] [CrossRef]
  22. Nikoobakht, A.; Aghaei, J.; Mokarram, M.J.; Shafie-khah, M.; Catalao, J.P.S. Adaptive Robust Co-Optimization of Wind Energy Generation, Electric Vehicle Batteries and Flexible AC Transmission System Devices. Energy 2021, 230, 120781. [Google Scholar] [CrossRef]
  23. Terriche, Y.; Su, C.L.; Lashab, A.; Mutarraf, M.U.; Mehrzadi, M.; Guerrero, J.M.; Vasquez, J.C. Design of Cost-Effective Compensators to Enhance Voltage Stability and Harmonics Contamination of High-Power More Electric Marine Vessels. IEEE Trans. Ind. Appl. 2021, 57, 4130–4142. [Google Scholar] [CrossRef]
  24. Sahoo, G.K.; Choudhury, S.; Rathore, R.S.; Bajaj, M.; Dutta, A.K. Scaled Conjugate-Artificial Neural Network-Based Novel Framework for Enhancing the Power Quality of Grid-Tied Microgrid Systems. Alex. Eng. J. 2023, 80, 520–541. [Google Scholar] [CrossRef]
  25. Blasi, T.M.; Fernandes, T.S.P.; Aoki, A.R.; Tabarro, F.H. Multiperiod Optimum Power Flow for Active Distribution Networks with Provisioning of Ancillary Services. IEEE Access 2021, 9, 110371–110395. [Google Scholar] [CrossRef]
  26. García-Torres, F.; Zafra-Cabeza, A.; Silva, C.; Grieu, S.; Darure, T.; Estanqueiro, A. Model Predictive Control for Microgrid Functionalities: Review and Future Challenges. Energies 2021, 14, 1296. [Google Scholar] [CrossRef]
  27. Schwenzer, M.; Ay, M.; Bergs, T.; Abel, D. Review on Model Predictive Control: An Engineering Perspective. Int. J. Adv. Manuf. Technol. 2021, 117, 1327–1349. [Google Scholar] [CrossRef]
  28. Tarafdar Hagh, M.; Jabbary Borhany, M.A.; Taghizad-Tavana, K.; Zare Oskouei, M. A Comprehensive Review of Flexible Alternating Current Transmission System (FACTS): Topologies, Applications, Optimal Placement, and Innovative Models. Heliyon 2025, 11, e41001. [Google Scholar] [CrossRef]
  29. Pandžić, F.; Capuder, T. Advances in Short-Term Solar Forecasting: A Review and Benchmark of Machine Learning Methods and Relevant Data Sources. Energies 2024, 17, 97. [Google Scholar] [CrossRef]
  30. Peddakapu, K.; Mohamed, M.R.; Srinivasarao, P.; Arya, Y.; Leung, P.K.; Kishore, D.J.K. A State-of-the-Art Review on Modern and Future Developments of AGC/LFC of Conventional and Renewable Energy-Based Power Systems. Renew. Energy Focus 2022, 43, 146–171. [Google Scholar] [CrossRef]
  31. Ma, T.T.; Lo, K.L.; Tumay, M. A Robust UPFC Damping Control Scheme Using PI and ANN Based Adaptive Controllers. COMPEL—Int. J. Comput. Math. Electr. Electron. Eng. 2000, 19, 878–902. [Google Scholar] [CrossRef]
  32. Mudi, J.; Shiva, C.K.; Mukherjee, V. An Optimal Control of Integrated Hybrid Power System with FACTS Devices Using Student Psychology-Based Optimization Algorithm. Adv. Theory Simulations 2021, 4, 2100147. [Google Scholar] [CrossRef]
  33. Kumarar, P.; Ganapathy, S.; Manikandan, M. Voltage Stability Analysis for Grid Connected PV System Using Optimized Control on IoT Based ANFIS. Prz. Elektrotech. 2024, 100, 259–266. [Google Scholar] [CrossRef]
  34. Gandhar, S.; Ohri, J.; Singh, M. A Mathematical Framework of ANFIS Tuned UPQC Controlled RES Based Isolated Microgrid System. J. Interdiscip. Math. 2022, 25, 1467–1477. [Google Scholar] [CrossRef]
  35. Ma, T.T. Multiple UPFC Damping Control Scheme Using ANN Coordinated Adaptive Controllers. Asian J. Control 2009, 11, 489–502. [Google Scholar] [CrossRef]
  36. Radhakrishnan, G.; Gopalakrishnan, V.; Anithakumar, P.S. Stability Improvement of a Grid Connected Offshore Wind Farm System Using ANN Based IPFC. J. Vib. Eng. Technol. 2017, 5, 137–143. [Google Scholar]
  37. Devarapalli, R.; Sinha, N.K.; Márquez, F.P.G. A Review on the Computational Methods of Power System Stabilizer for Damping Power Network Oscillations. Arch. Comput. Methods Eng. 2022, 29, 3713–3739. [Google Scholar] [CrossRef]
  38. Shojaei, A.A.; Othman, M.F.; Samadi, M. Application of a Nonlinear Controller Based on Recurrent Neural Network for Coordinated of PSS and ASMES. In Proceedings of the 2015 15th International Conference on Control, Automation and Systems (ICCAS), Busan, Republic of Korea, 13–16 October 2015; pp. 153–157. [Google Scholar]
  39. Ganjefar, S.; Farahani, M. Damping of Subsynchronous Resonance Using Self-Tuning PID and Wavelet Neural Network. COMPEL—Int. J. Comput. Math. Electr. Electron. Eng. 2012, 31, 1259–1276. [Google Scholar] [CrossRef]
  40. Polisetty, V.K.; Jetti, S.R.; Venayagamoorthy, G.K.; Harley, R.G. Intelligent Integration of a Wind Farm to an Utility Power Network with Improved Voltage Stability. In Proceedings of the Conference Record of the 2006 IEEE Industry Applications Conference, Forty-First IAS Annual Meeting, Tampa, FL, USA, 8–12 October 2006; Volume 1–5, pp. 1128–1133. [Google Scholar]
  41. Saleem, B.; Badar, R.; Judge, M.A.; Manzoor, A.; ul Islam, S.; Rodrigues, J.J.P.C. Adaptive Recurrent NeuroFuzzy Control for Power System Stability in Smart Cities. Sustain. Energy Technol. Assessments 2021, 45, 101089. [Google Scholar] [CrossRef]
  42. Miao, X.G.; Zhang, B.H.; Li, Z.C.; Wu, J.L.; Mao, C.X.; Li, X.P.; Sun, J.B.; Li, M.; Li, D.H. Coordinative Optimal Design for PSS and Auxiliary Damping Controller on SVC under Multi-Operating Conditions. Adv. Mater. Res. 2013, 732, 823–829. [Google Scholar] [CrossRef]
  43. Paital, S.R.; Ray, P.K.; Mohanty, A. Comprehensive Review on Enhancement of Stability in Multimachine Power System with Conventional and Distributed Generations. IET Renew. Power Gener. 2018, 12, 1854–1863. [Google Scholar] [CrossRef]
  44. Sharma, R.; Makwana, V.H. Enhanced Modular Multi-Level Converter-Based Static Synchronous Compensator with Social Ski-Driver Optimized Adaptive Neuro-Fuzzy Inference System Controller for Power Quality Enhancement. Electr. Eng. 2024, 106, 825–845. [Google Scholar] [CrossRef]
  45. Rana, M.J.; Shahriar, M.S.; Shafiullah, M. Levenberg-Marquardt Neural Network to Estimate UPFC-Coordinated PSS Parameters to Enhance Power System Stability. Neural Comput. Appl. 2019, 31, 1237–1248. [Google Scholar] [CrossRef]
  46. Silva, H.G.; Coelho, A.L.M.; Faria, I.P.; Araujo, B.G. ANN Based Impedance Trajectory Detection Approach for Loss of Excitation Protection of Synchronous Generators Connected to Transmission Lines with SVCs. Electr. Power Syst. Res. 2022, 213, 108766. [Google Scholar] [CrossRef]
  47. Rahmkhoda, E.; Faiz, J.; Abedini, M. Detecting Loss of Excitation Condition of Synchronous Generator in the Presence of Unified Power Flow Controller Based on Data Mining Method. Electr. Power Syst. Res. 2024, 228, 109975. [Google Scholar] [CrossRef]
  48. Kumar, S.; Dahiya, A.K. Enhancing Multi-Machine Power System Stability with STATCOM-SMES: A Soft Computing Approach. Comput. Electr. Eng. 2024, 120, 109878. [Google Scholar] [CrossRef]
Figure 1. Overview of the proposed hybrid frequency regulation framework, integrating predictive modeling, real-time actuation, and performance evaluation.
Technologies 13 00402 g001
Figure 2. Single-line diagram of the hybrid microgrid with PV, BESS, EVCS loads, and FACTS devices. The system operates at low-voltage AC and connects to the external grid via a step-up transformer. A contingency occurs at the left-side EVCS at t 0 = 10 s .
Technologies 13 00402 g002
Figure 3. Training performance of the LSTM network for frequency prediction: RMSE, Accuracy, and Loss over 50 epochs.
Technologies 13 00402 g003
Figure 4. Training evolution of the LSTM network for voltage prediction: RMSE, Accuracy, and Loss over 50 epochs.
Technologies 13 00402 g004
Figure 5. Frequency response under different control strategies: Baseline (no control), FACTS only, LSTM only, and Hybrid (LSTM + FACTS).
Technologies 13 00402 g005
Figure 6. Voltage response at the PCC under different control strategies: Baseline (no control), FACTS only, LSTM only, and Hybrid (LSTM + FACTS).
Technologies 13 00402 g006
Figure 7. Evolution of the BESS SOC under two control strategies.
Technologies 13 00402 g007
Figure 8. Impact of BESS capacity variation on dynamic RMSD and resilience index.
Technologies 13 00402 g008
Figure 9. Three-dimensional response surface of the RRI as a function of BESS capacity ( E rated ) and prediction latency ( Δ t LSTM ). The color scale represents EVCS penetration ( Φ EVCS ).
Technologies 13 00402 g009
Table 1. Comparative review of related literature and positioning of this work.
StudyEVCSFACTSBESSPredictiveFuzzy/AIDigital TwinMain Limitation
[6]Planning-focused; lacks FACTS coordination
[5]Forecasting-only; no actuation
[12]No BESS or grid-level coordination
[10]Does not address EVCS integration or uncertainty
[9]Static FACTS deployment; no adaptive control
[3]Neural optimization without FACTS or BESS
[1]IoT-based EV coordination only; lacks grid-layer integration
[25]V2G capabilities but lacks predictive optimization
[8]Digital twin simulations; no real-time control
[2]Forecasting of DERs only; no actuation mechanisms
[22]FACTS planning without DER integration
This WorkSimulation-based coordination of EV charging, storage, and FACTS devices using short-term forecasting; no physical implementation, fuzzy logic, or digital twin integration.
Table 2. Optimized configuration and hyperparameters of the LSTM network used for frequency prediction.
ParameterValue
Input Features6 (including EV demand, power flow, previous frequency)
Time Steps per Sample8
Prediction Horizon0.8 s
Number of LSTM Layers2
Hidden Units per Layer64
Dropout Rate0.1
OptimizerAdam
Learning Rate0.001
Batch Size32
Training Epochs50
Final RMSE (Training)0.026
Final Accuracy0.988
Hardware ResourceSingle GPU (RTX series)
Table 3. Quantitative comparison of control strategies based on key performance indices.
Control StrategyRMSDf (Hz) Δ f max (Hz) t s (s)VDI (p.u.)
Baseline (no control)0.1890.823.10.042
FACTS only0.1030.481.90.028
LSTM only0.0780.371.20.020
Hybrid (LSTM + FACTS)0.0440.180.60.014
Table 4. Complementary metrics for each control strategy.
Strategy η (%)C-Rate (1/h)Time (s)RRI
Baseline
FACTS only0.351.62
LSTM only91.40.470.182.51
Hybrid93.20.380.123.46
Table 5. Percentage of time each control device is active during simulation.
Control StrategyTCSC Usage (%)SVC Usage (%)BESS Usage (%)
Baseline (no control)0.00.00.0
FACTS only74.288.50.0
LSTM only0.00.078.4
Hybrid (LSTM + FACTS)55.667.192.6
Table 6. Parameter values used in sensitivity analysis.
ParameterValues Tested
BESS capacity E rated {0.6, 1.2, 2.4} MWh
LSTM latency Δ t LSTM {50, 100, 200} ms
EVCS penetration Φ EVCS {50%, 100%, 150%}
RRI weighting (VDI emphasis) α VDI { 0.2 , 0.5 , 0.8 }
Table 7. Sensitivity of operational metrics to EVCS penetration.
EVCS Penetration (%)C-Rate (1/h)BESS Efficiency (%)RRI
50%0.3194.23.72
100%0.3893.23.46
150%0.4989.62.91
Disclaimer/Publisher’s Note: The statements, opinions and data contained in all publications are solely those of the individual author(s) and contributor(s) and not of MDPI and/or the editor(s). MDPI and/or the editor(s) disclaim responsibility for any injury to people or property resulting from any ideas, methods, instructions or products referred to in the content.