Article

Localized Ultrasonic Cleaning for Injection Mold Cavities: A Scalable In Situ Process with Surface Quality Monitoring

by
Deviprasad Chalicheemalapalli Jayasankar
*,
Thomas Tröster
and
Thorsten Marten
Automotive Lightweight Design (LiA), Institute for Lightweight Design with Hybrid Systems (ILH), Paderborn University, Warburger Str. 100, 33098 Paderborn, Germany
*
Author to whom correspondence should be addressed.
Technologies 2025, 13(8), 354; https://doi.org/10.3390/technologies13080354
Submission received: 7 July 2025 / Revised: 31 July 2025 / Accepted: 7 August 2025 / Published: 11 August 2025
(This article belongs to the Section Manufacturing Technology)

Abstract

As global industries seek to reduce energy consumption and lower CO2 emissions, the need for sustainable, efficient maintenance processes in manufacturing has become increasingly important. Traditional mold cleaning methods often require complete tool disassembly, extended downtime, and heavy use of solvents, resulting in high energy costs and environmental impact. This study presents a novel localized ultrasonic cleaning process for injection molding tools that enables targeted, in situ cleaning of mold cavities without removing the tool from the press. A precisely positioned ultrasonic transducer delivers cleaning energy directly to contaminated areas, eliminating the need for complete mold removal. Multiple cleaning agents, including alkaline and organic acid solutions, were evaluated for their effectiveness in combination with ultrasonic excitation. Surface roughness measurements were used to assess cleaning performance over repeated contamination and cleaning cycles. Although initial tests were performed manually in the lab, results indicate that the method can be scaled up and automated effectively. This process offers a promising path toward energy-efficient, low-emission tool maintenance across a wide range of injection molding applications.

1. Introduction

The increasing demand for energy efficiency, material sustainability, and high-quality output in modern manufacturing has intensified the focus on production tool maintenance, particularly in the field of injection molding [1,2]. Mold tools are critical assets in mass-production sectors such as automotive, aerospace, consumer goods, and medical devices, where part quality and cycle time are tightly linked to mold condition. Over time, the repeated use of these tools leads to contamination from polymer residues, additives, mold release agents, and thermal degradation byproducts [3]. This buildup compromises the surface integrity and dimensional precision of molded parts, increases demolding forces, and accelerates tool wear [4,5]. Therefore, maintaining clean mold cavities is essential not only for ensuring part quality but also for extending tool life and supporting continuous production.
Cleaning techniques for injection molding tools have evolved over decades, yet many still rely on methods that interrupt production and carry significant operational or environmental trade-offs [6,7]. Manual cleaning is the most commonly employed method due to its low entry cost and flexibility. Operators typically use brushes or abrasives combined with solvent-based cleaners to remove surface contaminants. However, this method is labor-intensive, inconsistent in results, and often requires complete disassembly of the mold tool. The prolonged downtime associated with manual intervention significantly reduces production efficiency. To address these challenges, chemical cleaning methods using solvent-based or aqueous solutions have been developed to dissolve polymer residues and additives more consistently and with reduced reliance on manual labor [8]. Solvent-based agents are effective for a broad range of polymers including epoxies and thermoplastics, but they pose safety and environmental hazards [9]. Prolonged exposure to volatile organic compounds (VOCs) can endanger worker health, and strict regulations require controlled disposal and ventilation [10,11,12]. Aqueous-based cleaners are safer and environmentally preferred but typically require elevated temperatures and extended immersion times to achieve adequate performance, which limits their practicality for rapid, inline maintenance [13,14]. In contrast, thermal cleaning methods such as oven pyrolysis and induction heating apply high temperatures more directly and intensively to decompose organic buildup in shorter time frames, though they introduce their own set of challenges [15,16]. Although effective, these methods risk introducing thermal fatigue to the mold surface, leading to microcracks or surface oxidation. They also require dismounting and remounting of tools, which adds risk of alignment errors and process variability. Moreover, the energy input required for thermal cleaning is substantial, making it an undesirable option for frequent use [17,18].
Mechanical cleaning approaches like dry ice blasting, plastic media blasting, and bead blasting are non-chemical alternatives that aim to physically dislodge contaminants. Dry ice blasting is valued for its non-abrasive nature and minimal residue. However, it lacks effectiveness against stubborn, chemically bonded residues and may struggle with fine features or deep cavities [19,20,21]. More aggressive media like glass beads can clean more thoroughly but introduce the risk of surface erosion, requiring post-treatment polishing. Among non-contact techniques, ultrasonic cleaning offers a powerful alternative due to its ability to penetrate complex geometries [22,23,24]. It relies on the generation of high-frequency acoustic waves in a fluid medium, creating cavitation microbubbles that collapse near the tool surface [25]. These collapses generate localized high-pressure jets capable of dislodging contaminants without mechanical abrasion. Traditional ultrasonic cleaning, however, demands that the mold tool be fully immersed in a bath, which again necessitates tool removal and disassembly [26]. This limits its utility for inline or high-frequency cleaning applications. Across all conventional approaches, the core limitation remains the interruption of production. Taking a mold tool offline for cleaning introduces production losses, labor requirements, and requalification delays. Furthermore, the frequent handling and reassembly of precision molds increase the likelihood of surface damage, wear, and human error. There is a growing industrial demand for a solution that minimizes manual labor, reduces solvent and energy usage, maintains surface quality, and integrates directly into the production line without requiring tool removal.
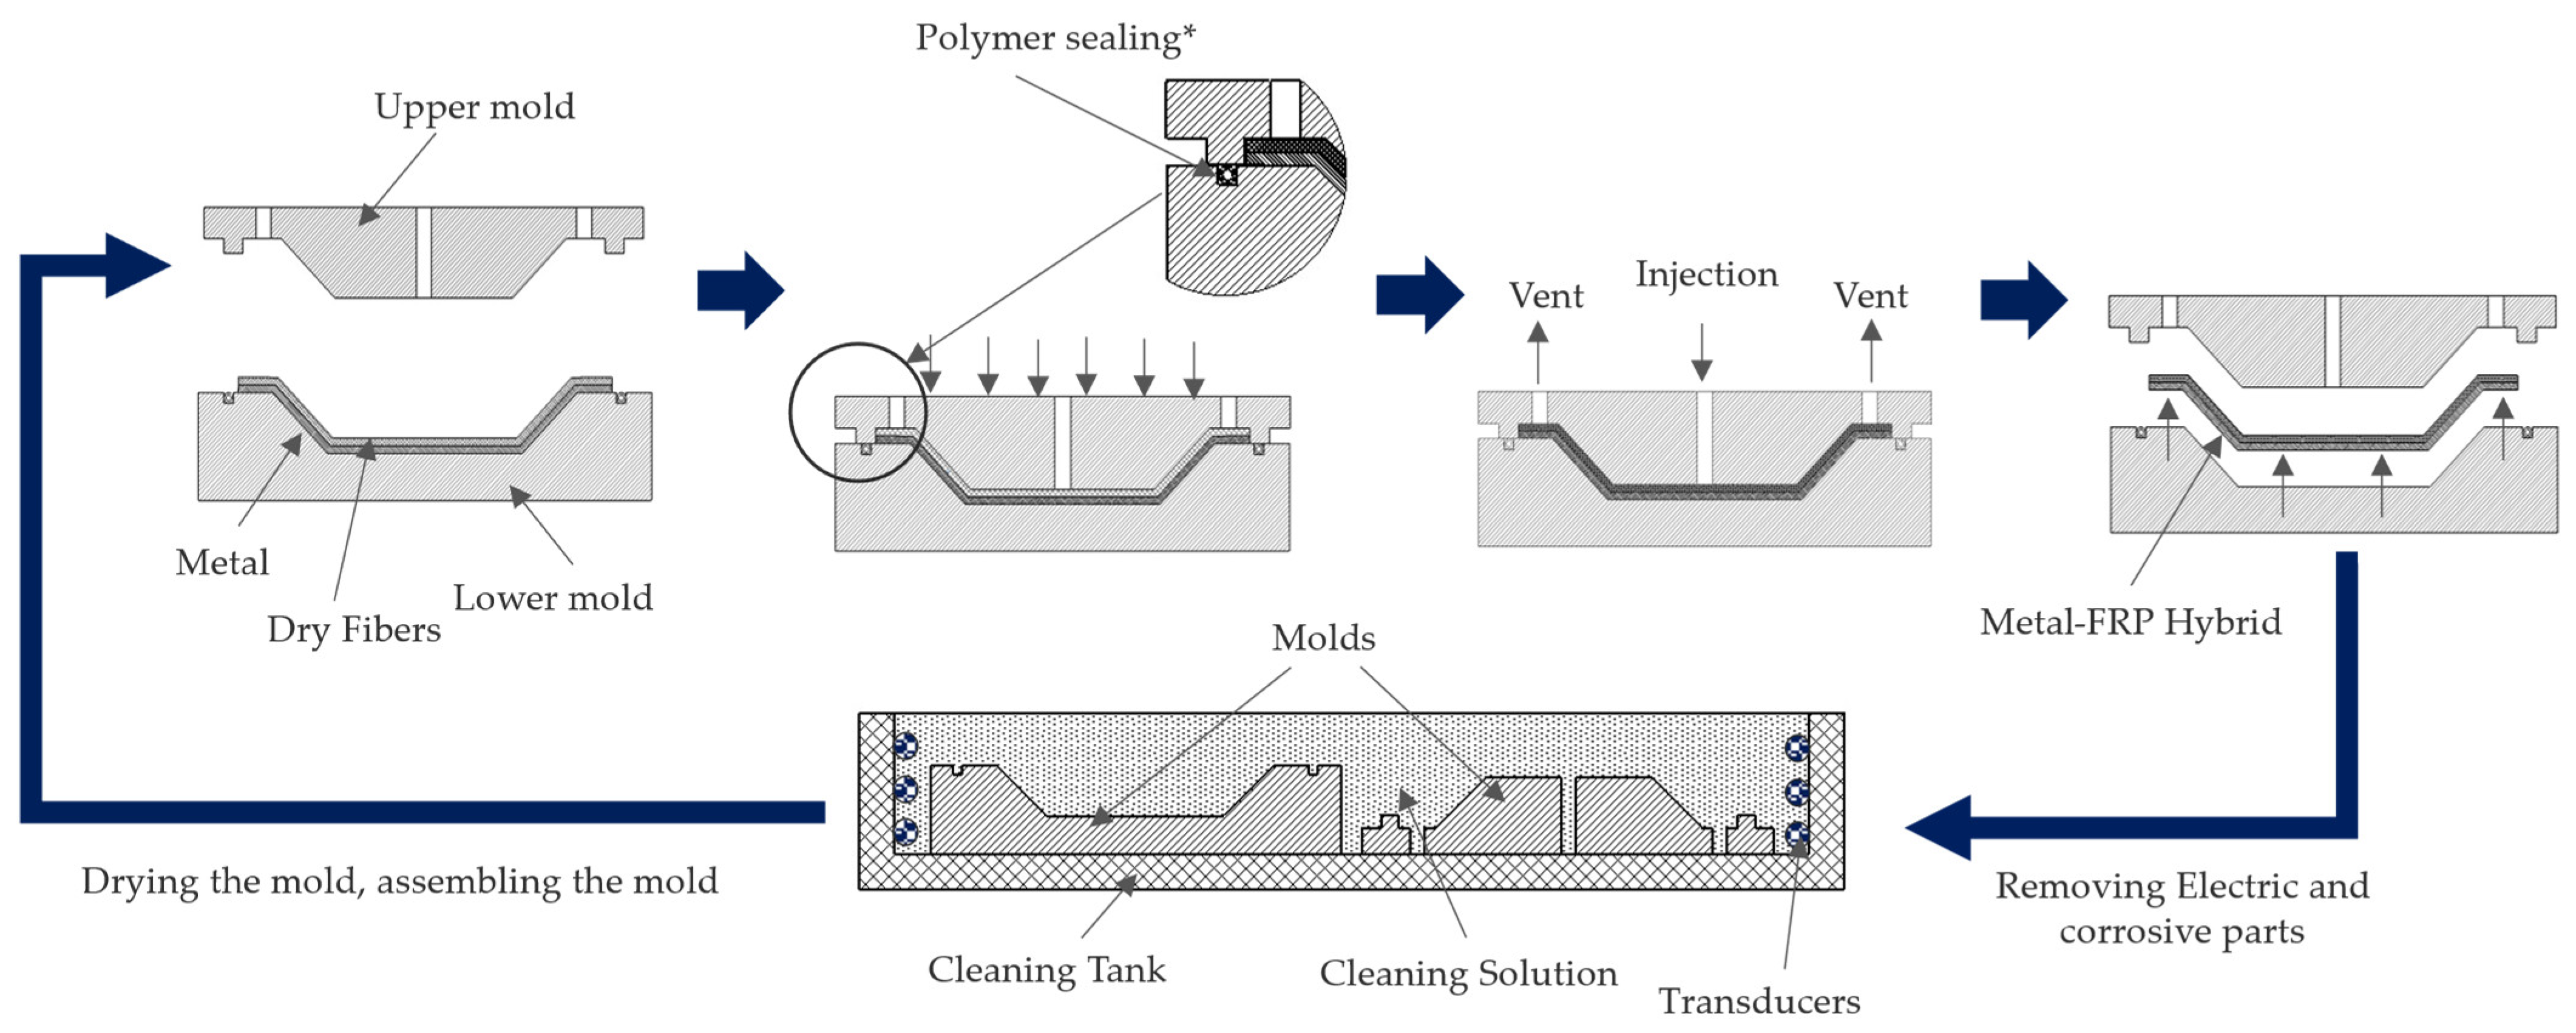
This work focuses on the Resin Transfer Molding (RTM) process, a subcategory of injection molding widely used for producing fiber-reinforced composite parts [27]. In RTM, dry fiber preforms are placed into a closed mold cavity, and a liquid thermoset resin is injected under pressure to impregnate the fibers and form a consolidated part [28]. The process relies heavily on vacuum sealing and precise surface conditions to ensure complete resin infiltration and high part quality [29,30]. Even small amounts of residue near sealing edges or on cavity surfaces can compromise vacuum integrity, disrupt resin flow, and lead to defects or incomplete parts. Figure 1 illustrates the complete RTM production cycle, highlighting the integration of cleaning after a predefined number of production cycles. In the conventional approach, this involves fully dismantling the mold from the press, performing an external cleaning process, reassembling the tool, and then resuming production. To address these challenges, this work introduces a localized ultrasonic cleaning method designed for in situ use within RTM mold tools.

2. Materials and Methods

2.1. Experimental Design and Strategy

The experimental strategy was designed to evaluate the feasibility and effectiveness of a localized ultrasonic cleaning method for RTM tooling under both controlled and practical conditions. Due to the high cost, extensive material consumption, and potential wear associated with full-scale mold testing, initial investigations were conducted at laboratory scale using smaller cavity inserts. This approach allowed for efficient parameter screening, reduced material waste, and minimized tool fatigue during repeated trials.
The first phase of the study focused on understanding how surface contamination develops under various conditions. Cavity inserts with different geometrical profiles were fabricated to investigate the influence of shape complexity, resin type, and curing parameters on contamination behavior and surface degradation. To simulate different release conditions, two strategies were employed: internal release agents mixed directly into the epoxy matrix and external release agents applied as a coating on the mold surface. Based on the results from this phase, the most contaminating matrix–release agent combination was selected to validate the cleaning concept using the full-scale production tool.
In the second phase, a production-scale RTM mold incorporating representative cavity features from the earlier trials was selected to validate the cleaning concept under realistic processing conditions. The ultrasonic cleaning unit was integrated directly into the mold setup to test its effectiveness without tool removal. This allowed the investigation of localized cleaning efficiency, surface recovery, and process reliability under near-industrial constraints. Both phases of the study were supported by quantitative surface roughness measurements and visual inspections, enabling systematic assessment of contamination trends and cleaning performance. This combined approach provided a valuable basis for understanding the potential scalability and robustness of the proposed ultrasonic cleaning method by connecting laboratory insights with practical implementation.

2.2. Materials

The selection of materials used in this study was based on industrial relevance to the RTM process and their influence on contamination and cleaning behavior. Two thermoset resin systems were used to simulate actual production conditions: an epoxy system (EPIKOTE Resin 05475 and EPIKURE Curing Agent 05443) and a polyester system (ENYDYNE H 68377 TAE and BUTANOX M-50). These systems were chosen because of their widespread use in automotive and aerospace applications due to their strong mechanical properties and good fiber impregnation characteristics. The epoxy resin was mixed in a 100:24 ratio (resin to hardener), while the polyester resin followed a 100:2 ratio. Table 1 summarizes the important properties of resin systems used in the current work. To assess the impact of mold surface chemistry on contamination, both internal and external release agents were used. Mikon INT-8010 (Münch Chemie International GmbH, Weinheim, Germany) was added directly into the resin mixture as an internal release agent at a concentration of 1.5%, while Mikon 227 MC (Münch Chemie International GmbH, Weinheim, Germany) was applied externally to the tool surface to help reduce adhesion and facilitate demolding as listed in Table 2. The application of Mikon 227 MC typically results in a thin film layer of approximately 30–50 µm, depending on the surface geometry, as recommended by the manufacturer. These agents were selected to simulate realistic production conditions and observe how surface interaction changes over multiple molding cycles. The inserts used to replicate mold cavity features were machined from tool steel 1.2085 (Ullner u. Ullner GmbH, Paderborn, Germany), which is commonly used in RTM molds due to its corrosion resistance and dimensional stability at elevated temperatures. For thermal isolation and sealing, PEEK (polyether ether ketone from smapla GmbH, Koblenz, Germany) was used to fabricate frame inserts because it can withstand curing temperatures up to 300 °C without deformation or chemical degradation. Table 3 lists the properties of tools used in the current work.

2.3. Contamination Sample Preparation and Characterization

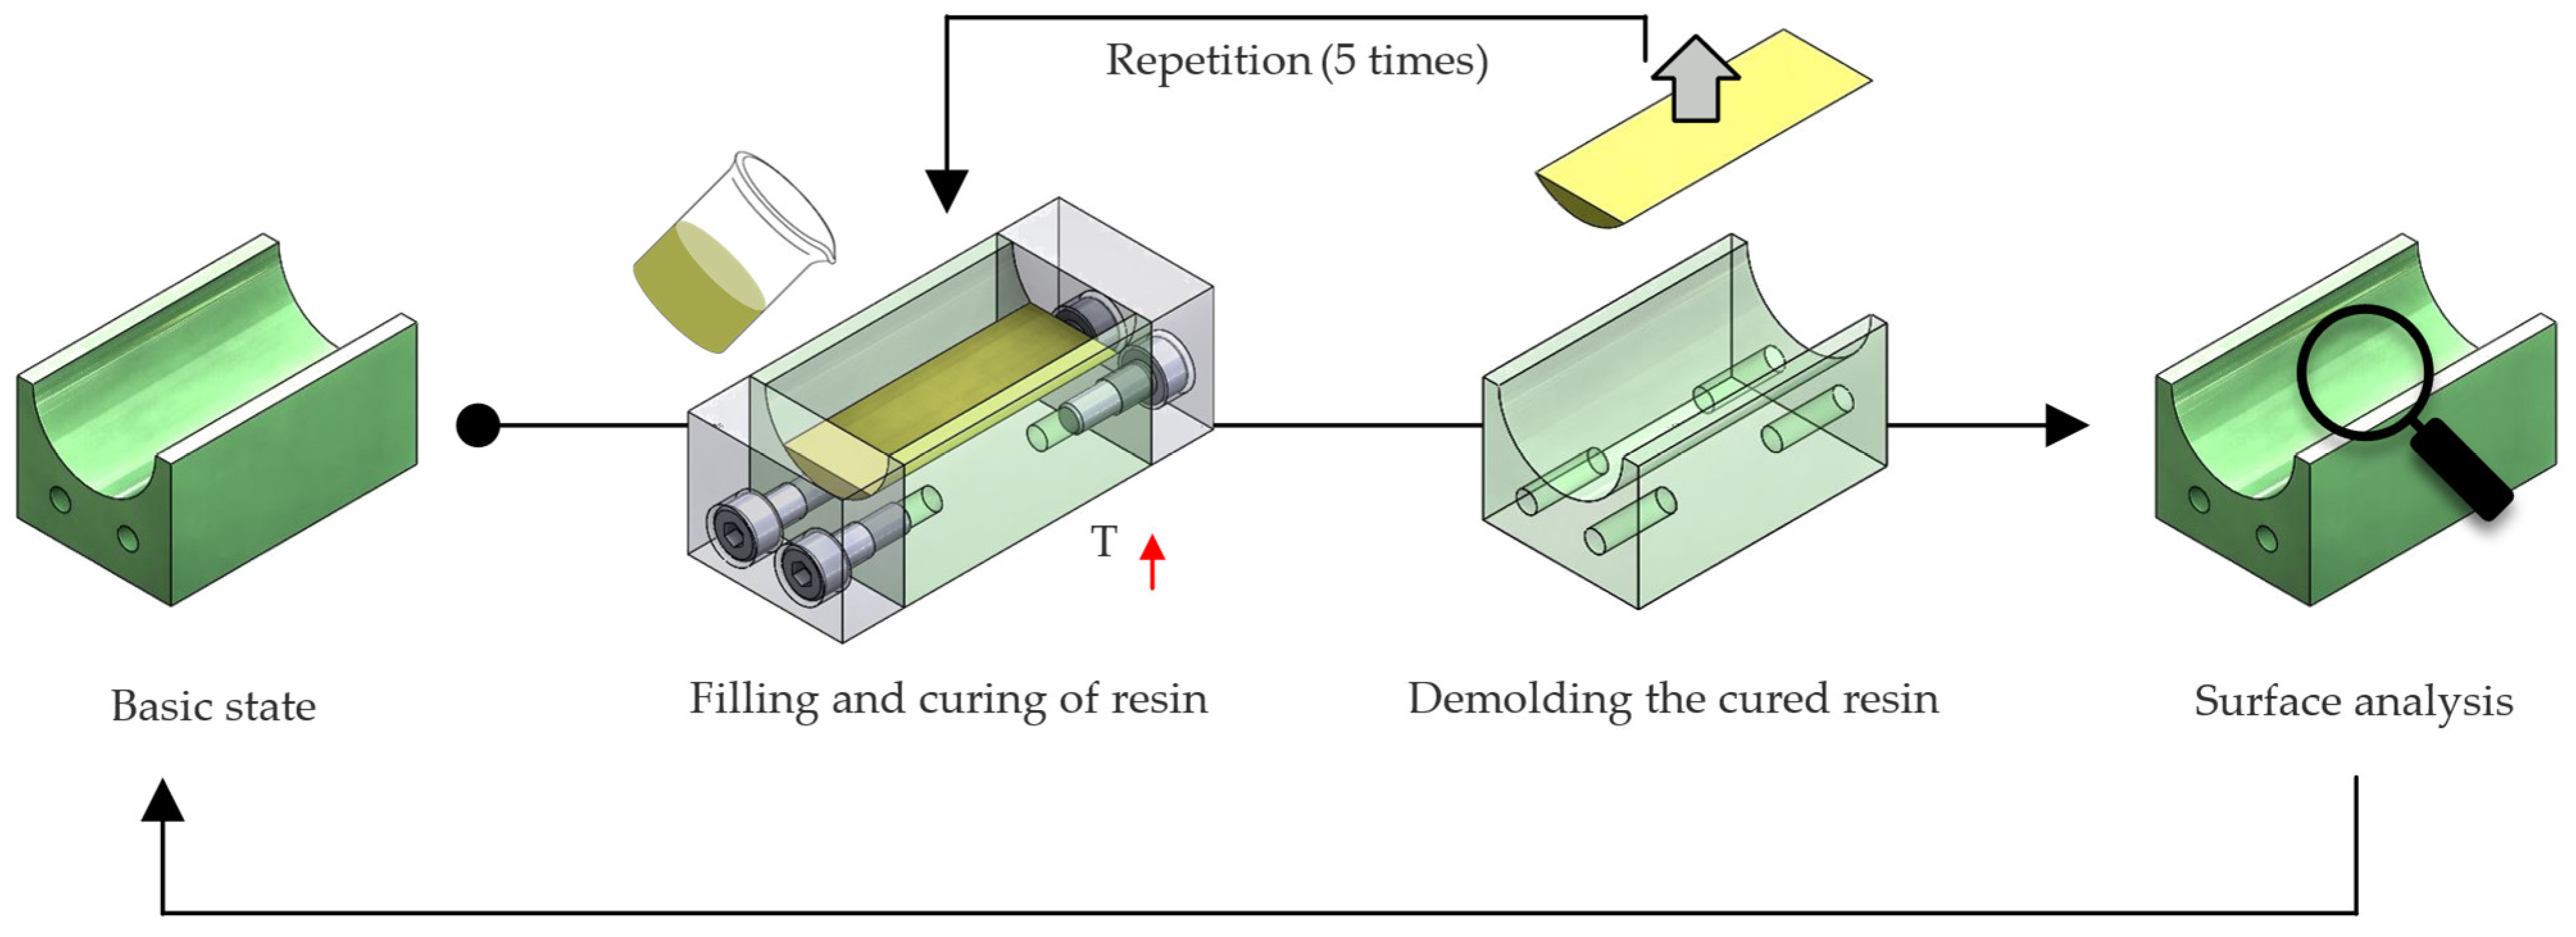
To investigate how mold surface geometry influences contamination buildup during repeated RTM cycles, a set of five representative cavity profiles (A–E) was manufactured from tool steel 1.2085 and polished to achieve a D1 surface finish (~2 µm Ra) as shown in Figure 2. These geometries simulate critical tool cross-sectional areas such as corners, grooves, sealing interfaces, and resin inlets and outlets, and were designed as rectangular samples measuring 40 mm in length and 25 mm in width, each incorporating different cavity profiles. Instead of performing a full RTM injection process, the resin was manually poured into each cavity and then cured under 5 bar pressure using a mobile press. This setup replicates the consolidation phase of RTM, with the only deviation being the absence of vacuum-assisted resin infusion. Both epoxy and polyester resin systems were tested, with and without internal release agents, and samples were cured at two temperature levels: 120 °C and 250 °C. For each configuration, resin was injected and cured for a total of 15 cycles. After every 5 cycles, the surface roughness of each geometry was measured to track contamination development. Figure 3 summarizes the key steps involved in preparing the surface roughness sample.
To evaluate how contamination affects the condition of mold surfaces during repeated RTM cycles, surface roughness was selected as a key indicator of surface degradation. Characterizing roughness over time helps quantify polymer residue buildup and identify when and where cleaning is required. Surface measurements were performed using a stylus-based profilometer. Several roughness parameters were considered during the initial trials, including Ra (arithmetical mean roughness) and Rz (average maximum height). While Rz provides insight into peak-to-valley distances, Ra was chosen as the primary metric for this study due to its robustness, reproducibility, and widespread use in evaluating mold surface quality in manufacturing contexts. Moreover, Ra was preferred over Rz because it provides a more stable and repeatable representation of gradual surface degradation, whereas Rz is more influenced by isolated surface irregularities that may not represent the general surface condition. Ra is particularly sensitive to gradual surface changes caused by polymer buildup and offers a reliable basis for comparing different geometries and process conditions over time. Measurements were taken at five predefined positions on each geometry after every five molding cycles, and the results were averaged to monitor surface evolution throughout the trial series.

2.4. Adhesion Sample Preparation and Characterization

To study how surface contamination affects mold–part interaction during demolding, a series of compression-shear tests were performed on flat tool steel specimens. The tests simulate the demolding forces encountered during composite part removal and are designed to quantify how mold surface conditions after repeated RTM cycles affect release behavior under controlled conditions. The test specimens consisted of rectangular steel blocks (24 mm × 24 mm × 10 mm) embedded into a high-temperature-resistant PEEK frame, forming a cavity on one side for resin injection as shown in Figure 4. The steel surface was first polished to reach a surface roughness of ~2 µm (D1 finish). The prepared steel sample was placed into the frame from below, while the liquid epoxy resin system (with or without internal release agent) was poured into the open cavity above it. A steel plate was placed over the top to seal the assembly, and the entire setup was compressed and cured in a hot press at either 120 °C or 250 °C under pressure of 5 bar. This produced a well-bonded interface between resin and steel that closely mimics real RTM mold–part interaction. After a certain number of curing cycles (5, 10, and 15), the samples were carefully removed and transferred to a universal testing machine equipped with a custom-designed fixture. The fixture was made to align and support the sample securely without introducing bending moments. A fixed lower die supported the PEEK frame, while a moving upper punch applied compressive force directly onto the resin layer to induce shear separation at the mold–resin interface. The test speed was set to 0.2 mm/min, and the force was recorded continuously until failure occurred. The maximum force recorded during this process was defined as the demolding force. Three types of resin-release agent combinations were tested, including systems with and without internal release agents at both curing temperatures. These measurements, combined with surface roughness data, help identify critical conditions under which tool contamination leads to increased demolding effort, highlighting the necessity for reliable in situ cleaning methods.

2.5. Ultrasonic Cleaning Setup and RTM Tool Implementation

To validate the localized ultrasonic cleaning concept under realistic production conditions, a set of technical requirements was first defined based on state-of-the-art review and early system planning. These included constraints related to cleaning time, residue removal efficiency, surface roughness deviation, environmental compatibility, and automation potential. Mechanical requirements for the cleaning attachment, such as allowable weight, installation space, and service life, were also considered to ensure seamless integration into industrial RTM setups. These criteria are summarized in Table 4 (cleaning method requirements) and Table 5 (cleaning system requirements).
The target values in Table 4 and Table 5 were derived from a combination of internal lab-scale trials, early project constraints, and informal input from industrial partners familiar with mold maintenance practices. For example, initial tests showed that removing epoxy contamination using conventional methods could require up to 3 h, prompting a defined upper limit of 120 min for the localized process. Surface roughness deviation and contamination removal thresholds were set based on repeatability observed during early trials. Equipment-related requirements such as attachment weight and cleaning time were formulated to align with typical production handling capabilities, enabling integration without tool disassembly or extensive manual effort. Based on these constraints, the ultrasonic cleaning process was implemented in a full-scale RTM mold used for producing FRP–metal hybrid cylindrical shafts. The selected tool includes all relevant geometric features previously examined at laboratory scale, such as sealing grooves, cylindrical profiles, injection ports, and tight cavity transitions, making it ideal for validating the method under production-like conditions. The mold cavity itself measures 54 mm in diameter and 427 mm in length. To avoid cavitation-related damage, a minimum safety clearance of 10 mm between the transducer and the cavity wall was required. A compact ultrasonic transducer (SP07-40-HD, 30 mm diameter, 418 mm length, 40 kHz, max 700 W that was provided by Erdmann GmbH & Co. KG, Menden, Germany) was selected for compatibility. Two custom inserts were developed: one to securely clamp the transducer inside the cavity, and another to route the cleaning fluid out via a pressure valve. The tool’s original vacuum ports were repurposed as fluid inlets, and embedded heating elements maintained a cleaning fluid temperature of 70 °C during operation. Figure 5 shows the CAD model of the setup used to validate the proposed method.
Two different cleaning solutions were evaluated under controlled conditions. The first was a citric acid–acetone mixture (1:2 molar ratio), applied in continuous ultrasonic mode at full power (700 W) for 30 min. While effective at cleaning lower cavity regions, this setup led to minor surface pitting, likely due to excessive cavitation energy. In a second iteration, a more controlled solution, benzyl alcohol and water (1:3 molar ratio) was used at reduced power (350 W) in pulsed mode (1 min on, 10 min off, repeated three times). This method achieved comparable cleaning with no visible tool damage, though some residue remained near the upper cavity wall, potentially due to localized evaporation. Each cycle was followed by a 6 bar rinse and vacuum evacuation of residual fluid. The composition and process parameters of both cleaning solutions are detailed in Table 6.

3. Results

Surface roughness (Ra) was used as a quantitative indicator of contamination buildup in RTM tooling under two processing temperatures: 120 °C and 250 °C. Surface roughness measurements were performed using a MarSurf M 310 portable profilometer (Mahr GmbH, Wiesbaden, Germany) equipped with a PHT 6-350 stylus probe. The device provides high-resolution 2D profile data and is suitable for both flat and curved technical surfaces, making it well-suited for on-site evaluation of mold cavities. Five mold insert geometries were investigated, each representing a typical cavity feature commonly found in RTM tools. These included a bent profile (Type A), cylindrical surface (Type B), S-shaped profile (Type C), sealing notch (Type D), and a drilled injection point (Type E). Each insert was subjected to 15 molding cycles, and Ra was measured at five predefined surface positions after cycles 0, 5, 10, and 15. The influence of both resin type and the use of internal release agents were evaluated. At 120 °C, four material configurations were tested, combining epoxy and polyester systems with and without internal release agents. For the higher-temperature study at 250 °C, only epoxy-based systems were examined, based on their stronger tendency to accumulate surface contamination observed in the earlier phase. Figure 6, Figure 7, Figure 8 and Figure 9 show the results at 120 °C. Among these, Figure 6 illustrates epoxy systems with internal release agent (Type 1). Surface roughness increased steadily across all geometries, with final Ra values between 3.5 µm and 11.6 µm. The most stable geometries were Types A and C, where gradual surface profiles and better flow helped delay buildup. In contrast, the drilled injection point geometry, represented by sample E1, showed the highest roughness increase. Ra rose from an initial 2.33 µm to 11.61 µm by the 15th cycle, indicating a strong tendency for resin buildup in enclosed or hard-to-reach cavity regions.
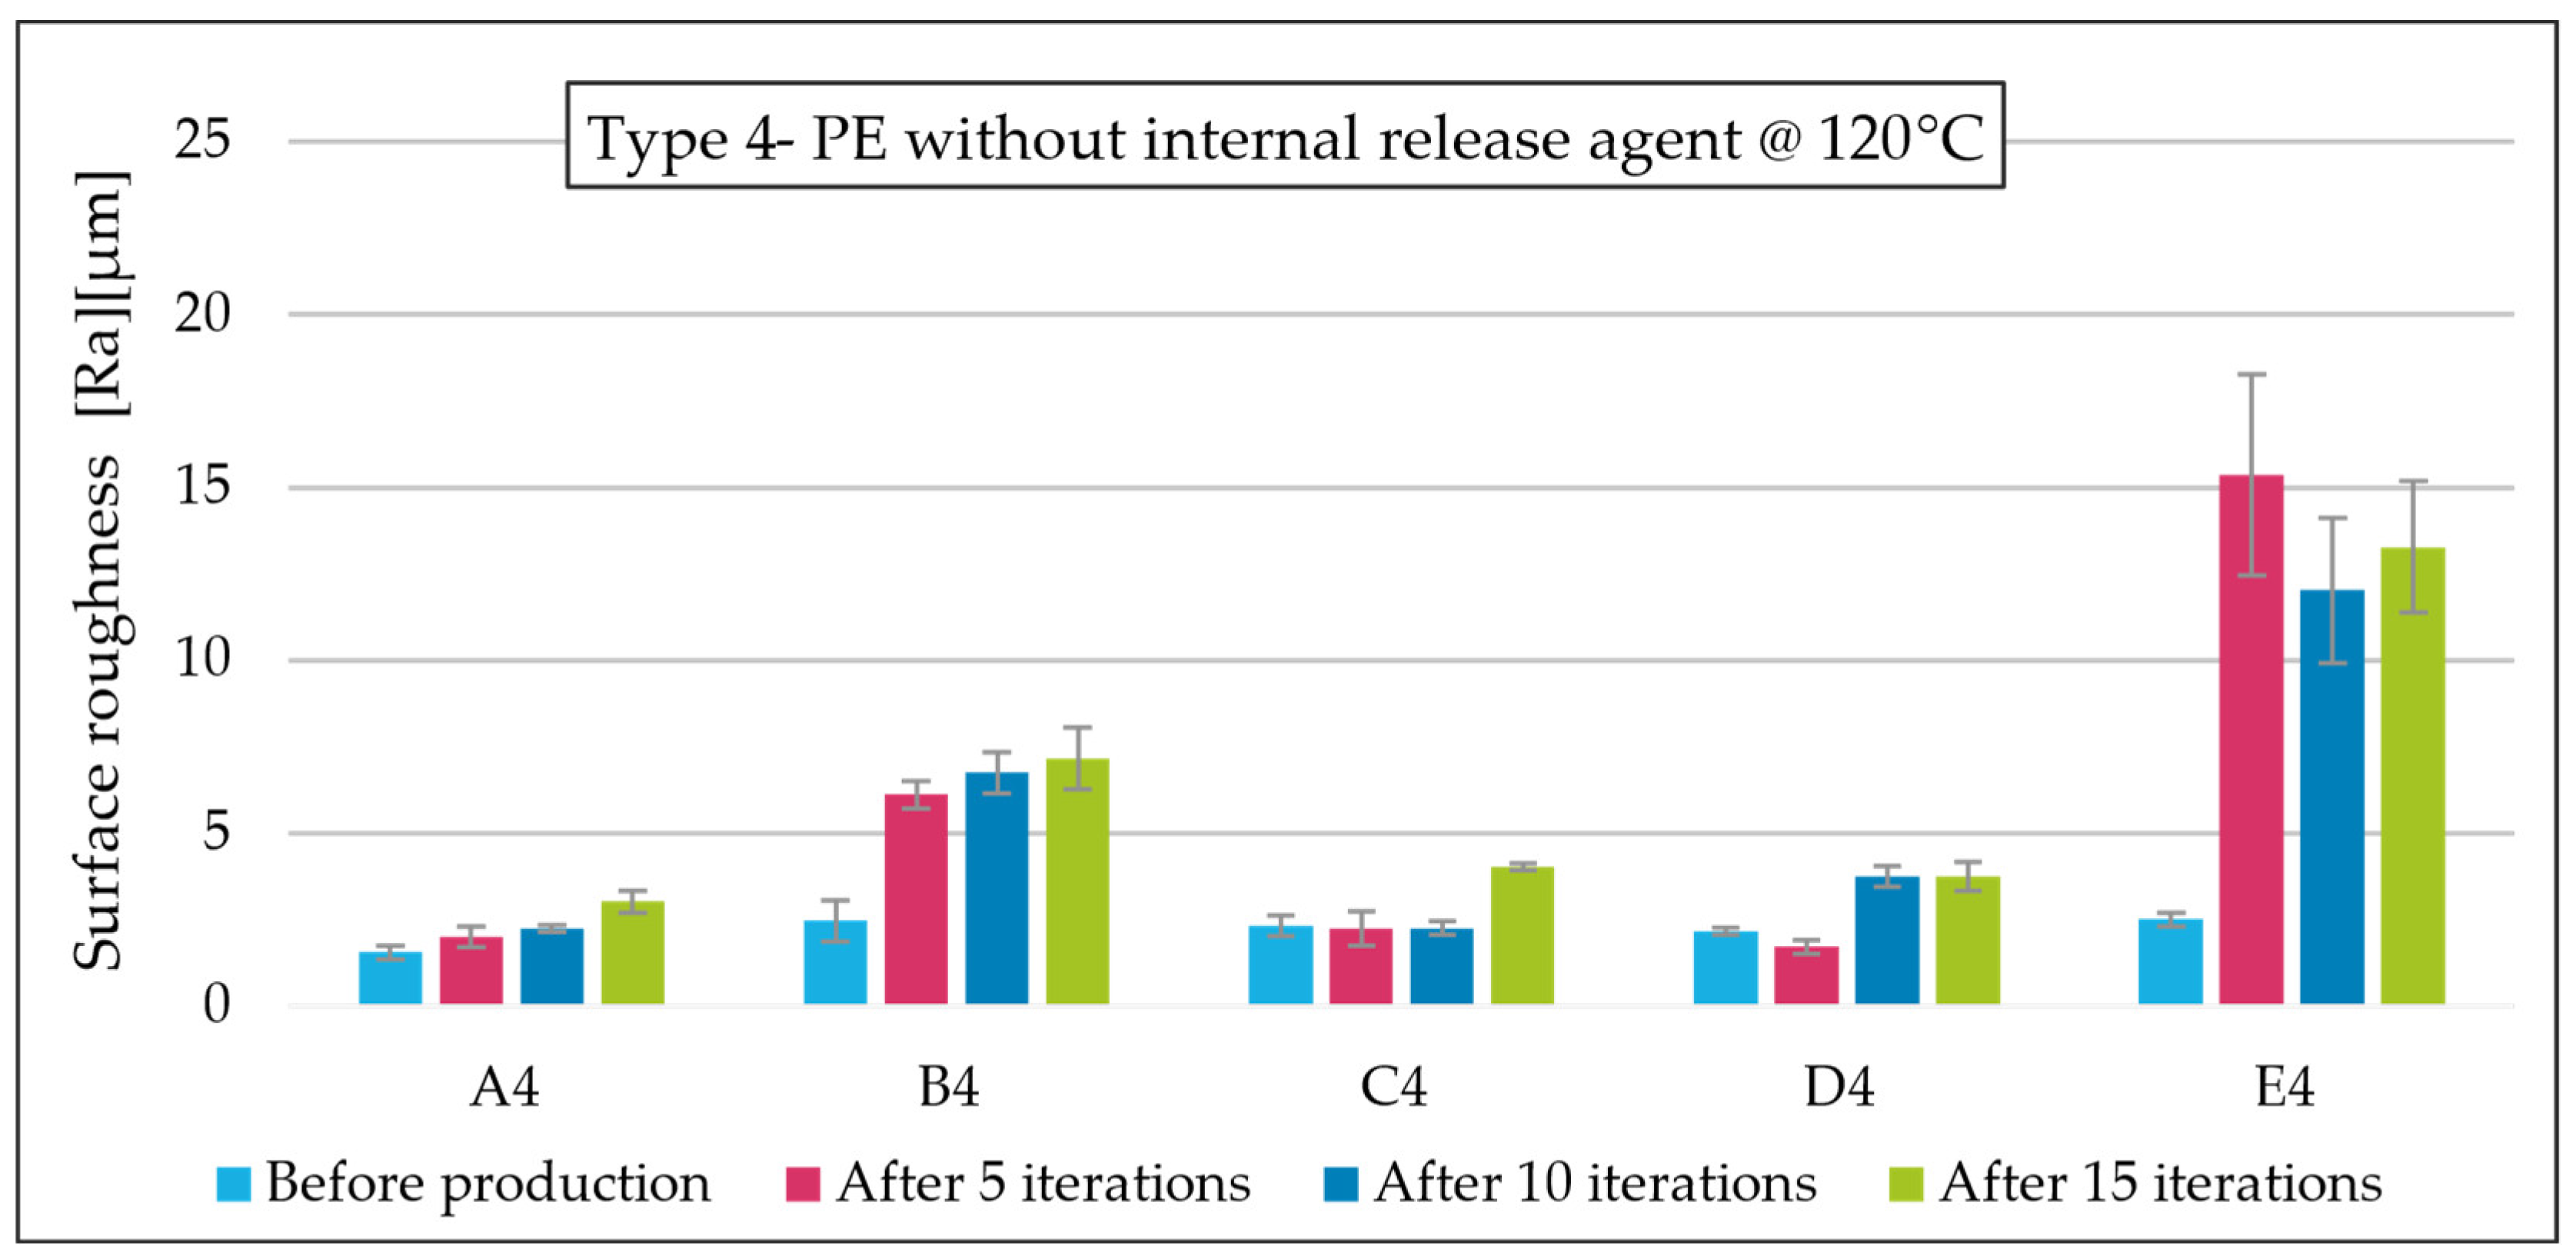
In Figure 7, the epoxy without internal release agent (Type 2) shows significantly faster and more uneven contamination. E2 reached a final Ra of 19.31 µm from a starting point of 2.25 µm, a 758% increase. Similarly, for B2, the cylindrical geometry, Ra rose from 2.45 µm to 9.25 µm. These results confirm that epoxy exhibits stronger chemical bonding to the tool surface and that release agents play a critical role in mitigating this effect. Standard deviations for these samples also increased noticeably, indicating patchy and inconsistent contamination. Figure 8 presents the performance of polyester systems with internal release agents (Type 3). While overall trends mirrored those of the epoxy samples, Ra values remained lower throughout the 15-cycle test. For example, E3 finished at 9.58 µm and B3 at 6.75 µm, both significantly below their epoxy counterparts. The difference is attributed to polyester’s lower viscosity, reduced chemical bonding, and slower thermal degradation under these conditions. In Figure 9, the polyester without release agent (Type 4) showed greater roughness growth than Type 3, but still remained less aggressive than the epoxy. Notably, E4 increased from 2.51 µm to 13.27 µm (a 428% increase), indicating that even polyester systems can lead to critical contamination in high-risk zones if no release agent is used. In contrast, geometries like C4 and D4 stayed below 4.0 µm, reinforcing that open contours and sealing regions are more manageable under controlled flow.
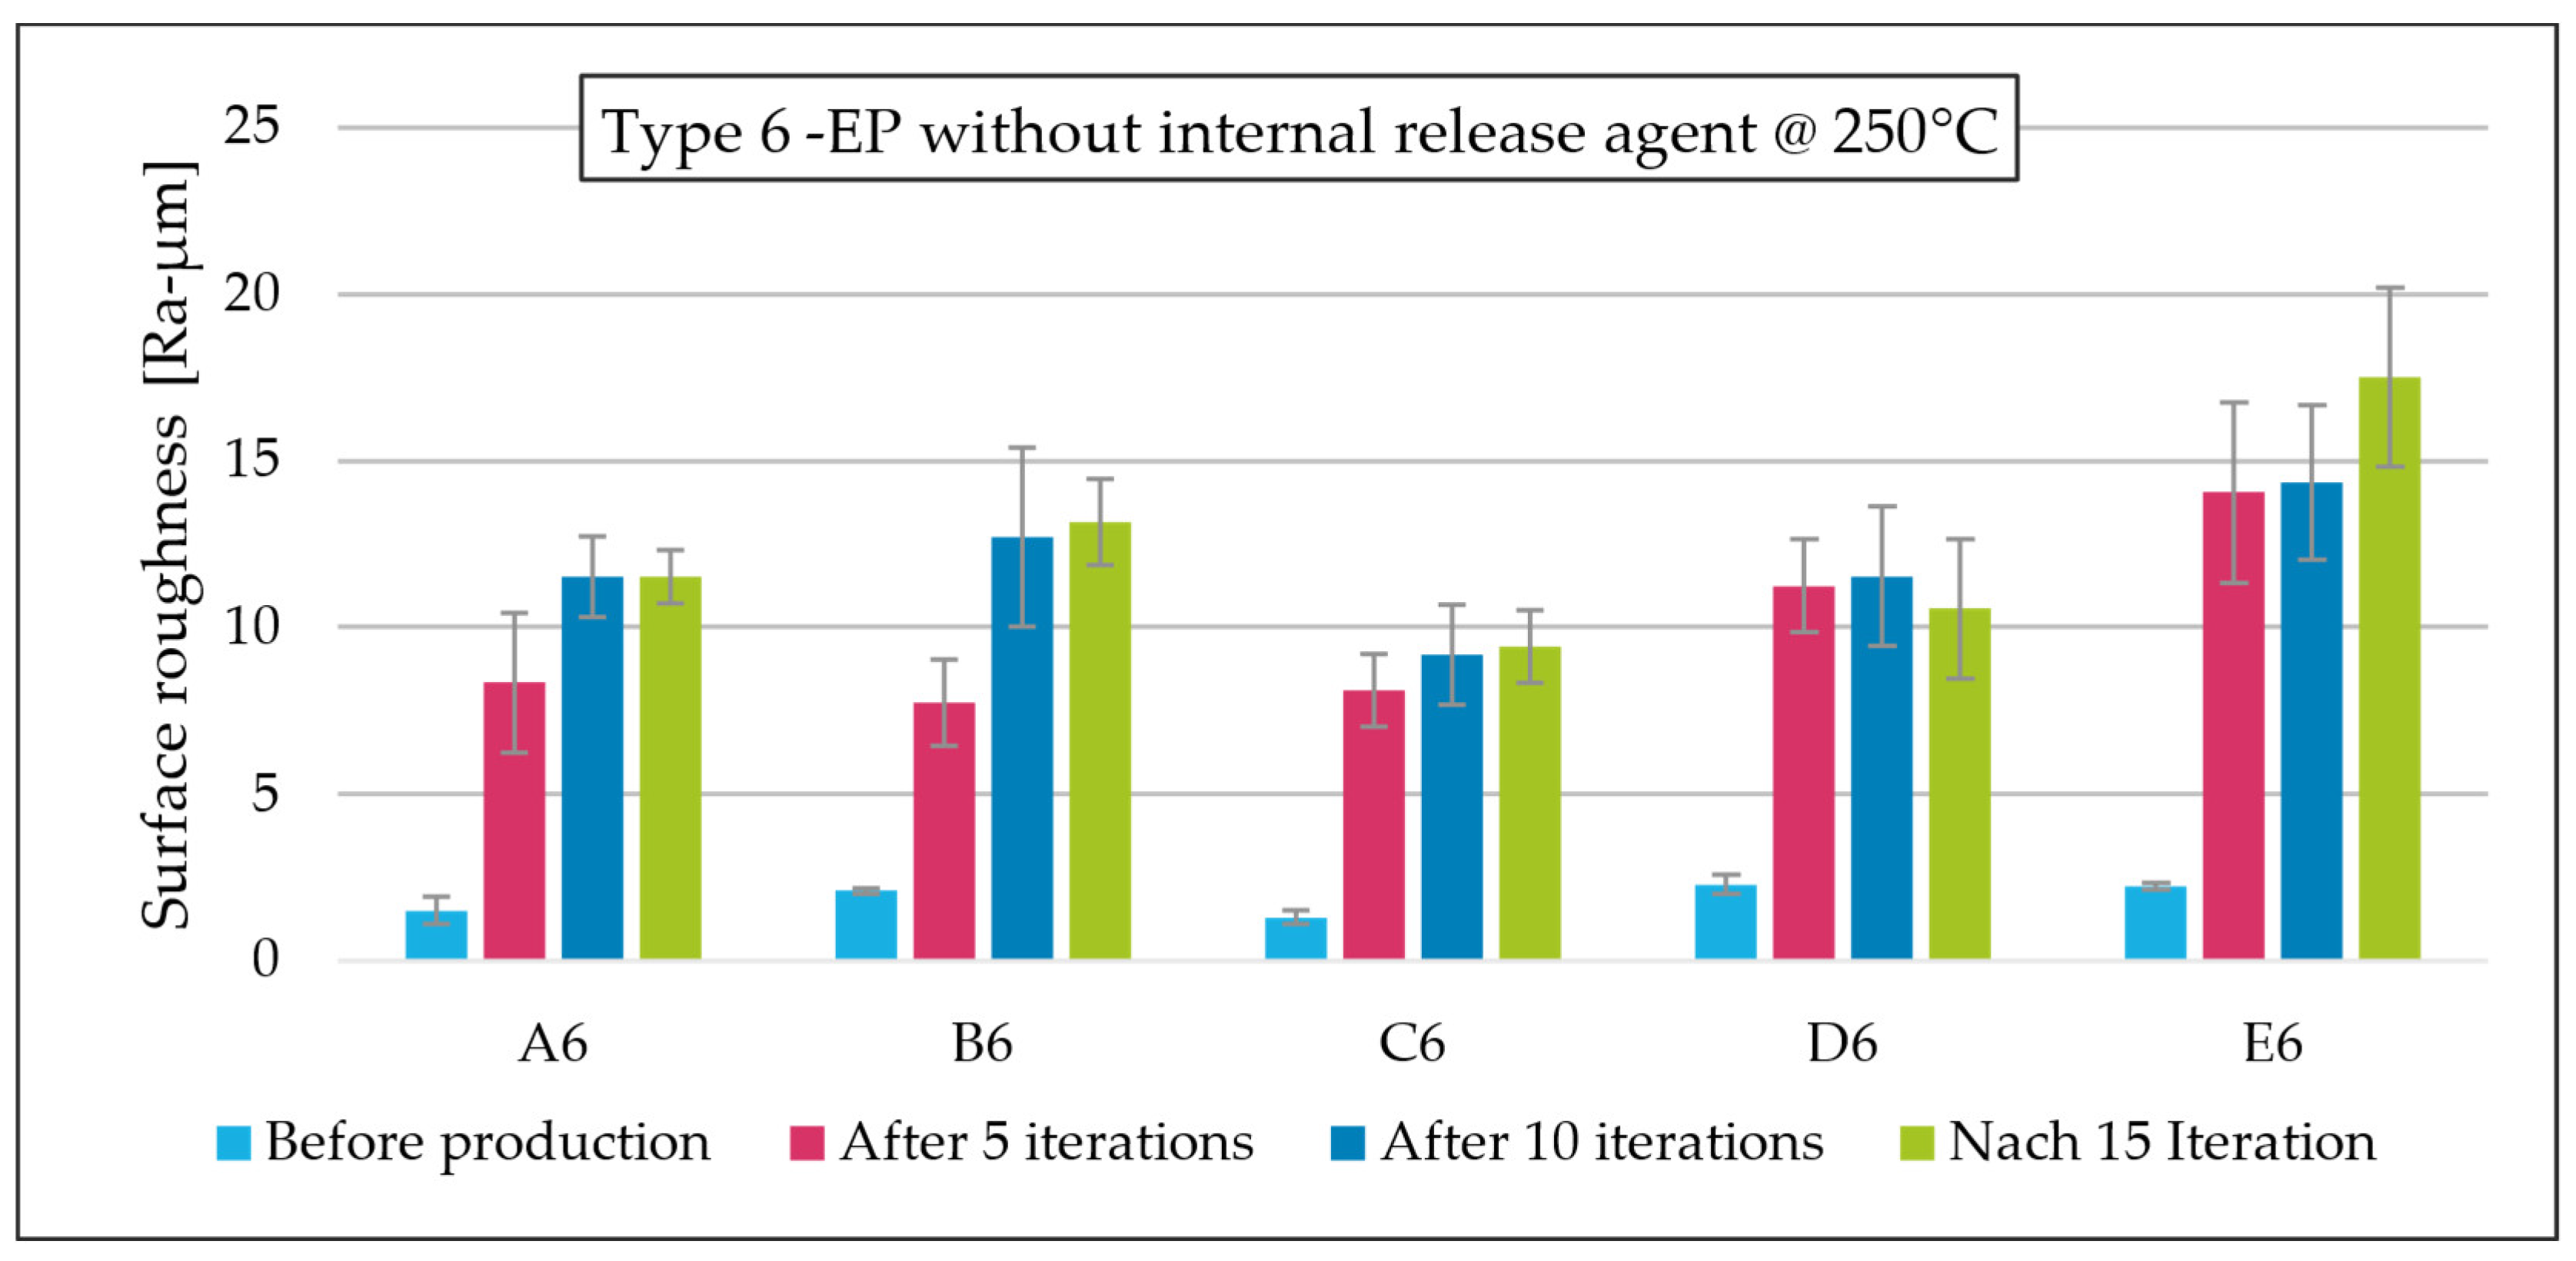
To investigate contamination behavior under elevated temperature conditions, only epoxy-based systems were selected for testing at 250 °C, as epoxy is more widely used in high-performance applications and exhibits greater surface degradation than polyester at 120 °C. Figure 10 and Figure 11 summarize the Ra evolution at this elevated temperature across all five geometries, comparing epoxy with (Type 5) and without (Type 6) internal release agents. In the bent geometry (A5 and A6), roughness increased steeply beyond 8 µm in both cases, with A6 rising from 1.53 µm to 11.51 µm: a 652% increase. This confirms that higher thermal energy accelerates crosslinking and residue formation, even in geometries that previously showed more stable behavior at 120 °C. Cylindrical geometry (B6) reached a peak of 13.16 µm, with particularly sharp growth between cycles 5 and 10, indicating a likely contamination threshold that should inform future cleaning intervals. For S-profile cavities (C5 and C6), final Ra values converged near 9.4 µm, suggesting that even open geometries are prone to thermal residue buildup under repeated exposure. Sealing notch geometries (D5 and D6) followed a moderate increase, ending slightly above 10 µm, and exhibited only small differences between configurations. This may be due to mechanical entrapment, where narrow grooves inhibit both flow and cleaning, reducing the release agent’s effectiveness. The most critical results were again found in the injection point geometry. Sample E6, without release agent, increased from 2.25 µm to 17.51 µm, representing the steepest Ra increase (678%) of the entire dataset. E5 also reached a high value of 13.25 µm, confirming that even release agent application cannot prevent thermal fouling in enclosed and drilled geometries. This highlights the cumulative effect of thermal exposure, cavity shape, and chemical protection on surface roughness progression. In addition, according to the material datasheet, exposure to 250 °C induces degradation and post-curing effects in thermoset epoxies, including excessive viscosity reduction, breakdown of adhesion promoters, and possible surface oxidation, all of which diminish interfacial bonding and contribute to easier resin detachment during demolding.
Across both temperatures, contamination buildup was highly geometry-dependent. Enclosed and concave surfaces such as those in Types B and E experienced greater fouling(contamination), while more gradual profiles (Types A and C) allowed for improved resin flow and agent coverage, resulting in lower roughness progression. Additionally, standard deviations increased consistently with cycle count, especially in geometries without release agents, supporting the hypothesis of uneven and uncontrolled surface contamination. These variations are critical for part quality, as they can lead to inconsistent demolding forces and poor surface finish. Release agents were effective in reducing both the magnitude and variability of increase in surface roughness, particularly at 120 °C. However, their performance decreased significantly at 250 °C, where epoxy showed strong affinity for the tool surface regardless of chemical separation. This behavior reinforces the need for targeted, geometry-specific in situ cleaning strategies particularly focused on high-risk zones such as injection ports and cylindrical features.
In addition to the roughness measurements, compression-shear tests were conducted to examine how surface changes over repeated cycles affect the force required to demold the resin from the steel surface. To assess how surface contamination affects demolding, compression-shear tests were carried out using a custom fixture. The test setup included a steel punch and a holding device with a cut-out that kept the specimen in place using four side walls and a screw. This fixture was mounted inside a universal testing machine, with a force sensor installed above the punch to measure the force needed to separate the resin from the steel. The testing speed was set to 0.2 mm/min. The complete setup and the recorded force curves are shown in Figure 12. The force curve for the epoxy sample with internal release agent shows a regular pattern, but the overall level of force stays about the same over all cycles. This means that the demolding effort remained stable throughout. For the epoxy sample without release agent, the demolding force increased steadily from cycle 1 to cycle 9. This suggests that the bond between the resin and steel became stronger with each cycle, likely due to increasing contamination on the tool surface. After the 10th cycle, the force values stayed at about the same level as before and followed a similar pattern to the sample with a release agent. In the third sample, which was also made without an internal release agent but cured at 250 °C, no significant force was recorded. The resin detached very easily from the steel without any noticeable resistance. This indicates that at higher temperatures, the resin may not bond as strongly to the steel surface, possibly due to changes in the material near the contact area caused by the heat. Overall, the results show that demolding forces are higher when curing is performed at lower temperatures and when no release agent is used. Higher curing temperatures seem to reduce the bonding between the resin and the mold surface, making it easier to separate.
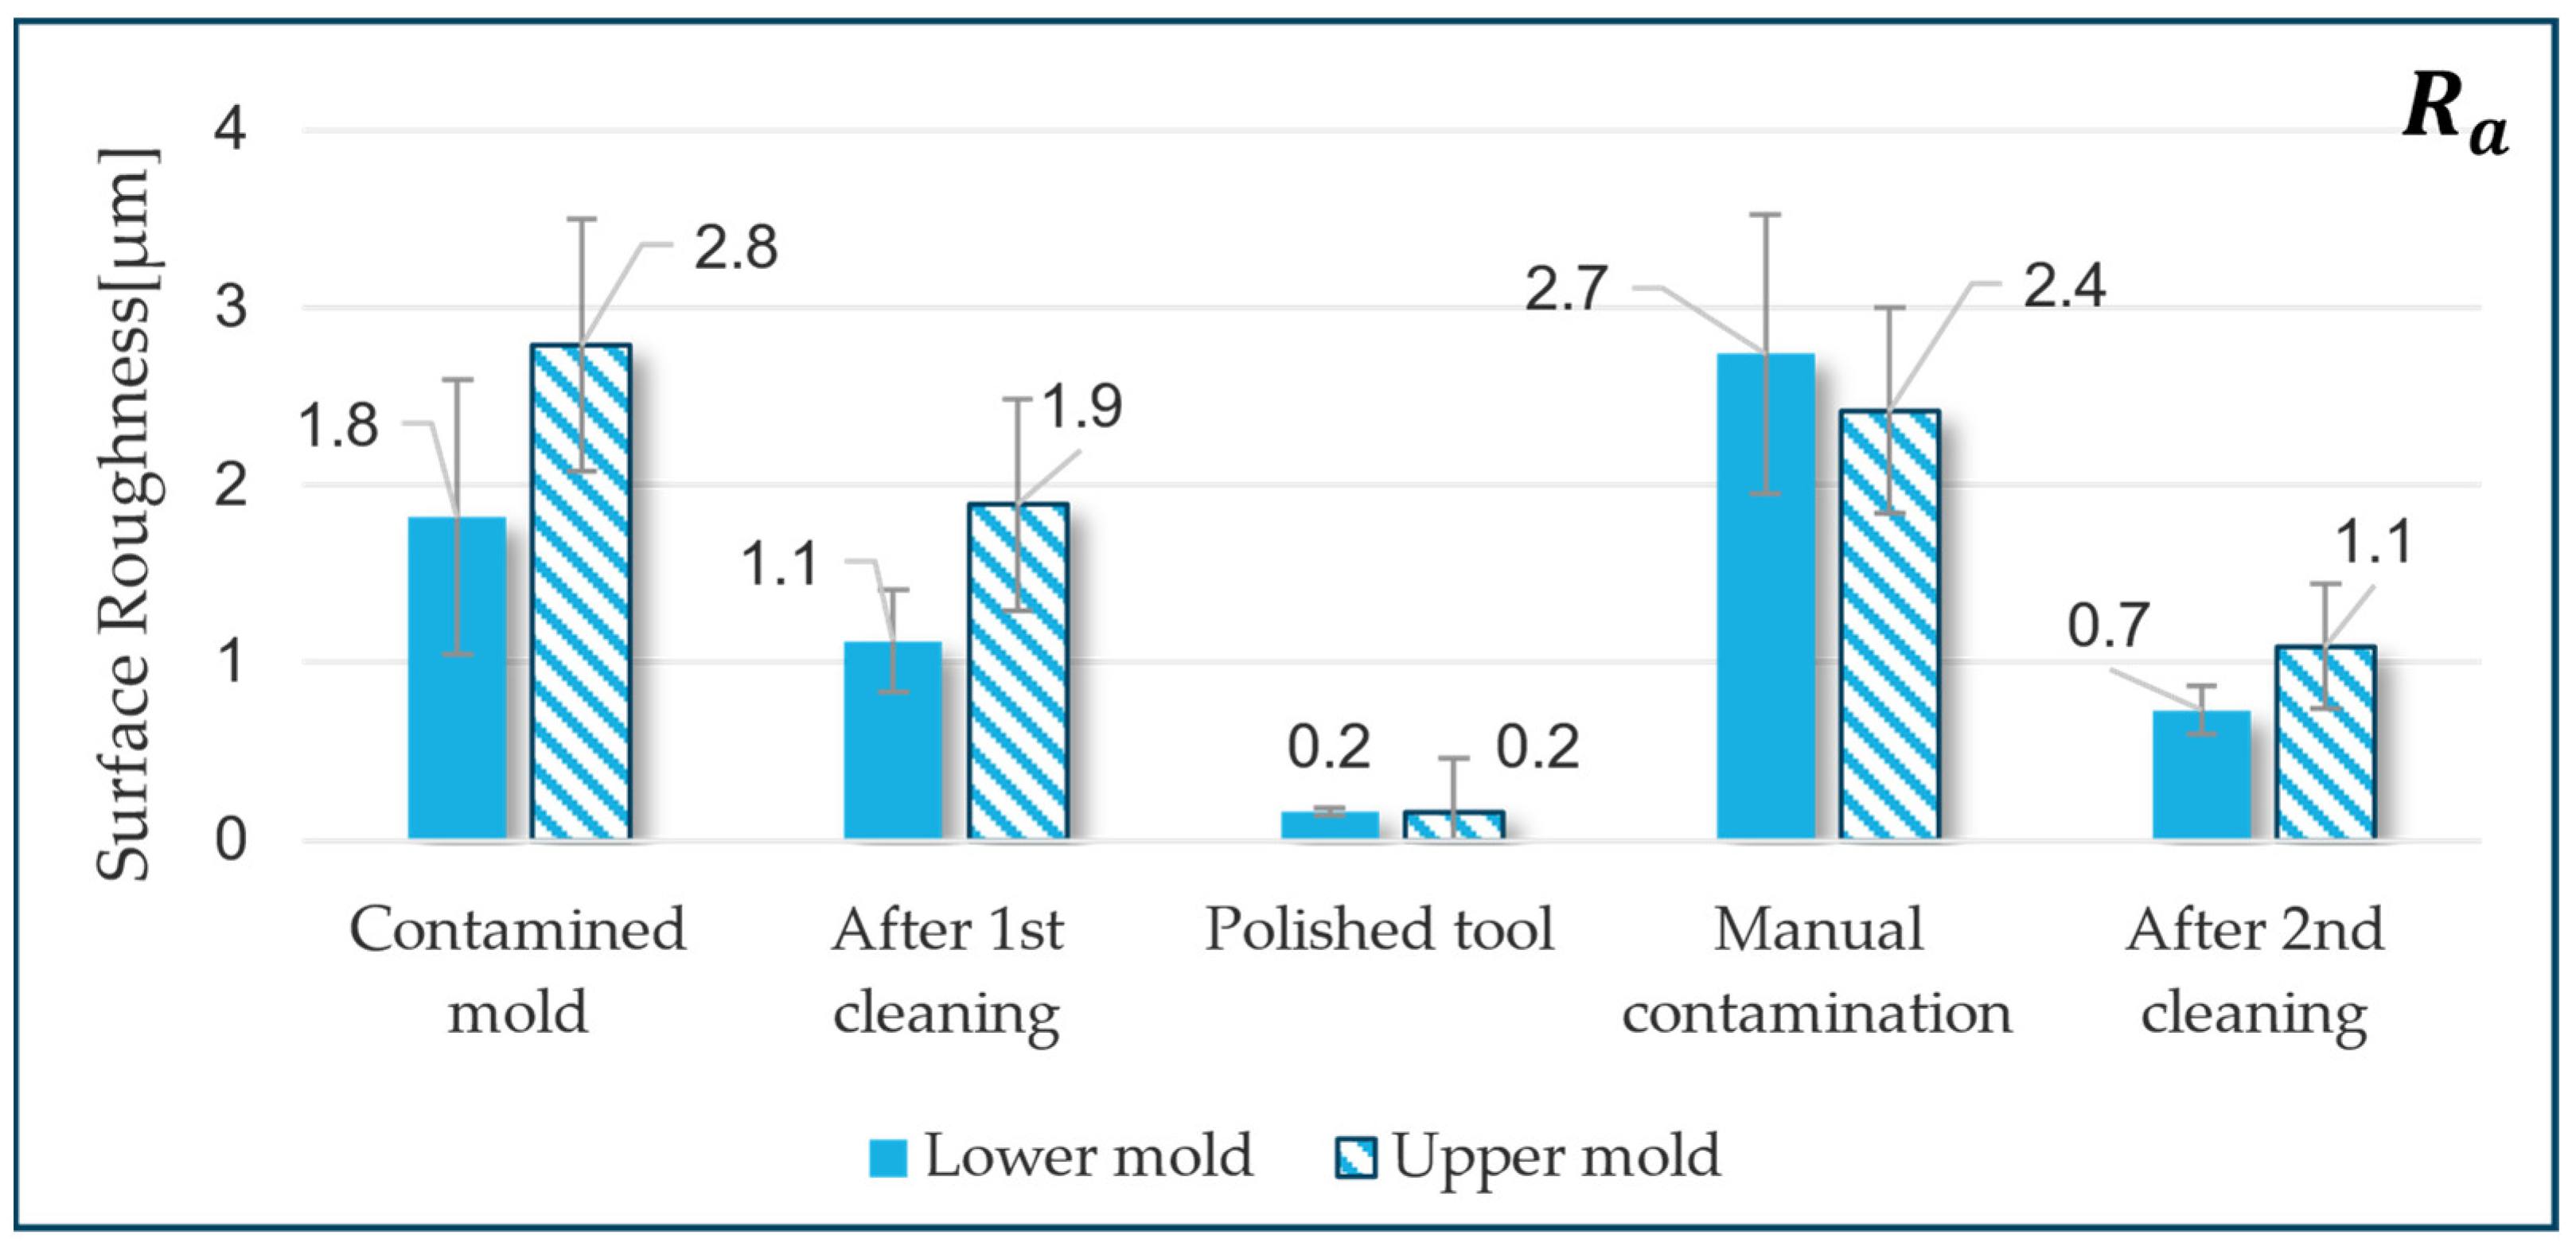
After analyzing surface roughness and demolding behavior in earlier trials, the localized ultrasonic cleaning method was applied to a full-scale RTM tool to evaluate its cleaning performance under realistic production conditions. Surface roughness was measured at 20 fixed locations across both the lower and upper mold halves, and average values were tracked throughout five key process stages. The evolution of surface conditions is summarized in Figure 13. It is also evident that the surface roughness measured directly on the RTM tool remained lower than those observed in the earlier insert-based trials, indicating that large-scale cavity surfaces may accumulate contamination less aggressively than localized or complex geometries. Initial contamination levels were higher on the upper mold half (2.8 µm) compared to the lower mold half (1.8 µm), likely due to reduced contact with cleaning fluid in upward-facing areas and greater exposure to evaporative loss. After the first cleaning iteration using a citric acid–acetone solution with continuous ultrasonic activation, roughness decreased to 1.1 µm on the lower mold and 1.9 µm on the upper mold. Although both surfaces showed improvement, the difference highlighted the need for better solution coverage and vapor control in the upper cavity region.
Both mold halves were then repolished, and an additional fine polishing stage was applied to further improve the tool surface, reducing the roughness from the original D1 finish (~2 µm) down to approximately 0.2 µm (A3 finish). To replicate mid-cycle contamination, the cavity was manually coated with resin instead of running a full series of molded parts. Roughness values after this step rose to 2.7 µm for the lower mold and 2.4 µm for the upper mold, reflecting typical buildup observed during RTM processing. It should be noted, however, that this manual contamination approach introduces a deviation compared to actual processing conditions, particularly due to the absence of injection pressure. During normal RTM operation, the resin is introduced under a pressure of approximately 5 bar, which promotes uniform wetting and penetration along the flow front. In contrast, manual application lacks this pressure-driven gradient, especially near the injection zone, potentially altering the local resin–tool interaction. A second cleaning iteration was then carried out using an optimized strategy. This involved switching to a benzyl alcohol–water solution, reducing ultrasonic power to 50%, and activating cavitation in three 1 min intervals separated by 10 min pauses. This method aims to preserve tool integrity while maintaining cleaning effectiveness. The lower mold surface improved to 0.7 µm and the upper mold to 1.1 µm. While slightly higher than the post-polish condition, these results confirm a successful cleaning effect with reduced energy input. The cleaning setup is illustrated in Figure 14, showing the lower tool over the various stages. To verify whether post-polishing could be avoided, a hybrid shaft was molded directly after the second cleaning. While the part was successfully produced, some minor surface adhesion was observed during demolding, indicating that polishing might still be beneficial under the current conditions. Figure 15 shows the results of a supplementary interlaminar shear test conducted on the produced steel-composite shaft. During demolding of the hybrid shaft produced after the second cleaning cycle, a noticeable resistance was observed, suggesting that internal shear stress may have built up between the metallic and composite layers. To investigate this further, an interlaminar shear strength (ILSS) test was conducted. The molded shaft was sectioned into 20 specimens, each 5 mm wide, and tested using a MTS with a fixture designed to push the metal insert out of the CFRP layer. This setup simulates interfacial stress conditions and allows evaluation of adhesion quality within the hybrid component. The test results revealed a reduction in interlaminar shear strength from 13.9 N/mm2 (reference sample) to 7.3 N/mm2 for the cleaned and molded shaft. These results suggest that the demolding forces applied may have contributed to local deformation or disruption within the fiber layers. However, this interpretation remains unverified, as no microscopic characterization was performed to confirm internal damage mechanisms. Future work will include such analyses to verify whether localized fiber–matrix separation or microcracking occurred during the demolding process. Despite the improved surface roughness achieved through cleaning (reduced to below 2.4 µm), the lack of a final polishing step appears to have adversely affected the interfacial adhesion between composite layers. This underscores the importance of incorporating a fine polishing stage to ensure consistent and optimal interface strength in subsequent molding cycles.

4. Discussion

Conventional mold cleaning methods used in Resin Transfer Molding (RTM) rely heavily on manual disassembly and external solvent cleaning, often leading to inconsistent surface quality, long downtimes, and potential tool damage. To address this, a localized ultrasonic cleaning process was proposed, allowing in situ cleaning directly inside the mold cavity without removing the tool from the press. The approach was tested in both laboratory-scale trials and a full-scale industrial mold, focusing on surface roughness changes and cleaning effectiveness.
Laboratory-scale testing was carried out using five representative cavity geometries machined in tool steel, each subjected to up to 15 molding cycles using epoxy and polyester resins at 120 °C and 250 °C. Surface roughness (Ra) was tracked throughout using a contact profilometer. Among the geometries, sharp corners and sealing grooves showed the most rapid roughness increase, validating their vulnerability to contamination buildup. To understand how this surface change impacts mold–part interaction, demolding forces were measured on flat specimens using a shear-compression test setup. Results showed a clear increase in adhesion force with cycle count in samples without internal release agents. In contrast, specimens using release agents exhibited fluctuating behavior due to possible uneven separation layers. At elevated temperatures (250 °C), resin tended to detach too easily without forming a strong bond, suggesting that thermal degradation or surface oxidation may interfere with adhesion.
Building on this understanding, the ultrasonic cleaning process was integrated into a full-size RTM mold designed for producing FRP–metal hybrid cylindrical shafts. This tool included all key cavity types tested earlier and was adapted to accept a compact ultrasonic transducer through a custom insert. Cleaning fluids were circulated through the cavity using the tool’s existing vacuum infrastructure, and internal heating maintained the solution at 70 °C. Initial tool surface roughness before cleaning was ~3.6 µm Ra. After a 30 min ultrasonic cycle using a citric acid–acetone mixture, residue was removed. The tool was polished back to an A3 finish with a surface roughness of 0.2 µm, and, then, the tool was manually contaminated, after which surface roughness increased to ~2.7 µm Ra, a 35% rise due to cumulative buildup. A second cleaning cycle was performed using a benzyl alcohol–water mixture in pulsed mode (3 × 1 min cycles with 10 min intervals at reduced power), which reduced the surface roughness to ~2.1 µm Ra, recovering 22% of the smoothness. However, after producing a final part post-cleaning, roughness increased again to ~2.4 µm Ra, likely due to removal of the polishing paste layer during ultrasonic exposure.
While the results confirm the feasibility of the process, we acknowledge that a direct comparison using identical ultrasonic parameters for both cleaning agents was not performed. Due to time and scheduling constraints during the experimental phase, it was not possible to apply reduced-power pulsed ultrasonic cleaning to the citric acid–acetone mixture. We agree that such a study would help isolate the effect of cleaning chemistry from ultrasonic energy input and will consider this in future work. Additionally, although citric acid is a mild organic acid, its combination with ultrasonic excitation may cause minor pitting or surface etching under prolonged exposure. This behavior was not observed here but will be further investigated in future studies.
Despite these promising results, some limitations must be acknowledged. The current cleaning method is most effective in localized regions and relies on the tool being properly sealed. Due to the low viscosity of the cleaning fluids, any leakage through unsealed contours may reduce cleaning efficiency or pose safety risks. As such, the method is best suited for tools with built-in or well-defined sealing interfaces. Additionally, we did not investigate microscopic damage to fiber layers or subsurface structure during demolding, which remains a topic for future work.
Future developments will focus on improved fluid sealing strategies, integration of programmable ultrasonic cycles, and coupling with roughness or pressure sensors for feedback control. Further investigations are also planned to evaluate long-term tool wear, residue buildup patterns across more complex geometries, and comparative studies using matched ultrasonic parameters for all cleaning agents. To support scalability and industrial integration, future systems may incorporate AI-assisted control logic combined with laser-based surface roughness monitoring. This would enable automated detection of contaminated zones and dynamic adjustment of cleaning parameters. In such systems, cleaning cycles could be initiated autonomously based on real-time surface data, reducing manual intervention and ensuring process consistency. These steps are needed to validate the scalability and robustness of the system under diverse industrial conditions. In conclusion, this study presents a validated concept for in situ ultrasonic cleaning inside an RTM production tool. While the current implementation is a functional prototype, it provides a strong foundation for future development of automated, energy-efficient mold maintenance systems. The results support the potential of this approach to reduce downtime, maintain surface quality, and extend tool life in composite manufacturing.

Author Contributions

Conceptualization, D.C.J., T.T. and T.M.; methodology, D.C.J., T.T. and T.M.; software, D.C.J.; validation, D.C.J.; formal analysis, D.C.J.; investigation, D.C.J.; resources, D.C.J., T.T. and T.M.; data curation, D.C.J.; writing—original draft preparation, D.C.J.; writing—review and editing, D.C.J., T.T. and T.M.; visualization, D.C.J.; supervision, T.T. and T.M.; project administration, T.T. and T.M.; funding acquisition, T.T. and T.M. All authors have read and agreed to the published version of the manuscript.

Funding

I acknowledge support for the publication cost by the Open Access Publication Fund of Paderborn University. The results presented here are part of a research project funded by the Federal Ministry for Economic Affairs and Energy (BMWK) based on a resolution of the German Bundestag—Project Number ZF4032937TA9. Technologies 13 00354 i001

Institutional Review Board Statement

Not applicable.

Informed Consent Statement

Not applicable.

Data Availability Statement

The original contributions presented in this study are included in the article. Further inquiries can be directed to the corresponding authors.

Acknowledgments

The authors would like to thank Erdmann GmbH & Co. KG, particularly Thomas Wenz, for kindly providing the cleaning solutions and the ultrasonic transducer setup used in this study for tool cleaning. Special thanks are also extended to Jan Andre Striewe for his support throughout this work, as well as to students Xin Ma and Chetan Geepalem for their valuable assistance during the experimental phase.

Conflicts of Interest

The authors declare no conflicts of interest. The funders had no role in the design of the study; in the collection, analyses, or interpretation of data; in the writing of the manuscript; or in the decision to publish the results.

Abbreviations

The following abbreviations are used in this manuscript:
RTMResin Transfer Molding
FRPFiber-Reinforced Polymer
EPEpoxy Resin
PEPolyester Resin
RaArithmetical Mean Roughness
RzAverage Maximum Height
CADComputer-Aided Design
PEEKPolyether Ether Ketone

References

  1. Garg, A.; Deshmukh, S. Maintenance management: Literature review and directions. J. Qual. Maint. Eng. 2006, 12, 205–238. [Google Scholar] [CrossRef]
  2. Fujishima, M.; Mori, M.; Nishimura, K.; Takayama, M.; Kato, Y. Development of Sensing Interface for Preventive Maintenance of Machine Tools. Procedia CIRP 2017, 61, 796–799. [Google Scholar] [CrossRef]
  3. Martínez-Mateo, I.; Carrión-Vilches, F.; Sanes, J.; Bermúdez, M. Surface damage of mold steel and its influence on surface roughness of injection molded plastic parts. Wear 2011, 271, 2512–2516. [Google Scholar] [CrossRef]
  4. Gim, J.; Turng, L.-S. A review of current advancements in high surface quality injection molding: Measurement, influencing factors, prediction, and control. Polym. Test 2022, 115, 107718. [Google Scholar] [CrossRef]
  5. Griffiths, C.; Dimov, S.; Brousseau, E.; Hoyle, R. The effects of tool surface quality in micro-injection moulding. J. Mater. Process. Technol. 2007, 189, 418–427. [Google Scholar] [CrossRef]
  6. Rakes, D.; Windyatri, H.; Suhendra, S. Scheduling Preventive Maintenance to Increase the Effectiveness of Injection Molding Machines Using the Overall Equipment Effectiveness Method at PT. Mah Sing Indonesia. Opsearch Am. J. Open Res. 2024, 3, 155–165. [Google Scholar] [CrossRef]
  7. Frumosu, F.D.; Rønsch, G.Ø.; Kulahci, M. Mould wear-out prediction in the plastic injection moulding industry: A case study. Int. J. Comput. Integr. Manuf. 2020, 33, 1245–1258. [Google Scholar] [CrossRef]
  8. Moniz, B.; Horvath, J.W. Chemical Cleaning and Cleaning-Related Corrosion of Process Equipment; ASM International: Materials Park, OH, USA, 2006. [Google Scholar]
  9. McLaughlin, M.C.; Zisman, A.S. The Aqueous Cleaning Handbook; Alconox Inc.: White Plains, NY, USA, 2006. [Google Scholar]
  10. Tsai, W.-T. An overview of health hazards of volatile organic compounds regulated as indoor air pollutants. Rev. Environ. Health 2019, 34, 81–89. [Google Scholar] [CrossRef]
  11. Yadav, R.; Pandey, P. A Review on Volatile Organic Compounds (VOCs) as Environmental Pollutants: Fate. Int. J. Plant Environ. 2018, 4, 14–26. [Google Scholar] [CrossRef]
  12. Hasana, N.H.; Saidb, M.; Leman, A. Health effect from Volatile Organic Compounds and Useful Tools for Future Prevention: A Review. Int. J. Environ. Eng. Sci. Technol. Res. 2013, 1, 28–36. [Google Scholar]
  13. Pettigrew, L.; Nghiem, L.D. Aqueous cleaning of manufactured parts/components: Establishing the role of solution quality. Int. J. Sustain. Manuf. 2011, 2, 127–140. [Google Scholar] [CrossRef]
  14. Pervan, A.; Grilly, J.; Lim, S.; Kaiser, R. Reduction of cleaning and verification times for an aqueous based process by on-line monitoring. In Particles on Surface: Detection, Adhesion and Removal; CRC Press: Boca Raton, FL, USA, 2002. [Google Scholar]
  15. Li, M.; Liu, W.; Short, T.; Qing, X.; Dong, Y.; He, Y.; Zhang, H.-C. Pre-treatment of remanufacturing cleaning by use of supercritical CO2 in comparison with thermal cleaning. Clean Technol. Environ. Policy 2015, 17, 1563–1572. [Google Scholar] [CrossRef]
  16. Losev, A.; Bychkov, I.; Selezneva, A.; Shendryk, V.; Shendryk, S. Cleaning of Parts with Detonating Gas Mixtures. In Proceedings of the Advanced Manufacturing Processes III, Odessa, Ukraine, 7–10 September 2021. [Google Scholar]
  17. Ouyang, J.; Mativenga, P.; Goffin, N.; Liu, W.; Liu, Z.; Mirhosseini, N.; Jones, L.; Woolley, E.; Li, L. Energy consumption and performance optimisation of laser cleaning for coating removal. CIRP J. Manuf. Sci. Technol. 2022, 37, 245–257. [Google Scholar] [CrossRef]
  18. Bonacchi, D.; Rizzi, G.; Bardi, U.; Scrivani, A. Chemical stripping of ceramic films of titanium aluminum nitride from hard metal substrates. Surf. Coatings Technol. 2003, 165, 35–39. [Google Scholar] [CrossRef]
  19. Máša, V.; Horňák, D.; Petrilák, D. Industrial use of dry ice blasting in surface cleaning. J. Clean. Prod. 2021, 329, 129630. [Google Scholar] [CrossRef]
  20. Spur, G.; Uhlmann, E.; Elbing, F. Dry-ice blasting for cleaning: Process, optimization and application. Wear 1999, 233–235, 402–411. [Google Scholar] [CrossRef]
  21. Onofre, A.; Godina, R.; Carvalho, H.; Catarino, I. Eco-innovation in the cleaning process: An application of dry ice blasting in automotive painting industry. J. Clean. Prod. 2020, 272, 122987. [Google Scholar] [CrossRef]
  22. Tan, W.; Tan, K.; Tan, K. Developing high intensity ultrasonic cleaning (HIUC) for post-processing additively manufactured metal components. Ultrasonics 2022, 42, 7–13. [Google Scholar] [CrossRef]
  23. Awad, S.; Nagarajan, R. Chapter 6—Ultrasonic Cleaning. In Developments in Surface Contamination and Cleaning; William Andrew: La Jolla, CA, USA, 2010; pp. 225–280. [Google Scholar]
  24. Roberts, P.M.; Venkitaraman, A.; Sharma, M.M. Ultrasonic Removal of Organic Deposits and Polymer-Induced Formation Damage. SPE Drill Complletion 2000, 15, 19–24. [Google Scholar] [CrossRef]
  25. Kashkoush, I.; Busnaina, A.; Kern Jr, F.; Kunesh, R. Ultrasonic Cleaning of Surfaces: An Overview. In Particles on Surfaces 3; Springer: Boston, MA, USA, 1991; pp. 217–237. [Google Scholar]
  26. Fuchs, F. Ultrasonic cleaning and washing of surfaces. In Power Ultrasonics; Woodhead Publishing: Cambridge, UK, 2015; pp. 577–609. [Google Scholar]
  27. Jayasankar, D.C.; Tröster, T.; Ellouz, M.; Kordisch, T. Intrinsic production of metal-carbon fiber reinforced plastic hybrid shafts using vacuum-assisted resin transfer molding. J. Compos. Mater. 2025, 59, 1721–1735. [Google Scholar] [CrossRef]
  28. Shojaei, A.; Ghaffarian, S.R.; Karimian, S.M.H. Modeling and simulation approaches in the resin transfer molding process: A review. Polym. Compos. 2003, 24, 525–544. [Google Scholar] [CrossRef]
  29. Silveira, K.B.V.; Alves, M.V.C.; De Medeiros, R. Advances in modeling and simulation flow dynamics in vacuum assistant resin transfer molding process for composite structures. Int. J. Adv. Manuf. Technol. 2025, 136, 5569–5579. [Google Scholar] [CrossRef]
  30. Yoon, M.; Ahn, M. Study on molding control factors to reduce void contents in manufacturing CFRP parts by HP-RTM. Compos. Part B Eng. 2025, 296, 112231. [Google Scholar] [CrossRef]
Figure 1. Cross-sectional schematic of the traditional RTM production cycle, highlighting the ultrasonic cleaning process after predefined production intervals. * Note: sealings are used only in vacuum RTM process.
Technologies 13 00354 g001
Figure 2. Geometric inserts (A–E) representing typical RTM mold cavity features for contamination study (a) Production setup, (b) Cross section view of the profiles.
Technologies 13 00354 g002
Figure 3. Process steps for sample preparation and measurement of surface roughness.
Technologies 13 00354 g003
Figure 4. (a) Frame used for manufacturing test specimen, (b) Bonded specimen with dimensions.
Technologies 13 00354 g004
Figure 5. CAD model of RTM tool with integrated transducer.
Technologies 13 00354 g005
Figure 6. Measured surface roughness (Ra) over 15 production cycles for Type 1 samples (epoxy + internal release agent) at 120 °C. Error bars represent the standard deviation of measurements.
Technologies 13 00354 g006
Figure 7. Measured surface roughness (Ra) over 15 production cycles for Type 2 samples (epoxy without internal release agent) at 120 °C. Error bars represent the standard deviation of measurements.
Technologies 13 00354 g007
Figure 8. Measured surface roughness (Ra) over 15 production cycles for Type 3 samples (polyester + internal release agent) at 120 °C. Error bars represent the standard deviation of measurements.
Technologies 13 00354 g008
Figure 9. Measured surface roughness (Ra) over 15 production cycles for Type 4 samples (polyester without internal release agent) at 120 °C. Error bars represent the standard deviation of measurements.
Technologies 13 00354 g009
Figure 10. Measured surface roughness (Ra) over 15 production cycles for Type 5 samples (epoxy + internal release agent) at 250 °C. Error bars represent the standard deviation of measurements.
Technologies 13 00354 g010
Figure 11. Measured surface roughness (Ra) over 15 production cycles for Type 6 samples (epoxy without internal release agent) at 250 °C. Error bars represent the standard deviation of measurements.
Technologies 13 00354 g011
Figure 12. (a) Test setup for compression-shear adhesion measurement, (b) force profiles for epoxy with, (c) without internal release agent.
Technologies 13 00354 g012
Figure 13. Average surface roughness (Ra) of lower and upper RTM mold halves across different cleaning stages, based on 20 measurements per surface. Error bars represent the standard deviation of measurements.
Technologies 13 00354 g013
Figure 14. Visual progression of the lower RTM mold cavity surface across different stages: contamination, (a) after first cleaning, (b) post-polishing, (c) manual contamination, (d) after second cleaning, (e) after sample production.
Technologies 13 00354 g014
Figure 15. Interlaminar shear strength of the hybrid steel-composite shaft produced after the second cleaning cycle, indicating mechanical integrity of the molded part. Error bars represent the standard deviation of measurements. Note: The carbon fibers (Torayca T300J 400 tex (6x)) was purchased from R&G Faserverbundwerkstoffe GmbH, Waldenbuch, Germany.
Technologies 13 00354 g015
Table 1. Material properties of resin systems 1.
EP 05475 + EK 05443 (100:24)
Viscosity [mPa·s]at 25 °C1200 ± 100
at 80 °C30 ± 5
at 100 °C13 ± 3
Pot Life [min]at 25 °C120 ± 10
Gel Time [sec]at 80 °C330 ± 30
at 100 °C210 ± 30
at 120 °C150 ± 30
at 140 °C90 ± 30
ENYDYNE H 68377 TAE + BUTANOX M-50 (100:1.5)
Brookfield Viscosity [mPa·s]at 23 °C390–430
Pot Life [min]at 23 °C20–25
Gel Time [min]at 23 °C22–27
1 All material property values presented are based on technical datasheets provided by the respective manufacturers.
Table 2. Material properties of release agents 1.
Mikon INT®-8010Mikon® 227 MC
TypeInternal Release AgentExternal Release
FunctionAdded into resin (only for Epoxy/Polyester)Applied to mold
Density [g/cm3]0.920.72
Flash Point [°C]2300
Recommended Dosage1.0–2.5%-
Evaporation/Cure TimeMixed into resin, no separate cure30 min minimum before molding
1 All material property values presented are based on technical datasheets provided by the respective manufacturers.
Table 3. Material properties of tools used 1.
PEEK 71566W 1.2085 Steel
Material TypePolyetheretherketone (PEEK)Pre-hardened martensitic stainless steel
Density [g/cm3]1.327.73
Tensile Strength [MPa]91~950–1100
Elongation at Break [%]11~10
Elastic Modulus [GPa]4.21~207
1 All material property values presented are based on technical datasheets provided by the respective manufacturers.
Table 4. Requirements for the cleaning method.
No.RequirementValue/Data
1Duration of cleaning<120 min
2Removal of existing macroscopically visible surface contamination>80%
3Deviation in free surface energy/roughness compared to initial state<20%
4Occupational safety in handling the cleaning medium/vaporsCompliance with GSV regulations (e.g., workplace concentration)
Table 5. Requirements for the cleaning machine.
No.RequirementValue/Data
1Weight of the cleaning attachment<100 kg
2Total duration of cleaning and preparation<150 min
3Service life of the bath seal>20 cycles
4Disassembly/reworking of the toolNot required
5Option to rinse off cleaned particlesRequired
6Option to discharge introduced mediaRequired
Table 6. Cleaning solution composition and operational parameters.
No.Solution TypeComposition (Molar Ratio)Cleaning ModeUltrasonic PowerDurationTemperatureNotes
1Citric Acid + Acetone1:2Continuous 700 W30 min70 °CComplete cleaning, but minor surface damage (spherical etching)
2Benzyl Alcohol + Water1:3Pulsed 350 W3 × 1 min (with 10 min pause)70 °CEffective cleaning, no surface damage, slight residue at cavity top
Disclaimer/Publisher’s Note: The statements, opinions and data contained in all publications are solely those of the individual author(s) and contributor(s) and not of MDPI and/or the editor(s). MDPI and/or the editor(s) disclaim responsibility for any injury to people or property resulting from any ideas, methods, instructions or products referred to in the content.