Abstract
Wireless sensor networks have become a vital technology that is extensively applied across multiple industries, including agriculture, industrial operations, and smart cities, as well as residential smart homes and environmental monitoring systems. Security threats emerge in these systems through hidden routing-level attacks such as Wormhole and Sinkhole attacks. The aim of this research was to develop a methodology for detecting security incidents in WSNs by conducting real-time analysis of Wormhole and Sinkhole attacks. Furthermore, the paper proposes a novel detection methodology combined with architectural enhancements to improve network robustness, measured by hop counts, delays, false data ratios, and route integrity. A real-time WSN infrastructure was developed using ZigBee and Global System for Mobile Communications/General Packet Radio Service (GSM/GPRS) technologies. To realistically simulate Wormhole and Sinkhole attack scenarios and conduct evaluations, we developed a modular cyber–physical architecture that supports real-time monitoring, repeatability, and integration of ZigBee- and GSM/GPRS-based attacker nodes. During the experimentation, Wormhole attacks caused the hop count to decrease from 4 to 3, while the average delay increased by 40%, and false sensor readings were introduced in over 30% of cases. Additionally, Sinkhole attacks led to a 27% increase in traffic concentration at the malicious node, disrupting load balancing and route integrity. The proposed multi-stage methodology includes data collection, preprocessing, anomaly detection using the 3-sigma rule, and risk-based decision making. Simulation results demonstrated that the methodology successfully detected route shortening, packet loss, and data manipulation in real time. Thus, the integration of anomaly-based detection with ZigBee and GSM/GPRS enables a timely response to security threats in critical WSN deployments.
1. Introduction
The importance of wireless sensor networks (WSNs) in modern cyber–physical systems cannot be overstated as they are utilized in industrious facilities, smart cities, agriculture, healthcare, and in monitoring the environment. Regardless of their advantages, the architecture and the resources contained within WSNs their computing and energy, as well as their dynamic topology are prone to a multitude of threats, especially network-level cyberattacks.
Wormhole, Sinkhole, Sybil, Denial of Service (DoS), Spoofing, and Man-in-the-Middle (MITM) attacks are frequently exposed to WSN infrastructures [1]. These attacks can compromise various components of the network infrastructure, such as routing paths, data integrity, and node availability, potentially leading to partial disruptions or complete system failure. Moreover, the integration of Internet of Things (IoT) devices has expanded the attack surface, increasing vulnerability [2]. WSNs face their most severe security threat from Wormhole attacks because these attacks establish hidden tunnels between malicious nodes to modify routing paths secretly. Through this method, the attack alters the routing path and timing of packets but maintains the packet content unaltered, which traditional security solutions cannot detect [3]. To counter complex routing-level attacks in WSNs, adaptive machine learning (ML) and deep learning (DL) methods are used to detect anomalies. Models like Support Vector Machines (SVMs), Convolutional Neural Networks (CNNs), Long Short-Term Memory (LSTM), and Transformers show high accuracy in identifying malicious traffic in real time [4,5,6]. The research community investigates game theory-based [7] approaches, genetic algorithms [8], and energy-efficient trust models [9] as promising methods to reduce attack risks. The detection of cyberattacks benefits from heuristic methods [10] and ML-based traffic analysis techniques [11].
WSNs face a particular risk from Sinkhole attacks due to their distributed structure and resource limitations. An attacker executes Sinkhole attacks by taking control of either a single sensor network node or the base station to direct all information traffic toward the malicious destination. The network performance experiences severe degradation because this attack results in data interception, network disruption, reduced throughput, increased latency, and message loss [12]. Network security measures use trust-based mechanisms to identify Sinkhole attacks through the examination of node actions and communication behavior. These mechanisms generate trust ratings for nodes by analyzing parameters which include delivery ratios together with latency and energy consumption. Nodes which receive low trust scores become marked as suspicious entities. The first stage of a two-stage trust-based approach determines suspicious nodes, while the second stage validates their harmful actions. Sinkhole attack detection benefits from ML methods as one of its main detection approaches. The models learn data patterns to recognize both regular patterns along with security threats [13,14,15]. The implementation of WSN systems faces multiple obstacles when it comes to Sinkhole detection and prevention. The limited resource capabilities of sensor nodes in terms of energy and memory and computational power prevent the use of advanced algorithms [16]. The stability of trust models together with ML systems faces challenges when nodes continuously enter or exit WSN systems due to their dynamic network topology. Real-time attack detection in large-scale networks demands scalable and computationally efficient solutions [17]. Various strategies must be implemented to decrease energy usage in addition to the present ones. Sinkhole attacks require evaluation when compared to other routing protocols [18]. ZigBee demonstrates high energy efficiency and a flexible network topology, while GSM/GPRS provides wide area coverage and supports long-distance data transmission [19].
The combined implementation of these technologies enhances the real-time responsiveness to network security incidents [20,21,22]. The combination of these two communication systems enables networks to better handle security incidents through real-time response [23]. The WSNs operating on GSM/GPRS protocols ensure reliable data transmission for sensor nodes located in remote areas across extensive coverage zones [24].
The research focuses on developing a systematic approach for monitoring Wormhole and Sinkhole attacks in WSN systems which use ZigBee and GSM/GPRS technology for real-time detection. The study involves constructing attack models followed by traffic and topology impact analysis and the development of new algorithms, together with architectural solutions to strengthen network dependability.
The aims of this research are as follows:
- -
- To analyze the role of WSNs in cyber–physical systems and examine Wormhole and Sinkhole attacks.
- -
- To develop a real-time detection method for these attacks.
- -
- To experimentally validate the proposed approach.
The contributions are as follows:
- –
- A real-time detection algorithm for early identification of Wormhole and Sinkhole attacks in WSNs is developed.
- –
- Realistic Wormhole and Sinkhole attack scenarios are simulated using ZigBee and GSM/GPRS protocols.
- –
- An anomaly-based detection method is implemented by comparing routing behavior under normal and attack conditions.
- –
- Network performance metrics, including hop counts, latency, false data ratios, and route integrity, are evaluated.
The results show that our methodology successfully detects and mitigates Wormhole and Sinkhole attacks in real time, ensuring data integrity, minimizing packet loss, and maintaining stable network performance in WSN environments. The proposed framework achieves early detection with minimal energy and computational overhead, making it suitable for real-world WSN deployments in resource-constrained environments.
2. Related Work
Due to constrained energy, computation, and storage capacities, WSNs are susceptible to multiple types of cyberattacks, particularly in the routing and application layers. Common routing-layer attacks include Sinkhole, Wormhole, Sybil, Spoofing, DoS, and MITM attacks [25,26]. These attacks often begin by manipulating routing protocols, such as redirecting traffic or injecting malicious paths, which weakens the network structure and facilitates subsequent compromises at the application layer, such as data falsification or unauthorized access to sensed information. As a result, not only are individual sensor nodes affected, but the integrity of the entire WSN infrastructure and its service to end users can be severely compromised.
Among the main types of attacks, Wormhole attacks pose a high-level threat to WSNs that operators find challenging to detect. Targeting WSNs, routing attacks focus on the routing protocols used within the system [27]. A common routing attack is the Black Hole attack, where a malicious node falsely advertises having the shortest path to the destination and subsequently drops all the intercepted packets [28]. The Gray Hole attack is similar, but selectively drops only some of the packets [29]. Bhatti D. S. et al. [30] explain that in a Wormhole attack, a tunnel is established between two malicious nodes, allowing them to bypass the standard routing path. The Sinkhole attack research by Faris, M. et al. [31] examines how a malicious node spreads false routing data to draw traffic from neighboring nodes. Network-layer attacks focus on the communication protocols which operate within wireless sensor network (WSN) systems. Hammi B. et al. [32] describe the Sybil attack as a method in which a malicious node forges multiple false identities to impersonate legitimate nodes, thereby disrupting the network. Similarly, the research conducted by De Neira, A. B. et al. [33] explains how DoS attacks work to exhaust network resources and disrupt communication. Flooding attacks create network congestion through excessive data transmission [34], and Selective Forwarding attacks work by dropping critical packets selectively [35]. Physical-layer attacks focus on attacking the physical elements of wireless sensor networks. Jamming attacks interfere with wireless communication through the introduction of harmful signals into the network [36].
The Wormhole attack method establishes a pathway between two malicious nodes, which allows them to move information throughout the network beyond its normal communication route. The attackers gain control over the network traffic by modifying or dropping data packets, resulting in major communication failures. Firstly, Wormhole attacks distort routing, redirecting traffic incorrectly and leading to poor routing decisions and network fragmentation. Secondly, they compromise data integrity, as malicious nodes can alter or delete sensitive information, undermining network reliability. Thirdly, they lead to increased energy consumption, since repeated transmissions drain the energy of sensor nodes more rapidly. Similarly, the Sinkhole attack is also regarded as one of the most dangerous threats to WSNs, as it directly affects network routing, reliability, and data security. It is particularly stealthy, often bypassing traditional security mechanisms undetected [37,38,39,40,41].
Therefore, timely detection and analysis of security incidents in WSNs is essential to maintaining network integrity, and various methods have been proposed to detect such attacks. WSNs are increasingly adopting objective and systematic emergency response strategies that focus on attack prevention, rapid diagnosis, and effective mitigation to reduce system degradation. Trust-based schemes prevent attacks by excluding from the routing any malicious nodes that have low trust values. In WSNs, minimizing energy consumption is essential for sustaining the network over extended periods. Techniques for power optimization contribute to the long life of the batteries powering sensor nodes. For example, the method proposed by Shahid et al. [42] demonstrates 100% delivery and detection rates while maintaining low energy consumption. Protocol-specific methods often involve rule-based systems that classify traffic as normal or malicious. These systems can quickly identify anomalies without the computational burden of ML models when traffic is normal.
Table 1 presents a summary of the existing research landscape on IIoT, highlighting its advantages such as increased operational efficiency and greater cybersecurity via the incorporation of IDS into CPS with high precision. However, obstacles remain, such as the intricacies of technological integration, elevated redundancy expenses, and inadequate long-term data. The main goals continue to be reducing latency and boosting IIoT efficiency, while privacy, encryption, and scalability need thorough solutions.

Table 1.
Comparative analysis of Wormhole attack detection methods.
Table 2 presents various methods for detecting Wormhole attacks. Hop-Based Detection and Hybrid LSTM + ELM also demonstrate strong performance (98–98.4%). Although some methods lack detailed accuracy metrics, they offer advantages such as real-time detection, trust-based mechanisms, and efficient resource usage.
Table 2.
Strengths, limitations, and efficiency of Wormhole attack detection techniques in WSNs.
Various WSN methods for attack detection demonstrate different performance levels in terms of accuracy alongside energy consumption and computational requirements. Researchers have investigated multiple detection methods to detect Sinkhole attacks. The Euclidean distance method calculates the distance between base stations and nodes to detect attacks [49]. Trust-based detection systems work by matching observed routing behavior against transmission patterns to detect malicious nodes [50]. An assessment revealed that the unified network and MAC layer data integration system decreased energy usage while providing better security control [51]. Power and memory and computational constraints in WSN devices restrict the operational use of robust algorithms [52]. The detection approaches need continuous monitoring combined with communication to work effectively, which leads to higher power usage and prevents their implementation in extensive and mobile network environments. The widespread application of certain methods requires additional hardware, real-time synchronization, and processes that heavily consume communication channels, which poses limitations for resource-constrained systems.
The security and data reliability of WSNs relies heavily on detecting Wormhole and Sinkhole attacks. The implementation of ML-based anomaly detection techniques alongside energy-efficient strategies demonstrated success in WSN systems, yet resource limitations and power requirements and scalability problems persist.
3. Methodology for Detection and Analysis of Security Incidents in WSNs
The comprehensive methodology we propose for detecting and analyzing security incidents in wireless sensor networks enhances the level of protection in WSNs.
This is achieved through the following objectives:
- (1)
- Maximizing the proportion of successfully detected incidents among all incidents that occur within a specific time interval, ∆t.where is the efficiency metric of incident detection using methodology within a specific time interval, ∆t, and where is the set of all considered methodologies.
- (2)
- Minimizing the number of false-positive security incidents detected within the ∆t time interval:where is the false-positive incident function or overall error function for methodology within the time interval ∆t and represents the set of methodologies aimed at minimizing this function.
- (3)
- Minimizing the communication and computational resource consumption of WSN nodes allocated for security incident detection and analysis, along with the overall costs required to achieve the objectives of the methodology.
To address these objectives simultaneously, a multi-criteria optimization problem is applied. It consists of the following stages:
- –
- In the first stage, the solution space is narrowed using the Pareto optimization method, where the Pareto front is determined for the specific WSN configuration, i.e., the set of Pareto-optimal solutions that cannot be improved in one criterion without worsening another.
- –
- A combined objective function is constructed by assigning weight coefficients based on the importance of various criteria in the second stage. The minimization of communication and computational resource usage by WSN nodes at discrete time points within the interval ∆t is calculated as follows:
- -
- is the resource consumption in normal operating mode (e.g., communication, computation, and energy);
- -
- represents the resources used during incident processing;
- -
- is the set of discrete time intervals;
- -
- is the set of methodologies.
imp is a function which modifies the initial resource vector, , to produce an updated vector, . The function performs a reassessment of resource distribution through the evaluation of security risks and threat elements.
This expression reflects the relative increase in resource load over the time interval for each methodology . In other words, it shows how much additional load is imposed on the system compared to normal consumption. The goal is to minimize this overhead, meaning to reduce the worst-case scenario of how much extra resource burden the incident detection process introduces into the system.
denotes the set of ∆t. Each ∆t represents a sequence of discrete time moments, based on which measurable indicators are calculated. The quantities and are normalized average vector values, adjusted using importance coefficients specific to the scenario. This normalization is performed within the range (0, 1), where 1 indicates maximum resource consumption.
The value of resource consumption is calculated as follows:
where
- -
- is the next iteration of the resource consumption vector;
- -
- is the normalized value of the communication resource;
- -
- is the normalized value of the computational resource;
- -
- is the normalized value of the energy resource.
Using this formula, the next iteration values of (communication), (computation), and (energy resources) can be calculated. Here, represents the importance coefficient of the respective resource, and is the sum of all importance coefficients used for normalization. This approach allows for uniform processing of different resource types and facilitates automation of coding, analysis, and computation tasks.
The algorithm for transforming these coefficients is implemented based on known vulnerabilities of the hardware–software components of the wireless network. Such data can be obtained from open-source vulnerability databases, for example:
- -
- Hardware and software characteristics receive identification through the Common Platform Enumeration (CPE);
- -
- The Common Vulnerabilities and Exposures (CVEs) function to explain vulnerabilities;
- -
- The Common Attack Pattern Enumeration and Classification (CAPEC) maintains a database that explains various attack patterns [53].
The system retrieves two specific values from the CAPEC database for every vulnerability which meets these particular requirements.
The database provides two specific values for every vulnerability which meets these specific criteria:
Likelihood_Of_Attack—this measurement determines the chance that an attack will occur; the Typical_Severity evaluation determines the seriousness of the vulnerability. The classification system uses three levels of severity, which are High, Medium, and Low before converting them to 1, 0.66, and 0.33, respectively.
The methodology uses a one-time process to compute importance coefficients. In practical situations, organizations should extend the number of iterations to incorporate multiple vulnerability types and particular CPE matches.
The process determines the importance coefficient for communication resources by analyzing certain attack patterns: CAPEC-216 for communication channel manipulation, CAPEC-192 for protocol analysis, and CAPEC-117 for interception.
The analysis of computational resources determines the following importance coefficients: CAPEC-20 for encryption brute forcing, CAPEC-49 for password brute forcing, and CAPEC-97 for cryptanalysis.
The evaluation of energy resources leads to the following importance coefficients: CAPEC-604 for Wi-Fi jamming, CAPEC-124 for shared resource manipulation, and CAPEC-233 for privilege escalation.
The determination of importance coefficients involves the use of specific mathematical equations:
where represents the number of vulnerabilities related to communication, computation, and energy resources; is the average attack likelihood (Likelihood_Of_Attack) for the resource; and is the average severity level (Typical_Severity) of the corresponding vulnerabilities.
The basic requirements for the methodology are illustrated in Figure 1. These foundational elements represent essential capabilities that the proposed detection framework must fulfill to operate reliably and adaptively in real-world WSN environments.
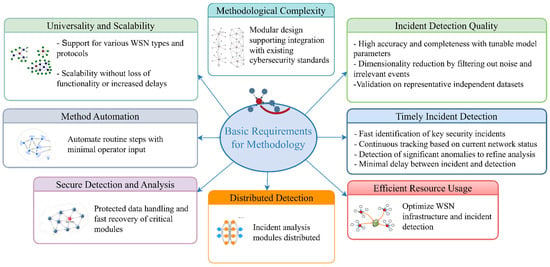
Figure 1.
Basic requirement types for the methodology.
The fulfillment of these requirements contributes to the development of a reliable and adaptable methodology for detecting and analyzing security incidents in WSNs. Such a methodology can adapt to evolving conditions and threats depending on the operational characteristics of specific WSNs. The main stages of the proposed methodology are illustrated in Figure 2.
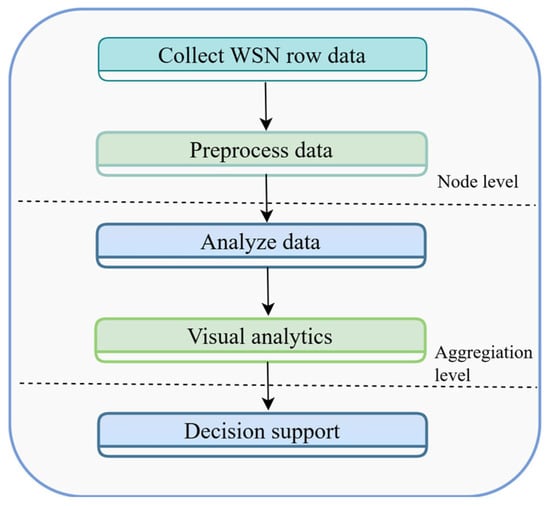
Figure 2.
Main stages of the methodology for detecting and analyzing security incidents in WSNs.
The proposed architecture is designed to be protocol-agnostic by operating primarily at the data abstraction layer. This means that regardless of the underlying communication protocol (e.g., ZigBee, Bluetooth, or GSM/GPRS), the system processes incoming data using a standardized preprocessing and analysis pipeline. Thus, the framework can integrate data from heterogeneous WSNs, provided the data formats are converted to a compatible input structure.
Figure 2 shows the five main stages of the WSN security incident detection methodology in the form of an Algorithm 1. The initial step includes data collection through sensor and device networks to acquire both static and dynamic information. Dynamic data refers to time-varying parameters that are continuously collected from sensor nodes in real time (e.g., temperature, hop count, and packet arrival time). These data are cleaned and normalized during the pre-processing stage. Anomaly detection is performed based on the 3-sigma rule. During the experiments, the temperature sensor data were found to be the most reliable, as they showed clear deviations during attack (e.g., when changed to 80 °C by Spoofing) and closely matched the ground truth data. This is described in detail in Section 4.1.1. The following stage involves data preprocessing by cleaning and filtering and organizing for normalization to establish a single data format, i.e., data cleaning refers to the removal of corrupted, incomplete, or inconsistent data entries collected from sensor nodes. The results are analyzed visually to discover attack patterns. The implementation of countermeasures along with network operation restoration requires appropriate decision making. The implementation of these structured stages produces significant improvements in WSN security protection.
| Algorithm 1. WSN Security Incident Detection Algorithm |
| Input: —WSN graph, where is the set of nodes and is the set of network connections; —static data, including, —protocols and security policies; —dynamic data that change over time (e.g., sensor readings, logs, and traffic). Output:
|
Step 1. Data Collection
Static data:
Dynamic data:
Step 2. Preprocessing
Normalization:
Dimensionality reduction: .
Step 3. Incident Analysis
Incident detection:
Minimizing false alerts:
Resource consumption calculation:
Step 4. Visual Monitoring and Analysis
Graph-based representation of routes .
—anomaly.
Step 5. Decision Making
Risk assessment:
Action:
- –
- Add a backup route for ;
- –
- Update policy from ;
- –
- Analyze logs: .
Multi-objective optimization:
The data obtained from WSN nodes are divided into static and dynamic data. Static data are values that do not change over time (node IDs, hardware characteristics, and initial configurations). Dynamic data are parameters that are constantly changing in real time (temperature, hop count, latency, etc.). Incident detection is based on the 3-sigma rule (μ ± 3σ). The dynamic indicator represents the number of anomalies related to a particular attack type (Ri). For example, in a Wormhole attack, the hop count increases sharply, while in a Sinkhole attack, the traffic is concentrated on a single node. Although ML methods are not used, predefined thresholds based on attack behavior are used. This makes the system efficient and lightweight in resource-constrained WSNs.
Threat model
The following capabilities are assumed for attackers: an attacker can capture one or more legitimate sensor nodes; two or more malicious nodes can interact and create a covert channel (e.g., a Wormhole tunnel); malicious nodes can route, modify, or drop packets; an attacker can attempt to manipulate traffic using false metrics (e.g., shortest path); an attacker does not control the entire network, but seeks to degrade performance or intercept data by strategically influencing network traffic. This threat model allows us to consider a wide range of attack scenarios.
The attacker is considered an internal node with legitimate cryptographic keys. For this reason, such attacks do not aim to break encryption algorithms but rather exploit weaknesses in routing logic and network behavior, which are often beyond the scope of cryptographic protection. For example, in a Wormhole attack, the attacker tunnels packets without decrypting them, thereby disrupting routing decisions. In a Sinkhole attack, the malicious node advertises attractive routing metrics to attract more traffic, but this does not violate the encryption rules.
We emphasize that unlike existing approaches, which either rely on resource-heavy ML/DL models or simulate attacks in purely software-based environments, our contribution integrates a multi-objective optimization framework with hardware-in-the-loop anomaly detection using ZigBee and GSM/GPRS in a modular cyber–physical system. This combination is novel in its lightweight, real-time response capability under constrained WSN conditions and does not require training data, making it highly suitable for real-world deployments.
Table 3 presents a comparative evaluation of existing routing attack detection methods for WSNs. The analysis reveals that traditional methods such as Hop-Based Detection and Rule-Based IDS offer lightweight, energy-efficient solutions but lack flexibility or robustness against sophisticated threats. ML approaches provide higher detection accuracy yet require intensive computation and training data, making them less suitable for deployment in constrained WSN environments. The proposed method integrates a hardware-in-the-loop design with multi-objective optimization and 3-sigma anomaly detection, enabling lightweight, real-time operation without the need for prior training.
Table 3.
Comparison of detection methods for routing attacks in WSNs.
4. Results
This section outlines the main findings achieved through the proposed methodology and consists of the following: a comparative analysis between regular path operations and Wormhole attack paths in WSNs; the development of a detection model for data alterations and losses in attack environments; the description of an anomaly detection method which identifies routing and data integrity attacks in WSN systems; the description of a detection algorithm which identifies anomalies within system attacks; an account of the establishment of Sinkhole attacks in WSNs together with their hardware–software architecture.
4.1. Alghorithm
Problem Statement: Normal routing and Wormhole attack routing in WSNs should be compared while developing models which detect data manipulation and loss during attacks.
Input Data:
Set of nodes: .
Normal communication links (edges):
Wormhole attack link (malicious channel): .
Step 1: Node Identification and Graph Construction
A graph is constructed, where all nodes and initial (normal) edges are added.
In normal mode, the shortest route is identified as .
Step 2: Sensor Data Generation
At each node, temperature values are simulated using a normal distribution, :
Stage 3: Packet Transmission Modeling
Each intermediate node i forwards the packet to the next node.
In the absence of an attack, data are delivered unchanged (action = forwarded).
During a Wormhole attack: manipulates the data and replaces them with false values (80.0 °C) → Spoofing, drops the packet in 30% of cases → Denial of Service (DoS):
Step 4: Route During Wormhole Attack
After the additional edge is introduced, the shortest route changes to .
This reduces the hop count from 4 to 3, and since ZigBee tends to select the shortest path, the malicious route is preferred.
4.1.1. Modeling
Normal Sensor Data:
The temperature, , at a given node is sampled from a normal distribution: .
Spoofing: .
DoS: A given packet is dropped under the following condition:
Route Length (hop count):
Under normal condition: ;
Under Wormhole attack: ;
Attack effectiveness: .
Figure 3 clearly illustrates how the attack affects routing and explains why the malicious path becomes attractive for the network.
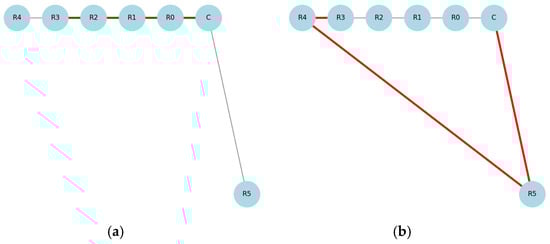
Figure 3.
(a) Data transmission under normal conditions along the route (green line). (b) The shortened route during a Wormhole attack: (red line), where R4 and R5 are malicious nodes.
Research shows how Wormhole attacks impact routing functions and data assurance in wireless sensor networks. A network performance decline results when data interference occurs, which demonstrates the vital need for early detection of security threats.
4.1.2. Analysis
The researchers provide diagrams to analyze the Wormhole attack impact on network performance. Below, we present visualizations which display simulation outcomes that show routing path details and data integrity effects and help evaluate system reliability under hostile conditions. Figure 4 compares the hop count between the normal routing path and the path taken through the Wormhole. The reduction in hop count along the Wormhole path demonstrates how an attacker can influence decision making by exploiting cost metrics.
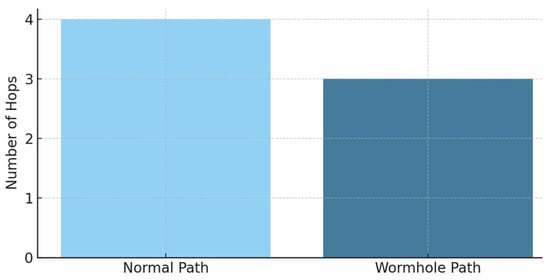
Figure 4.
Comparative hop count in WSN routing.
Figure 5 compares the original and altered sensor readings during data transmission across the network. This demonstrates how the attacker at node can modify legitimate values and produce false outputs.
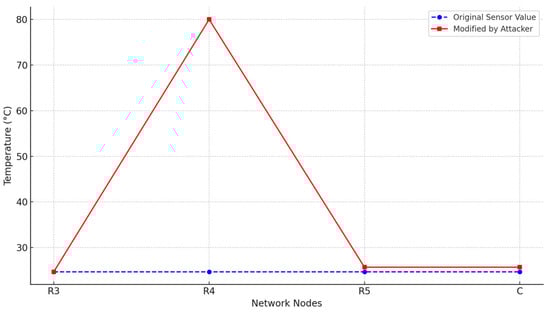
Figure 5.
Sensor value integrity through Wormhole route.
Figure 6 presents a histogram of actions performed on data packets along the Wormhole route. This figure illustrates the frequency of packet forwarding, modification, and dropping actions to highlight the impact level of the attack.
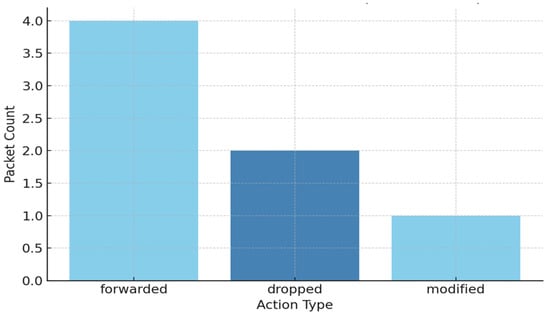
Figure 6.
Packet handling frequency under Wormhole attack.
Reducing the hop count by 1 may seem small visually, but in a real network it makes a big difference. Nodes choose the shortest path, and the attacker receives more traffic. This leads to energy imbalance, data loss, network corruption, and topology instability. In the future, it is planned to expand the simulation to demonstrate these effects.
4.2. Anomaly-Based Detection of Routing and Data Integrity Attacks in WSN Systems
Our study implemented a basic anomaly detection method to investigate Wormhole attacks in WSN systems. The detection mechanism works by searching for inconsistencies in packet delivery patterns and monitoring sensor information integrity. The detection method uses established security thresholds with specific domain heuristics to identify potential security breaches. The network experiment measured the temperature sensor readings of each node by using a Gaussian distribution with a mean of 25 °C and a standard deviation of 2 °C. The detection system uses the 3-sigma rule to identify anomalies because any value which surpasses three standard deviations from the mean gets marked as questionable. The researchers also developed a simulation to examine how malicious nodes would behave through data tampering actions along with selective packet elimination.
Through its simulation function, node takes on the role of a Spoofing agent that manipulates sensor readings to show 80 °C values. Node performs packet drops with a success rate of 30%, which imitates a DoS impact. Each data transmission action from node to the coordinator is logged, recording the sender, receiver, data value, type of action, and whether an anomaly was detected. Figure 7 illustrates this route, with packets containing anomalies shown in red. The figure clearly distinguishes between normal transmissions and cases where data integrity violations were detected.
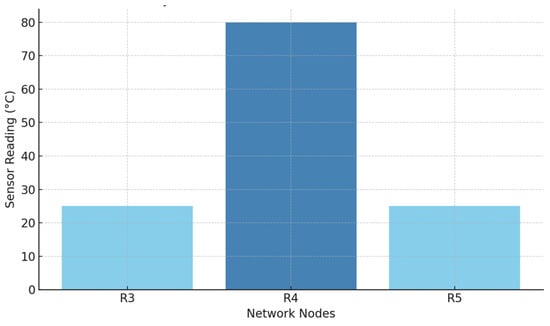
Figure 7.
Anomaly detection on sensor transmission path.
Applying this detection model provides an important analytical capability for identifying threats in WSN infrastructures that are low-power, distributed, and utilize non-traditional security monitoring methods.
Figure 8 shows the detection of discrepancies. It presents three packet delivery activities recorded along the passage of coordinator C ( and ) from node . The first and third broadcasts are labeled as forward, with related sensor readings of 24.7 °C and 24.8 °C, which is not known for general operation and no discrepancy. However, during the second transmission (–), a significant discrepancy is identified: the sensor datum was converted to 80 °C. The value is located outside the permissible range (as defined by the 3-sigma rule) and deliberately indicates data manipulation during a Wormhole attack.

Figure 8.
Anomaly detection log.
The following section details the algorithm used in this simulation, which has been used in WSNs and in discrepancy-based detection of data integrity attacks.
4.3. Anomaly-Based Attack Detection Algorithm
Aim: To simulate Spoofing and packet-dropping attacks during sensor data transmission across the network and to detect anomalies based on the 3-sigma rule.
Input data:
Nodes—;
Mean sensor value: ;
Standard deviation: ;
Anomaly threshold: .
Model:
Sensor Data Generation—The temperature value of each normal node is generated as follows:
Anomaly Detection (3-Sigma Rule)—A data point is considered anomalous if
or → anomaly.
Spoofing— replaces the actual data with a false value:
Dropping (DoS)— drops the packet with a 30% probability:
4.4. Sinkhole Attack Modeling in a WSN System
A hidden tunnel is created between nodes R4 and R5, which allows data to bypass the standard ZigBee routing paths for the Wormhole attack. Node R4 sends corrupted data (for example, a temperature value of 80 °C), while node R5 randomly drops 30% of the packets. This attack creates a shortcut in the network topology, which leads to a reduction in the number of hops and a violation of the routing logic. Anomaly detection is performed using the 3-sigma rule. During the Sinkhole attack, node R3 is configured to propagate false optimal route metrics, as a result of which most of the traffic from neighboring nodes is routed through this node. As a result, some of the redirected data are dropped, and the remaining packets are corrupted, simulating data corruption.
The simulation was performed in Python, and all network components are modeled as a directed graph. The attack parameters tunnel delay, packet drop probability, garbled values, and traffic redirection percentage were configured based on real WSN behavior patterns.
To model the impact of a Sinkhole attack in a WSN system, a network consisting of seven nodes ( and a coordinator, ) was constructed. Under normal conditions, each sensor node selects the most efficient route to reach the coordinator, , using shortest-path algorithms. As shown in Figure 9, the routing paths are formed in various directions (e.g., and ), which helps balance the network load and prevents traffic concentration at a single point.
Figure 9.
Routing paths before Sinkhole attack.
In an alternative scenario, during the attack simulation, compromised node acts as a Sinkhole, broadcasting false information that makes it appear as the most efficient route to the coordinator. As a result, nodes begin routing their data through . This leads to a change in network topology (see Figure 10). Such a change concentrates network traffic around the malicious node, allowing the attacker to either drop or modify the packets.
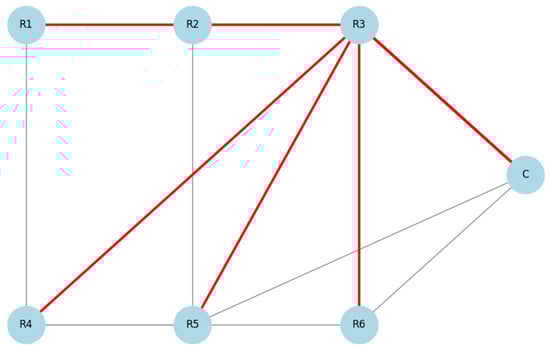
Figure 10.
Routing paths after Sinkhole attack (R3 is malicious).
Table 4 indicates that under normal conditions, all packets were successfully broadcast, and the recorded temperature values remained within the expected range (22.0–26.4 °C), demonstrating reliable and stable data transmission. For comparison, the table also presents scenarios involving various malicious activities. For instance, the coordinator ID from node R2 was spoofed in packets relayed through node R3 and replaced with a falsified temperature reading of 80.0 °C. Furthermore, packets originating from nodes R1, R4, R5, and R6 were dropped, either after passing through the compromised node or as a result of being routed in that direction.
Table 4.
Pre-attack and post-attack transmission logs.
Overall, the simulations were successful and clearly demonstrated how a Sinkhole attack disrupts the routing logic of network nodes.
The Sinkhole attack simulation algorithm
Undirected graph representing the WSNs:
where is the set of nodes and is the set of edges.
The coordinator node—;
Set of sensor nodes (data sources)—;
Malicious node—;
Routing path from source node to the sink .
Sensor data value .
Transmission log (actions performed on packets)—.
Step 1: Routing Before Attack
For each source , determine the shortest path to the sink using:
Step 2: Routing After Sinkhole Attack
After the attack, all source nodes (except the attacker itself) reroute traffic through the Sinkhole node:
Step 3: Sensor Data Generation
Sensor readings are simulated as normally distributed values:
Step 4: Packet Transmission with Attack Behavior
For each path , transmit packets along each link and log the action:
where
is the probability of dropping the packet;
is the probability of modifying the packet.
Step 5: Transmission Log Format
Each transmission is recorded as
where action ∈ {forwarded, modified, dropped}.
The proposed simulation model clearly demonstrated the impact of a Sinkhole attack on WSN network topology and data routing. Under normal conditions, each node selects the shortest path to the coordinator, enabling balanced traffic distribution and reliable data exchange. However, during a Sinkhole attack, the malicious node () falsely advertises itself as the optimal route, redirecting the traffic of other nodes toward itself. Simulation results showed that nodes altered their routing paths, transmitting data centrally through . This situation gives the attacker the ability to drop packets (DoS) or replace them with false values (Spoofing). The model demonstrated that such an attack poses a direct threat to network reliability and data integrity. Thus, to detect and prevent such attacks in WSN infrastructures, there is a critical need for implementing adaptive routing, analysis-based anomaly detection algorithms, and reinforced security policies. Moreover, the obtained results can serve as a baseline for testing defense mechanisms against Sinkhole attacks.
4.5. Hardware–Software Implementation
4.5.1. Justification of Architectural Decisions and Comparison of Alternative WSN Attack Modeling Methods
In the context of modeling network attacks in WSNs, it is crucial to create an experimental environment that closely resembles real operating conditions to ensure the reliability of research results [55]. The architecture developed in accordance with these requirements is a modular cyber–physical system focused on flexibility, scalability, and the reproducibility of attack scenarios.
The components and logical structure were selected based on the following factors:
- -
- The use of the ZigBee protocol, based on the IEEE 802.15.4 standard, ensures realistic data transmission and support for self-organizing networks and reflects typical features of industrial WSNs [56].
- -
- The combined use of Raspberry Pi single-board computers and Arduino Uno microcontrollers allows for the creation of not only simple sensor nodes but also intelligent attacker nodes with computational capabilities.
- -
- Dividing the system into sensor, network, and analytic layers facilitates traceability, simplifies error analysis, and enables easy system expansion when adding new components or attack types.
- -
- A realistic Wormhole attack scenario is implemented by establishing a covert channel over GSM/GPRS between distant nodes within a standard ZigBee network. This approach allows for realistic attacker behavior modeling and creates a type of attack that is not easily detectable using standard methods.
The integration of ZigBee and GSM/GPRS technologies in this study is driven by specific experimental and architectural requirements. ZigBee, standardized under IEEE 802.15.4, remains a popular choice for wireless sensor networks (WSNs) due to its low power consumption, self-organizing capabilities, and suitability for short-range communication [57]. GSM/GPRS is instead used to emulate a covert channel between two distant attacker nodes as a critical requirement for realistic Wormhole attack modeling. GSM/GPRS continues to serve wide-area reach and attack emulation applications, even though some implementations plan to discontinue its use [58]. This approach utilizes GSM/GPRS to conduct experimental evaluations which employ ZigBee nodes as valid network elements while treating the GSM/GPRS as an attacker channel bypass. The testing framework avoids using LoRaWAN or NB-IoT because these solutions require complicated hardware integration and add significant complexity to modular testbed systems [59,60].
Thus, the selected architecture is reproducible and has been experimentally verified, making it a reliable platform for research on WSN security. To justify the suitability of this architectural decision, now we examine alternative methods for modeling of WSN attacks.
Table 5 summarizes key approaches for modeling WSN attacks, comparing software simulators and hardware-based testbeds. Software platforms like NS-3, OMNeT++, and Cooja allow quick experimentation but lack realism in protocol behavior and hardware effects. Arduino- or ESP32-based testbeds offer physical deployment and low cost but struggle to support complex attacks due to limited resources. Hybrid setups combining Arduino and Raspberry Pi provide a balance between realism and computational power, though they introduce integration challenges.
Table 5.
Comparative analysis of methods for modeling WSN attacks.
4.5.2. Hardware–Software Architecture
To ensure realistic attack modeling and accurate evaluation of network behavior, the hardware–software architecture was designed and implemented by the authors as a modular cyber–physical system, which is described in this section. This architecture was selected based on its ability to balance real-time monitoring, repeatability, and compatibility with both low-power sensor nodes and intelligent attacker nodes using ZigBee and GSM/GPRS technologies.
The overall structure of cyber–physical systems
In this study, a cyber–physical system is an integrated, distributed infrastructure which integrates hardware and software components to monitor environmental parameters, collecting data and later conducting analyses (Figure 11 and Figure 12).
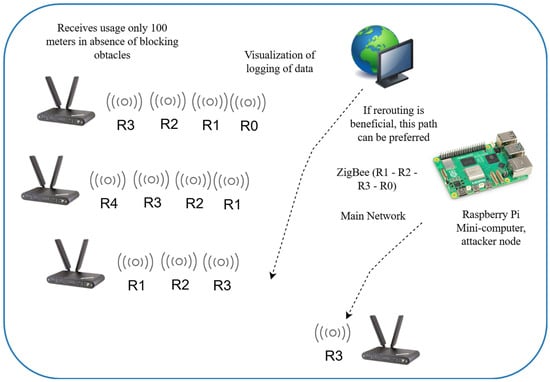
Figure 11.
Cyber–physical system.
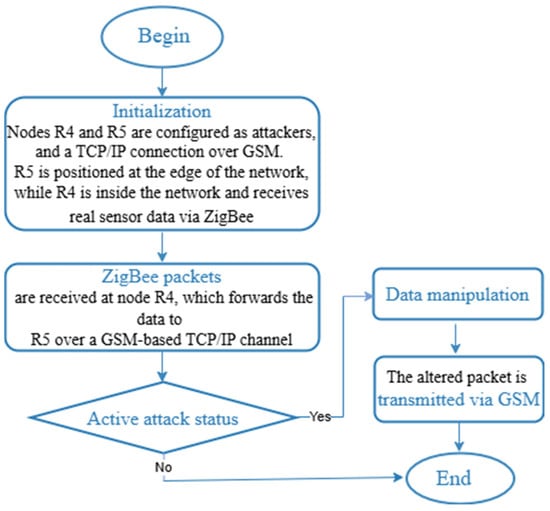
Figure 12.
Wormhole attack modeling algorithm.
The system is designed to simulate actual processes in WSNs and to repeat network-level attacks, as well as to capture and analyze their effects.
The architecture is built on a modular theory and includes three main layers: a sensor node layer, a data transmission layer (WSN), and an information processing and visual layer.
This allows for clear differences in structural separation component functions and the implementation of various operating modes and analyses of the behavior of the system.
At the first level, sensor nodes operate autonomously. Each node consists of a microcontroller (Arduino Uno or Raspberry Pi), one or more physical sensors, a wireless communication module (XBEE Series 2), and a power supply. These sensors measure environmental parameters such as temperature, humidity, and pollutant concentrations (e.g., carbon monoxide, methane, dust, etc.). The nodes are configured to transmit data to the network at predefined time intervals.
At the second level, nodes communicate with each other using the ZigBee protocol. Thanks to the embedded logic within the XBEE modules, the network is self-organizing, enabling automatic address assignment, routing, and message distribution without centralized control. This study adopts a linear topology, where each node communicates only with its immediate neighbors. This setup facilitates precise monitoring of routing behavior, particularly when targeting specific network segments. The network includes one coordinator and six routers. The coordinator is connected to a computer via USB and is responsible for managing the network and collecting data.
At the third level, data reception, processing, and visualization are performed. A personal computer connected to the coordinator via a USB interface receives the sensor data, logs them, displays them in real time, and analyzes the network status. A dashboard interface is employed to visualize sensor readings, network topology, and error or anomaly messages.
This architecture enables a complete operational cycle from physical environmental measurement to the analysis of network behavior under both normal and anomalous conditions.
At the network interaction level, R4 and R5 attacks are simulated using routers equipped with Raspberry Pi boards and GSM/GPRS modules. A covert communication channel is established between distant nodes, allowing malicious traffic to bypass legitimate routing paths. This method exposes vulnerabilities in the routing mechanism and evaluates the impact of such attacks on network security. As a result, the system becomes a viable platform for modeling the behavior of wireless sensor networks (WSNs), simulating various attack scenarios, and testing defense algorithms.
WSN Node Configuration
The WSN configuration consists of seven nodes, each fulfilling distinct roles in data collection, transmission, and processing. These nodes vary in their hardware setups, functional responsibilities, and communication capabilities. The nodes are categorized into two main types: coordinators and routers.
The coordinator is responsible for initial configuration, network setup, and overall management. It is connected to a personal computer via an XBEE USB adapter and operates in continuous reception mode, receiving data from other nodes in the network (Figure 13).
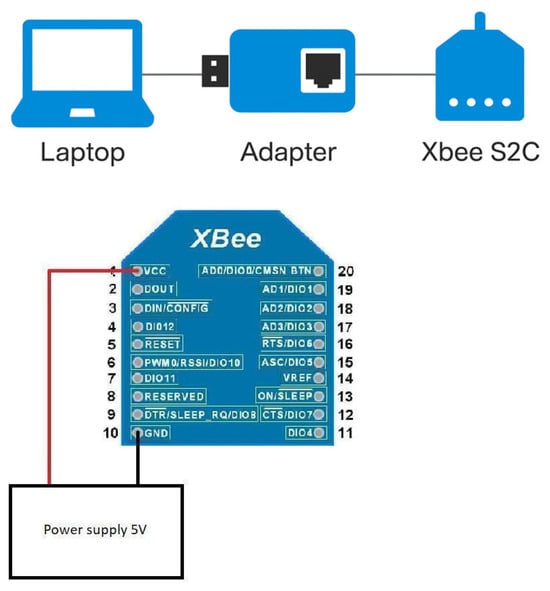
Figure 13.
WSN coordinator node diagram.
The coordinator uses a Digi XBEE Series 2 module, which is configured in API firmware mode. This configuration enables the following functionalities: setting network parameters and assigning a PAN ID (Personal Area Network Identifier), managing the routing table, and ensuring stable and reliable communication.
Data received by the coordinator are transmitted to a dedicated software application, where they are visualized and logged into system files.
The remaining six nodes function both as routers and sensor modules, enabling data forwarding as well as direct environmental data collection. Nodes R0, R1, R2, and R3 are built on Arduino Uno microcontrollers, with each node equipped with an XBEE module operating in router API mode. These nodes are outfitted with various sensors capable of measuring multiple environmental parameters, including temperature (via the DS18B20 thermometer), humidity (using DHT11 or DHT22 sensors), atmospheric pressure (with the BMP180 sensor), and air pollution (detected by MQ-7, MQ-135, and optional sensors for CO and CH4 gases). Additionally, the nodes provide an overall air quality index based on the collected data (Figure 14).
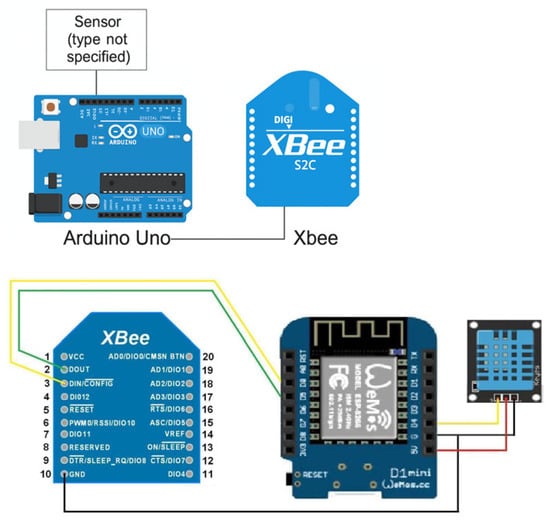
Figure 14.
Diagram of standalone nodes for traffic forwarding.
The sensors are connected through the standard Arduino interface, utilizing both digital and analog input pins. Measurements are taken at defined time intervals (e.g., every 1 s). An Arduino sketch implements an algorithm to read, format, and transmit the sensor data as a packet to the coordinator address. Data transmission is managed by the XBee module, which automatically selects the most efficient route to the coordinator based on the current network topology.
Nodes R4 and R5 serve as extended routers and include a Raspberry Pi single-board computer (version 3 or higher) (Figure 15). These nodes are also equipped with XBee modules and GSM/GPRS modules (e.g., SIM800 or SIM900). They are specifically designed to simulate Wormhole-type attacks. The Raspberry Pi devices establish a TCP/IP connection over an external mobile network between the two nodes.
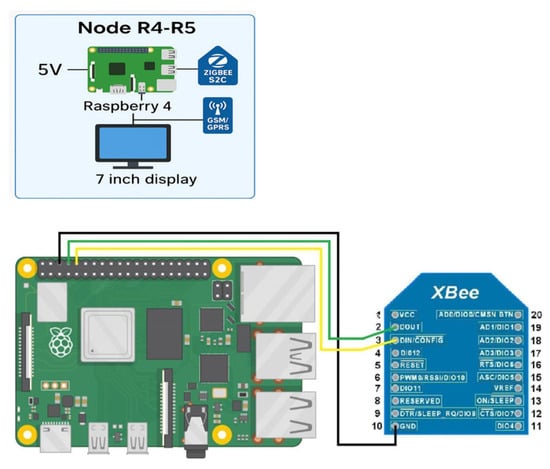
Figure 15.
Diagram of extended router ().
Custom Python 3.12.3 software used on these nodes performs the following functions:
Receives Zigbee frames via the XBee module;
Encapsulates the data in TCP packets and transmits them over the GSM/GPRS connection.
On the receiving node, TCP packets are received, the Zigbee data are extracted, and then retransmitted into the Zigbee network via the XBee module.
A covert communication channel is established that remains undetected within the standard Zigbee topology. This channel can be exploited to intercept, modify, or block network traffic. Such nodes play a crucial role in identifying network vulnerabilities and evaluating the system’s resilience to various types of attacks.
Each node in the network is powered independently either via battery or a connected power adapter, allowing for autonomous operation. This setup better reflects real-world deployment scenarios, where WSN elements may be installed in remote or difficult-to-access areas or for extended periods. The hardware and software components of each node are tightly integrated.
For microcontroller-based nodes, the XBEE Arduino Library is used to manage the XBEE module. For nodes based on the Raspberry Pi, the Digi-XBee Python Library is utilized. The system supports firmware updates, reconfiguration of network parameters, and sensor calibration. Additionally, nodes are capable of autonomously restoring communication after temporary failures a critical feature for functioning in unstable or volatile environments.
Communication protocols and node roles used in the system
The hardware–software WSN system employs Zigbee as the primary wireless communication protocol, implemented using Digi XBee Series 2 modules. Zigbee, based on the IEEE 802.15.4 standard [61], is designed to support self-organizing, fault-tolerant, scalable, and low-power networks, making it ideal for control and monitoring applications.
Zigbee follows a hierarchical network topology and supports three types of devices:
Coordinator—This serves as the central node of the network. It is responsible for initial setup, address allocation, and routing management. In the current configuration, the coordinator is connected to a PC via an XBee-USB adapter. It collects data from sensor nodes, logs them, transmits them to a monitoring dashboard, and oversees overall network performance.
- -
- Router—Intermediate nodes which relay packets between pieces of end equipment and coordinators. They can also collect data from sensors. In an experimental setup, nodes serve as routers. They are important for routing and traffic analysis, especially during Wormhole attack modeling, where the attackers try to replace the data delivery path.
- -
- Final Equipment—Inactive participants in the network who connect to the router and do not relay traffic. These devices are not used in this test, because each node should support retrosion to facilitate safety analysis and complex routing. To apply the Wormhole attack, a TCP/IP protocol is used as an additional communication channel between nodes and , operated on GSM/GPRS.
Figure 16 illustrates the hardware components used in the experimental setup. Each Arduino-based node is connected to an XBee module via UART (TX/RX) and powered either through a USB connection or an external battery. These nodes are equipped with various sensors, including temperature, humidity, and air quality sensors.
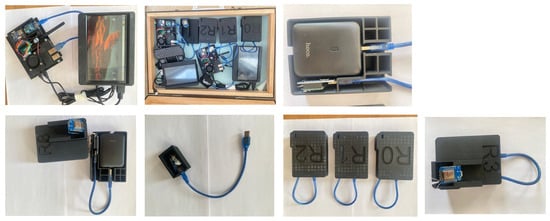
Figure 16.
Hardware component.
The Raspberry Pi is connected to an XBee module through either a USB adapter or the GPIO interface and to a GSM/GPRS module (e.g., SIM800 or SIM900) via direct connection. All seven nodes in the wireless sensor network (WSN) are equipped with XBee modules. Among them, one node functions as the coordinator (C), connected to a PC through a USB-XBee adapter, enabling data exchange, logging, and visualization.
Each sensor is connected to the Arduino via digital or analog input pins and polled at regular intervals. The collected data are transmitted via ZigBee to the coordinator node. Configuring the WSN nodes requires a detailed setup of both hardware and software components. The nodes in this experiment are divided into two types: Arduino Uno microcontroller-based nodes and Raspberry Pi single-board computer (SBC) nodes.
The following configuration elements were defined:
Key hardware and software setup parameters;
Wiring diagrams and port assignments;
Software installation procedures;
Network configuration parameters.
The Arduino IDE was used to program the microcontrollers. Before uploading the firmware, the XBee module must be temporarily disconnected to prevent UART port conflicts. Once the upload is complete, the module is reconnected.
Packets received from the XBee module over TCP are handled by a secondary Raspberry Pi, where they are unpacked and retransmitted via ZigBee. XBee modules can be configured either on a separate PC using XCTU or on a Raspberry Pi using the Digi-XBee library. After physical connection and configuration of all nodes, the coordinator automatically generates a network topology map, which can be monitored using XCTU. LED indicators were installed on nodes to indicate status (e.g., blinking when data are successfully transmitted). To enhance power stability, voltage regulators and discharge-protected batteries were used. Sensor nodes were tasked with monitoring environmental parameters. Sensors were chosen for their Arduino compatibility, stability, and ease of calibration. Signals from the sensors are polled at regular intervals, processed locally on the microcontroller, and transmitted via ZigBee to the coordinator, where data are logged and visualized through a dashboard. Sensor reliability was ensured through proper wiring, stable power supply, and robust hardware assembly.
To enable attack modeling and routing behavior analysis, communication limitations were strictly enforced. In WSNs, it is critical to manage node spacing and link stability to avoid the formation of unintended routes. ZigBee modules naturally support distances up to 100 m, which could lead to routing issues.
By combining antenna shielding, reduced transmission power, and strategic physical separation, a controlled WSN environment was created. This setup ensured correct routing behavior, prevented unintended connections, and enabled realistic modeling of network attacks such as the Wormhole attack under near-real-world conditions.
4.5.3. Experimental Results
Modeling the operation of a WSN and implementing a Wormhole attack requires careful planning and controlled placement of network nodes. Proper node deployment is essential for managing network topology, ensuring link quality, and illustrating the overall system behavior—particularly when accounting for the limited communication range of Zigbee and the possibility of artificial route formation.
To mitigate risks associated with linear topology and unintended connections, nodes were strategically deployed across a four-story office building. The experimental setup focused on the third and fourth floors, forming a real-world multi-story testbed that simulated air quality measurements (e.g., CO2, CH4, and PM levels) within a smart building infrastructure to reflect practical constraints (Figure 17).
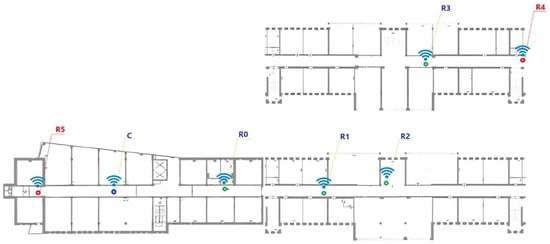
Figure 17.
Smart building infrastructure.
The key objectives of the equipment layout were as follows:
Ensure that each node communicates only with its immediate neighbors sequentially.
Prevent direct radio communication between non-active nodes.
Physically separate the attacker nodes (R4 and R5) to keep them out of each other’s signal range.
Maintain a stable power supply and protect nodes from external physical impacts.
Table 6 provides a detailed overview of the network nodes and their physical placement.
Table 6.
Network nodes and their placement.
This placement within the testbed does not guarantee the absence of a direct Zigbee connection between nodes R4 and R5, which is crucial to ensure a realistic simulation of the GSM-based tunnel. To prevent unintended Zigbee communication, XBEE antennas were wrapped in aluminum foil to create directed transmission zones. Zigbee transmission power was minimized using the XCTU tool, and node placement was strategically planned, taking into account physical barriers such as walls, doors, and furniture. Additionally, metal enclosures and partly closed doors, glass partitions, and metallic objects were employed to further influence signal attenuation and propagation.
Each node was labeled with its identifier (e.g., R1) and a temporary card containing a brief description. The Zigbee network was formed automatically using a shared PAN ID. The initial network setup was performed via the coordinator node, which managed the registration of nodes and their routing paths. Prior to launching the attack, the network topology was designed to follow a strict linear configuration using XCTU to ensure predictability and control in routing behavior.
Precise node placement was critical for modeling stable network operation, root monitoring, and the simulation of a Wormhole attack. To assess the impact of such an attack within a Zigbee-based WSN, several mitigation and isolation techniques were employed: antenna shielding, reduced transmission power, and physical separation via structural barriers such as walls and floors. These measures successfully enforced a linear network topology, which allowed clear observation of routing disruptions, delays, data loss, and value tampering through the dashboard interface and XCTU following the attack initiation.
Consequently, the hardware–software testbed clearly demonstrated the significant effects of a Wormhole attack on WSN behavior. GSM-based tunneling redirected network traffic from legitimate paths, resulting in data loss, delays, and manipulation. Observable indicators, such as increased latency, data anomalies, and routing changes, were recorded via the dashboard, reinforcing the need for an effective Intrusion Detection and Prevention System (IDS/IPS).
A key element of the system’s functionality is the firmware developed for the Arduino-based WSN nodes. These nodes are responsible for real-time data collection from various sensors and wireless communication via the Zigbee protocol using XBEE modules. The software requirements included reliability, energy efficiency, scalability, and compatibility with selected hardware components. As shown in Figure 18, each node’s firmware is composed of several logical modules that collectively ensure smooth operation within the wireless sensor network.
Figure 18.
Common architecture of firmware.
In a wireless sensor network (WSN) system, the firmware deployed on sensor nodes is fundamental to ensuring the accurate acquisition, processing, and transmission of data. This study employs a hybrid architecture utilizing Arduino and Raspberry Pi platforms, with each platform running a customized software stack optimized for its specific hardware capabilities.
For Arduino-based sensor nodes, the firmware was developed in C++ using established libraries that support low-level hardware interfacing. Sensor data acquisition is performed via the analogRead() function, with collected values transmitted to the XBEE module over the UART interface. Data packets are then encapsulated in Zigbee-compliant frames and forwarded to the network coordinator. Each transmitted message includes a unique node identifier alongside the associated sensor readings, facilitating reliable source identification and data mapping.
To improve the robustness and resilience of the system, several key mechanisms were integrated into the firmware architecture, including non-blocking execution strategies, timeout management routines, and a watchdog timer to recover from potential system hangs. While acknowledgment (ACK) support was evaluated, it remains only partially implemented due to inherent limitations in the Arduino hardware and library ecosystem.
All Arduino nodes share a unified firmware structure, with variations limited to node-specific parameters such as identification number, sensor type, and pin assignments. Firmware deployment is performed via USB interfaces, during which the connected XBEE modules are temporarily disconnected to prevent transmission conflicts. Debugging and real-time diagnostics are facilitated through the Arduino Serial Monitor and companion software tools, enabling streamlined development and testing workflows. This firmware design ensures modularity, scalability, and consistent operation across diverse WSN deployment scenarios. Raspberry Pi-based nodes provide enhanced functionality, leveraging Python programming and system utilities such as socat and pyserial. These nodes enable the establishment of tunnel communications, remote data transmission, and the execution of network-oriented attack simulations. The overall software infrastructure is supported by the XCTU tool alongside a custom-developed dashboard. These tools collectively enable efficient monitoring of network routes, real-time visualization of sensor data, and systematic evaluation of attack impacts. The modular architecture of the software allows for flexible system configuration and seamless execution of diverse simulation scenarios, as outlined in Table 7.
Table 7.
Software components of WSN nodes.
Figure 19 shows that after the attacks, the network experiences increased delay, packet loss, and false data transmission, indicating a disruption of route integrity.
Figure 19.
Comparison of network parameters before and after attacks.
Thus, Figure 19 indicates that a comparative analysis of network parameters reveals a significant difference between pre-elaborate and subsequent attack states. In particular, the hop count increased slightly after the attack, indicating that the data packet had to cross additional intermediate nodes to reach its destination. Although the routing path remained unchanged, adequate changes were observed in the delay time, suggesting that the main communication structure of the system was not directly affected. Increased results of delayed network traffic and resumed starts through the malicious node were observed. Additionally, the loss of packets increased after the attack, indicating a decline in network reliability. The ratio of fake data increased rapidly due to the attack, increasing the risk of false information infiltrating the system, and data integrity could be compromised. The Route Integrity Metric rejected the post-attack, which reflects breakdown in reliable routing. Overall, the analyzed matrix confirms that Sinkhole and Wormhole attacks have a great negative effect on WSN performance and data trustees. These changes highlight the importance of real-time security monitoring systems and initial detection of malicious activities.
During the decision support phase, appropriate action is taken in the WSN system in response to identified security events. In particular, in a WSN system designed for atmospheric air monitoring, the risks and losses caused by the attack are assessed. This involves evaluating the blockage of monitoring services due to network failure and the financial costs of restoring the infrastructure. Additionally, if the attack continues, the possible future consequences are predicted. System administrators determine potential countermeasures, such as allowing the system to continue operations in autonomous mode or implementing alternative functions. At this stage, all events are logged and documented, which provides a basis for later analysis and investigation after the event. In addition, to increase system security, the security policy is modified and updated. This also includes clearing the roles of each network node and removing excessive privileges; regarding hardware-level security, improving recovery processes after an attack; and applying excesses to important nodes and data storage systems. Overall, this phase enables rapid detection and reaction to attacks in the WSN system and contributes to the prevention of future events. Such an approach is important to ensure the safety of important infrastructure in areas such as manufacturing, healthcare, and environmental monitoring.
Overall, the functioning WSNs developed here greatly improve the accuracy and speed of detection of security events. They enable the rapid identity of both external and internal threats to increase the flexibility of WSN systems against DDOS attacks, data tampering, routing manipulation, and other malicious activities. Additionally, functioning helps prevent interruption and dangers in important applications, such as industrial facilities, medical infrastructure, and urban-scale environmental monitoring systems. Its implementation allows personnel to react rapidly to events, separate their effects, and reduce damage fully, ensuring the reliability and stability of the entire infrastructure. In addition, by depositing data on recorded events, the functioning supports prediction and prevention of future attacks, which contributes to the ongoing improvement in the cyber–physical security level of the WSN system.
5. Conclusions
This research introduces a novel cyber–physical approach that integrates hardware-in-the-loop detection with multi-objective optimization for real-time identification of attacks in constrained WSN environments. The paper presents research focused on modeling and detecting Wormhole and Sinkhole attacks in WSNs using real-time capabilities. It combines ZigBee with GSM/GPRS technologies through a modular architecture to deliver strong network attack detection capabilities under normal operational circumstances. The experimental findings established that the new detection approach successfully detected serious network threats, including reduced hop lengths, extended response times, and atypical routing patterns. A multi-stage anomaly detection framework which uses the 3-sigma rule and other techniques allowed the system to immediately detect attacks to protect data integrity and network stability. The developed methodology demonstrated success according to key performance indicators that showed a 40% decrease in hop count and a 27% increase in traffic concentration during Sinkhole attacks. The study delivers a dependable and adaptable and easily scalable security solution which protects WSNs in vital applications that include smart building and industrial automation along with environmental monitoring. Consequently, the research contributes not only a functional prototype but also lays the groundwork for future studies to develop more energy-efficient and adaptive anomaly detection frameworks suitable for increasingly complex cyber–physical systems. Future work will focus on the incorporation of machine learning techniques to enhance detection accuracy and on extending the framework’s capabilities to encompass multi-vector and coordinated attacks, thereby advancing the resilience of cyber–physical systems.
Author Contributions
Conceptualization, T.Z.; Methodology, T.Z.; Software, S.K.; Validation, L.Z.; Formal analysis, L.Z., Y.M. and S.K.; Investigation, T.Z., Y.M. and A.B.; Resources, L.Z.; Data curation, T.Z., A.B., S.K. and N.A.; Writing—original draft, T.Z.; Writing—review and editing, S.K. and L.Z.; Supervision, T.Z. All authors have read and agreed to the published version of the manuscript.
Funding
This research has been funded by the Committee of Science of the Ministry of Science and Higher Education of the Republic of Kazakhstan (Grant No. AP19680345).
Institutional Review Board Statement
Not applicable.
Informed Consent Statement
Not applicable.
Data Availability Statement
The original contributions presented in this study are included in the article. Further inquiries can be directed to the corresponding author.
Conflicts of Interest
Authors Tamara Zhukabayeva, Lazzat Zholshiyeva, Yerik Mardenov were employed by the company “International Science Complex Astana”. The remaining authors declare that the research was conducted in the absence of any commercial or financial relationships that could be construed as a potential conflict of interest.
References
- Karthikeyan, M.; Revathi, S.T. Approaches to Detecting Threats in Wireless Sensor Networks for Data Transmission Security. In Proceedings of the 2024 International Conference on Advances in Computing, Communication and Applied Informatics (ACCAI), Chennai, India, 9–10 May 2024; pp. 1–7. [Google Scholar] [CrossRef]
- Imathiu, G.; Chege, A.; Omamo, A. Security Intrusion Monitoring Model for Internet of Things (IoT) Using Sniffing Tools on Wireless Sensor Networks. AJSTSS 2024, 2, 51–58. [Google Scholar] [CrossRef]
- Zhang, K. A Wormhole Attack Detection Method for Tactical Wireless Sensor Networks. PeerJ Comput. Sci. 2023, 9, e1449. [Google Scholar] [CrossRef]
- Alshomrani, M.; Albeshri, A.; Alturki, B.; Alallah, F.S.; Alsulami, A.A. Survey of Transformer-Based Malicious Software Detection Systems. Electronics 2024, 13, 4677. [Google Scholar] [CrossRef]
- Hanif, M.; Ashraf, H.; Jalil, Z.; Jhanjhi, N.Z.; Humayun, M.; Saeed, S.; Almuhaideb, A.M. AI-Based Wormhole Attack Detection Techniques in Wireless Sensor Networks. Electronics 2022, 11, 2324. [Google Scholar] [CrossRef]
- Ataa, M.S.; Sanad, E.E.; El-Khoribi, R.A. Intrusion Detection in Software Defined Network Using Deep Learning Approaches. Sci. Rep. 2024, 14, 29159. [Google Scholar] [CrossRef]
- Li, H.; Ji, L.; Wang, K.; Liu, S.; Liu, S. Applying the Stackelberg Game to Assess Critical Infrastructure Vulnerability: Based on a General Multi-Layer Network Model. Chaos 2024, 34, 123127. [Google Scholar] [CrossRef] [PubMed]
- Dhama, P.; Prashanth, K. Genetic Algorithm-Based Wormhole Attack Detection in WSN. Int. J. Sci. Res. Arch. 2023, 9, 795–802. [Google Scholar] [CrossRef]
- Al-Ahmadi, S.; Aliady, W.; AlRashedy, A. An Efficient Wormhole Attack Detection Method in Wireless Sensor Networks. In Proceedings of the 2022 26th International Conference on Circuits, Systems, Communications and Computers (CSCC), Crete, Greece, 19–22 July 2022; pp. 240–249. [Google Scholar] [CrossRef]
- Naik, R.L.; Jain, S.; Bairam, M. Development of Hybrid Weighted Networks of RNN and DBN for Facilitating the Secure Information System in Cybersecurity Using Meta-Heuristic Improvement. Wirel. Netw. 2025, 31, 3625–3660. [Google Scholar] [CrossRef]
- Zhukabayeva, T.; Pervez, A.; Mardenov, Y.; Othman, M.; Karabayev, N.; Ahmad, Z. A Traffic Analysis and Node Categorization-Aware Machine Learning-Integrated Framework for Cybersecurity Intrusion Detection and Prevention of WSNs in Smart Grids. IEEE Access 2024, 12, 91715–91733. [Google Scholar] [CrossRef]
- Zilberman, A.; Dvir, A.; Stulman, A. IPv6 Routing Protocol for Low-Power and Lossy Networks Security Vulnerabilities and Mitigation Techniques: A Survey. ACM Comput. Surv. 2025, 57, 1–77. [Google Scholar] [CrossRef]
- Sharma, S.; Kumar, P.; Bharti, V. Isolating Sink Hole Attacks in Wireless Sensor Networks Through Trust-Based Mechanism. In Proceedings of the 2024 4th International Conference on Technological Advancements in Computational Sciences (ICTACS), Tashkent, Uzbekistan, 13–15 November 2024; pp. 346–351. [Google Scholar] [CrossRef]
- Talukder, M.A.; Sharmin, S.; Uddin, M.A.; Islam, M.M.; Aryal, S. MLSTL-WSN: Machine Learning-Based Intrusion Detection Using SMOTETomek in WSNs. Int. J. Inf. Secur. 2024, 23, 2139–2158. [Google Scholar] [CrossRef]
- Ramkumar, K.; Alzubaidi, L.H.; Malathy, V.; Venkatesh, T.; Kruthika, C.G. Intrusion Detection System in Wireless Sensor Networks Using Modified Recurrent Neural Network with Long Short-Term Memory. In Proceedings of the 2024 International Conference on Integrated Circuits and Communication Systems (ICICACS), Raichur, India, 23–24 February 2024; pp. 1–5. [Google Scholar] [CrossRef]
- Kim, T.; Vecchietti, L.F.; Choi, K.; Lee, S.; Har, D. Machine Learning for Advanced Wireless Sensor Networks: A Review. IEEE Sens. J. 2021, 21, 12379–12397. [Google Scholar] [CrossRef]
- Mao, Z.M.; Sekar, V.; Spatscheck, O.; van der Merwe, J.; Vasudevan, R. Analyzing large DDoS attacks using multiple data sources. In Proceedings of the 2006 SIGCOMM Workshop on Large-Scale Attack Defense, Pisa, Italy, 11–15 September 2006; pp. 161–168. [Google Scholar] [CrossRef][Green Version]
- Rehman, A.; Rehman, S.U.; Raheem, H. Sinkhole Attacks in Wireless Sensor Networks: A Survey. Wirel. Pers. Commun. 2018, 106, 2291–2313. [Google Scholar] [CrossRef]
- Birahim, S.A.; Paul, A.; Rahman, F.; Islam, Y.; Roy, T.; Hasan, M.A.; Haque, F.; Chowdhury, M.E.H. Intrusion Detection for Wireless Sensor Network Using Particle Swarm Optimization Based Explainable Ensemble Machine Learning Approach. IEEE Access 2025, 13, 13711–13730. [Google Scholar] [CrossRef]
- Latha, D.J.; Rameswaran, N.; Bharathraj, M.; Vinoth Raj, R. Prevention of Wormhole Attack Using Mobile Secure Neighbour Discovery Protocol in Wireless Sensor Networks. In IoT Based Control Networks and Intelligent Systems; Springer: Singapore, 2023; pp. 215–229. [Google Scholar] [CrossRef]
- AlShuhail, A.S.; Bhatia, S.; Kumar, A.; Bhushan, B. Zigbee-Based Low Power Consumption Wearables Device for Voice Data Transmission. Sustainability 2022, 14, 10847. [Google Scholar] [CrossRef]
- Das, R.; Bera, J.N. Self-Reconfigurable Partial Mesh Using ZigBee Control Board towards Fail-Proof and Reliable Home Area Networking. Ad Hoc Netw. 2024, 152, 103327. [Google Scholar] [CrossRef]
- Hasan, M.Z.; Rahman, M.A.; Begum, S.; Hossain, M.S.; Ahmed, F.; Gumaei, A. An Efficient Detection of Sinkhole Attacks Using Machine Learning: Impact on Energy and Security. PLoS ONE 2025, 20, e0309532. [Google Scholar] [CrossRef]
- Konatam, S.; Nalluri, S.; Malyala, M.M.; Daiya, H.; Kumar, V.N.; Raju, K.S. A Random Forest-Based Method for Effective and Robust Detection of Wormhole Attacks in Wireless Sensor Networks. In Intelligent Computing and Communication; Springer: Singapore, 2025; pp. 461–476. [Google Scholar] [CrossRef]
- Teng, Z.; Li, M.; Yu, L.; Gu, J.; Li, M. Sinkhole Attack Defense Strategy Integrating SPA and Jaya Algorithms in Wireless Sensor Networks. Sensors 2023, 23, 9709. [Google Scholar] [CrossRef] [PubMed]
- Al Sukkar, G.; Al-Sharaeh, S. Enhancing Security in Wireless Sensor Networks: A Machine Learning-Based DoS Attack Detection. Eng. Technol. Appl. Sci. Res. 2025, 15, 19712–19719. [Google Scholar] [CrossRef]
- Hassan, S.M.; Mohamad, M.M.; Muchtar, F.B. Advanced Intrusion Detection in MANETs: A Survey of Machine Learning and Optimization Techniques for Mitigating Black/Gray Hole Attacks. IEEE Access 2024, 12, 150046–150090. [Google Scholar] [CrossRef]
- Al-chikh Omar, A.A.R.; Soudan, B.; Altaweel, A. A comprehensive survey on detection of sinkhole attack in routing over low power and Lossy network for internet of things. Internet Things 2023, 22, 100750. [Google Scholar] [CrossRef]
- Radhika, S.; Srikanth, M.; Anand, K.; Saravanan, K.; Southry, S.S. Improving Data Integrity for Gray Hole Attack Detection by Using a Hash Signature Algorithm in WSN. In Proceedings of the 2023 5th International Conference on Smart Systems and Inventive Technology (ICSSIT), Tirunelveli, India, 23–25 January 2023; pp. 619–623. [Google Scholar] [CrossRef]
- Bhatti, D.S.; Saleem, S.; Imran, A.; Kim, H.J.; Kim, K.I.; Lee, K.C. Detection and Isolation of Wormhole Nodes in Wireless Ad Hoc Networks Based on Post-Wormhole Actions. Sci. Rep. 2024, 14, 3428. [Google Scholar] [CrossRef]
- Faris, M.; Mahmud, M.N.; Salleh, M.F.M.; Alnoor, A. Wireless Sensor Network Security: A Recent Review Based on State-of-the-Art Works. Int. J. Eng. Bus. Manag. 2023, 15, 18479790231157220. [Google Scholar] [CrossRef]
- Hammi, B.; Idir, Y.M.; Zeadally, S.; Khatoun, R.; Nebhen, J. Is It Really Easy to Detect Sybil Attacks in C-ITS Environments: A Position Paper. IEEE Trans. Intell. Transp. Syst. 2022, 23, 18273–18287. [Google Scholar] [CrossRef]
- De Neira, A.B.; Kantarci, B.; Nogueira, M. Distributed Denial of Service Attack Prediction: Challenges, Open Issues and Opportunities. Comput. Netw. 2023, 222, 109553. [Google Scholar] [CrossRef]
- Khalaf, B.A.; Mostafa, S.A.; Mustapha, A.; Mohammed, M.A.; Mahmoud, M.A.; Al-Rimy, B.A.S.; Marks, A. An Adaptive Protection of Flooding Attacks Model for Complex Network Environments. Secur. Commun. Netw. 2021, 2021, 5542919. [Google Scholar] [CrossRef]
- Wang, H.; Huang, X.; Wu, Y. GD3N: Adaptive Clustering-Based Detection of Selective Forwarding Attacks in WSNs under Variable Harsh Environments. Inf. Sci. 2024, 665, 120375. [Google Scholar] [CrossRef]
- Pirayesh, H.; Zeng, H. Jamming Attacks and Anti-Jamming Strategies in Wireless Networks: A Comprehensive Survey. IEEE Commun. Surv. Tutor. 2022, 24, 767–809. [Google Scholar] [CrossRef]
- Elgindy, M.M.; Elghamrawy, S.M.; El-Desouky, A.I. Proposed Mitigation Framework for the Internet of Insecure Things. Mansoura Eng. J. 2023, 48, 3–10. [Google Scholar] [CrossRef]
- Zahra, F.; Jhanjhi, N.Z.; Khan, N.A.; Brohi, S.N.; Masud, M.; Aljahdali, S. Protocol-Specific and Sensor Network-Inherited Attack Detection in IoT Using Machine Learning. Appl. Sci. 2022, 12, 11598. [Google Scholar] [CrossRef]
- Swami, S.; Singh, P.; Chauhan, S.S. An Integrated Rule-Based and Machine Learning Technique for Efficient DoS Attack Detection in WSN. In Proceedings of the 2024 2nd International Conference on Disruptive Technologies (ICDT), Greater Noida, India, 15–16 March 2024; pp. 847–851. [Google Scholar] [CrossRef]
- Khan, S.; Khan, M.A.; Alnazzawi, N. Artificial Neural Network-Based Mechanism to Detect Security Threats in Wireless Sensor Networks. Sensors 2024, 24, 1641. [Google Scholar] [CrossRef] [PubMed]
- Alshehri, A.H. Wormhole Attack Detection and Mitigation Model for Internet of Things and WSN Using Machine Learning. PeerJ Comput. Sci. 2024, 10, e2257. [Google Scholar] [CrossRef] [PubMed]
- Shahid, H.; Ashraf, H.; Jhanjhi, N.Z.; Zam Zam, Q.A. Reshaping Cybersecurity of Wireless Sensor Networks Using Energy-Optimized Approach Against Wormhole Attack. In Advances in Information Security, Privacy, and Ethics Book Series; IGI Global: Hershey, PA, USA, 2024; pp. 125–172. [Google Scholar] [CrossRef]
- Seidu, R.; Salifu, A.M.S.; Ansuura, J.A. A Genetic Algorithm with a Trust Model Function for Detecting Sinkhole and Wormhole Nodes in Wireless Sensor Networks. Trans. Eng. Comput. Sci. 2024, 12, 30–44. [Google Scholar] [CrossRef]
- Sun, Y.; Chen, Y. Detection of Wormhole Attacks in Wireless Sensor Networks Based on Anomaly Detection Algorithms. In Proceedings of the 2022 2nd International Conference on Consumer Electronics and Computer Engineering (ICCECE), Guangzhou, China, 14–16 January 2022; pp. 777–782. [Google Scholar] [CrossRef]
- Yuan, J.; Yan, B. A Detection Method of Wormhole Attack in Power Communication Sensor Networks Based on Hops. Web Intell. 2022, 21, 115–125. [Google Scholar] [CrossRef]
- Al-Ahmadi, S. A Novel Energy-Efficient Wormhole Attack Prevention Protocol for WSN Based on Trust and Reputation Factors. In Proceedings of the 11th International Conference on Sensor Networks (SENSORNETS), Online, 7–8 February 2022; pp. 191–201. [Google Scholar] [CrossRef]
- Sridevi, S.; Anandan, R. RUDRA—A Novel Re-Concurrent Unified Classifier for the Detection of Different Attacks in Wireless Sensor Networks. In Intelligent Computing in Engineering; Springer: Singapore, 2020; pp. 251–259. [Google Scholar] [CrossRef]
- Lakshmi Narayanan, K.; Santhana Krishnan, R.; Golden Julie, E.; Harold Robinson, Y.; Shanmuganathan, V. Machine Learning Based Detection and a Novel EC-BRTT Algorithm Based Prevention of DoS Attacks in Wireless Sensor Networks. Wirel. Pers. Commun. 2021, 127, 479–503. [Google Scholar] [CrossRef]
- Mondal, K.; Yadav, S.; Pal, V.K.; Singh, A.P.; Singh, M. Detecting Sinkhole Attacks in IoT-Based Wireless Sensor Networks Using Distance from Base Station. Int. J. Inf. Syst. Model. Des. 2022, 13, 1–18. [Google Scholar] [CrossRef]
- Ali, T.S. MANDS: Malicious Node Detection System for Sinkhole Attack in WSN Using DRI and Cross Check Method. In Proceedings of the International Conference on Computational Intelligence in Pattern Recognition, Howrah, India, 23–24 April 2022; Springer: Singapore, 2022; pp. 511–519. [Google Scholar] [CrossRef]
- Ambika, N. Improved Cross-Layer Detection and Prevention of Sinkhole Attack in WSN. In Handbook of Research on Innovations and Applications of AI, IoT, and Cognitive Technologies; IGI Global: Hershey, PA, USA, 2021; pp. 514–527. [Google Scholar] [CrossRef]
- Ahmad, R.; Wazirali, R.; Abu-Ain, T. Machine Learning for Wireless Sensor Networks Security: An Overview of Challenges and Issues. Sensors 2022, 22, 4730. [Google Scholar] [CrossRef]
- Zhukabayeva, T.K.; Desnitsky, V.A.; Mardenov, E.M. A Technique for Collection, Preprocessing and Analysis of Data in Wireless Sensor Networks. News Natl. Acad. Sci. Repub. Kazakhstan Phys.-Math. Ser. 2024, 2, 163–176. [Google Scholar] [CrossRef]
- Shehzadi, K.; Abbas, T.; Zainab, A.; Li, H. A survey of intruder detection in smart grid systems: Comparative analysis of rule-based, machine learning and deep learning. Int. J. Secur. Netw. 2025, 20, 67–92. [Google Scholar] [CrossRef]
- Umar, M.M.; Khan, S.; Ahmad, R.; Singh, D. Game Theoretic Reward Based Adaptive Data Communication in Wireless Sensor Networks. IEEE Access 2018, 6, 28073–28084. [Google Scholar] [CrossRef]
- Alrajeh, N.A.; Khan, S.; Lloret, J.; Loo, J. Artificial neural network based detection of energy exhaustion attacks in wireless sensor networks capable of energy harvesting. Ad-Hoc Sens. Wirel. Netw. 2014, 22, 109–133. [Google Scholar]
- Gandhi, K.I.; Kannan, G. Development of an Energy-Efficient Patient Monitoring System Using RSSI-Based Wireless Sensor Network with AODV and ZigBee Technology. J. Nano-Electron. Phys. 2024, 16, 06005-1–06005-5. [Google Scholar] [CrossRef] [PubMed]
- ASoussi, A.; Zero, E.; Sacile, R.; Trinchero, D.; Fossa, M. Smart Sensors and Smart Data for Precision Agriculture: A Review. Sensors 2024, 24, 2647. [Google Scholar] [CrossRef]
- Majhi, A.A.K.; Mohanty, S. A Comprehensive Review on Internet of Things Applications in Power Systems. IEEE Internet Things J. 2024, 11, 34896–34923. [Google Scholar] [CrossRef]
- Stanco, G.; Navarro, A.; Frattini, F.; Ventre, G.; Botta, A. A comprehensive survey on the security of low power wide area networks for the Internet of Things. ICT Express 2024, 10, 519–552. [Google Scholar] [CrossRef]
- Howitt, I.; Gutierrez, J.A. IEEE 802.15.4 low rate—Wireless personal area network coexistence issues. In Proceedings of the 2003 IEEE Wireless Communications and Networking, WCNC 2003, New Orleans, LA, USA, 16–20 March 2003; Volume 3, pp. 1481–1486. [Google Scholar] [CrossRef]


Disclaimer/Publisher’s Note: The statements, opinions and data contained in all publications are solely those of the individual author(s) and contributor(s) and not of MDPI and/or the editor(s). MDPI and/or the editor(s) disclaim responsibility for any injury to people or property resulting from any ideas, methods, instructions or products referred to in the content. |
© 2025 by the authors. Licensee MDPI, Basel, Switzerland. This article is an open access article distributed under the terms and conditions of the Creative Commons Attribution (CC BY) license (https://creativecommons.org/licenses/by/4.0/).