Abstract
Many speech coding strategies have been developed over the years, but comparing them has been convoluted due to the difficulty in disentangling brand-specific and patient-specific factors from strategy-specific factors that contribute to speech understanding. Here, we present a comparison with a ‘virtual’ patient, by comparing two strategies from two different manufacturers, Advanced Combination Encoder (ACE) versus HiResolution Fidelity 120 (F120), running on two different implant systems in a computational model with the same anatomy and neural properties. We fitted both strategies to an expected T-level and C- or M-level based on the spike rate for each electrode contact’s allocated frequency (center electrode frequency) of the respective array. This paper highlights neural and electrical differences due to brand-specific characteristics such as pulse rate/channel, recruitment of adjacent electrodes, and presence of subthreshold pulses or interphase gaps. These differences lead to considerably different recruitment patterns of nerve fibers, while achieving the same total spike rates, i.e., loudness percepts. Also, loudness growth curves differ significantly between brands. The model is able to demonstrate considerable electrical and neural differences in the way loudness growth is achieved in CIs from different manufacturers.
1. Introduction
Cochlear implants (CIs) bypass the outer and middle ear of a person with sensorineural hearing loss to deliver electric stimulation directly to the auditory nerve in the cochlea, restoring functional hearing to the user. It is considered to be one of the most successful and prolific sensory prostheses, having passed more than one million implantations in 2022 [1]. CI users generally have good speech understanding in quiet environments and are usually capable of having conversations on the phone, but perception of more complex sounds such as speech-in-noise and music remains problematic for many CI users [2].
In many ways, the CI aims to mimic biological hearing processes. Pitch is conveyed using the natural tonotopic organization of the cochlea, with high frequencies at the base and low frequencies at the apex of the cochlea [3]. Loudness is encoded in the cochlea by the number of activated fibers and the firing rate of these fibers. CIs increase perceived loudness by increasing charge delivered to the auditory nerve, which in turn leads to a broader excitation pattern and a higher firing rate of the auditory nerve cells. This mimicry works rather well, but this electrical equivalent of neural activation leads to new challenges, such as current spread that reduces the pitch specificity and a reduced number of loudness steps that can be perceived [2]. As a result, for CI users, the difference between a just-hearable sound, also referred to as a threshold-level sound, and a comfortable sound is much smaller than for those with normal hearing. This smaller dynamic range can negatively impact speech intelligibility, which partially relies on intensity variations for the identification of vowels and consonants [4] and music perception [2]. Another issue is the interaction between pitch and loudness. In normal hearing, sound presented at the same sound pressure level at different frequencies is not perceived as equally loud; middle-frequency sounds are perceived louder than high-frequency sounds. Typically, CIs use a pre-emphasis filter to emulate this frequency sensitivity, which compresses low-frequency sound and amplifies high-frequency sound. In practice, this internal amplification means that a high-frequency sound will reach the defined stimulation threshold sooner than a low-frequency sound of the same sound level.
Over the years, CI manufacturers have developed different implants and speech coding strategies (SCSs) to encode sound. Similarly, they have implemented different ways to deliver the charge to the auditory nerve, such as increasing the pulse rate per channel (pps/channel), changing the pulse shape (such as varying interphase or interpulse gaps), the number of active electrode contacts, and more (see McKay [5] for a comprehensive overview). These variations are partially driven by the parameters of the hardware platform. Changing these will result in more neural activation and, therefore, an increase in perceived loudness. However, it is difficult to compare the strategies and understand these differences, as many different types of testing are used to investigate implant performance, which are very often platform-specific. Additionally, limited numbers of participants make it difficult to find statistically relevant data. Another downside is the inability to compare speech coding strategies within a patient, as different speech coding strategies are manufacturer-specific. This means that patient-specific differences in anatomy and physiology, as well as the interpretation of the patient, always play a role in any finding.
Interestingly, patient testing with different speech coding strategies of different brands sometimes shows opposing results for the same parameter. Balkany et al. [6] found that low stimulation rates between 500–900 pps/channel were preferred by Nucleus Contour device users (from Cochlear Inc., Sydney, Australia) and did not hinder speech understanding. However, experiments with implants from MedEl demonstrated a preference for high stimulation rates of 1200–1600 pps [7]. For Advanced Bionics (AB, Valencia, CA, USA) implants, increasing stimulation rate did not influence speech understanding, but it did lower T-level and thus increased the dynamic range [8]. Another difficulty in comparing strategies is even in definitions of fitting settings; for instance, both define T-level as the first noticeable sound, but Advanced Combination Encoder (ACE), developed by Cochlear, works with a comfortable level (C-level) and HiRes Fidelity 120 (F120), developed by Advanced Bionics, maps a most comfortable level (M-level).
These differences between strategies have been described from multiple angles in multiple ways. Wolfe [9] published a book for audiologists that describes different SCSs and their fittings. Vaerenberg et al. [10] developed a graphical representation to compare loudness encoding in different implants, from input to the output of the implant in current. McKay [5] modeled the effect of different pulse shape parameters on auditory nerve activation. However, as far as we are aware, no study has been conducted yet that considers every step from sound to processor to auditory nerve, and investigates the effects of one on the other. Using a computational model instead of patient experiments enables an objective comparison of different speech coding strategies in the same virtual cochlea. In this way, physiological differences are bypassed, and no patients are needed, so only the effect of the speech encoding on the auditory nerve is investigated.
In this paper, we assess how choices in signal encoding of two different SCSs (ACE and F120) impact the activation of the auditory nerve. Research versions of ACE and F120 strategies were kindly made available to us by the respective manufacturers (described in detail by Nogueira et al. [11,12]), which allow us to simulate an SCS as close as possible to the clinical version. Unfortunately, research versions of other manufacturers were not available to us.
The ACE strategy of Cochlear drives an array with 22 electrode contacts, and has a default stimulation rate of 900 pps/channel. This strategy uses pre-emphasis, and it does not activate a channel before an internal base loudness level (assigned to T-level) is reached. Within the electric dynamic range, loudness is logarithmically encoded. Once the internal base level is reached, the electrode contact starts stimulating at T-level [11]. Additionally, a stimulus above the internal saturation level (assigned to C-level) does not increase the electrode contact’s output. Another notable feature of this strategy is the use of the N-over-M paradigm. Per stimulation cycle, N electrode contacts are activated with the most energy in this cycle of the M available channels. For the ACE strategy, N is fixed most often at 8, and M is the total number of electrode contacts (22).
The F120 strategy from Advanced Bionics is designed for devices with 16 electrode contacts and employs dual electrode stimulation, or more commonly called current steering, rather than monopolar stimulation. With current steering, two electrode contacts are stimulated simultaneously, which creates an intermediate pitch percept between those elicited by the individual contacts [13]. F120 uses a slightly different pre-emphasis, but unlike in the ACE strategy, individual channels are also stimulated below their T-levels. In each stimulation cycle, all 15 electrode contact pairs will be activated, but when the sound level is too low, this stimulation is subthreshold. As a result, a constant stimulation rate of 1850 pps/channel is achieved. In this strategy, the loudness is linearly encoded up to the most comfortable level (M-level), after which the current increase is compressed with a 1:12 ratio. Typically, no inter-pulse gaps are used on the AB platforms.
In this study, we aim to fit both strategies in the same virtual patient by finding analogous fitting definitions. However, due to the difference in pre-emphasis, the T-levels of both strategies are reached at different sound levels. Additionally, the compared processors have some significant differences in the definition of the upper level (C-level/M-level). Therefore, it would be incorrect to assume that these values are the same at a processing or fitting level. Vaerenberg et al. [10] worked around this issue by only comparing responses to inputs of one frequency. We opted for a different approach and created a way to equalize stimulus loudness at T-level. This is explained in greater detail in the Methods section. Lastly, in normal clinical practice, patient fittings are done with pulse trains. However, in this paper, fittings are done using acoustic pure tone waves, just as Vaerenberg et al. [10] did in their loudness comparison, building on the assumption that a loud sound would excite a comparable number of auditory nerve fibers, irrespective of the type of implant.
This paper is based on the implanted cochlea model developed at the Leiden University Medical Center, now extended to run both F120 and ACE. In this computational model study, we aim to bring insights into loudness encoding in cochlear implants of two different manufacturers. We provide results from both the neural and the electrical outputs obtained for ACE and F120 for all electrode contacts at a wide range of levels of loudness.
2. Materials and Methods
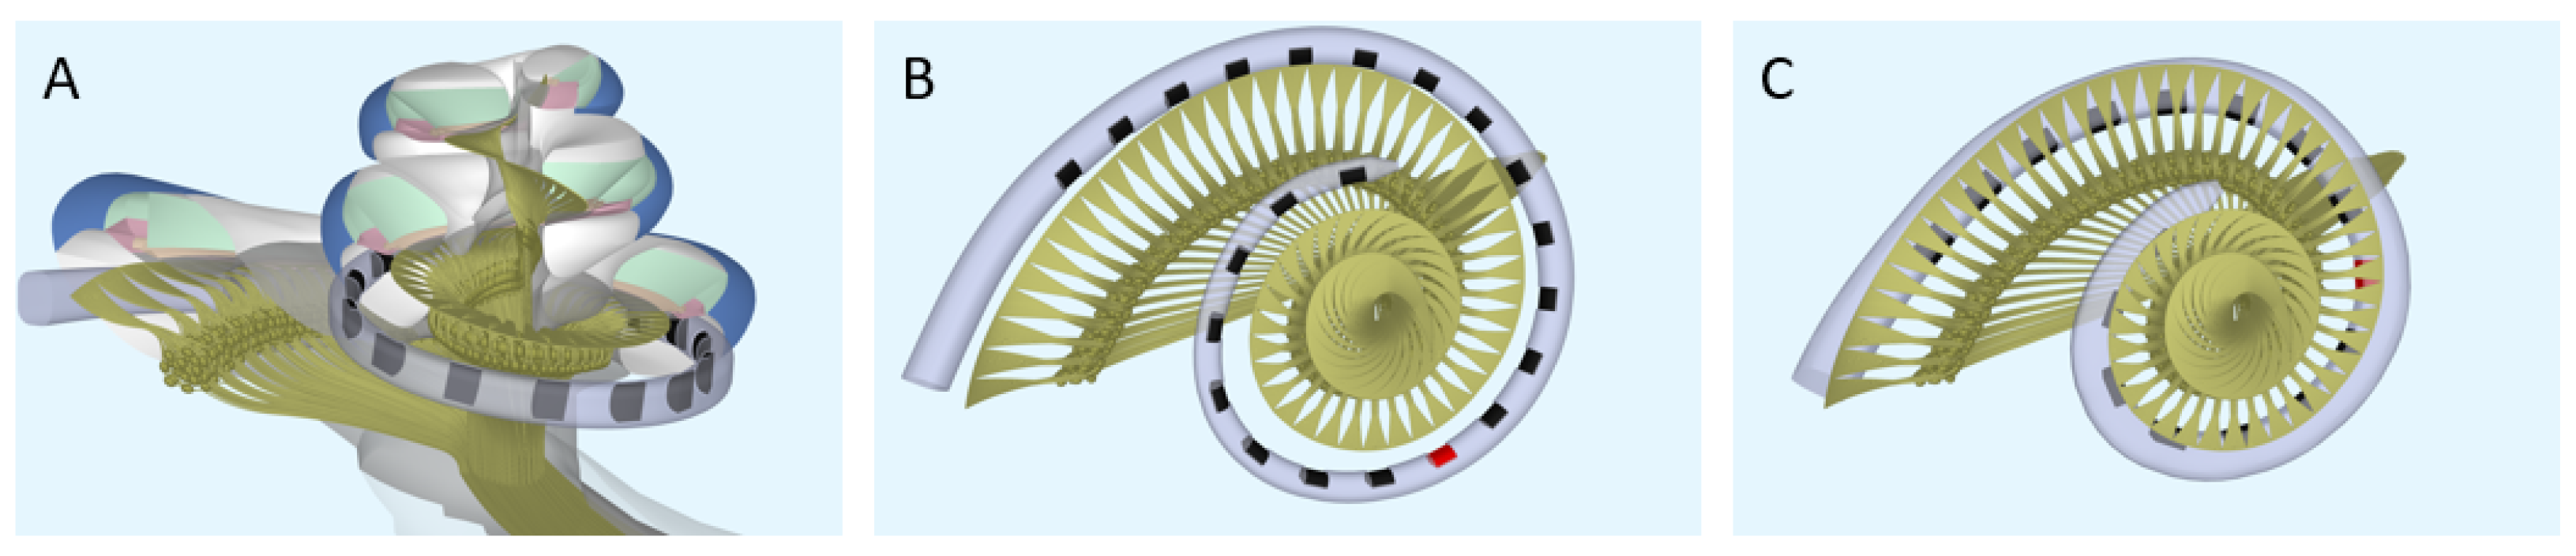
Computational model. To model the neural response to different strategies, the latest version of the implanted cochlea model was used [14,15,16]. This model presents a pipeline that consists of multiple segments: (1) a volume conduction model, which calculates simulated electrical potentials along the auditory neurons in a realistic three-dimensional geometry of the implanted human cochlea, (2) an active nerve fiber (ANF) model with human kinetics [17], which calculates deterministic neural responses to the electrical potentials from the volume conduction model, and (3) a stochastic model PHAST+, which extends the deterministic single fiber thresholds with stochasticity, adaptation, and accommodation [14,18,19]. The cochlear geometry used in this study is based on µCT imaging data from a human temporal bone. Inside the model geometry, realistic neural trajectories are defined according to histological data and simulated electrical potentials are calculated at their nodes of Ranvier and internodal segments [14,18]. Figure 1 shows a sliced-open version of this cochlear model geometry with one of the modeled electrode arrays (Figure 1A), as well as a top view to portray the neural trajectories modeled with two different implant arrays (Figure 1B,C). These modeled electrode arrays were chosen to match the patient population of our clinic and have been the most validated in previous research. Similarly, we have chosen to stick to the validated versions of the available toolboxes of the speech coding strategies. Our aim is to portray loudness percepts of two different clinical strategies and not include research versions of these strategies that employ a range of parameters not often used in the clinic. However, to exclude the effects of position and emphasize the differences purely in strategy, an initial calibration was done with hypothetical lateral wall electrode arrays modeled in the same position (see Figure 2). These arrays have the same shape and dimension of electrode contacts, with only the number of contacts and distance between them varying for each strategy.

Figure 1.
The geometry of the modeled cochlea. (A) Sliced-open view, (B) top view for the ACE array (Nucleus Slim Straight), and (C) top view for the F120 array (HiFocus Mid-Scala). The red electrode contacts have a center frequency of 1250 Hz.
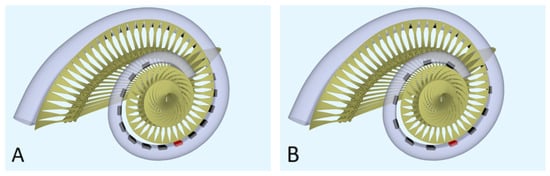
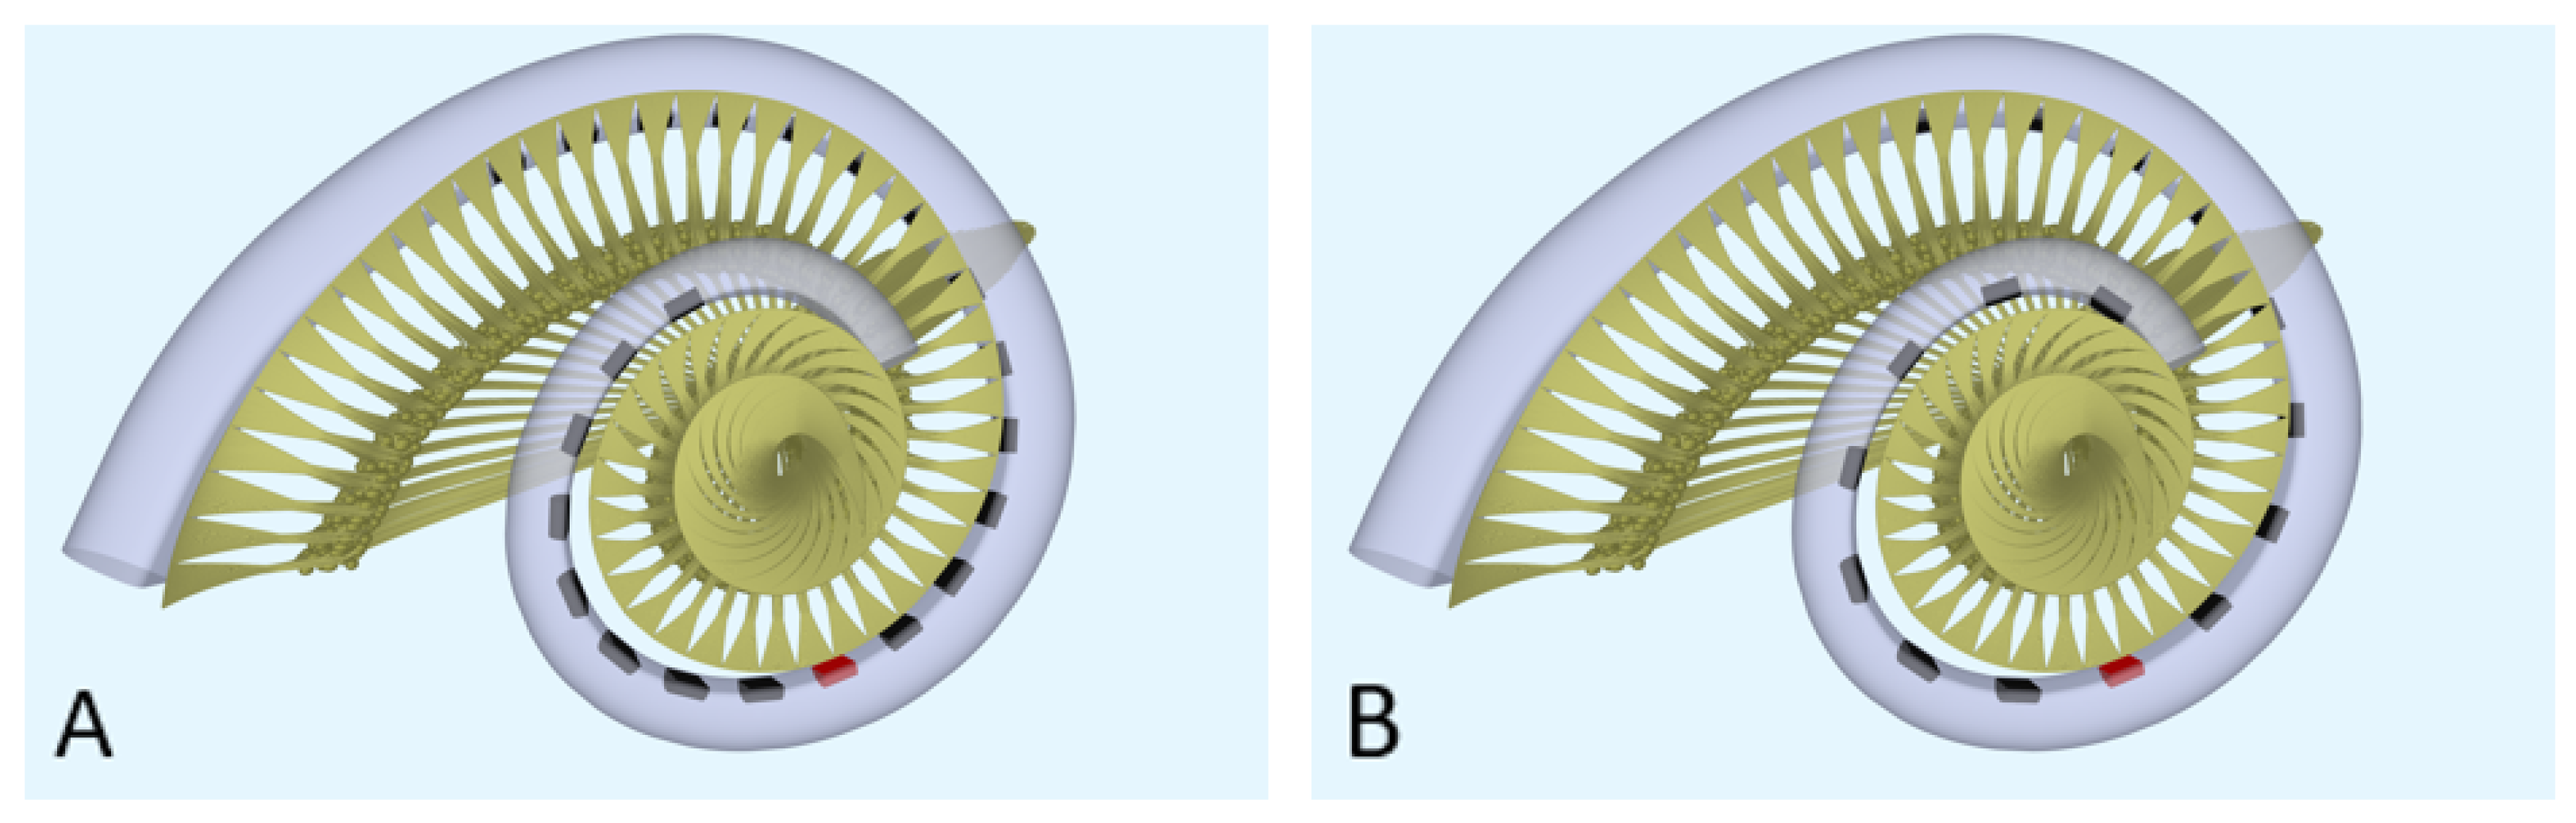
Figure 2.
The geometry of the modeled cochlea with the hypothetical lateral wall arrays: (A) top view for the hypothetical lateral wall array of ACE (Nucleus Slim Straight), (B) top view for the hypothetical lateral wall array of F120 (HiFocus Mid-Scala). The red electrode contacts have a center frequency of 1250 Hz.
The combined implanted cochlea model takes an electrodogram, created by a speech coding strategy, as input and generates spiking output for 3200 fibers, resulting in a neurogram. Initially, the implanted cochlea model only worked with the research version of HiRes Fidelity 120 (F120) developed by Advanced Bionics. For this paper, the model was extended to also run ACE. For the ACE simulations, a realistic representation of the Nucleus Slim Straight electrode array was used (Figure 1A,B), and for the F120 simulations, a model of the HiFocus Mid-Scala was made, based on geometric data provided by Advanced Bionics (Figure 1C). The insertion angle of the most basal electrode contact of HiFocus Mid-Scala was 27 degrees from the round window, and for the most apical electrode contact, 420 degrees from the round window. For Nucleus Slim Straight, these values were 38 and 455 degrees, respectively. All cochlear angles are determined according to the consensus coordinate system described by Verbist et al. [20].
Speech coding strategies. The code of both SCSs was provided by their respective companies as research versions of clinical strategies used in the implants. Both these research versions allowed T- and C-/M-level adjustment and produced an electrodogram in response to sound. We used the T- and C-/M-levels found with the ANF model; however, a known shortcoming is that the fiber thresholds are about a factor of 3 higher than clinical thresholds. To correct for this known systemic error, the T-, C-, and M-levels were scaled down with a factor of 3, thereby avoiding the SCS’s internal current output limit.
The speech processor for F120 was taken from the open-source Advanced Bionics Generic-Python-Toolbox. This is code for the spectral resolution strategy (SpecRes), a research version of the commercial HiRes with Fidelity 120 strategy [12]. To match both clinical results and loudness curves described by Vaerenberg et al. [10], the scaling of the audiomixer function was set to relative, using a full scale of 109.6 dB. The acoustic dynamic range was set to 40 dB. This is not to be compared to the IDR setting in the fitting software. Noise reduction was disabled; automatic gain control (AGC) and pre-emphasis were enabled.
For ACE, the Nucleus MATLAB toolbox (NMT, in MATLAB 2023a), by Cochlear was used to simulate the Cochlear Nucleus CI. As described by Nogueira et al. [11], the default values of the ACE toolbox set the base-level or T-level at 33.86 dB and the saturation level or C-level at 65.35 dB. To make the default values more reflective of the clinic and Vaerenberg et al. [10], the level of C was maintained at 65 dB, but the level of T was changed to 25 dB resulting in a dynamic range of 40 dB. Specifically for this study, a dB scaling was added at the start of the processing chain to scale audio inputs to these known T- and C-level outputs. Similar to F120, AGC and pre-emphasis were enabled.
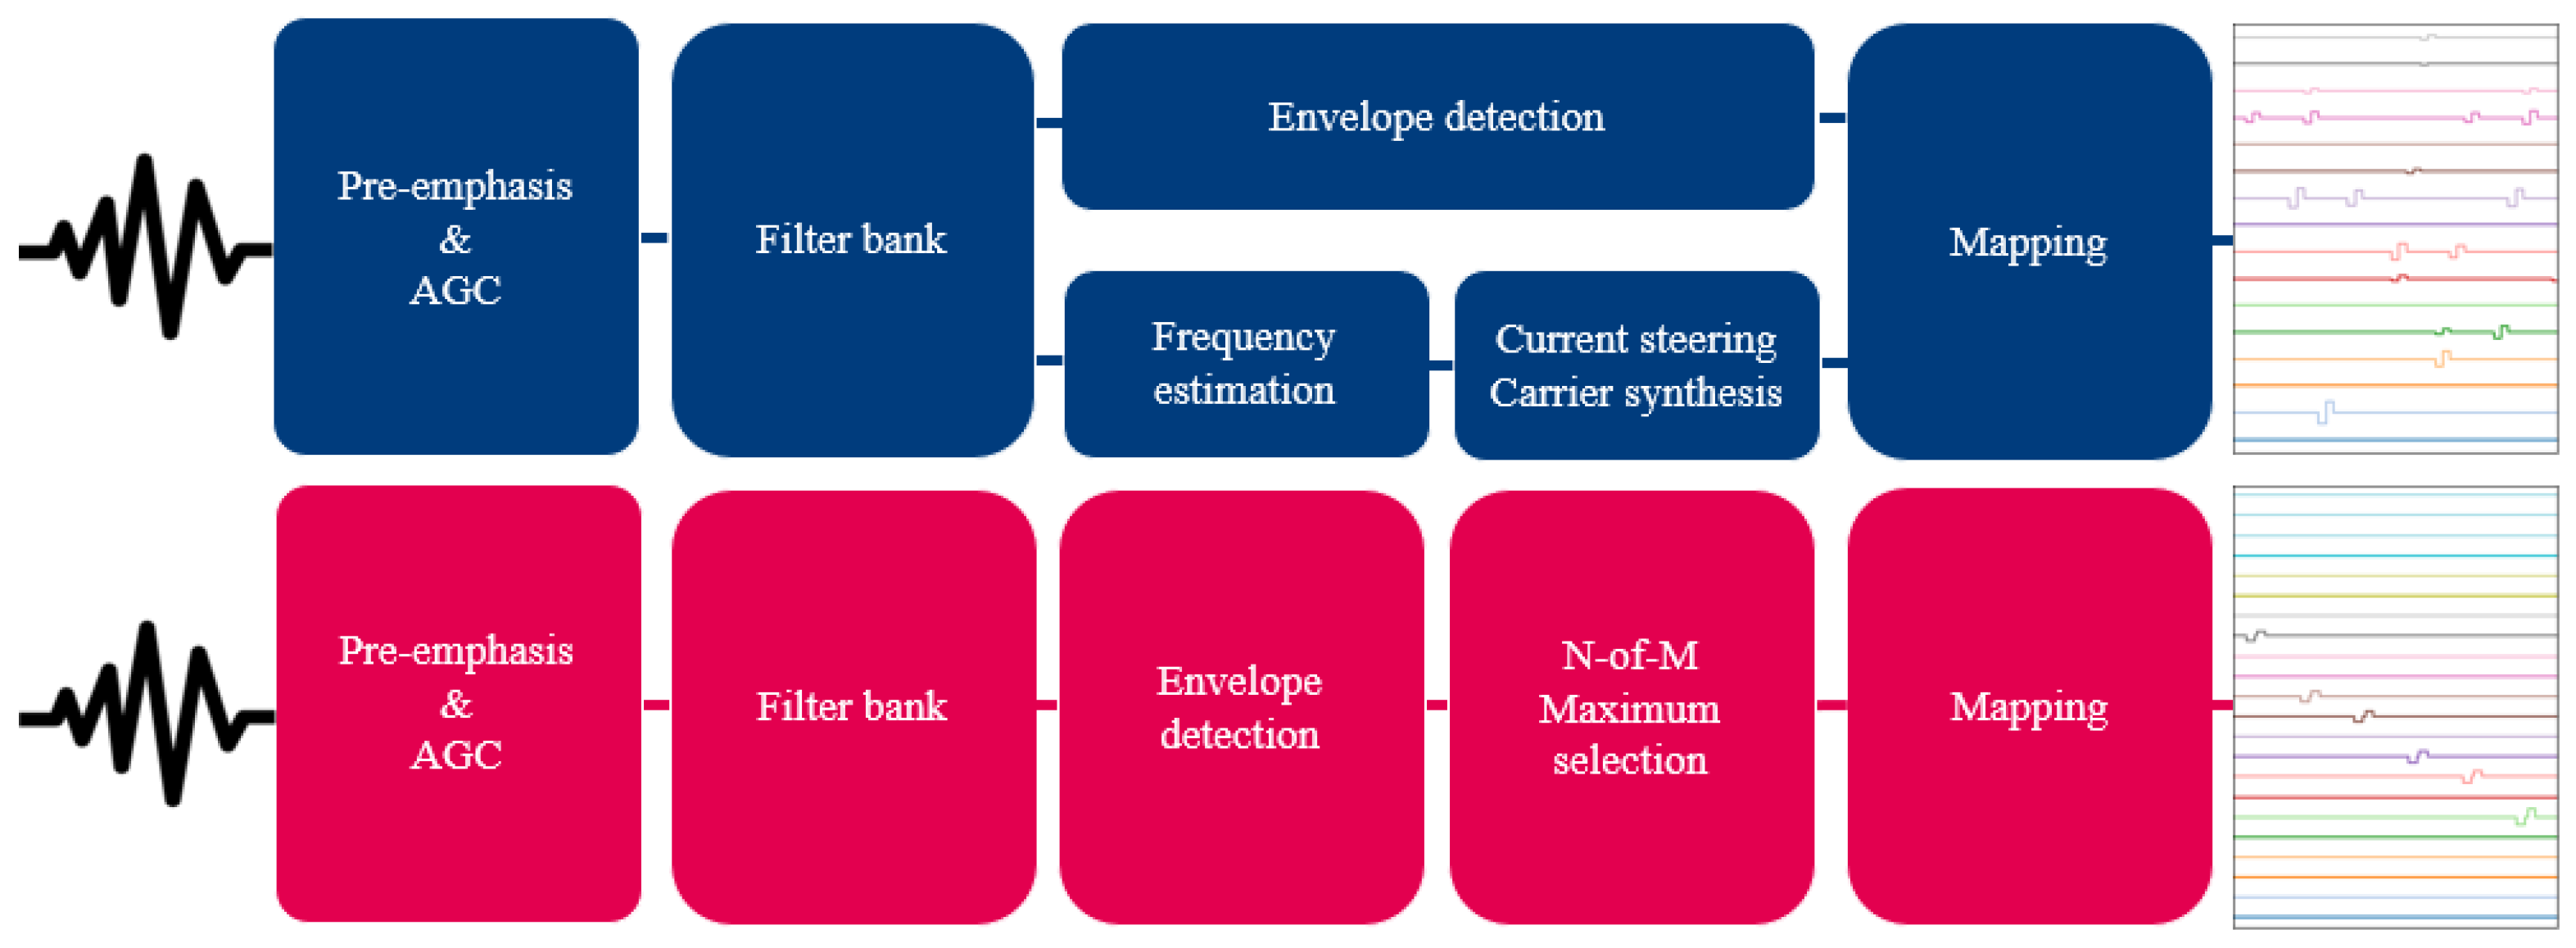
Other relevant settings can be found in Table 1. An overview of both strategies is shown in Figure 3. The electrodograms of Figure 3 show the biphasic cathodic-first rectangular pulses that both strategies use, as well as the sequential stimulation order for ACE versus simultaneous stimulation order for F120.

Table 1.
Default settings of ACE and F120.

Figure 3.
Schematic overview of the F120 (top, indicated in blue) and ACE (bottom, indicated in magenta) strategies. Both strategies take sound as input to create an electrodogram.
Loudness scaling. For comparison of the output of different electrode contacts, a type of frequency-specific loudness scaling was needed, as pre-emphasis causes low-frequency sounds to reach the T-level of the implant at higher sound pressure levels (SPLs) than high-frequency sounds. A similar principle is used to create audiograms in pure-tone audiometry, using ISO equal-loudness contours, which scale input in dB SPL to dB HL. Similarly, we developed a conversion table that relates a stimulus in dB SPL to a converted scale: ‘dB T’, which equalizes stimuli at all frequencies to their implant-specific threshold level. A stimulus at 25 dB T for each electrode contact leads to T-level electric stimulation. This table can be found in Appendix A.
Stimuli. Pure tones of 1 s were generated for each electrode contact’s center electrode frequency (CEF), the auditory frequencies assigned to specific contacts by ACE and F120. For ACE, the electrode contacts are enumerated from base to apex, meaning E1 is assigned the highest frequency of 7437 Hz (CEF1), whereas for F120, the lowest frequency (CEF1) is assigned to E1 in the apex. All stimuli were scaled using the conversion table from Appendix A and the implants’ dB scaling. Cosine-squared ramps were applied to the start of the stimulus (0.05 s).
Metric for neural response. In previous studies conducted with the implanted cochlea model, T- and M-level stimulation was defined as a number of activated fibers (expressed in width of the excitation area) [21,22]. In this paper, a next step was taken to quantify loudness in this model by summing the spikes of the stable part of the signal to achieve an expression of loudness in total spike rate (spikes/s). Our neural activation stabilized after 0.2 s of stimulation (a combined effect of the ramp and the AGC). To reduce the influence of spontaneous activity and possible cross-turn activation, relevant neural fibers per electrode contact were selected, whose activation would be caused by that specific electrode contact. For all stimuli, 640 out of 3200 fibers were selected and based on the maximum width of activation observed, to not exclude relevant data. During calibration, all electrode contact amplitudes except for the center electrode contact (CE) of the CEF and its neighboring electrode contacts (CE–1 and CE+1) were set to 0. This was done to reduce the effect of subthreshold pulses. For CEF2, this would mean that the CE (E2), as well as E1 and E3, were included in the calibration.
Neural baseline determination. Spike rates were used to indicate when a sound was at a threshold or at a comfortable level. These rates were determined in an experiment where modified or hypothetical electrode array geometries for ACE and F120 simulations were placed in such a way that their electrode contact allocated to 1250 Hz was at the same position in the cochlea along the lateral wall, to mitigate any effects of electrode contact positioning. For ACE, this was E14; for F120, this was E8. This frequency was chosen because both SCSs have very similar CEFs around this value and are only marginally affected by the pre-emphasis of each strategy. Stimuli presented at 25 and 65 dB T resulted in minimal spike rate differences between the strategies. In the end, the spike rates found at this electrode contact of F120 were chosen, as this SCS has previously been investigated using this model.
Implant fitting. After scaling the stimulus loudness and determining the neural baseline, the implants were fitted at all CEFs. We hypothesized that a just-noticeable sound and a sound of 65 dB should have the same spike rate for both SCSs on all contacts to be detected as equal by a subject, similar to other computational models that assume a close relationship between total neural excitation and loudness perception [23,24].
For each electrode contact, stimuli with the corresponding CEF were presented at 25 and 65 dB T, and spike rates were calculated. T- and C- or M-levels of the SCSs were adjusted, resulting in a changed pulse amplitude until the total spike rate closely matched the previously defined total spike rates of threshold and comfortable level, respectively.
Loudness growth curves. After calibrating all electrode contacts individually, stimuli from 0 to 110 dB T with 5 dB T step sizes were created for each electrode contact’s CEF to generate input-output curves. For F120, subthreshold activation was now enabled for all electrode contacts, similar to clinical implementation. Spike rates were calculated in the same way as explained previously.
Electrodograms were analyzed by calculating the charge delivered and evaluating the maximum amplitude of each electrode contact. Similar to the neural analysis, only the stable part of the electrodogram was included. As F120 always has all electrode contacts activated with subthreshold activation, a lot of charge is delivered over the entire cochlea that does not directly impact the neural loudness percept. In calculations, only the CE and its neighbors (CE − 1 and CE + 1) were included, as these electrode contacts significantly impact the spiking rate and are used in the loudness coding.
3. Results
Firstly, the results of the baseline determination will be discussed in Section 3.1, with which we established our neural threshold and comfort level. These levels are calculated with a hypothetical lateral wall array, but our goal is to model the clinical setting. Therefore, the subsequent Section 3.2 describes the neural activation with the actual arrays in their clinically representative position. Since the fitting of electrode contacts is based on neural activation, the results of the neural activation will first be discussed. We compared the resulting neural activation at different levels of loudness of the two strategies. Secondly, the electrical output of the SCSs at these levels of loudness will be discussed in Section 3.3.
3.1. Neural Baseline Levels
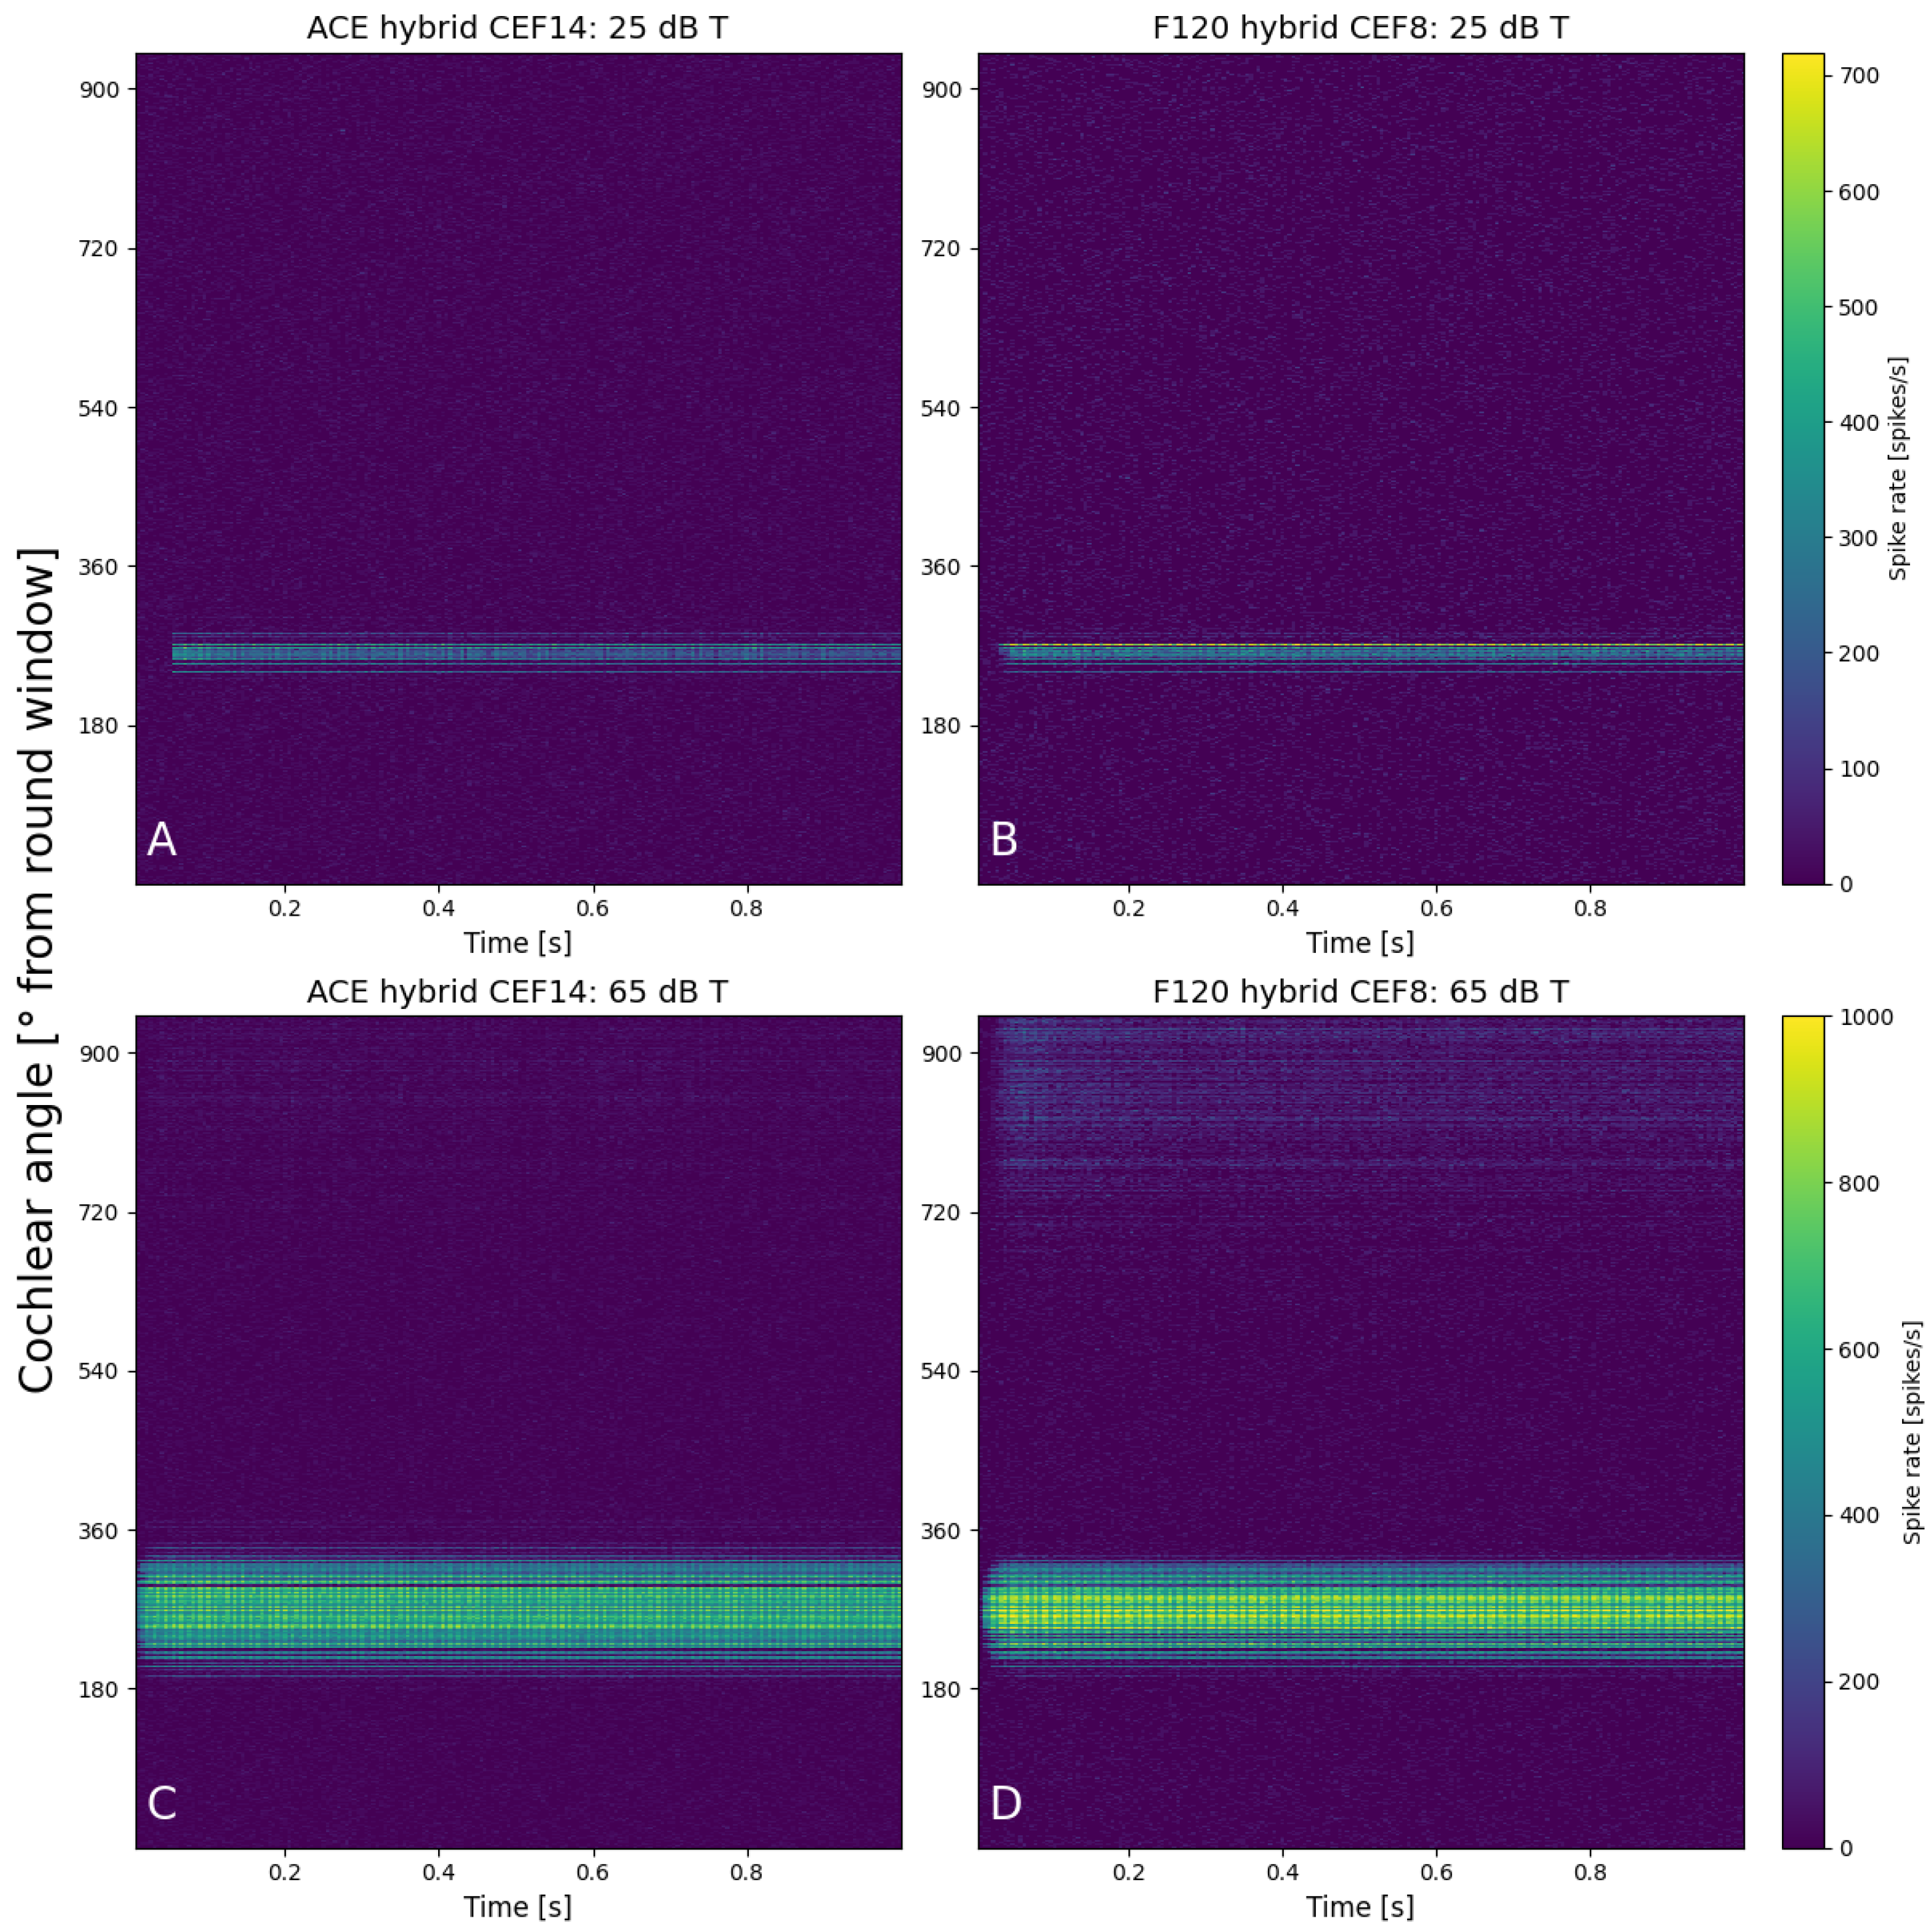
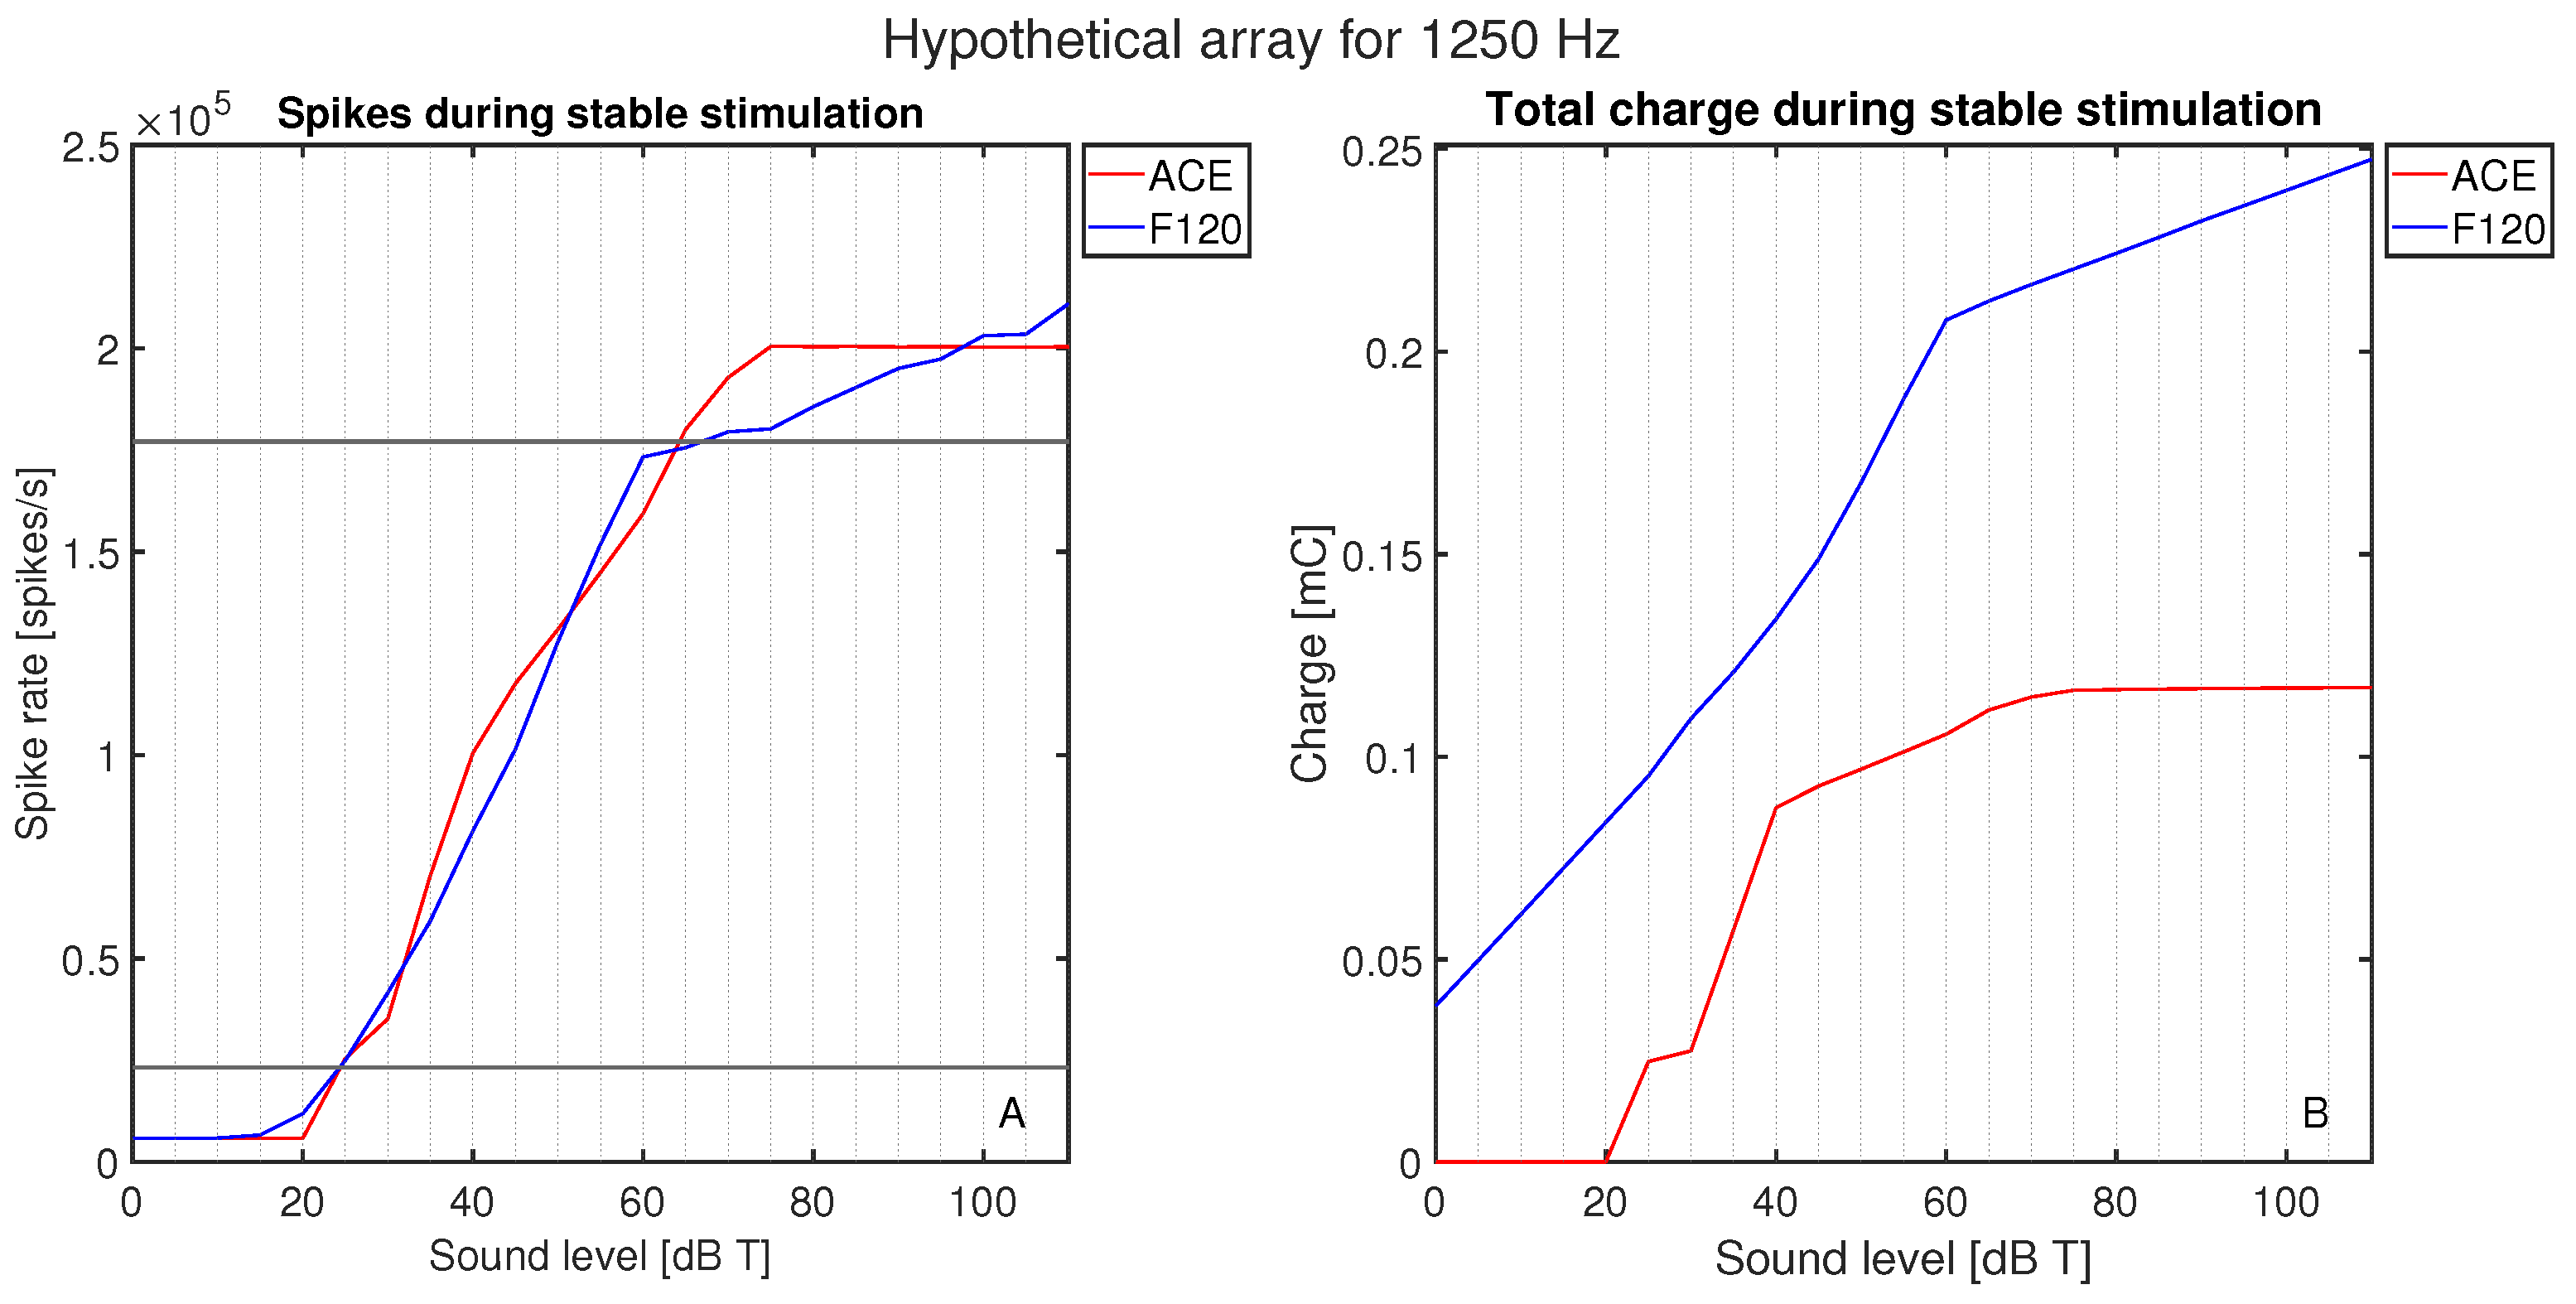
The initial calibration of threshold and comfort level was conducted on hypothetical lateral wall electrode arrays (see Figure 2), meaning they were positioned differently than they are in the clinic, to exclude the effect of differences in position. Both hypothetical arrays were placed along the lateral wall, and the shape and size of the electrode contacts were the same. The number of electrode contacts, the distance between the electrode contacts, and the cochlear angle were different between the hypothetical arrays. They were placed such that E8 F120 matched the position of E14 ACE. The neurograms with these similarly positioned arrays (Figure 4) showed neural activation with a stimulus of 1250 Hz at exactly the same cochlear angle. Figure 5 demonstrates the spike rate (Figure 5A) and total charge (Figure 5B) for both ACE and F120 with a stimulus of 1250 Hz. The spike rate found at this electrode contact for an input at threshold level was 23.2 kspikes/s. For comfort level, this was 177 kspikes/s. To match both strategies, it is assumed that a sound of 65 dB results in an equal spike rate over the devices. In this way, a comfort level of the ACE strategy could be found, overcoming the definition problem between the strategies.

Figure 4.
Neurograms for a stimulus of 1250 Hz with hypothetical lateral wall arrays placed at the exact same location in the cochlea. The panels show 25 dB T with (A) ACE and (B) F120, and 65 dB T with (C) ACE and (D) F120. The y-axis indicates the location of the fibers in the cochlea in degrees from the round window, from base to apex. Each color bar is shared per row and indicates the individual spike rates of each fiber.
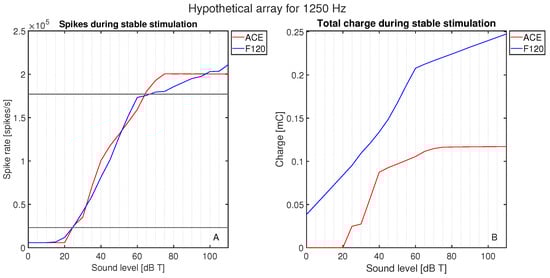
Figure 5.
Activation as a function of loudness: (A) the neural activation in terms of the total spike rate for ACE and F120, and (B) the electric activation in terms of the charge needed to reach this spike rate. The response is plotted for a stimulus of 1250 Hz in 0–10 dB T in steps of 5 dB.
3.2. Neural Activation
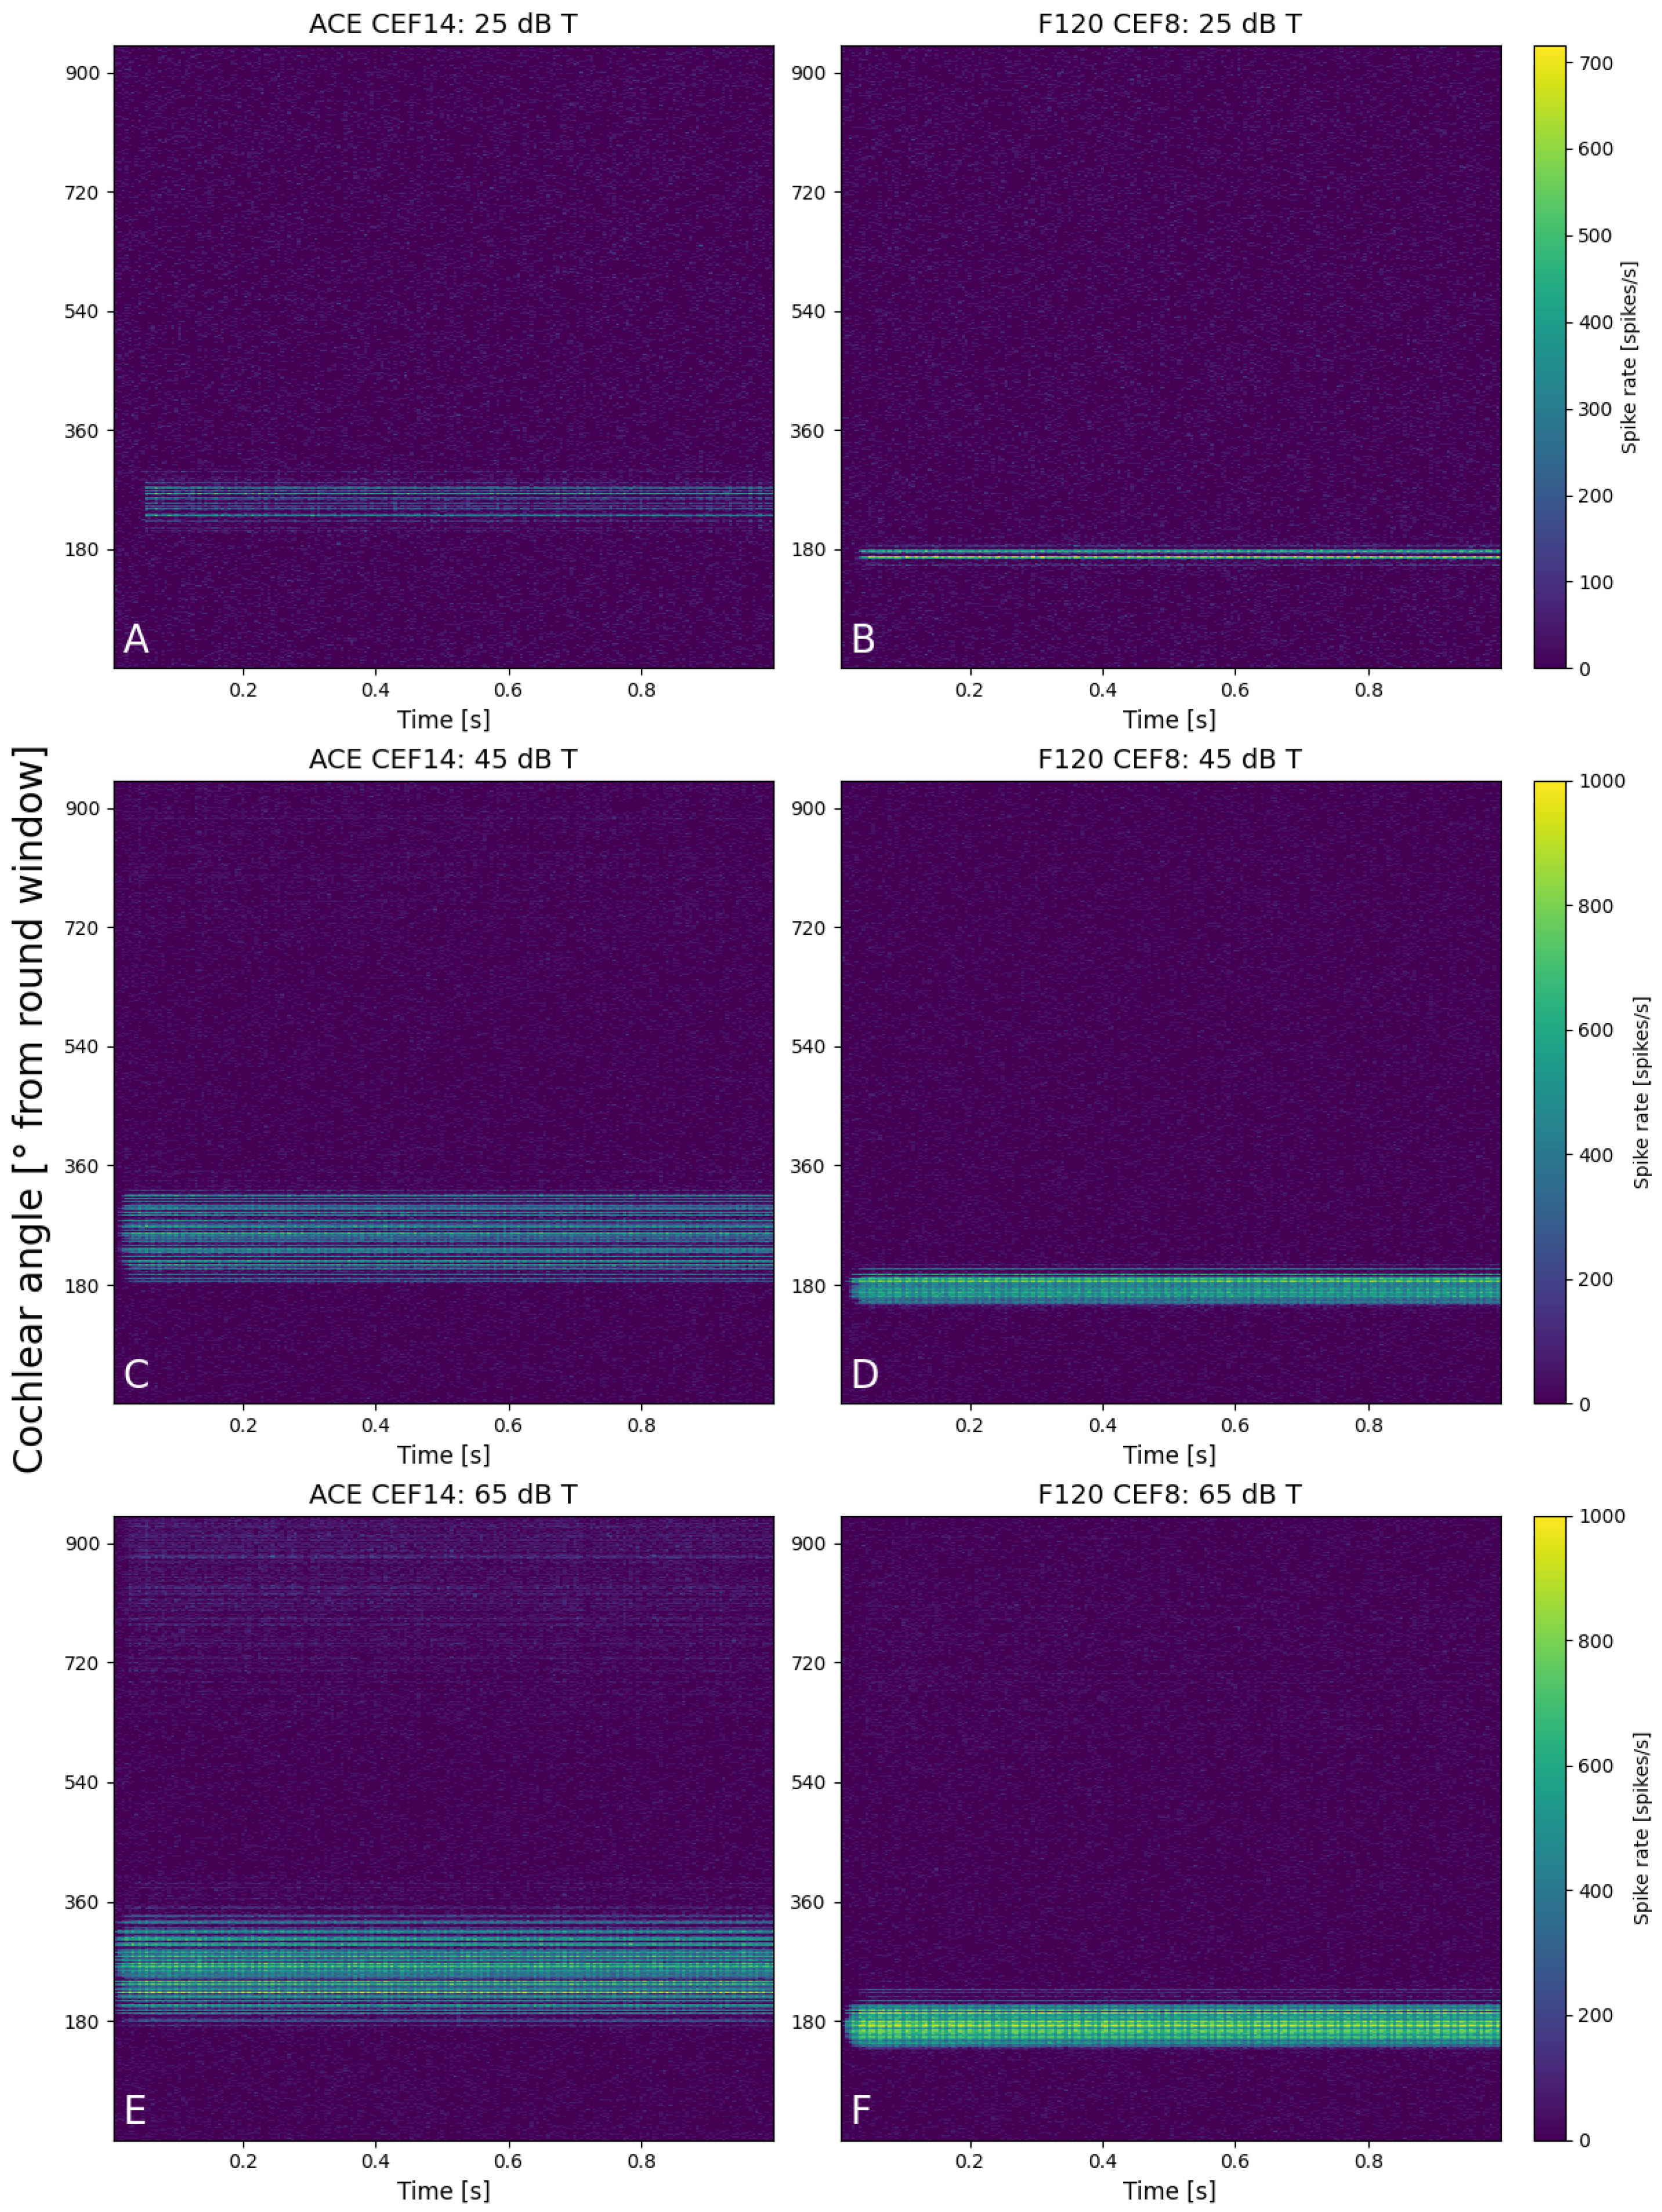
Figure 6 shows six neurograms that were created at 25, 45, and 65 dB T for a stimulus of 1250 Hz for both implants (CEF of ACE at E14 and E8 for F120). The spike rate of all the fibers is color-coded, with the position of the fiber along the basilar membrane on the y-axis. At 25 dB T (Figure 6A,B), both areas of excitation were quite similar in width and spike rate. The maximum spike rate for an individual fiber of the ACE neurogram was slightly lower than F120 (680 vs. 720 spikes/s). The ACE neurogram also shows that during the cosine-squared ramp, the electrode contact did not turn on before the base level was reached. At 45 dB T (Figure 6C,D), a greater difference between the two strategies was visible as ACE recruited a larger area of excitation, albeit with slim regions without activity (darker lines) and a lower maximum spike rate (920 vs. 1000 spikes/s). F120 had a more focused area of excitation with higher firing rate. At 65 dB T (Figure 6E,F), this pattern of excitation continued, but here some cross-turn stimulation was visible for ACE (at 700–900°). Also for F120, cross-turn stimulation was sometimes visible at different CEFs in this same region of the cochlea. For both strategies, the area of excitation was broader at 65 dB T than when compared to the lower sound level.

Figure 6.
Neurograms for a stimulus of 1250 Hz for 25 dB T with (A) ACE and (B) F120, for 45 dB T with (C) ACE and (D) F120, and for 65 dB T with (E) ACE and (F) F120. The y-axis indicates the location of the fibers in the cochlea in degrees from the round window, from base to apex. Each color bar is shared per row and indicates the individual spike rates of each fiber.
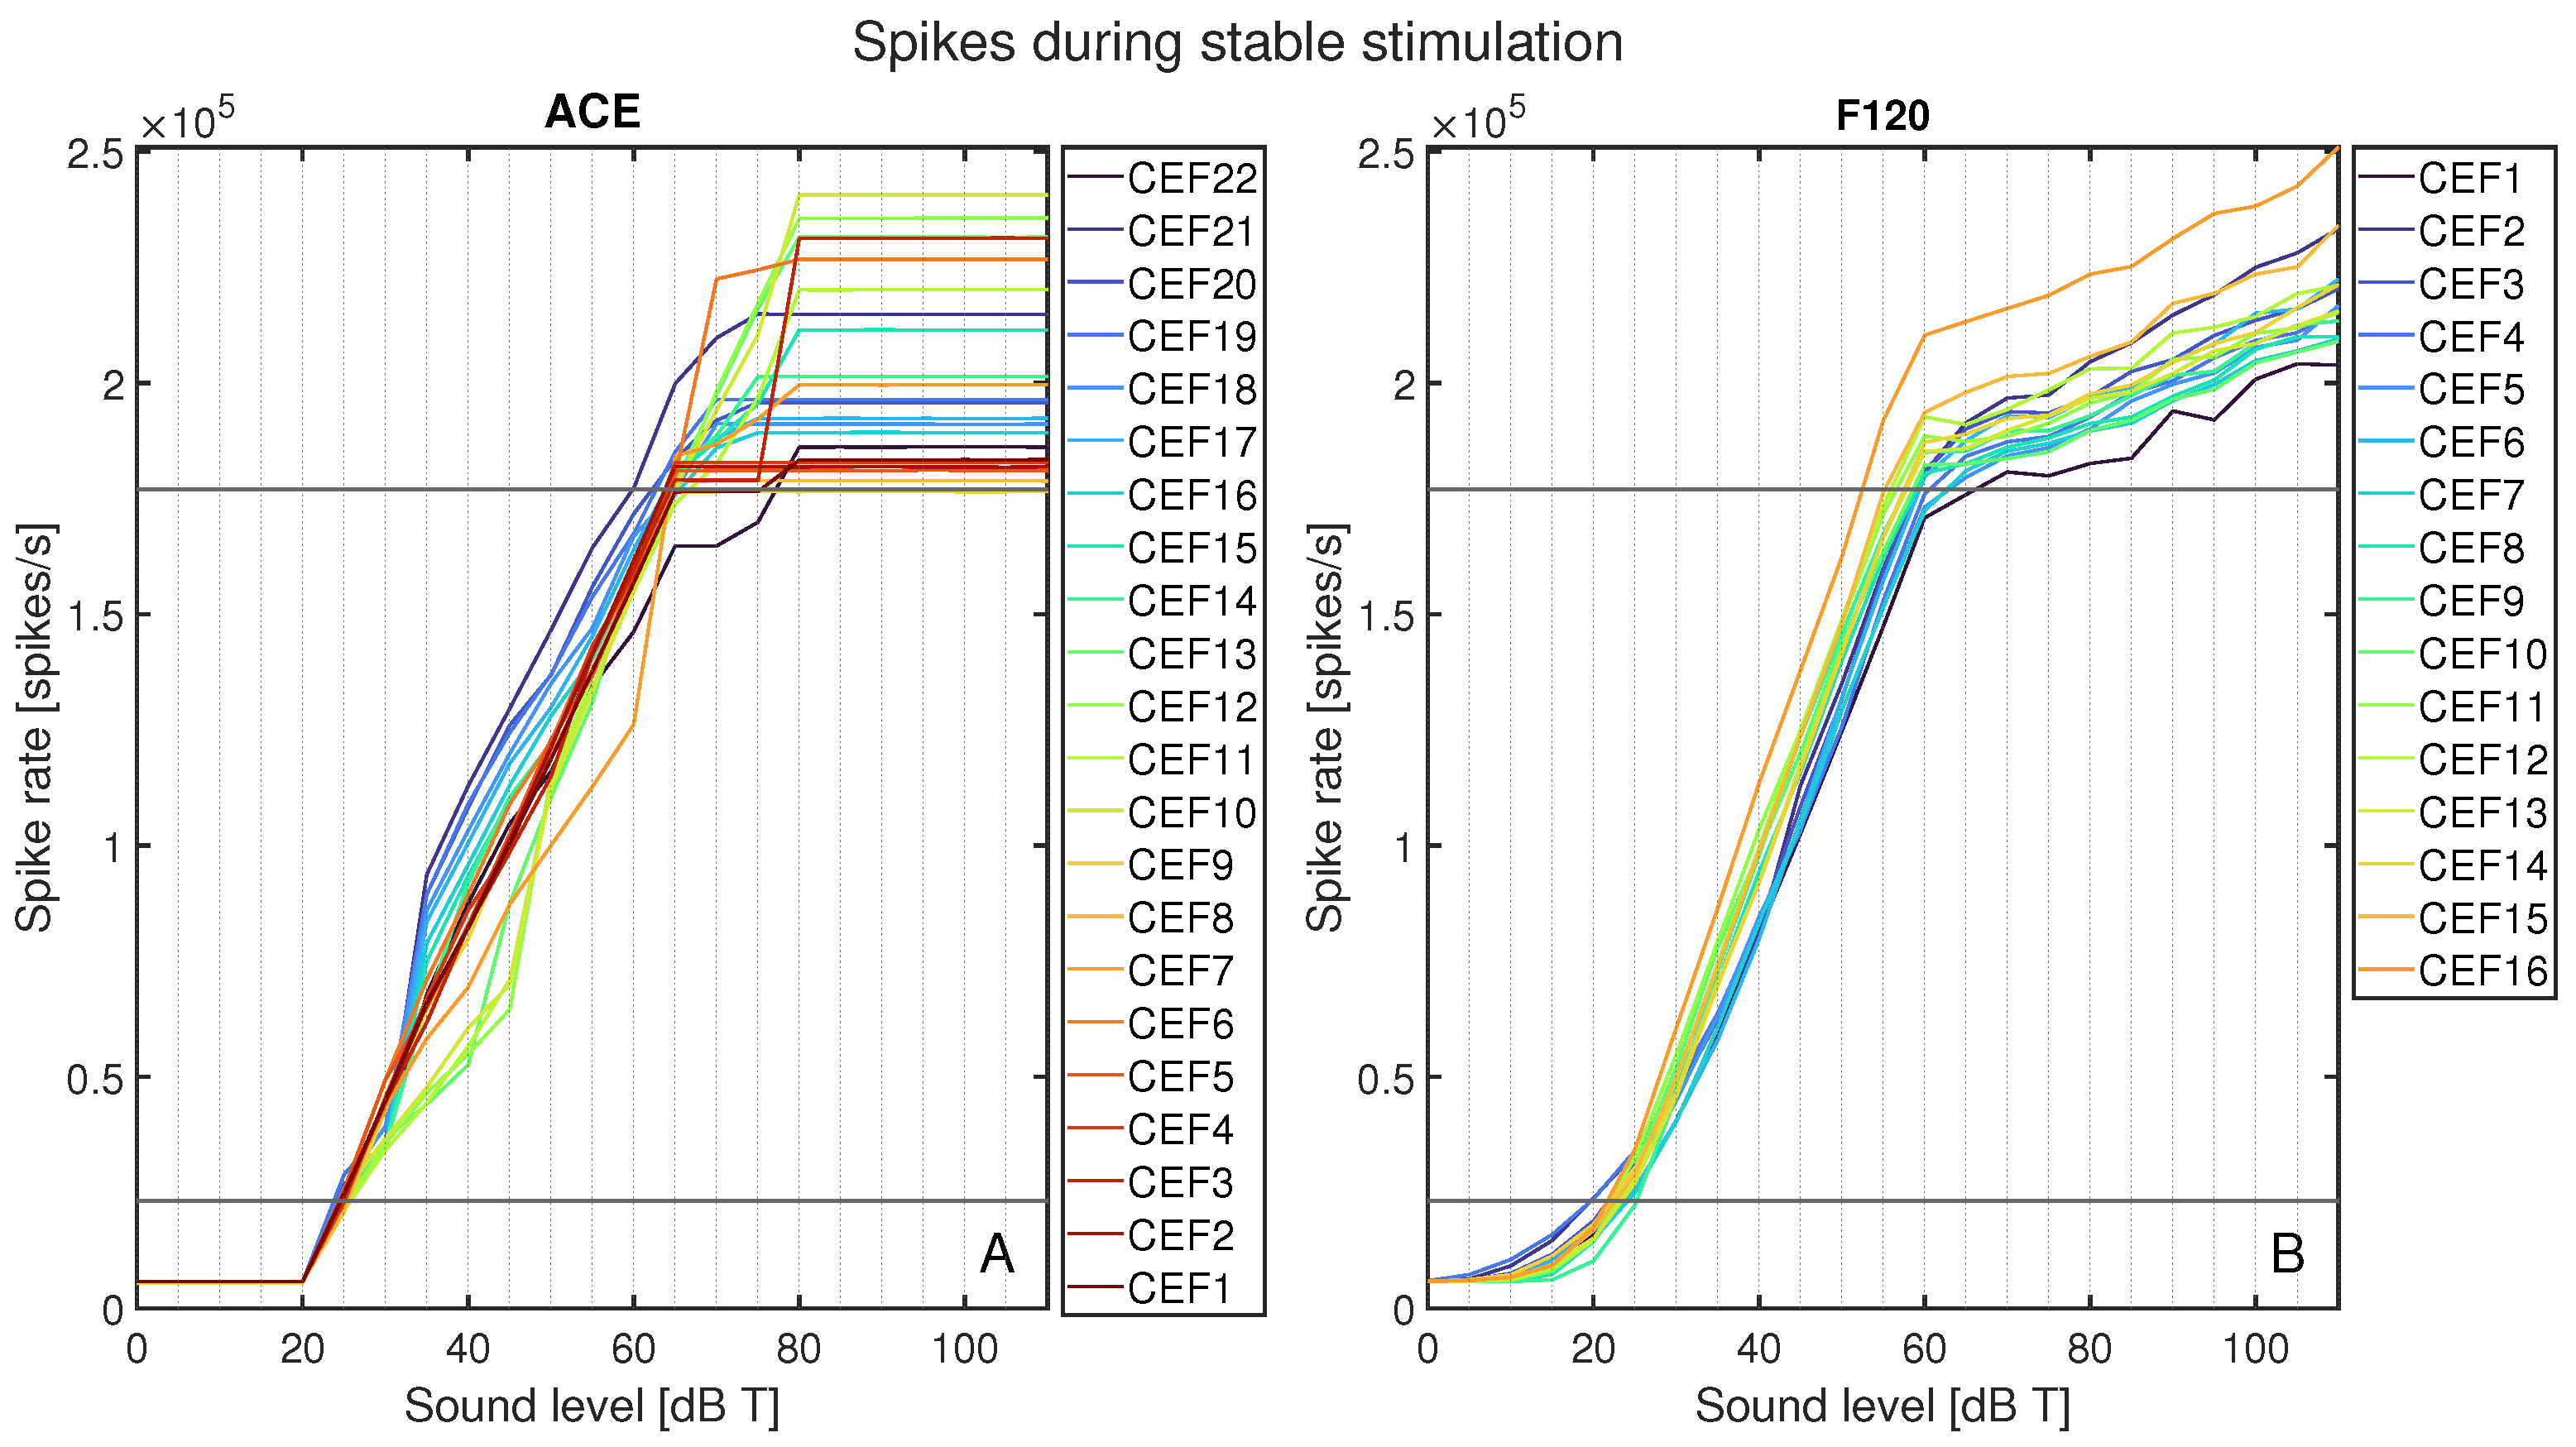
The total spike rates for each CEF’s area of interest are plotted in Figure 7 as spike rate versus sound level in dB T. Figure 7A shows all spike rates for ACE, and Figure 7B for F120. This figure shows an abrupt activation for ACE at 25 dB T, whereas F120 had a slow increase in activation starting from 0 dB T. Between T-level and M-level, the increase in neural activation for F120 followed a linear pattern. For ACE, while the spike rate always increased monotonically, it did so less smoothly than for F120, with greater variation between different CEFs. Above 60 dB T, the neural activation of F120 still increased, but at a lower slope, in line with the AGC catching in. Contrarily, ACE’s neural activation still increased up to 75 dB T, but plateaued after this level for all CEFs. With ACE, the electrode contacts located centrally on the array tended to have a gradual increase in neural activation up to 45 dB T, which more steeply increased, to the highest plateaus. The basal CEFs showed the opposite behavior: they had higher neural activation between 35 and 55 dB T, but plateaued at a lower maximum activation. For F120, the order of the curves stayed consistent during the entire loudness sweep: the basal contacts tended to have the lowest neural activation, and the apical ones the highest.
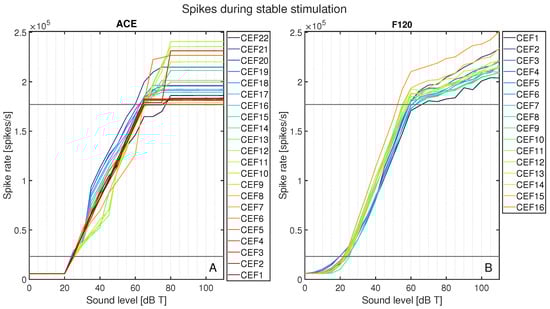
Figure 7.
Total spike rate for ACE (A) and F120 (B) after loudness calibration for each stimulus from 0 to 110 dB T in steps of 5 dB. Each color represents the response to a center electrode frequency (CEF) matching the electrode contact number, so that CEF22 is the CEF of ACE electrode contact 22. The horizontal black lines indicate the calibrated neural activation fitted at threshold and comfort levels.
3.3. Electric Activation
To gain more insights into the behavior of the two strategies over the electric dynamic range, the following section studies the electric activation in response to a stimulus with the CEF of the corresponding CE and its neighboring electrode contacts (CE + 1 and CE − 1).
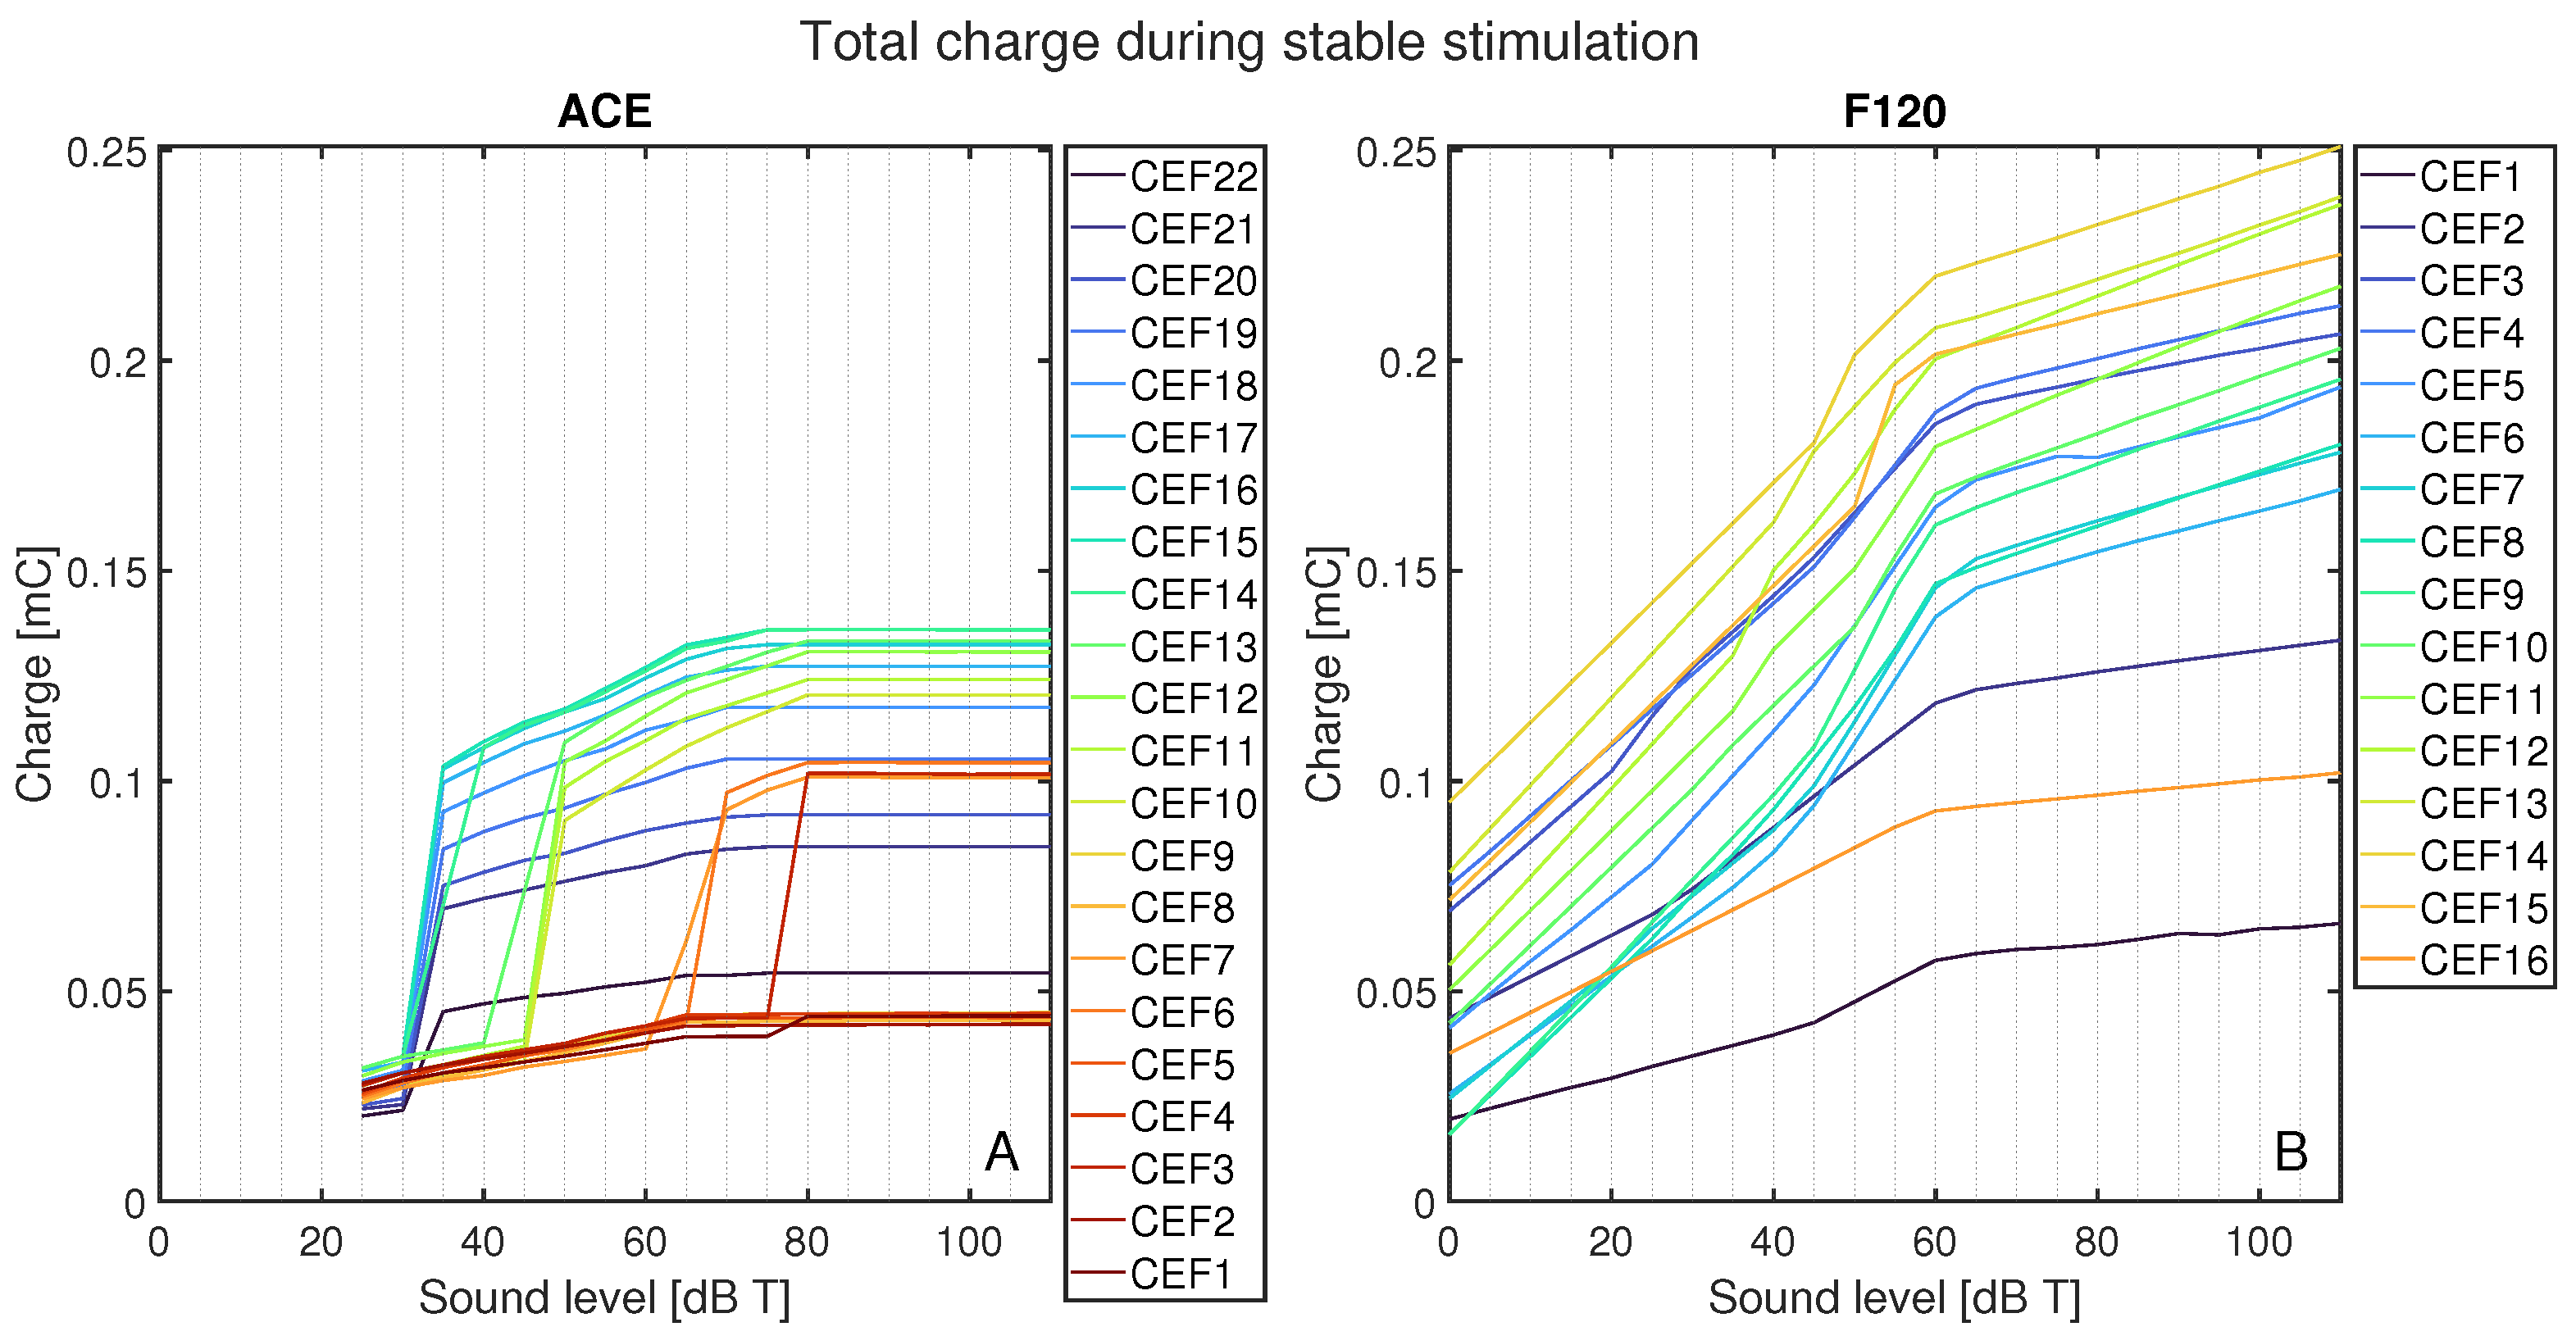
Figure 8 shows the total charge delivered per CEF to its respective CE, CE + 1, and CE − 1 during the stable part of the stimulus and normalized to 1 s, as a function of sound level for ACE (Figure 8A) and F120 (Figure 8B). On average, ACE required less charge to reach the same loudness level. In ACE, there are clear differences in the charge build-up for different CEFs, i.e., their corresponding electrode contacts. All CEFs had an irregular charge curve, but the basal CEFs (CEF1–CEF4, indicated in dark red) produced the lowest amount of total charge, followed by the apical CEFs (CEF20–CEF22, indicated in purple). The CEFs located in the middle of the array produced the highest charge. The plateau in total charge above 80 dB T is also clear in this figure. Interestingly, the smooth slopes in F120 showed a pattern: CEFs producing a low total charge at 0 dB T consistently had lower total charge for each loudness step when compared to CEFs that started with a higher charge at 0 dB T. With this strategy, the CEFs at the basal part of the array (CEF12–CEF15) tended to produce a higher total charge, except CEF16.
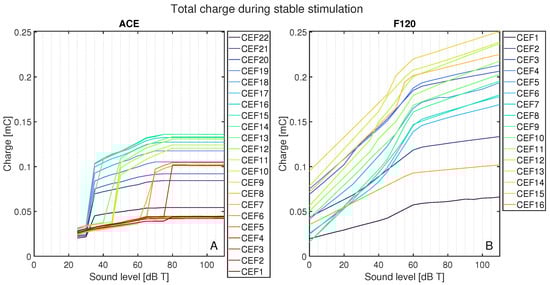
Figure 8.
Total charge for each CEF from its CE, CE + 1, and CE − 1 from 0 to 110 dB T in steps of 5 dB T for (A) ACE and (B) F120. Each color represents the response to a center electrode frequency (CEF) matching an electrode contact, so that CEF22 is the CEF of ACE electrode contact 22. For both strategies, the CEFs are shown in the legend from apex to base. Below 25 dB T, ACE did not produce any charge.
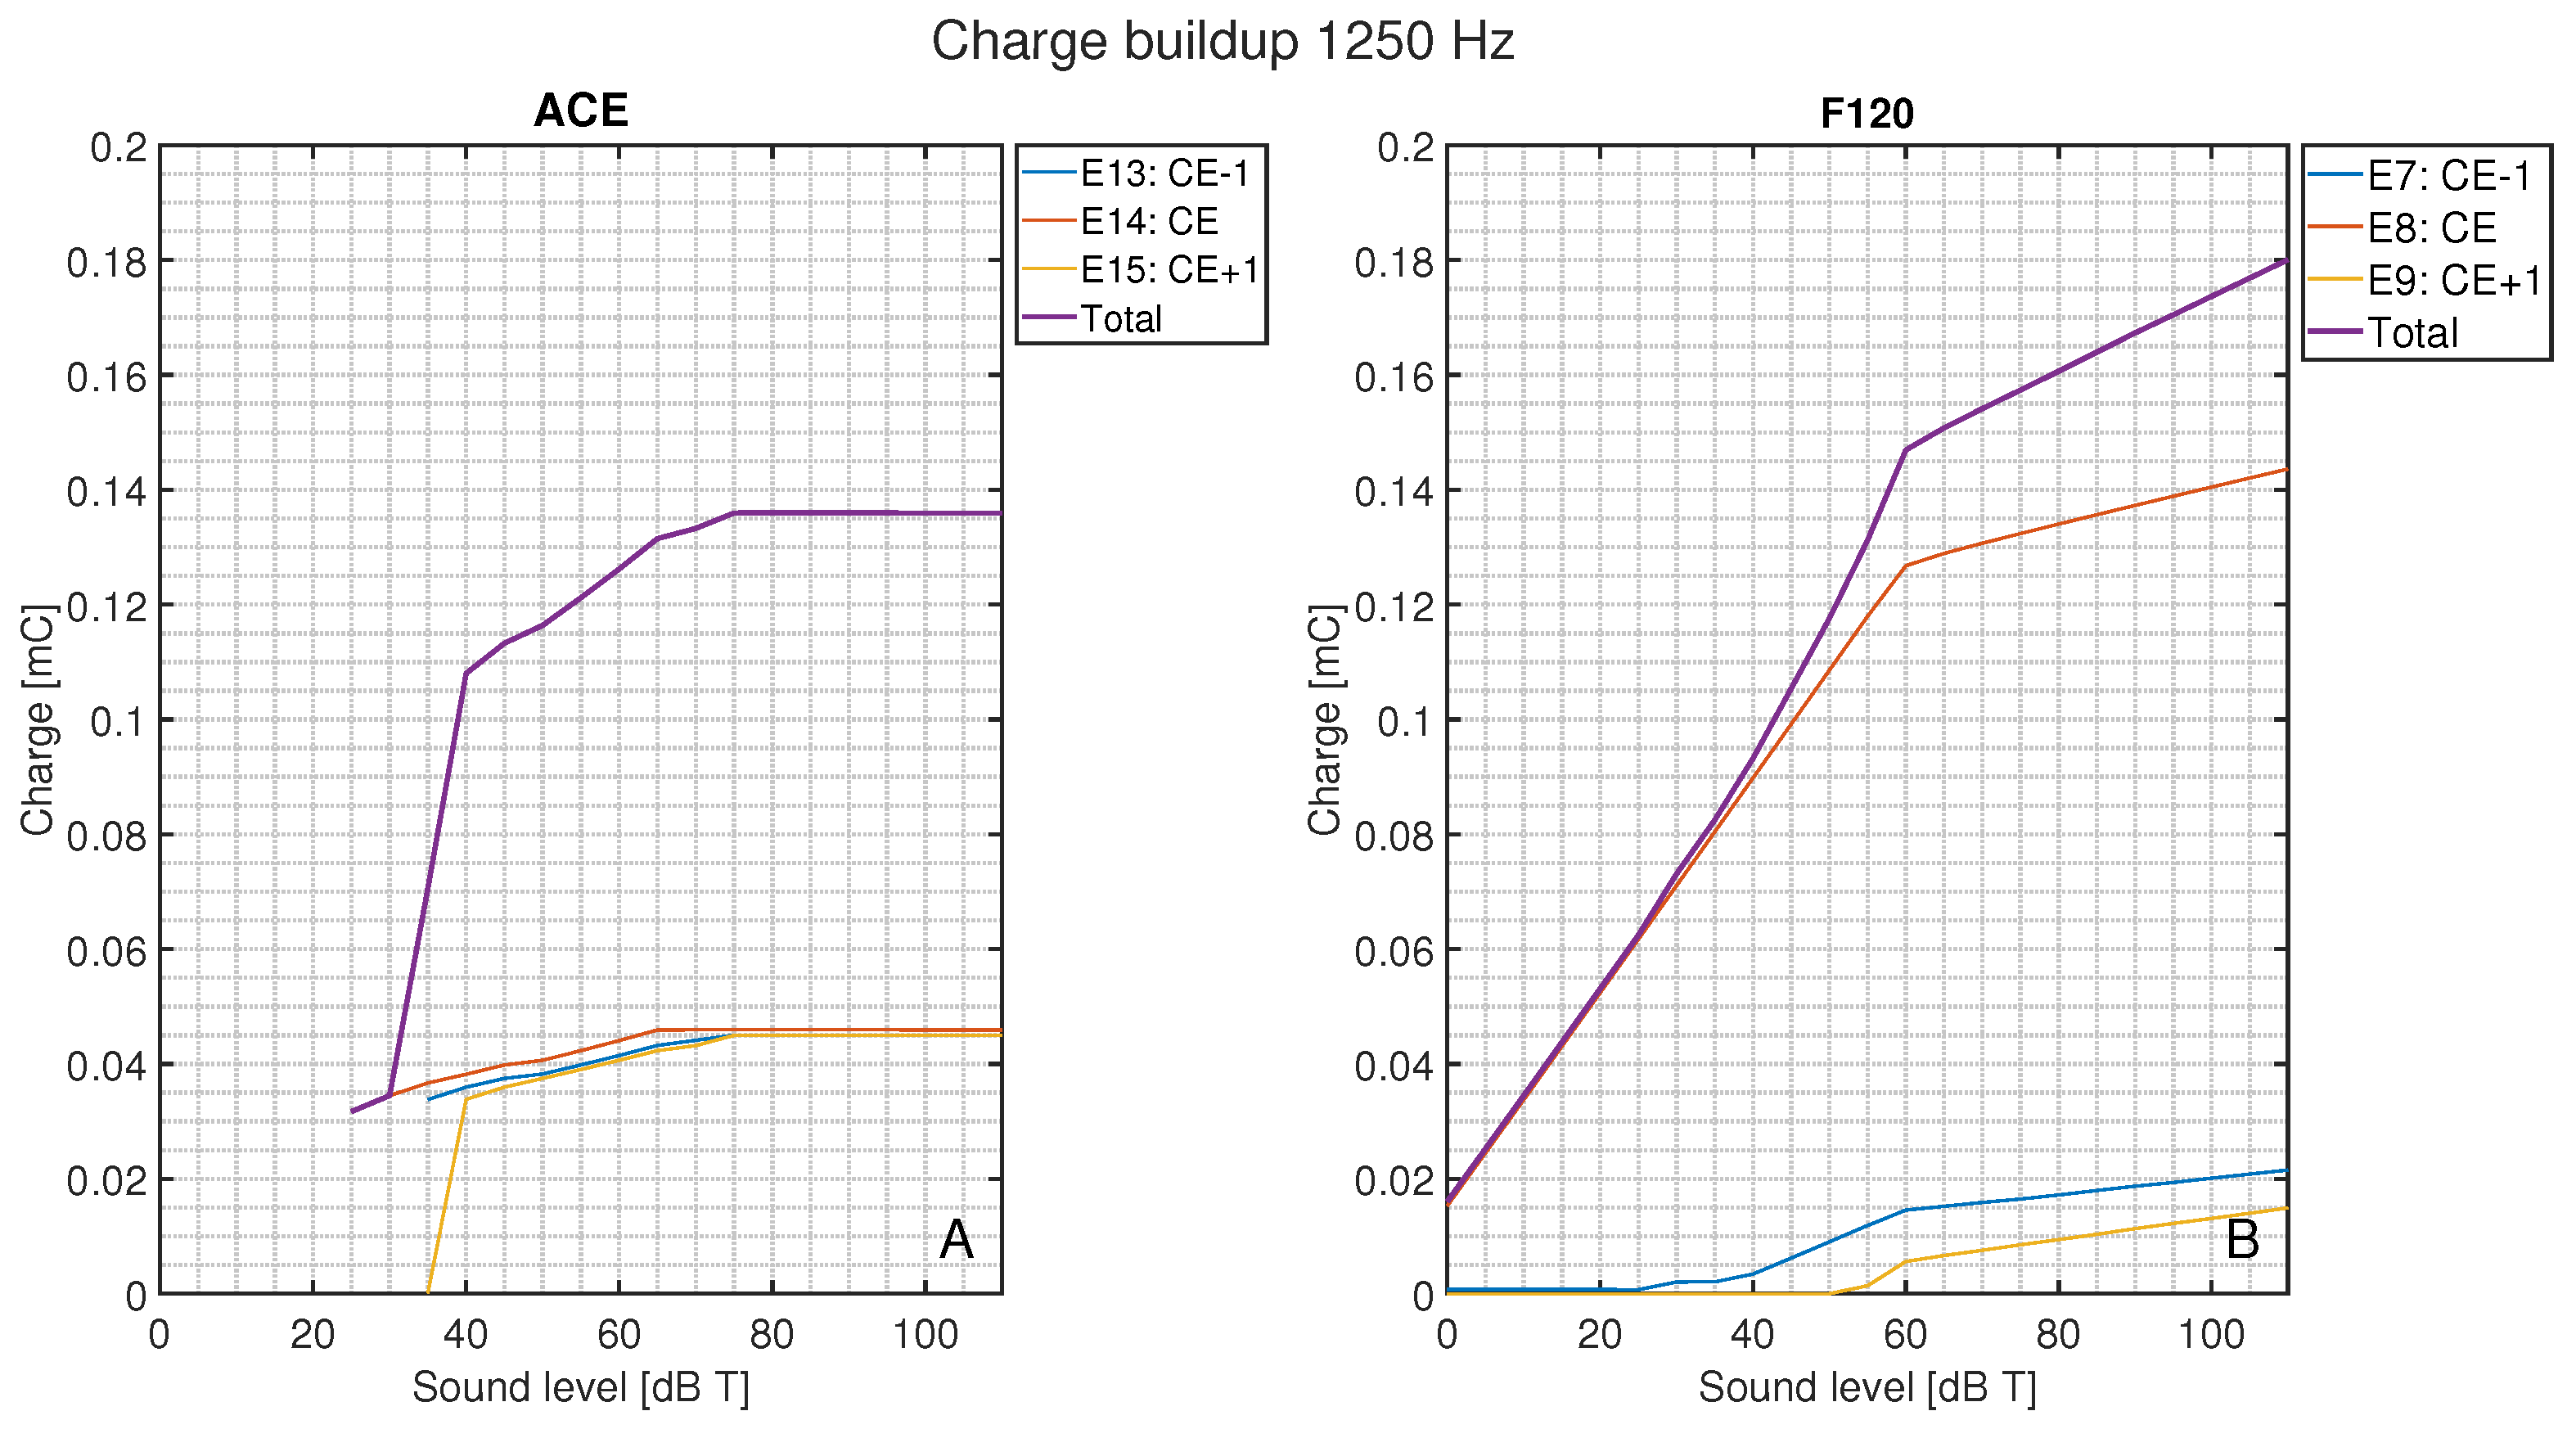
In Figure 9, the total charge injected for a pure tone of 1250 Hz is shown compared to the charge per electrode contact as a function of loudness. For ACE (Figure 9A), the CE + 1 and CE − 1 were activated at input levels just above 30 dB T with a similar magnitude as the CE. These surrounding electrode contacts conveyed a considerable part of the total charge, whereas for F120 (Figure 9B), the CE + 1 and CE − 1 were only recruited at higher loudness levels and had a smaller contribution to the total delivered charge.
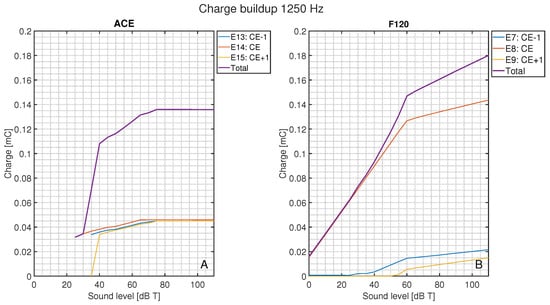
Figure 9.
Total charge during the stable stimulation for the CEF of 1250 Hz as a function of loudness level and the corresponding total charge of the CE, CE + 1, and CE − 1, for (A) ACE and (B) F120. Below 25 dB T, ACE did not produce any charge.
4. Discussion
This paper aimed to increase our understanding of loudness encoding in two different cochlear implant devices from different manufacturers by examining the whole system from sound to auditory nerve responses. The implanted cochlea model was extended to run both F120 and ACE, and pure sine waves were used to calibrate loudness to include every aspect of both SCSs. This work has highlighted notable differences between the two strategies, for instance, the different patterns in the area of excitation. By utilizing pure tones as input to the SCSs, we could also show the difference in recruitment of electrodes over the loudness growth curves. This use of sound waves reflects the loudness encoding similar to the real-world responses, contrary to the use of simple pulse trains. It is important to note that all differences described here between the SCSs do not say anything about their clinical performance, but merely explain how loudness is conveyed by both strategies.
The neurograms shown in Figure 6 show a clear difference at a neural level in the way fibers are activated per SCS. When loudness increases, ACE induces an active increase in area of excitation by recruiting neighboring electrode contacts (see Figure 9), whereas the increase in area of activation for F120 was mainly the effect of current spread, rather than active use of more electrode contacts. F120 first increases the individual spike rate locally. This can be a fundamental difference in the way the SCSs encode loudness; however, the fact that ACE is an N-of-M speech coding strategy may also play a role. N-of-M strategies stimulate the (in this case) eight most dominant analysis bands. With a pure tone stimulus, an increase in energy of the signal may cause energy to spread to neighboring channels because of partially overlapping analysis filters. As there is no other frequency present, this automatically means that this energy spread is perceived as dominant, which is then processed as such by the ACE SCS and leads to neighboring electrode contract recruitment. However, with these pure tone stimuli, the maximum number of dominant bands was always lower than eight.
The loudness growth curves of Figure 7 clearly illustrate the response of the auditory nerve to different sound levels. It can be seen that F120 stimulates below 25 dB T, while ACE turns on abruptly, matching literature descriptions of the strategies [11,12]. For ACE, the electrode contacts reach C-level stimulation at 65 dB T and plateau after the defined C-level, while F120 continues to increase above M-level, albeit with the defined 1:12 compression defined in the AGC [12].
Comparing Figure 7 and Figure 8 demonstrates that ACE (with the Slim Straight array) can reach equal loudness with less total charge than F120 (with the Mid-Scala array). This has several reasons. Firstly, ACE recruits more auditory nerve fibers than F120 by broadening their signal along the electrode array, i.e., recruitment of adjacent electrodes. Secondly, it may also be the effect of the difference in pulse shape between the strategies. ACE uses an interphase gap (Table 1, also visible in the electrodogram of Figure 3), which increases the responsiveness of the auditory nerve fiber to the first phase of the pulse [5], as we could also observe in our model. Thirdly, the generally higher charge delivered by F120 can be due to the higher stimulation rate of this strategy. It would be interesting to match the stimulation rate and pulse shape of ACE to that of F120 to test this hypothesis. Based on our findings and the literature, we expect that the charge needed for ACE to reach a certain spike level would be more similar to F120 than it is now. Fourthly, another difference between the two implants is the position of the electrode arrays. The Slim Straight array is situated close to the lateral wall, whereas the Mid-Scala array is in the center of the scala tympani. A greater distance from the modiolus results in more current spread and thus a wider area of activation (see [25] or other comparable models).
Similarly, this effect of greater spread is visible in Figure 6. E14 of ACE is situated farther from the modiolus than E8 of F120 (see red electrode contacts in Figure 1B,C) and has a wider area of activation even when only one electrode is active at T-level (Figure 6A,B). This spread was not present in the hypothetical lateral wall arrays, which were positioned at the same distance from the modiolus (Figure 4). Although the arrays are placed in identical cochlear geometries, the array of ACE is modeled to be implanted slightly deeper into the cochlea, based on clinical CT-scans (Figure 1), which is reflected in the position of excitation in Figure 6. Interestingly, although the electrode array position has an effect on the width of activation, this is not reflected in large differences in necessary total charge (Figure 5B and Figure 8).
The difference in charge build-up, as shown in Figure 8, has the same pattern as the spike rates of Figure 7. The sudden strong activation of neighboring electrode contacts in ACE leads to jumps in spike rate, whereas the gradual charge increase on each electrode contact of F120 is reflected in a smoother increase of the spike rate. It would be interesting to investigate if the difference in smooth or jumping behavior of these neural loudness growth functions is reflected in patient perception. Tak and Yathiraj [26] researched intensity discrimination in implanted and normal hearing children (13 out of 15 with ACE) and found that, especially in high frequencies, implanted children had poorer intensity discrimination than their normal hearing counterparts. The highest stimulus used was 4000 Hz, comparable to CEF5 and CEF6 in Figure 7 and Figure 8, which show the shallowest buildup in charge and neural spikes for these inputs, which is in line with a higher just noticeable difference for loudness.
Figure 7 also shows that for many CEFs, F120 reaches the defined M-level in spike rate below 65 dB T and that AGC compression already occurs below M-level. In the literature there are different default values for the AGC knee-point; Vaerenberg et al. [10] shows compression from 60 dB, Wolfe [9] states that the default value for AGC is around 63 dB; the research code provided by AB defines it as −53.6 dB below the full scale maximum, which would mean 56 dB in this study. In all cases, that means that the fitting of M-level at 65 dB always happens in the compression zone of the AGC. In this study, the main difference between the fitting and the final stimulation was the enabling of subthreshold pulses for F120 over all electrode contacts for the final run, whereas they were only enabled on three electrode contacts during fitting. Apparently, this activation of subthreshold pulses over the entire cochlea changes the responsiveness of the auditory nerve fibers in such a way that M-level stimulation is reached at lower sound levels.
In this study, pure tone stimuli were used in the calibration of the two SCSs. This differs from clinical practice, where the fitting of T- and C- or M-level is done with pulse trains. These pulse trains do not take the effect of the pre-emphasis into account, and are not affected by the AGC or subthreshold pulses used in real stimulation. However, this study demonstrates that these factors have quite a large effect on the way loudness is encoded. Computational model studies that exclude these front-end processes, and psychophysical studies that directly work with electric pulse trains, might therefore oversimplify loudness encoding.
In previous work, the T- and M-level stimulation of this model was expressed in excitation width along the basilar membrane [22], which was partly informed by model simulations of psychophysical experiments [21]. We have built upon this work to set our baseline spike rates, albeit several characteristics were different, such as array type and included stimuli. Although the spike rate values chosen for our definitions of T- and C- or M-levels are therefore to some extent arbitrary, using different values would influence all electrode contacts equally, so the comparisons between the strategies made in this paper would still be unaffected.
There are also important limitations to this study. Loudness is generally hypothesized to depend on the total integrated activity of the cochlear nerve, but the true neural correlates have yet to be elucidated [27]. We have based our method on this hypothesis and may have oversimplified the true workings of loudness coding, as we do not take higher-level processing or neural plasticity into account, which may also affect loudness perception. Another limitation is the validity of the research versions of the SCSs. Our settings used in the strategies have been verified as much as possible by literature and through personal correspondence with the respective companies, but there may still be differences between our version and the clinically implemented SCSs. Additionally, specific pre- or post-processing created by both companies to increase speech-understanding in noisy environments can affect loudness as they repress the signal of noisy channels and increase lower energy channels, improving speech-in-noise perception [28]. However, the pure-tone stimuli used in this paper were perceived as “noise” by these algorithms, resulting in suppression of the signal we are trying to measure.
In future studies, this implanted cochlea model can be used to objectively investigate many more differences between SCSs. It is a diverse tool that can be extended to run with other SCSs, also from different manufacturers, like Med-El, whose SCSs were, unfortunately, not available to us for this study. A major area of interest is the encoding of frequency information. Many studies have investigated pitch encoding showing electrodograms, patient outcomes, neural activation, or a combination of these (e.g., see [29] for a comparison between three implants based on pure tones, [30] for ACE with harmonic complexes, or see [31] for place and temporal pitch encoding in three different implants). This subject is beyond the scope of the current paper, but future work will focus on including this topic in our modeling pipeline. Other research topics could include looking at the stimuli used in psychophysical experiments, the interaction between perceived pitch and loudness, or temporal encoding. The focus could also be on CI-specific characteristics such as changing pulse rate, pulse shape, or dynamic range of the implants. It is also possible to examine different electrode array designs, cochlear anatomies, and pathologies, and investigate what happens to a neural signal if auditory nerve fiber health deteriorates or the electrode array is placed in a different position in the cochlea.
5. Conclusions
This paper demonstrates that differences found between speech coding strategies in cochlear implants are not only patient-dependent, but are to a large extent also caused by fundamental differences in the way loudness is encoded. Including the full system in the model, from sound via electrodogram, to neural activation, has shown that encoding loudness in CIs is not as straightforward as it sometimes seems and that analyses that only consider the electric output might oversimplify this process.
Author Contributions
Conceptualization, J.J.B. and J.H.M.F.; methodology, I.M.V. and S.S.M.M.; software, S.S.M.M., R.K.K. and I.M.V.; validation, S.S.M.M. and I.M.V.; formal analysis, I.M.V., S.S.M.M. and R.K.K.; investigation, I.M.V. and S.S.M.M.; resources, S.S.M.M. and R.K.K.; data curation, S.S.M.M. and I.M.V.; writing—original draft preparation, I.M.V. and S.S.M.M.; writing—review and editing, I.M.V., S.S.M.M., R.K.K., J.J.B. and J.H.M.F. visualization, I.M.V., S.S.M.M. and R.K.K.; supervision, J.J.B. and J.H.M.F.; project administration, I.M.V.; funding acquisition, J.J.B. and J.H.M.F. All authors have read and agreed to the published version of the manuscript.
Funding
The collaboration project TEMPORAL is co-funded by PPP Allowance awarded by Health∼Holland, Top Sector Life Sciences & Health, to stimulate public–private partnerships (grant number LSHM20101). The PhD trajectory of I.M. Venema is financially supported by Advanced Bionics.
Institutional Review Board Statement
Not applicable.
Informed Consent Statement
Not applicable.
Data Availability Statement
Data available upon request.
Acknowledgments
We would like to thank Phillipp Hehrmann (Advanced Bionics) for answering our questions about the SpecRes code and Filiep Vanpoucke (Cochlear) for providing us with the NMT.
Conflicts of Interest
The authors declare no conflicts of interest.
Appendix A
Determination of Internal T-Level per Electrode Contact
Electrode contact outputs in response to stimuli of their respective CEFs were plotted for different dB SPL inputs until the electrode contact stimulated at the previously defined base level, or T-level.
To determine what input level of loudness is needed in dB SPL to reach the desired loudness in dB T, the following formula was used:
where indicates the difference in loudness between the reference electrode contact and electrode contact n and can be taken from Table A1.
Table A1.
Overview of center frequencies (CEFs) for each electrode contact of both SCS with their required difference in loudness input in dB SPL to reach T-level stimulation.
Table A1.
Overview of center frequencies (CEFs) for each electrode contact of both SCS with their required difference in loudness input in dB SPL to reach T-level stimulation.
| ACE | F120 | ||||
|---|---|---|---|---|---|
|
Electrode Contact Number |
CEF (Hz) | (dB SPL) |
Electrode Contact Number |
CEF (Hz) | (dB SPL) |
| E22 | 250 | 13.8 | E1 | 306 | 8.9 |
| E21 | 375 | 10.3 | E2 | 442 | 5.6 |
| E20 | 500 | 7.8 | E3 | 578 | 5.0 |
| E19 | 625 | 5.9 | E4 | 646 | 4.0 |
| E18 | 750 | 4.3 | E5 | 782 | 3.5 |
| E17 | 875 | 3.0 | E6 | 918 | 2.5 |
| E16 | 1000 | 1.8 | E7 | 1054 | 2.0 |
| E15 | 1125 | 0.8 | |||
| E14 | 1250 | 0.0 | E8 | 1257 | 0.0 |
| E13 | 1437 | −1.2 | E9 | 1529 | −0.5 |
| E12 | 1687 | −2.6 | |||
| E11 | 1937 | −3.7 | E10 | 1801 | −1.5 |
| E10 | 2187 | −4.7 | E11 | 2141 | −2.0 |
| E9 | 2500 | −5.8 | E12 | 2549 | −3.0 |
| E8 | 2875 | −6.9 | E13 | 3025 | −3.5 |
| E7 | 3312 | −8.0 | E14 | 3568 | −4.5 |
| E6 | 3812 | −9.0 | |||
| E5 | 4375 | −9.8 | E15 | 4248 | −5.5 |
| E4 | 5000 | −10.7 | |||
| E3 | 5687 | −11.3 | |||
| E2 | 6500 | −11.9 | |||
| E1 | 7437 | −10.7 | E16 | 8054 | −2.9 |
References
- Zeng, F.G. Celebrating the one millionth cochlear implant. JASA Express Lett. 2022, 2, 077201. [Google Scholar] [CrossRef] [PubMed]
- Limb, C.J.; Roy, A.T. Technological, biological, and acoustical constraints to music perception in cochlear implant users. Hear. Res. 2014, 308, 13–26. [Google Scholar] [CrossRef] [PubMed]
- Macherey, O.; Carlyon, R.P. Cochlear implants. Curr. Biol. 2014, 24, R878–R884. [Google Scholar] [CrossRef] [PubMed]
- Khater, A.; El Shennaway, A.; Anany, A. Improvement of cochlear implant performance: Changes in dynamic range. Egypt. J. Otolaryngol. 2015, 31, 36–41. [Google Scholar] [CrossRef]
- McKay, C.M. Applications of phenomenological loudness models to cochlear implants. Front. Psychol. 2021, 11, 611517. [Google Scholar] [CrossRef]
- Balkany, T.; Hodges, A.; Menapace, C.; Hazard, L.; Driscoll, C.; Gantz, B.; Kelsall, D.; Luxford, W.; McMenomy, S.; Neely, J.G.; et al. Nucleus freedom North American clinical trial. Otolaryngol.—Head Neck Surg. 2007, 136, 757–762. [Google Scholar] [CrossRef]
- Riss, D.; Hamzavi, J.S.; Blineder, M.; Flak, S.; Baumgartner, W.D.; Kaider, A.; Arnoldner, C. Effects of stimulation rate with the FS4 and HDCIS coding strategies in cochlear implant recipients. Otol. Neurotol. 2016, 37, 882–888. [Google Scholar] [CrossRef]
- Bonnet, R.M.; Boermans, P.P.B.; Avenarius, O.F.; Briaire, J.J.; Frijns, J.H. Effects of pulse width, pulse rate and paired electrode stimulation on psychophysical measures of dynamic range and speech recognition in cochlear implants. Ear Hear. 2012, 33, 489–496. [Google Scholar] [CrossRef]
- Wolfe, J. Cochlear Implants: Audiologic Management and Considerations for Implantable Hearing Devices; Plural Publishing: San Diego, CA, USA, 2018; Volume 1. [Google Scholar]
- Vaerenberg, B.; Govaerts, P.J.; Stainsby, T.; Nopp, P.; Gault, A.; Gnansia, D. A uniform graphical representation of intensity coding in current-generation cochlear implant systems. Ear Hear. 2014, 35, 533–543. [Google Scholar] [CrossRef]
- Nogueira, W.; Büchner, A.; Lenarz, T.; Edler, B. A psychoacoustic “NofM”-type speech coding strategy for cochlear implants. EURASIP J. Adv. Signal Process. 2005, 2005, 101672. [Google Scholar] [CrossRef]
- Nogueira, W.; Litvak, L.; Edler, B.; Ostermann, J.; Büchner, A. Signal processing strategies for cochlear implants using current steering. EURASIP J. Adv. Signal Process. 2009, 2009, 1–20. [Google Scholar] [CrossRef]
- Townshend, B.; Cotter, N.; Van Compernolle, D.; White, R. Pitch perception by cochlear implant subjects. J. Acoust. Soc. Am. 1987, 82, 106–115. [Google Scholar] [CrossRef] [PubMed]
- Kalkman, R.K.; Briaire, J.J.; Frijns, J.H. Current focussing in cochlear implants: An analysis of neural recruitment in a computational model. Hear. Res. 2015, 322, 89–98. [Google Scholar] [CrossRef] [PubMed]
- van Gendt, M.J.; Briaire, J.J.; Kalkman, R.K.; Frijns, J.H. A fast, stochastic, and adaptive model of auditory nerve responses to cochlear implant stimulation. Hear. Res. 2016, 341, 130–143. [Google Scholar] [CrossRef] [PubMed]
- Kalkman, R.K.; Briaire, J.J.; Dekker, D.M.; Frijns, J.H. The relation between polarity sensitivity and neural degeneration in a computational model of cochlear implant stimulation. Hear. Res. 2022, 415, 108413. [Google Scholar] [CrossRef]
- Schwarz, J.R.; Reid, G.; Bostock, H. Action potentials and membrane currents in the human node of Ranvier. Pflügers Archiv. 1995, 430, 283–292. [Google Scholar] [CrossRef]
- Kalkman, R.K.; Briaire, J.J.; Dekker, D.M.; Frijns, J.H. Place pitch versus electrode location in a realistic computational model of the implanted human cochlea. Hear. Res. 2014, 315, 10–24. [Google Scholar] [CrossRef]
- de Nobel, J.; Martens, S.S.; Briaire, J.J.; Bäck, T.H.; Kononova, A.V.; Frijns, J.H. Biophysics-inspired spike rate adaptation for computationally efficient phenomenological nerve modeling. Hear. Res. 2024, 447, 109011. [Google Scholar] [CrossRef]
- Verbist, B.M.; Skinner, M.W.; Cohen, L.T.; Leake, P.A.; James, C.; Boëx, C.; Holden, T.A.; Finley, C.C.; Roland, P.S.; Roland, J.T., Jr.; et al. Consensus panel on a cochlear coordinate system applicable in histologic, physiologic, and radiologic studies of the human cochlea. Otol. Neurotol. 2010, 31, 722–730. [Google Scholar] [CrossRef]
- Snel-Bongers, J.; Briaire, J.J.; van der Veen, E.H.; Kalkman, R.K.; Frijns, J.H. Threshold levels of dual electrode stimulation in cochlear implants. J. Assoc. Res. Otolaryngol. 2013, 14, 781–790. [Google Scholar] [CrossRef]
- Briaire, J.J.; Frijns, J.H. The consequences of neural degeneration regarding optimal cochlear implant position in scala tympani: A model approach. Hear. Res. 2006, 214, 17–27. [Google Scholar] [CrossRef]
- McKay, C.M.; Remine, M.D.; McDermott, H.J. Loudness summation for pulsatile electrical stimulation of the cochlea: Effects of rate, electrode separation, level, and mode of stimulation. J. Acoust. Soc. Am. 2001, 110, 1514–1524. [Google Scholar] [CrossRef]
- Alvarez, F.; Kipping, D.; Nogueira, W. A computational model to simulate spectral modulation and speech perception experiments of cochlear implant users. Front. Neuroinform. 2023, 17, 934472. [Google Scholar] [CrossRef] [PubMed]
- Kalkman, R.K.; Briaire, J.J.; Frijns, J.H. Stimulation strategies and electrode design in computational models of the electrically stimulated cochlea: An overview of existing literature. Netw. Comput. Neural Syst. 2016, 27, 107–134. [Google Scholar] [CrossRef] [PubMed]
- Tak, S.; Yathiraj, A. Comparison of intensity discrimination between children using cochlear implants and typically developing children. J. Int. Adv. Otol. 2019, 15, 368. [Google Scholar] [CrossRef]
- Pickles, J.O. An Introduction to the Physiology of Hearing; Academic Press: London, UK, 1988; Volume 2. [Google Scholar]
- Wolfe, J.; Schafer, E.C.; John, A.; Hudson, M. The effect of front-end processing on cochlear implant performance of children. Otol. Neurotol. 2011, 32, 533–538. [Google Scholar] [CrossRef]
- Stupak, N.; Todd, A.E.; Landsberger, D.M. Place-pitch interval perception with a cochlear implant. Ear Hear. 2021, 42, 301–312. [Google Scholar] [CrossRef]
- Swanson, B.A.; Marimuthu, V.M.; Mannell, R.H. Place and temporal cues in cochlear implant pitch and melody perception. Front. Neurosci. 2019, 13, 1266. [Google Scholar] [CrossRef]
- Goldsworthy, R.L.; Bissmeyer, S.R. Cochlear implant users can effectively combine place and timing cues for pitch perception. Ear Hear. 2023, 44, 1410–1422. [Google Scholar] [CrossRef]
Disclaimer/Publisher’s Note: The statements, opinions and data contained in all publications are solely those of the individual author(s) and contributor(s) and not of MDPI and/or the editor(s). MDPI and/or the editor(s) disclaim responsibility for any injury to people or property resulting from any ideas, methods, instructions or products referred to in the content. |
© 2025 by the authors. Licensee MDPI, Basel, Switzerland. This article is an open access article distributed under the terms and conditions of the Creative Commons Attribution (CC BY) license (https://creativecommons.org/licenses/by/4.0/).