1. Introduction
According to the World Bank, global waste generation is expected to increase from 2.01 billion tons in 2018 to approximately 3.40 billion tons by 2050 [
1]. Improper waste disposal remains a principal contributor to pollution and environmental degradation, significantly affecting public health. The construction industry is among the leading generators of solid waste. Despite the rapid development of modern infrastructure and the elevation of living standards, rapid urbanization has also resulted in an alarming increase in both municipal solid waste (MSW) and construction and demolition waste (CDW). CDW refers to debris produced during building construction, renovation, and demolition [
2,
3]. With global population growth driving demand for new developments and CDW replacement, CDW volume continues to rise [
4].
A growing challenge such as this underscores the importance of implementing efficient intelligent CDW management systems that identify and process waste quickly and accurately. Globally, MSW volumes are increasing as a result of economic development, population growth, and changes in consumption patterns [
5,
6]. Each year, CDW alone accounts for over 10 billion tons of waste, representing 35% to 40% of the overall amount of waste generated. In the European Union, it accounts for approximately 36% of the total waste, while in the United States, it is responsible for 67% of the total waste [
7]. Demolition waste accounts for 70–90% of the global CDW stream, posing significant environmental challenges related to land use, climate resilience, and natural resource depletion [
8].
Insufficient management of MSW and CDW inhibits sustainable development and negatively impacts economic growth, the environment, and the public health of urban areas [
9]. Research, government agencies, and industry stakeholders recognize the importance of CDW management for sustainability. The CDW management programs developed by countries such as Japan and Germany have demonstrated effective recycling and reuse of CDW [
10]. Technological advancements, particularly in artificial intelligence and machine learning, offer promising opportunities to improve CDW sorting and prediction. It is anticipated that this will reduce the sector’s environmental footprint.
The increasing urbanization in the 21st century, particularly in densely populated urban centers, has significantly contributed to the generation of CDW. Replacement of old, low-rise structures with high-density structures generates considerable waste [
11]. A CDW management strategy typically includes source reduction, reuse, and recycling, with reuse being the most widely adopted of these methods. The United States generated 600 million tons of CDW in 2018—more than double the volume of MSW—at a 75% recycling rate [
12]. The EU also achieved a 75% recovery rate for CDW by 2020 [
13]. In contrast, China recycled only 10% of its CDW, despite setting a national target of 13%. Every year, India recycles only 1.3% of the 150 million tons of waste produced. The UAE’s CDW accounts for 30% of its total waste, much of which is disposed of in landfills [
14].
Saudi Arabia, despite generating 53 million tons of MSW annually, lacks adequate infrastructure for recycling and reuse. An estimated 30% to 40% of this waste is CDW, which results in environmental losses of approximately
$1.3 billion per year [
15]. Unmanaged CDW impacts include resource depletion, increased pollution, and heightened greenhouse gas emissions. These consequences hinder development efforts, damage tourism, and compromise urban health, safety, and aesthetics [
2,
16]. However, successful models such as Japan’s integrated waste management system and Germany’s high recycling efficiency highlight the potential of technology-driven CDW solutions [
17].
There is a large environmental impact associated with CDW, contributing to pollution, resource depletion, and landfill overuse. Recycling promotes greenhouse gas reduction, economic development, and job creation. CDW needs to be managed sustainably to protect the environment [
18]. The construction industry is responsible for a significant share of global environmental degradation, including 23% of air pollution, 40% of drinking water contamination, and 50% of landfill waste and global warming contributions [
19]. Although up to 90% of CDW materials are technically reusable, poor management practices often result in unnecessary landfill disposal. There is a large environmental impact associated with CDW, contributing to pollution, resource depletion, and landfill overuse. Recycling promotes greenhouse gas reduction, economic development, and job creation. CDW needs to be managed sustainably to protect the environment [
20].
Several key barriers to recycling exist, including low landfill disposal fees, readily available inexpensive aggregates, poor-quality recycled materials, and inadequate source separation. Ineffective CDW management contributes to environmental, economic, and social issues, such as habitat destruction, emissions, and a decline in public safety [
21]. By integrating smart technologies such as automated sorting, artificial intelligence-based recycling, and incentive-driven policies, CDW management can be significantly enhanced [
22]. Educational initiatives can further support public awareness and participation. Without proper intervention, CDW may hinder progress toward the UN’s 2030 Sustainable Development Goals.
Aligned with Saudi Arabia’s Vision 2030, major infrastructure and real estate developments across cities like Riyadh, Jeddah, and Dammam are accelerating CDW generation [
23]. Recent research in Saudi Arabia reports CDW generation rates of 50–60 tons per 1000 m
2 for existing construction and up to 1200 tons per 1000 m
2 for demolition [
24]. Mixed soil, concrete blocks, gravel, asphalt, glazed tiles, and various metals and composites are among the components of Saudi Arabia’s CDW [
25]. While many of these materials are non-hazardous, their high generation volume, storage limitations, and logistical challenges make efficient management difficult. Saudi Arabia has responded by establishing recycling plants, expanding green building incentives, and utilizing robotic demolition technologies to improve the handling of CDW [
26]. Accurate classification and prediction of CDW are essential to optimize recycling processes, conserve natural resources, and minimize environmental harm, thus supporting a circular economy [
27].
Despite these efforts, there remains a notable research gap in the development of advanced CDW prediction models, especially in developing nations. To address this problem, the present study introduces “Green Ground”, a convolutional neural network (CNN)-based deep learning framework developed for classifying and predicting different types of CDW, including materials such as autoclaved aerated concrete (AAC), asphalt, ceramics, and concrete. The term Green Ground was selected by the researchers to emphasize the model’s alignment with environmental objectives and its contribution to advancing sustainable waste management practices. Green Ground provides a robust and scalable framework for CDW management by leveraging image-based learning to enhance material classification and prediction accuracy [
28,
29]. This approach holds significant potential to transform recycling operations and substantially reduce waste generation.
As Saudi Arabia continues its transformation under Vision 2030, advanced technologies such as Green Ground can play a pivotal role in environmental sustainability. By automating waste sorting and improving classification accuracy, the model addresses key challenges in CDW recycling. These challenges include data scarcity, processing limitations, and concerns about scalability.
This study aimed to answer the following research questions:
- (A)
How can deep learning models enhance sorting and recycling efficiency in the CDW sector?
- (B)
How can these technologies support Saudi Arabia’s sustainability goals?
- (C)
How can model limitations, such as data availability and training time, be mitigated?
- (D)
What improvements can be made to broaden the model’s applicability across diverse CDW materials?
This research aimed to develop a CNN-based model capable of identifying and predicting CDW types from construction site images. Beyond developing a high-performing model, this study proposes strategies to improve prediction accuracy and operational integration. Ultimately, the Green Ground model represents a significant step toward sustainable waste management by enabling more efficient recycling and supporting national and global environmental objectives.
Key aspects of the Green Ground model include its ability to solve waste management and recycling problems. As CDW continues to increase, it is necessary to develop an adaptable model that can categorize and predict its types. Government and industry can optimize resources through Green Ground by identifying materials and predicting future requirements. Consequently, they will be able to adopt precise strategies to minimize the environmental impact caused by improper waste disposal, thus reducing the need for raw materials. Green Ground’s ability to predict various types of materials will contribute to scientific and technological advancements in this field, leading to the development of recycling systems.
As part of the sustainable waste management field, several key contributions are made. By analyzing images, Green Ground classifies CDW materials, improving recycling efficiency and speed by substantially reducing manual sorting. This model reduces manual sorting and enhances overall efficiency by automating material recognition. To ensure robust model training, well-structured datasets were gathered, labeled, and enhanced. The model was developed into a practical web interface using Gradio, a scalable and adaptable platform that supports more comprehensive recycling systems and environmental initiatives. To ensure the system’s effectiveness and reliability in categorizing waste materials, a wide range of performance metrics was used to assess its effectiveness and reliability.
Essentially, this paper is organized as follows:
Section 2 presents a comprehensive literature review of CDW prediction approaches and their limitations.
Section 3 outlines the methodology, including data collection and model architecture.
Section 4 presents the experimental results. A detailed discussion of the findings is provided in
Section 5, and this study is concluded in
Section 6.
2. Related Work
Various approaches to recycling CDW are discussed in this section, including both traditional and modern approaches. An overview of traditional recycling practices and their environmental impacts is presented and evaluated, highlighting the challenges and limitations faced in recycling CDW. Furthermore, this section discusses the application of life cycle assessment (LCA) for evaluating recycling facilities and identifying gaps in current practices, especially in developing nations.
A foundation for optimizing waste management is built on the integration of advanced technologies. The use of deep learning models can enhance recycling efficiency, addressing the limitations associated with traditional recycling. As part of this process, advanced digital models are used to identify and classify waste and predict materials to be recovered from demolished buildings. An overview of recent studies on waste prediction, recycling efficiency, and the application of deep learning techniques such as semantic segmentation and CNNs is presented. Several issues are discussed, including existing practices and proposed improvements to CDW management in Saudi Arabia.
2.1. Traditional CDW Recycling
Comprehensive CDW recycling is crucial to advancing sustainability. Researchers have examined the benefits of using locally sourced and recycled insulation materials in construction, such as plaster and natural fibers. A comprehensive assessment of the environmental feasibility of CDW recycling has been conducted using life cycle assessment (LCA), illustrating the need for improved recycling practices. Furthermore, an examination of CDW management across different regions has revealed significant barriers to effective recycling, meager recycling rates, and high costs, suggesting that enhanced strategies are critical to achieving sustainability. Five studies have shed light on current CDW recycling practices and point to improvement opportunities, which are discussed in this section.
The building sector produces approximately 36% of the global greenhouse gas emissions and consumes up to 40% of the worldwide energy, thus resulting in a significant impact on the environment. To investigate the use of locally sourced and recycled building insulation materials in Sardinia, a study [
30] focused on plaster and natural fibers used as insulation and plastering materials. The low thermal conductivity of these materials makes them ideal for both the construction of new buildings and the renovation of existing buildings.
In a related effort to mitigate environmental impacts, a study on the environmental feasibility of recycling CDW was presented in [
31]. LCA is a standard method for assessing the environmental impact of products. The study evaluated the recycling facility using ISO14040/14044 [
32,
33] for sustainable management found in [
31,
34]. LCA studies on CDWM are primarily conducted in Europe, according to [
34]. Research gaps are apparent in other areas, especially in developing nations. In the paper, landfilling and steel production were evaluated as factors influencing recycling viability and optimal building conditions. Based on these findings, LCA was used to analyze the production of recycled aggregates (RAs) and natural aggregates (NAs). This shed light on LCA’s role in CDWM and helped develop an effective recycling program. To effectively manage plastic waste, cities must understand existing patterns of waste generation and recycling.
Examining the impact of urbanization, technological advances, and automation on solid waste generation, as well as energy usage and environmental issues, was the central focus of [
35]. Innovative approaches to repurposing municipal, agricultural, and industrial waste were presented, emphasizing sustainable alternatives to landfills. Solid waste can provide economic and environmental benefits, including fertilizers, construction materials, biofuels, and wastewater treatment.
Further emphasizing the need for effective waste management, CDW in Portugal was managed extensively in [
36], with only 6% of respondents stating they recycle and 13% reusing their CDW. A negative waste hierarchy index of 39% was attributed to current practices that result in significant quantities of waste being sent to landfills. The study identified key barriers to CDW recycling, including high costs and labor intensity, while also pointing out that transportation costs and regulatory burdens are not viewed as major barriers. As a result, waste management strategies must be integrated into construction projects early on. These results contribute to improving CDW practices, which in turn support Portugal’s waste recovery targets and circular economy goals.
While demolition waste glass (DWG) accounts for less than 5% of the total quantity of CDW, it has significant potential for reuse in areas such as aggregate production and soil stabilization [
37]. CDW recycling focuses primarily on bulk materials, whereas DWG reduces landfill waste and lowers emissions associated with raw material production. However, there are regulatory gaps, low awareness, and inadequate processing infrastructures that limit its integration. By incorporating DWG into broader CDW strategies, the industry can improve its recycling efficiency.
A cationic rapid setting bitumen emulsion (CRS-2) was used to design the chip seals for pavements using CDW materials in another study, with yellow bricks, red bricks, and glass making up 100% of the aggregates [
38]. According to different tests, including a sand patch test and a British pendulum test, chip seals were highly skid-resistant, embeddable, and had strong adhesion to asphalt surfaces. Recycling materials in chip seals enhances paving performance while reducing construction waste. A summary of the key studies and findings from the above literature review is provided in
Table 1.
2.2. CDW Classification
Optimizing recycling processes and improving environmental management requires effective CDW classification. Technological advancements have significantly improved the ability to sort and identify various types of waste. Digital models leveraging deep learning techniques have become instrumental in automating waste sorting, allowing for more efficient resource recovery. The following section discusses different methods for classifying CDW, such as deep learning semantic segmentation models, innovative image classification techniques, as well as robotic sorting systems. This study provides an opportunity to better understand how these technological solutions contribute to improved waste management practices and support sustainable development.
Digital models are an effective tool for managing solid waste since they identify and sort construction, renovation, and demolition (CRD) waste. The DL semantic segmentation models DeepLabv3+ and U-Net were used to identify a real-world scenario of CRD waste composition in [
39]. A combination of ResNet-101, RegNetX-1.6, and MobileOne-S3 was utilized to train the models efficiently for feature extraction. As a result, waste sorting was automated, thanks to backbone networks, and DL contributed to resource recovery across industries and environmental management. In the context of constraints on data collection and labeling, DL can improve waste management through increased recycling and resource recovery.
Building on these advancements, Zhang et al. presented an innovative solution for categorizing recyclable waste into five types—glass, fabric, paper, plastic, and metal—based on CNN images [
40]. In combination with transfer learning, DenseNet169 allowed accurate recycling waste identification and classification, achieving 82% accuracy as a balanced and high-diversity image classification algorithm.
Expanding the scope of waste classification, the authors proposed a solution to identify recyclable objects often mixed with non-recyclable objects and classify them accordingly in [
41]. Through transfer learning, a pre-trained ResNet-50 CNN extracts features, and then a fully connected layer classifies them. During training, the model was augmented and trained on the TrashNet dataset. Images were segmented using sliding windows during pre-classification; labeled sample points were combined with Gaussian clustering during post-classification for identifying the object location. The results showed 48.4% detection in simulation and 92.4% classification accuracy.
Manual sorting is labor-intensive, inefficient, expensive, and presents significant health risks due to exposure to toxic and hazardous environments. To address these practical challenges, the authors in [
42] proposed an optimized robotic grasping for sorting tasks using a 3D camera and the deep learning models RCNN and AE. Over 90% of grasping attempts were successful in the optimized models versus 70% in unoptimized models. To improve recycling efficiency and to lower the costs, multiple robots should be used simultaneously.
Technological advancements continue to advance, leading to an increasing interest in integrating these innovations with other methods of waste detection. Therefore, by combining advanced remote sensing and DL, ref. [
43] presented a method for detecting CDW with 91.67% accuracy, accurately identifying and classifying CDW types, such as demolition debris and landfills, using ZY-3 multispectral images from various years. As cities grow, change detection becomes crucial for managing environmental impacts. It provides important data for urban planning and sustainable development, as well as aiding waste management.
Table 2 summarizes the key literature on CDW classification.
2.3. CDW Prediction
CDW prediction is vital to waste management and sustainability. Predictive models designed to estimate CDW quantities and characteristics are discussed in this section. Diverse approaches are discussed, including deep learning techniques for predicting material retrieval from buildings, classification models for waste mixtures, and hybrid machine learning models that enhance prediction accuracy. These innovative methods demonstrate how waste prediction can be improved through their analysis.
In the context of these advancements, the researchers in [
1] developed three DL models to predict the number of materials to be retrieved from buildings before demolition. Independent variables, such as floor count, volume, and building archetype, were used to evaluate how they relate to each other. For the recyclable, landfillable, and reusable materials, the amount was taken into consideration. The training process used a dataset of 2280 building demolitions to identify the key features required for prediction, and then varied cases for testing and validation. As a result, the data provided a high level of accuracy in predicting demolition material quantities. Among the independent variables, the number of floors significantly impacted the model’s performance.
In [
44], Torky et al. proposed a deep learning technique, GH2_MobileNet, to predict the quantity of hydrogen used in waste mixture production, measured in kilograms. Using images, waste was classified into three classes: recyclable, organic, and harmful. As part of the classification process for organic waste mixtures, specifically dry and wet waste, a hypermodel (MobileNet-CNN) was also developed. To estimate the weights of dry and wet organic waste, two models were used: DOWE and WOWE. Based on the prediction results, DOWE and WOWE together predicted the total organic waste mixture to be 299.17 kg, while WOWE alone predicted 272.08 kg. Overall, in terms of waste identification and classification, the hypermodel outperformed the other models.
Similarly, LSTM-SRNN models have been proposed to predict disease status by researchers [
45]. Using video and image data, the model was able to distinguish between healthy and diseased rice crops with 99.99% accuracy. This suggests that the model is exceptionally good at identifying healthy rice crops. By creating an instant video analysis mobile phone, the scientists proposed predicting illnesses and acting accordingly. Video processing can be used to improve video quality by filtering out noise and expanding investigations into rice diseases and other plant diseases.
In a related study, LSTM-based trash prediction models employed daily waste data from Istanbul’s daily garbage. The research [
46] compared the LSTM model’s performance with other ML and DL models, including k-nearest neighbors (kNN), random forest (RF), multilayer perceptron (MLP), and gated recurrent unit (GRU). The results showed that LSTM achieved the most successful results, with a failure rate of 5.19%, while kNN had a higher failure rate of 5.46%. The results indicate that by creating hybrid deep learning models, future research could enhance prediction outcomes.
In line with these predictive advancements, an analysis of 160 buildings carried out in [
47] helped develop an ML hybrid model for predicting demolition waste generation rates. A PCA–kNN model combining principal component analysis (PCA) with decision trees (DTs), kNN, and linear regression (LR) produced the highest accuracy (R2 = 0.897) and error rate (7%), outperforming non-hybrid models and helping in CDWM strategies.
Table 3 presents a structured overview of the CDW prediction literature reviewed in the preceding section.
2.4. CDWM State in KSA
As Saudi Arabia develops and modernizes, effective management of CDW is becoming increasingly important. Saudi Arabia’s CDW management system faces significant challenges and offers significant opportunities for improvement. Studies have highlighted the current practices and gaps in CDW management, emphasizing the need for robust policies and systems that align with broader sustainability objectives. As we advance toward a more efficient and circular economy, the following section examines the current state of CDW management in KSA.
To address these challenges, 81 companies in KSA’s eastern province were studied in [
48]. A study of factors impacting the management of CD waste in the region was conducted by the authors. Only 39% of the companies in the study had a pollution control plan. Additionally, the study provided information on construction waste management at each company’s project site, showing that 86.4% of CDW ends up in landfills, whereas only 13.6% is recycled and reused. The study emphasizes the importance of developing a CDWM system to enable the move toward a circular economy, as it identified waste as being reusable and recyclable.
Saudi Arabia’s eastern province faces several challenges and barriers to managing CDW. According to [
46], eastern province municipality landfills were analyzed to determine the amount of waste generated in the region. Based on data collected from construction sites, 131,436 tons of debris were dispersed in 2016 and 142,985 tons in 2017. As noted in [
48,
49], the lack of CDW data, along with immature strategic policies, remain key obstacles to effective CDW management and recycling. Consequently, an estimated 13% of CDW is discarded in an uncontrolled manner. Furthermore, many solutions were proposed in support of Saudi Arabia’s Vision 2030. A comprehensive evaluation of the existing CDWM in Riyadh was conducted in [
50] to verify the lack of an efficient and stable management framework.
In addition to these findings, according to Omar et al., the indicators for estimating the amount of CD generated in cities and their efficient recycling were determined in [
51]. An experimental study was conducted to test concrete mixtures made from recycled materials by analyzing the generation and management practices of the cities of KSA (Dammam, Khobar, and Dharan). Under compressive stress, cubic samples achieved a value of over 50 MPa. The largest amount of CD waste originating from municipalities was approximately 252,806 tons per year in the selected sample, whereas the amount originating from the private sector was over 5000 tons per month.
Table 4 outlines the significant literature on CDWM state in KSA.
3. Materials and Methods
A basic practice in today’s society is recycling, which minimizes waste, protects priceless resources, and minimizes the impact on the environment. Materials are gathered, processed, and reused to keep them out of landfills and incinerators. By reprocessing these materials, recycling reduces the need to extract and manufacture new resources, which reduces pollution and energy consumption. Waste management through this approach is both economically viable and aligned with the larger goal of creating a more sustainable and environmentally conscious society. With a worldwide push to improve resource efficiency and preserve the environment, recycling initiatives are becoming increasingly important. The term “industrial waste” refers to abandoned or residual materials from industrial activities, also known as CDW. The process of recycling industrial waste involves extracting and repurposing materials to produce new products or resources. These recycling techniques improve efficiency while reducing environmental impact by minimizing the amount of industrial waste disposed of in landfills.
3.1. Data Acquisition
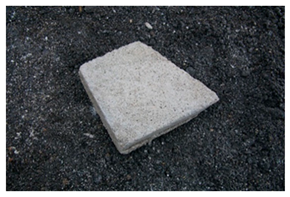
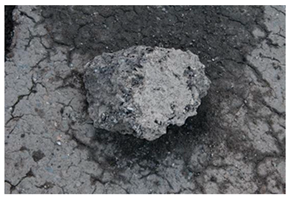
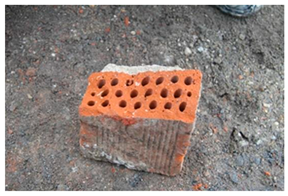
The dataset used in this research was derived from an open-source repository (Zenodo) focused on CDW research [
52]. The dataset originally contained 2664 images of materials fragments (AAC, asphalt, concrete, and ceramics). The images were captured at a CDW collection and sorting yard using a Canon DSLR camera, positioned at a distance of approximately 70 cm, producing images at a resolution of 1920 × 1280 px. To ensure consistent image quality and minimize variations in illumination, the researchers captured images in shade. CDW fragments were used without any cleaning to reflect the actual situations in the real world. Images were taken by the authors by placing fragments directly on the CDW piles or the ground while taking the images.
Table 5 summarizes the material types.
3.2. Data Preprocessing
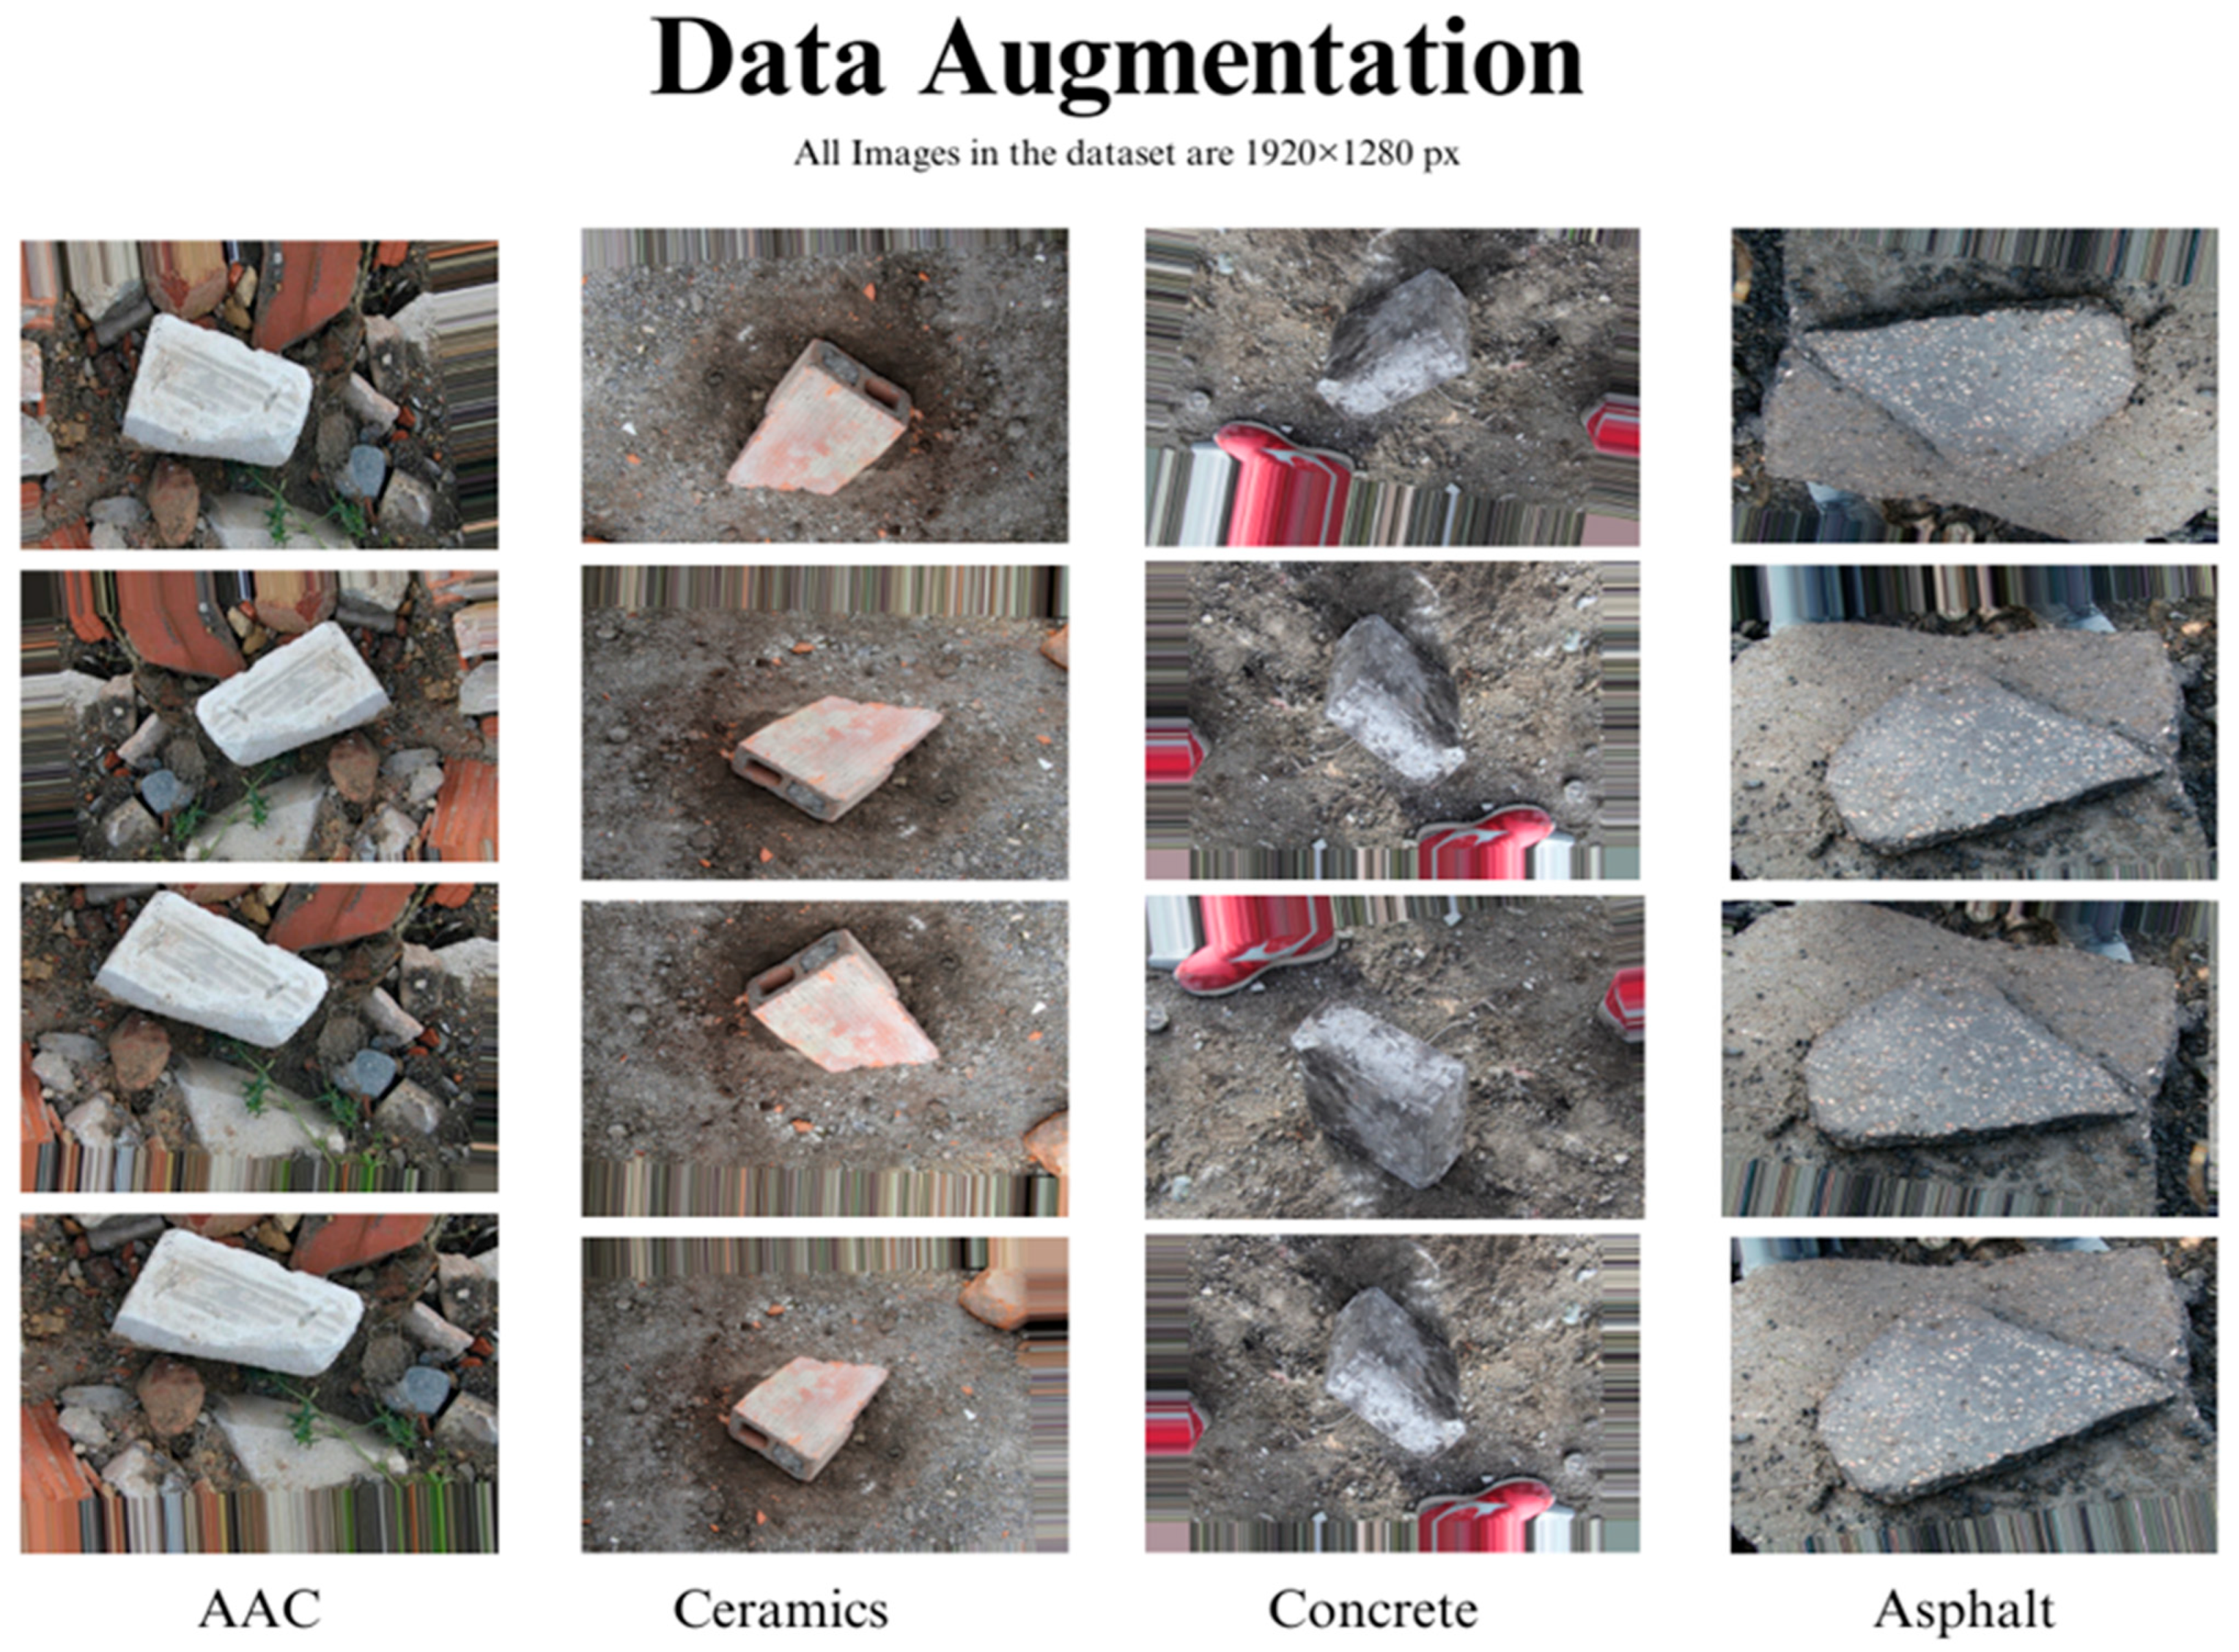
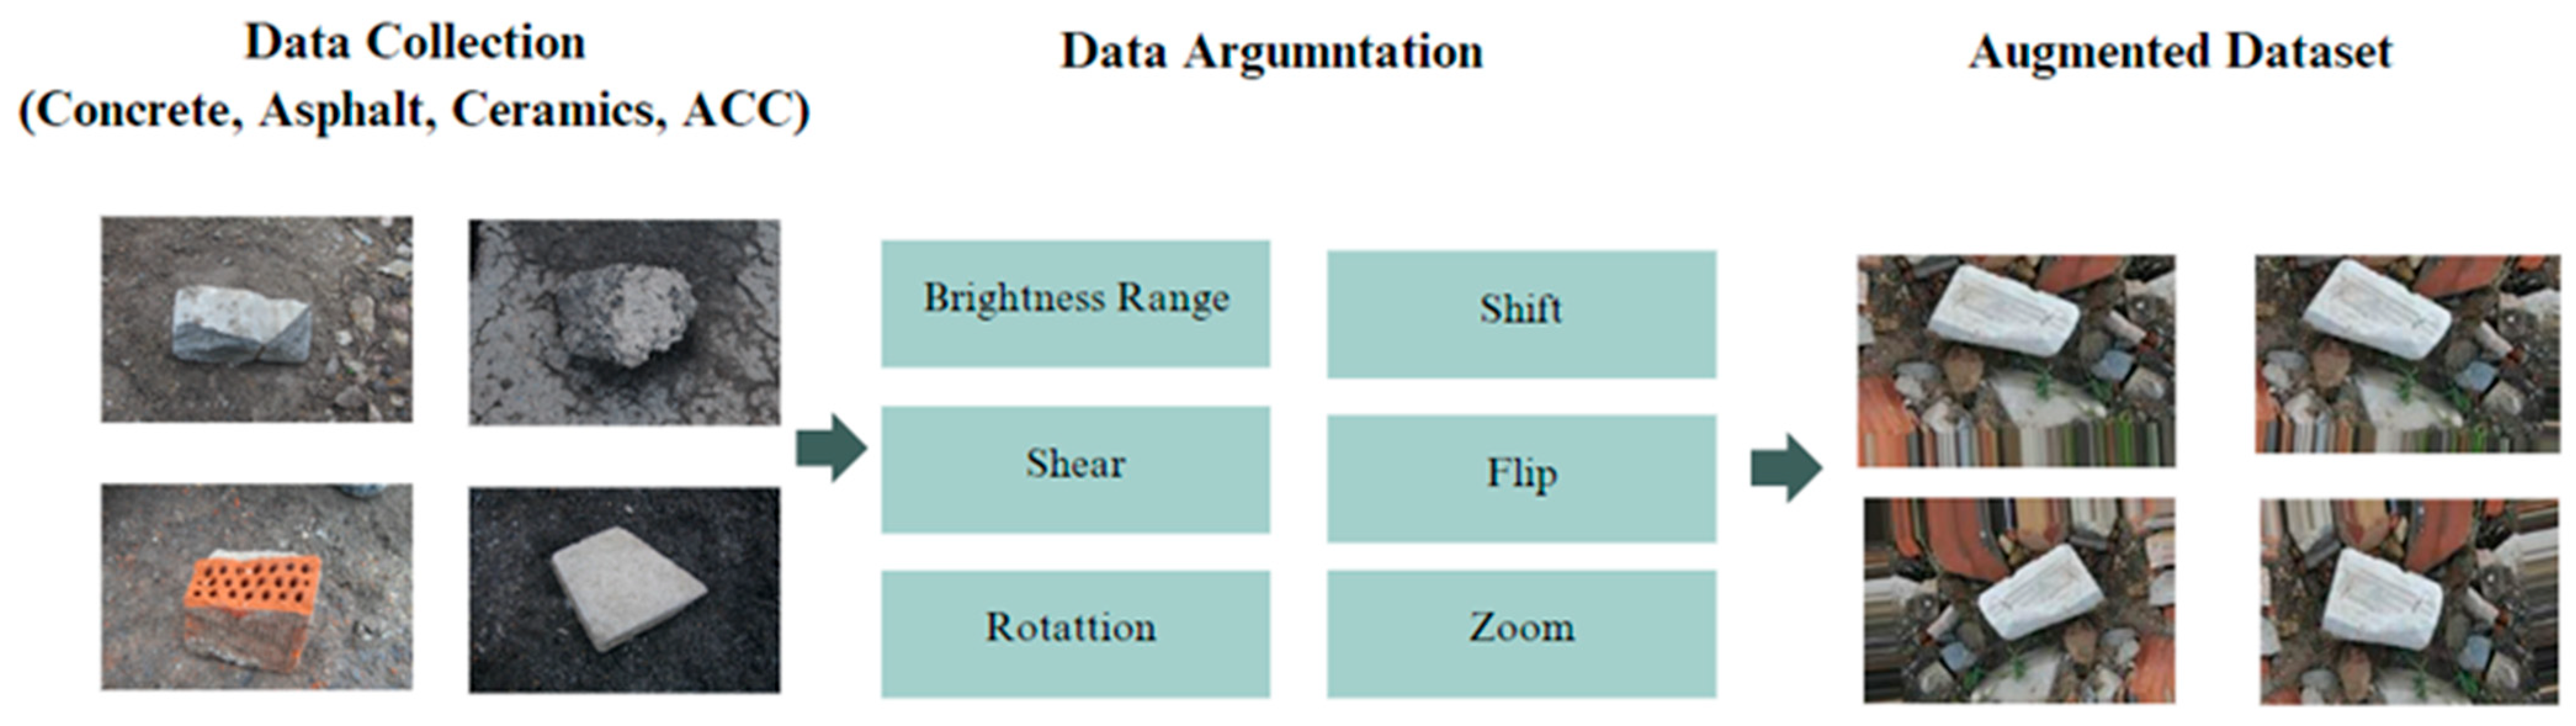
In order for the dataset to fit the DL model, data augmentation techniques were applied to increase the dataset size to attain high accuracy with respect to minimizing overfitting chances and to enhance the model’s generalization. The parameters used were as follows: rotation range, zoom range, horizontal and vertical flips, width shift range and height shift range, shear range, brightness range, and fill mode. The parameters in
Table 6 allow for a wide range of transformations to be applied to images during data augmentation, where each generated image implies a specification within the range of the function.
Table 7 summarizes the results of data augmentation applied to AAC, ceramics, concrete, and asphalt images in the dataset. Four examples of augmented images are shown in
Figure 1.
Figure 2 illustrates an image belonging to the AAC class of the dataset, which produced four images after applying the augmentation operations. While excessive augmentation may lead to overfitting, the current results suggest that it is beneficial in this context, with no adverse effects on classification. In addition, the improved classification performance also demonstrated that the augmentation strategies are effective in enhancing model learning when compared to the original Zenodo dataset source.
3.3. Model Building and Training
A DL architecture based on CNNs is widely used in computer vision tasks such as image detection and classification. CNNs are a type of neural network (NN) architecture that uses input images to identify and classify images by extracting relevant features. Convolutions are performed by CNNs using labels, and feature maps are generated by CNNs using labels.
CNNs are artificial neural networks designed specifically for recognizing images. An NN represents the activity of neurons in the brain through a patterned hardware and/or software system. CNNs are also defined as multilayer neural networks consisting of several layers, where each layer converts one number of activations into another through a function. This special architecture is often used in DL to recognize scenes and objects and to detect, extract, and segment images.
Many researchers have shown impressive accuracy when using the CNN architecture for classification and identification [
53]. Therefore, it was chosen for building the model, employed using Python language and its libraries (TensorFlow and Keras), and deployed.
3.4. Model Components/Architectures
The model system leverages transfer learning (TF) and DL techniques to classify and predict images. Green Ground uses CNNs to learn hierarchical features from raw pixel data to classify and predict images. The model architecture consists of several components. The raw image data are processed by an initial image input layer, followed by a series of feature extraction layers. The first convolutional layer applies 32 filters (kernel size 3 × 3, ReLU activation) to the input image to produce an output of 222 × 222, which is then down-sampled using a max-pooling layer (2 × 2) to 111 × 111. A second convolutional layer with 64 filters follows, producing a 109 × 109 output, which is again reduced using max pooling to 54 × 54. The third convolutional layer applies 128 filters, yielding a 52 × 52 output, followed by a final max-pooling layer reducing it to 26 × 26. These feature maps are flattened into a 1 × 128 vector, which is passed through a fully connected dense layer with 128 hidden units and ReLU activation. To classify the images into four categories, SoftMax activation is used as the final output layer. Overall, the model includes 3 convolutional layers, 3 max-pooling layers, 1 flatten layer, and 2 dense layers, with approximately 11.17 M trainable parameters.
Figure 3 illustrates the sequential flow of these layers from input to output.
Why CNN?
CNNs were chosen as the core architecture for the proposed model due to their efficiency in image classification tasks, especially with texture-rich visual data such as CDW. The datasets used in this study contained images of different types of materials exhibiting distinct patterns, textures, and edges. Due to their convolutional layers, CNNs are specifically designed to detect spatial hierarchies, as they progressively learn local and global features.
The use of a traditional CNN offers a substantial advantage over more complex architectures such as ResNet or EfficientNet in terms of computational efficiency and ease of implementation, particularly under the limitations of the hardware encountered in this study. This model was developed and trained on a standard laptop without a GPU, making lightweight architectures more feasible. It is important to note that, despite these limitations, the model achieved strong performance metrics, suggesting that the CNN chosen was capable of effectively generalizing across datasets.
3.5. Theory/Calculation
Convolutional layer computes , where is the input from the previous layer (or the input image for the first layer), is the filter for the layer, is the bias for layer , and ∗ denotes the convolution operation. is the output before applying the activation function.
ReLU activation function is applied as where is the activation output for layer .
Max-pooling layer performs , where is the output of the max-pooling layer, f is the size of the pooling filter, and is the stride of the pooling operation.
Flattening is the process of converting the 2D matrices into a 1D vector: , where is the output of the last max-pooling layer and is the flattened layer.
Fully connected (dense) layer refers to the computation , where is the weight matrix, is the bias vector, and is the output before applying the activation function.
The output layer with SoftMax activation function is defined as , where is the output prediction. In the SoftMax activation function, the output is transformed into a probability distribution over all possible classes. The input data are transformed in each of these operations step by step, which allows the model to learn and make predictions based on the input data.
An illustration of the Green Ground model’s website interface is shown in
Figure 4 to provide an understanding of its structure and design. Uploading and dragging an image to the “Uploaded Image” box provides the user with the opportunity to test the model’s ability to predict and classify CDW materials. Once the user clicks on the “Submit” button, the image is sent to the models for testing. The predicted class is then displayed in the “Predicted Class” box. In the event that the “Flag” button is clicked, a file entitled “Flagged” appears on the user’s computer, which is intended for flagging specific images that have been selected by the user. In the case of the “Clear” button, it removes the current images to allow the user to test new images.
3.6. Model Implementation
This section outlines the implementation steps undertaken by the authors in the development of the model.
Figure 5 illustrates an implementation phase that includes the following.
Installation involved setting up all necessary software tools, including Anaconda version 2024.02, Jupyter Notebook version 6.5.4, Python version 3, TensorFlow version 2.12.0, Keras version 2.12.0, and Gradio version 4.32.2. The dataset was acquired from the Zenodo website, where several images depicting CDW were available. For preprocessing, the images were resized to a uniform size of 200 × 200 pixels, normalized, and possibly augmented to increase their diversity, robustness, and size. The dataset was then divided into training and testing sets, with 70% allocated for training and 30% for testing, ensuring that the model could be trained on a substantial amount of data while allowing for robust evaluation of untested samples.
After extensive research, a CNN architecture was selected due to its capability to learn hierarchical patterns from data, facilitating image classification and prediction. The TensorFlow, Keras, and Gradio libraries were used to implement CNNs for image prediction tasks using Python code. By building upon existing frameworks and methodologies, time and effort were saved. The codebase was tailored to the dataset and classification task, involving parameter adjustments, iterative error resolution, and issue handling. Following model training, various performance metrics, such as accuracy metrics and confusion matrices, were analyzed, leading to the development of a modified model. Ultimately, the Green Ground image prediction model was successfully deployed.
Iterative development was used during the implementation phase of the project to continuously improve the model. As a result, the desired experience and outcome were achieved. Although the model was successfully developed and tested on standard laptop hardware in a Jupyter Notebook environment, it has not been optimized for real-time industrial deployments. Integrated real-time systems and edge devices may be enabled with lightweight architectures or inference optimization techniques in future research.
Description of the Characteristics of the Machine Used
The specifications of the hardware environment used in the model development are listed in
Table 8 to increase reproducibility and provide context for the reported training times and performance. A limited number of computational resources, however, made the training process significantly time-consuming. As the model was trained on a non-GPU laptop, the training time extended to several days. Consequently, the scope of experimentation and the selection of models were influenced by these constraints. Specifically, more advanced and computationally intensive architectures such as ResNet and EfficientNet were not explored since their training requirements exceeded the hardware capabilities. The chosen model architecture, therefore, reflects the balance between feasibility and performance in the available infrastructure.
3.7. Model Evaluation
To obtain the best performance from the DL model, the dataset was divided into 70% training and 30% testing, resulting in an overall accuracy of 96% after feeding it into the model. A dataset comprising 80% training and 20% testing was also fed into the model, which achieved 95.8% accuracy. After this, the 70% training and 30% testing dataset was also selected for further development of the model. Several accuracy measurements were employed to indicate prediction accuracy, which were recall, precision, F1-score, confusion matrices, and ROC curve.
Accuracy measures the proportion of correctly predicted instances, including both true positives and true negatives, relative to the total number of instances. It provides an overall percentage of correct predictions.
Precision is the ratio of correctly predicted positive instances to the total number of positive instances predicted.
Recall, on the contrary, is the ratio of correctly predicted positive instances to the total number of positive instances.
F1-score integrates both precision and recall into a single metric, measured by a harmonic mean, which provides an objective measure that balances both concerns.
F-beta score extends the F1-score by allowing the precision and recall weights to be altered.
is a parameter that determines the relative weight of recall and precision.
4. Results
The prediction model was developed and trained using Jupyter Notebooks on an augmented dataset. The dataset comprised 9273 images, subdivided into a 70–30% training–testing split, yielding 6491 images for training and 2782 for testing. Given that the model was trained on high-resolution images, the following results were derived.
The first model was trained for 50 epochs, with an accuracy of 96.69%. Although this seems impressive, it should be noted that not all materials were accurately predicted by the model. This discrepancy indicates that, while the model had a high overall accuracy, certain classes were more challenging to predict. This can be attributed to factors such as class imbalance, image quality, or inherent similarities between certain material types.
The second model, which was trained for 100 epochs, showed an improvement in accuracy of 97.12%. With this marginal increase in accuracy, almost all material classes were able to make more accurate predictions. This difference emphasizes the importance of sufficiently training a model so that it can recognize more complex patterns within a dataset. As a result, there are concerns regarding overfitting, where a model becomes too tailored to the training data and performs poorly when faced with unknown data.
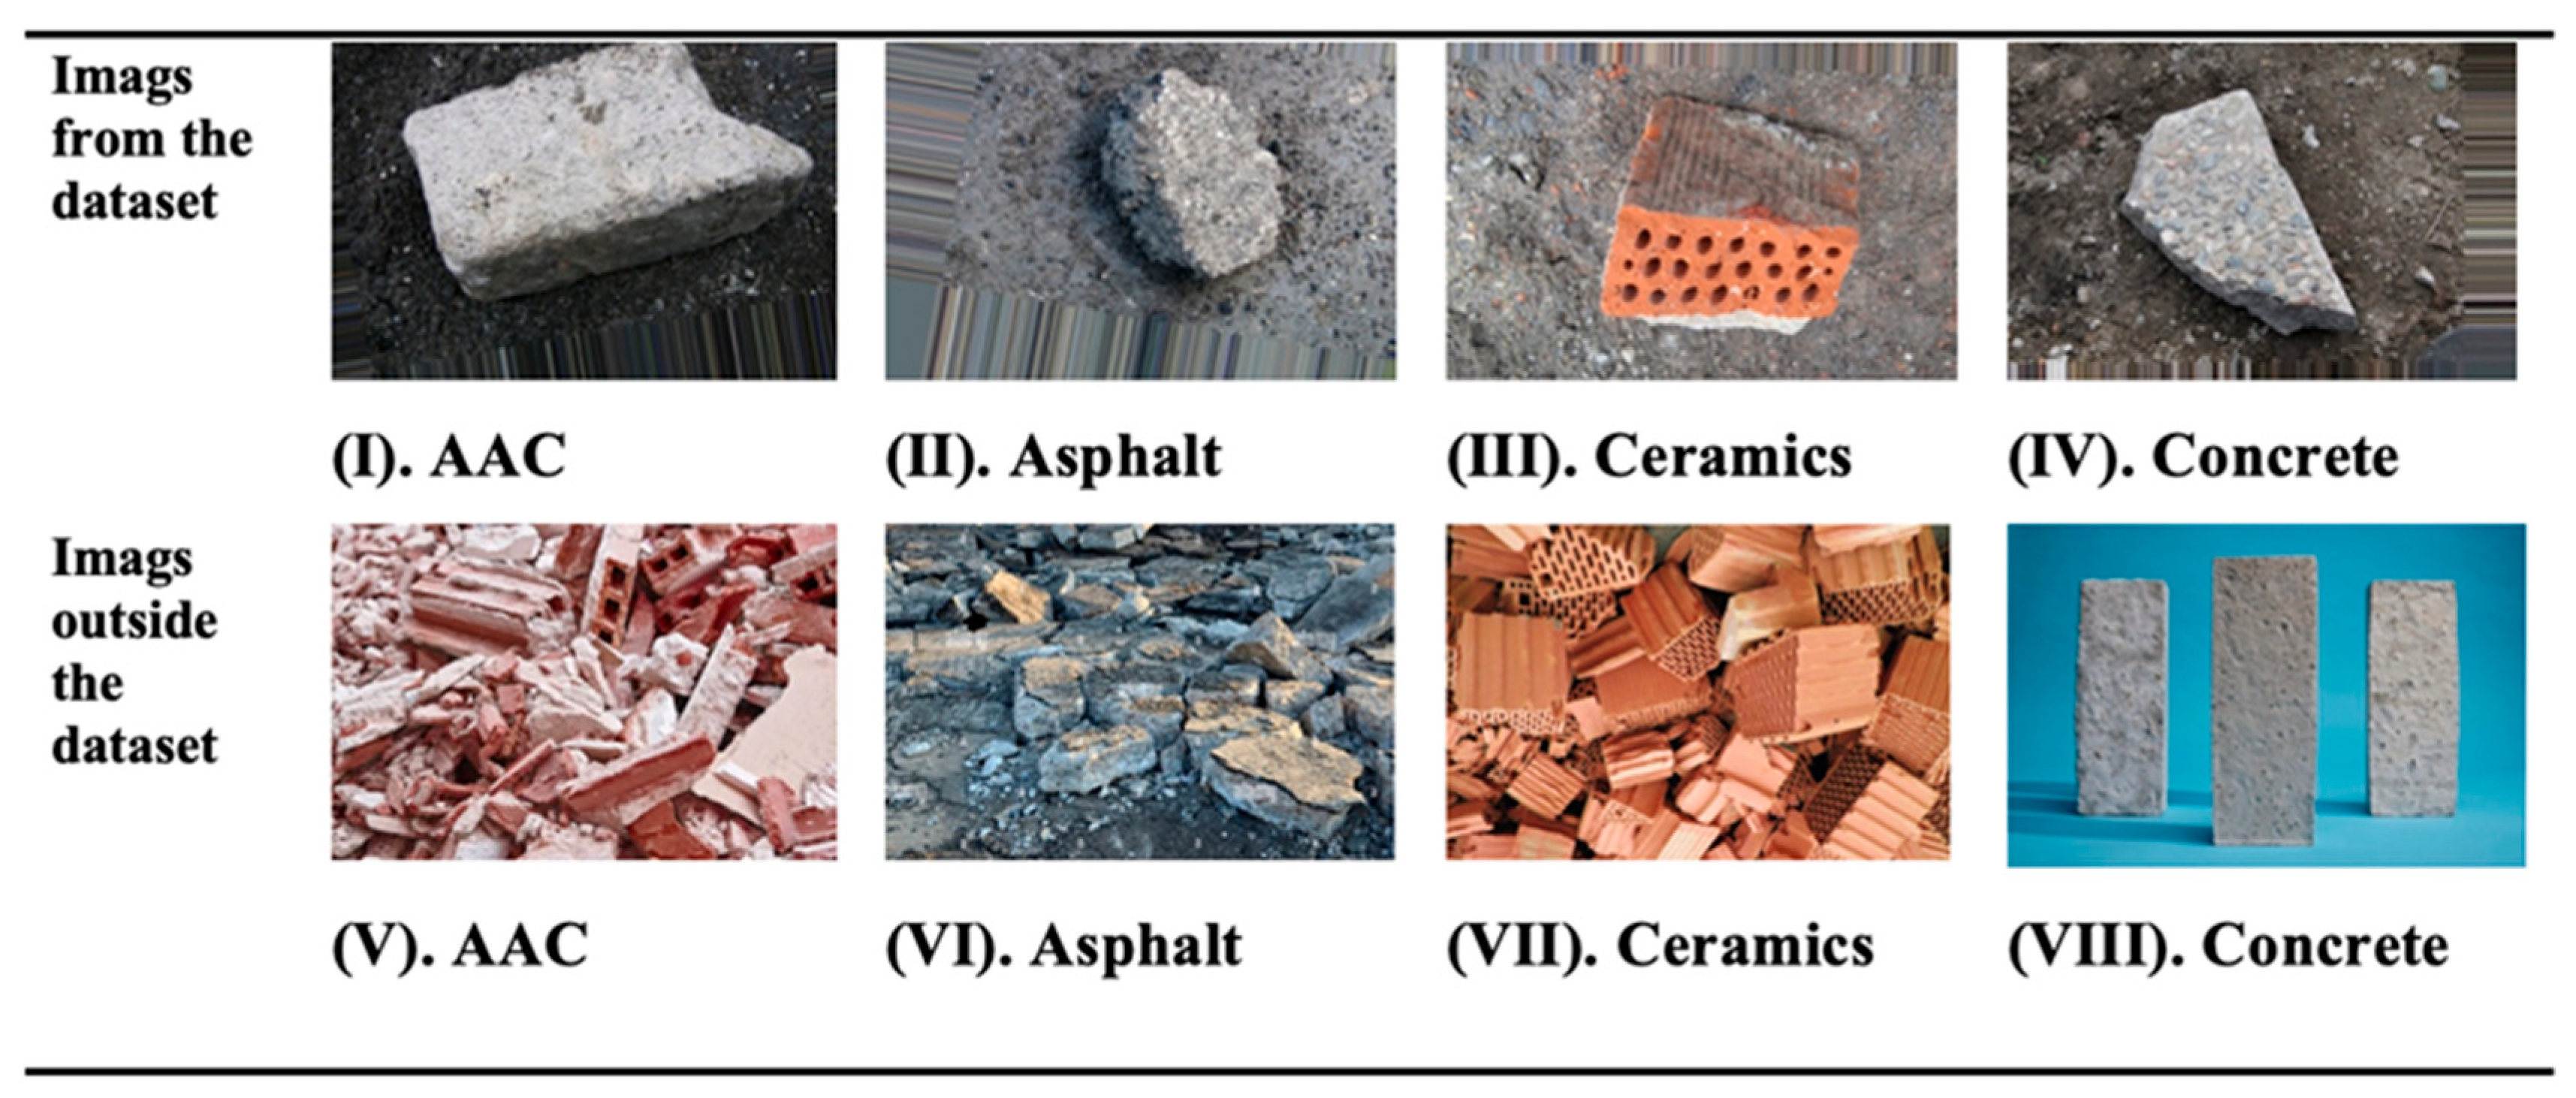
To further evaluate the models, an external image of (VIII) concrete [
54], which was not part of the dataset, as illustrated in
Figure 6, was used as a test case. The model trained for 50 epochs misclassified the image as asphalt, demonstrating a specific case in which short training periods led to incorrect classifications. On the contrary, the model trained for 100 epochs correctly identified the image as concrete. This result suggests that increasing the number of epochs increases the model’s ability to generalize to new unseen data, thereby increasing its predictive capability. It also underscores the importance of balancing training duration with model performance.
Additionally, the model was evaluated using several CDW images to assess its prediction capabilities after processing 100 epochs. The images depicted in
Figure 6 show a sample of public images of (V) AAC [
55], (VI) asphalt [
56], (VII) ceramics [
57], and (VIII) concrete [
54] that were obtained outside of the dataset. Meanwhile, images (I), (II), (III), and (IV) show images that were part of our dataset. These images were evaluated by the model, achieving accurate predictions for all labels. The model’s ability to accurately predict these labels demonstrates its potential applicability in real-world scenarios. However, it is important to consider the possibility of bias in the dataset, as the model’s success with these specific images may not fully reflect its performance on a broader range of CDW materials. Nevertheless, despite the lack of an explicit background complexity analysis, most images in the dataset contained visible target materials with little background interference. Therefore, the model appeared to naturally focus on the dominant material, which is in line with the dataset’s visual clarity and structure.
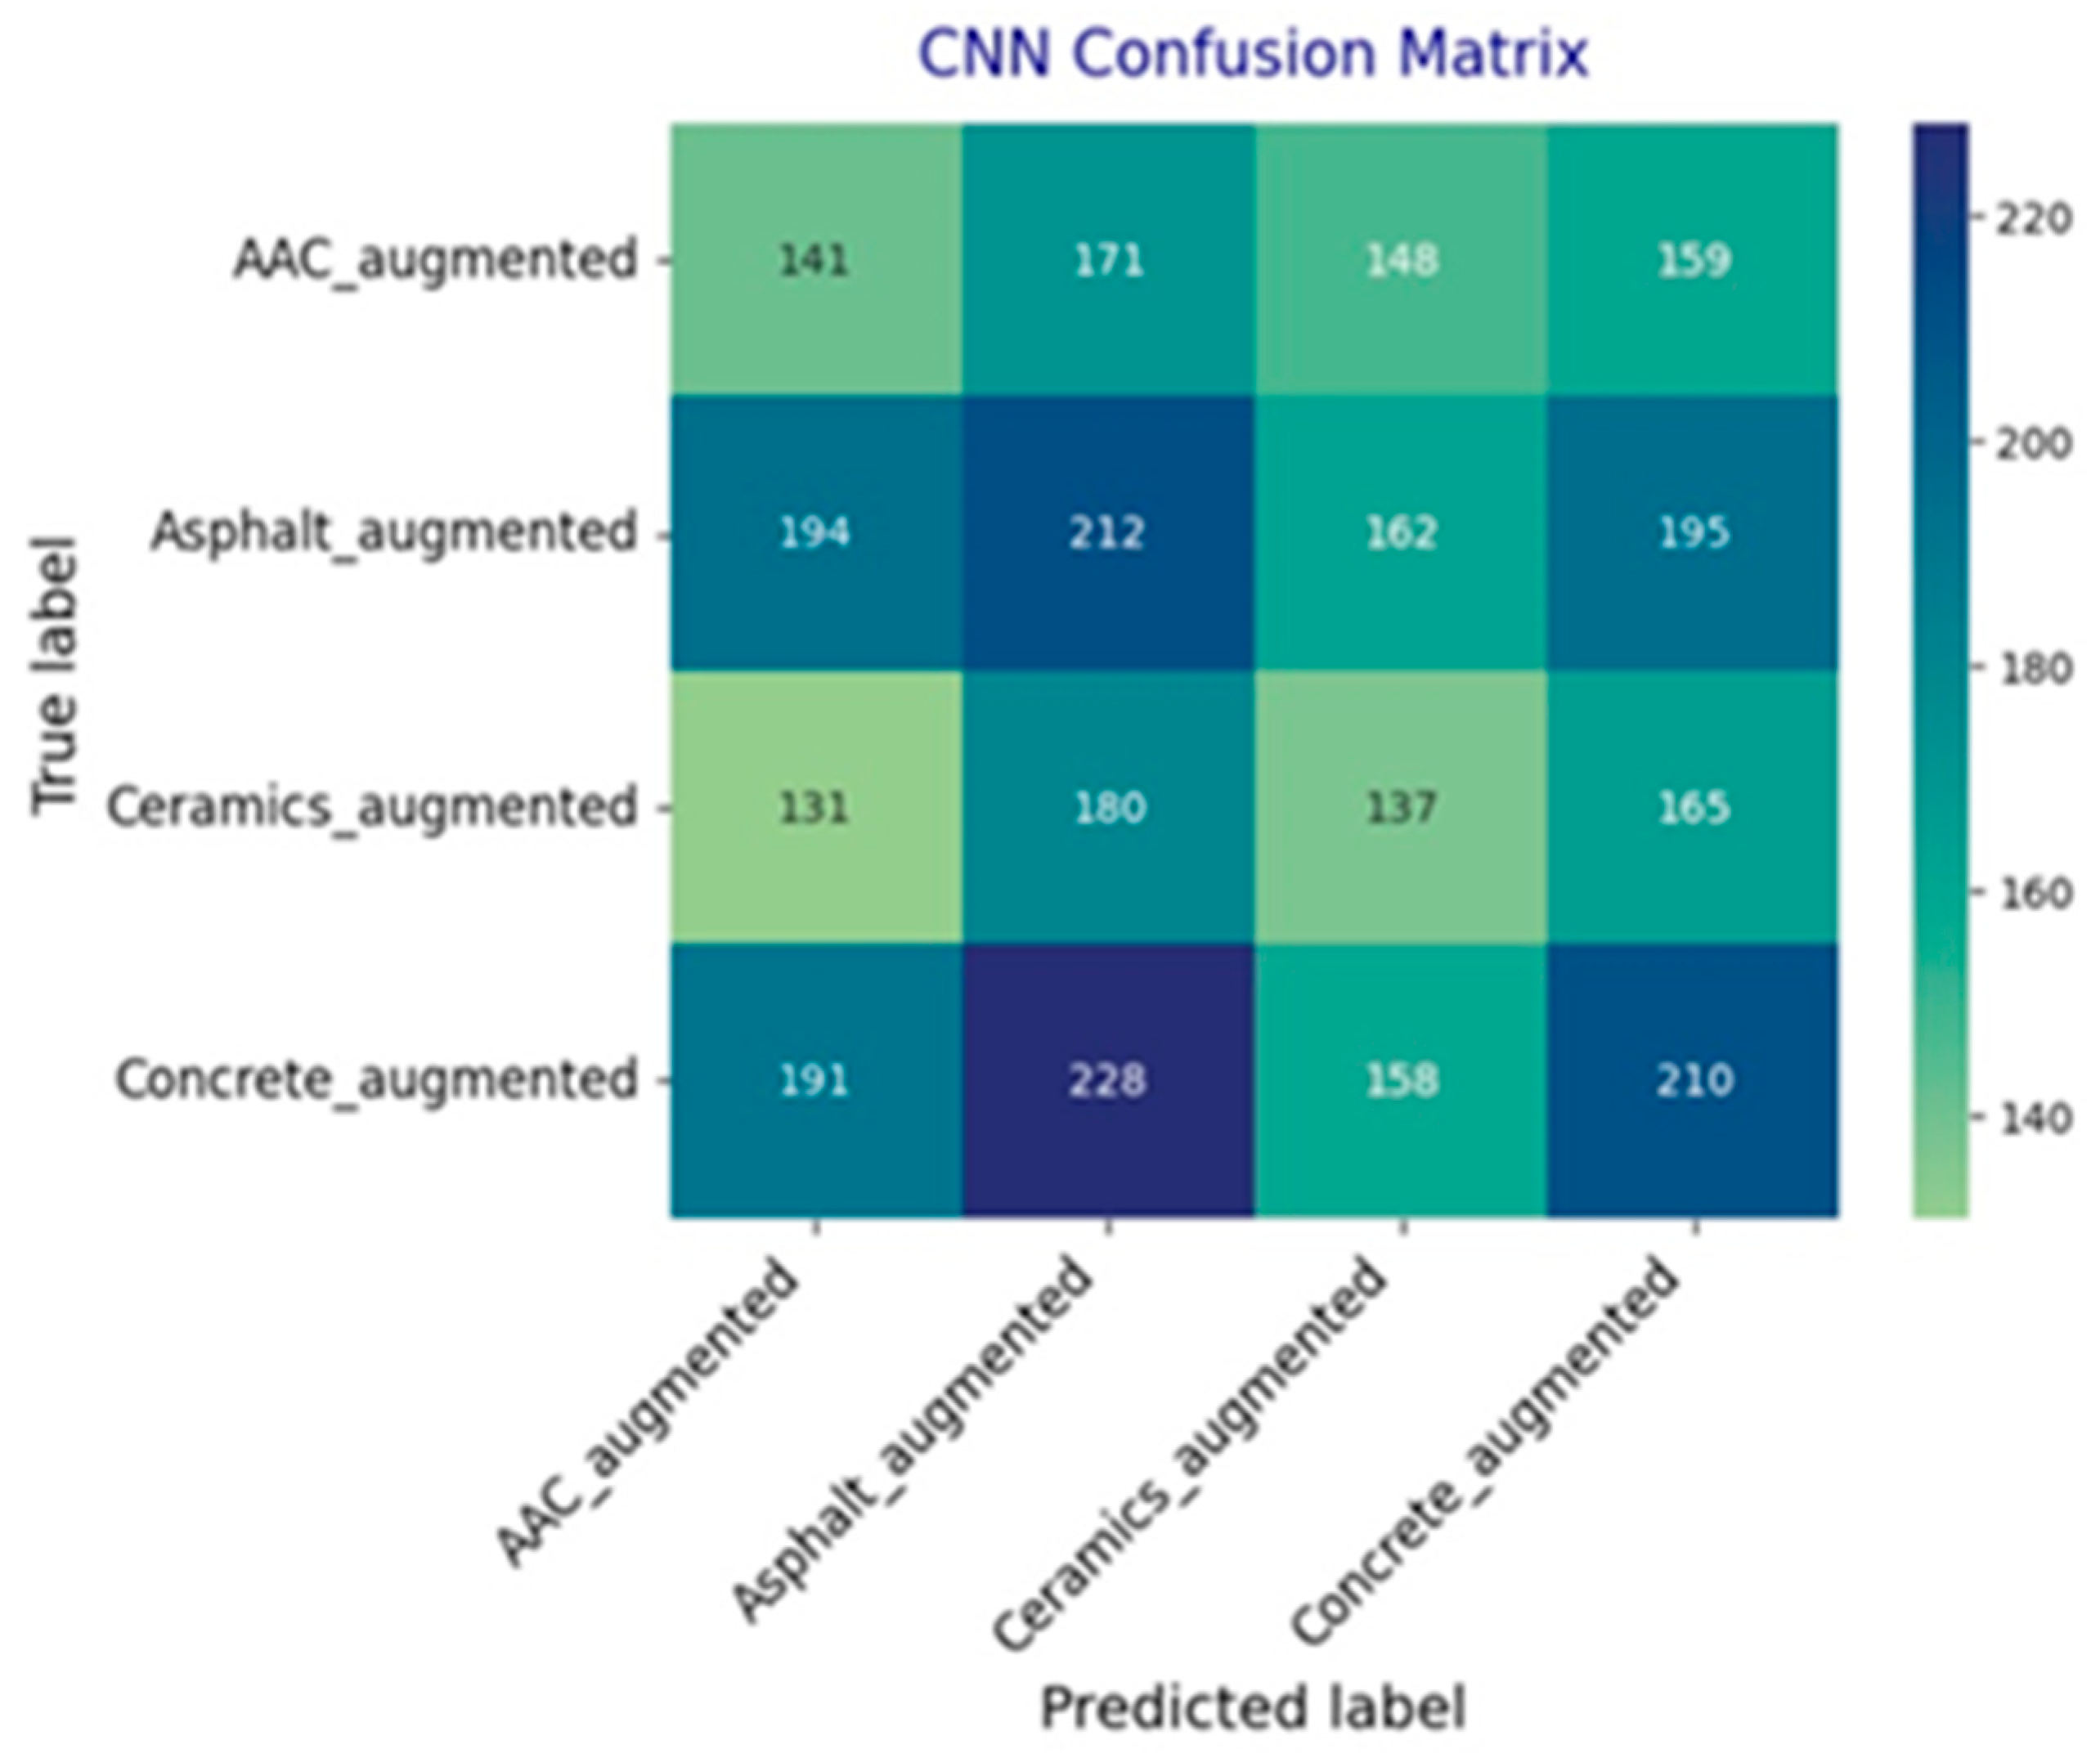
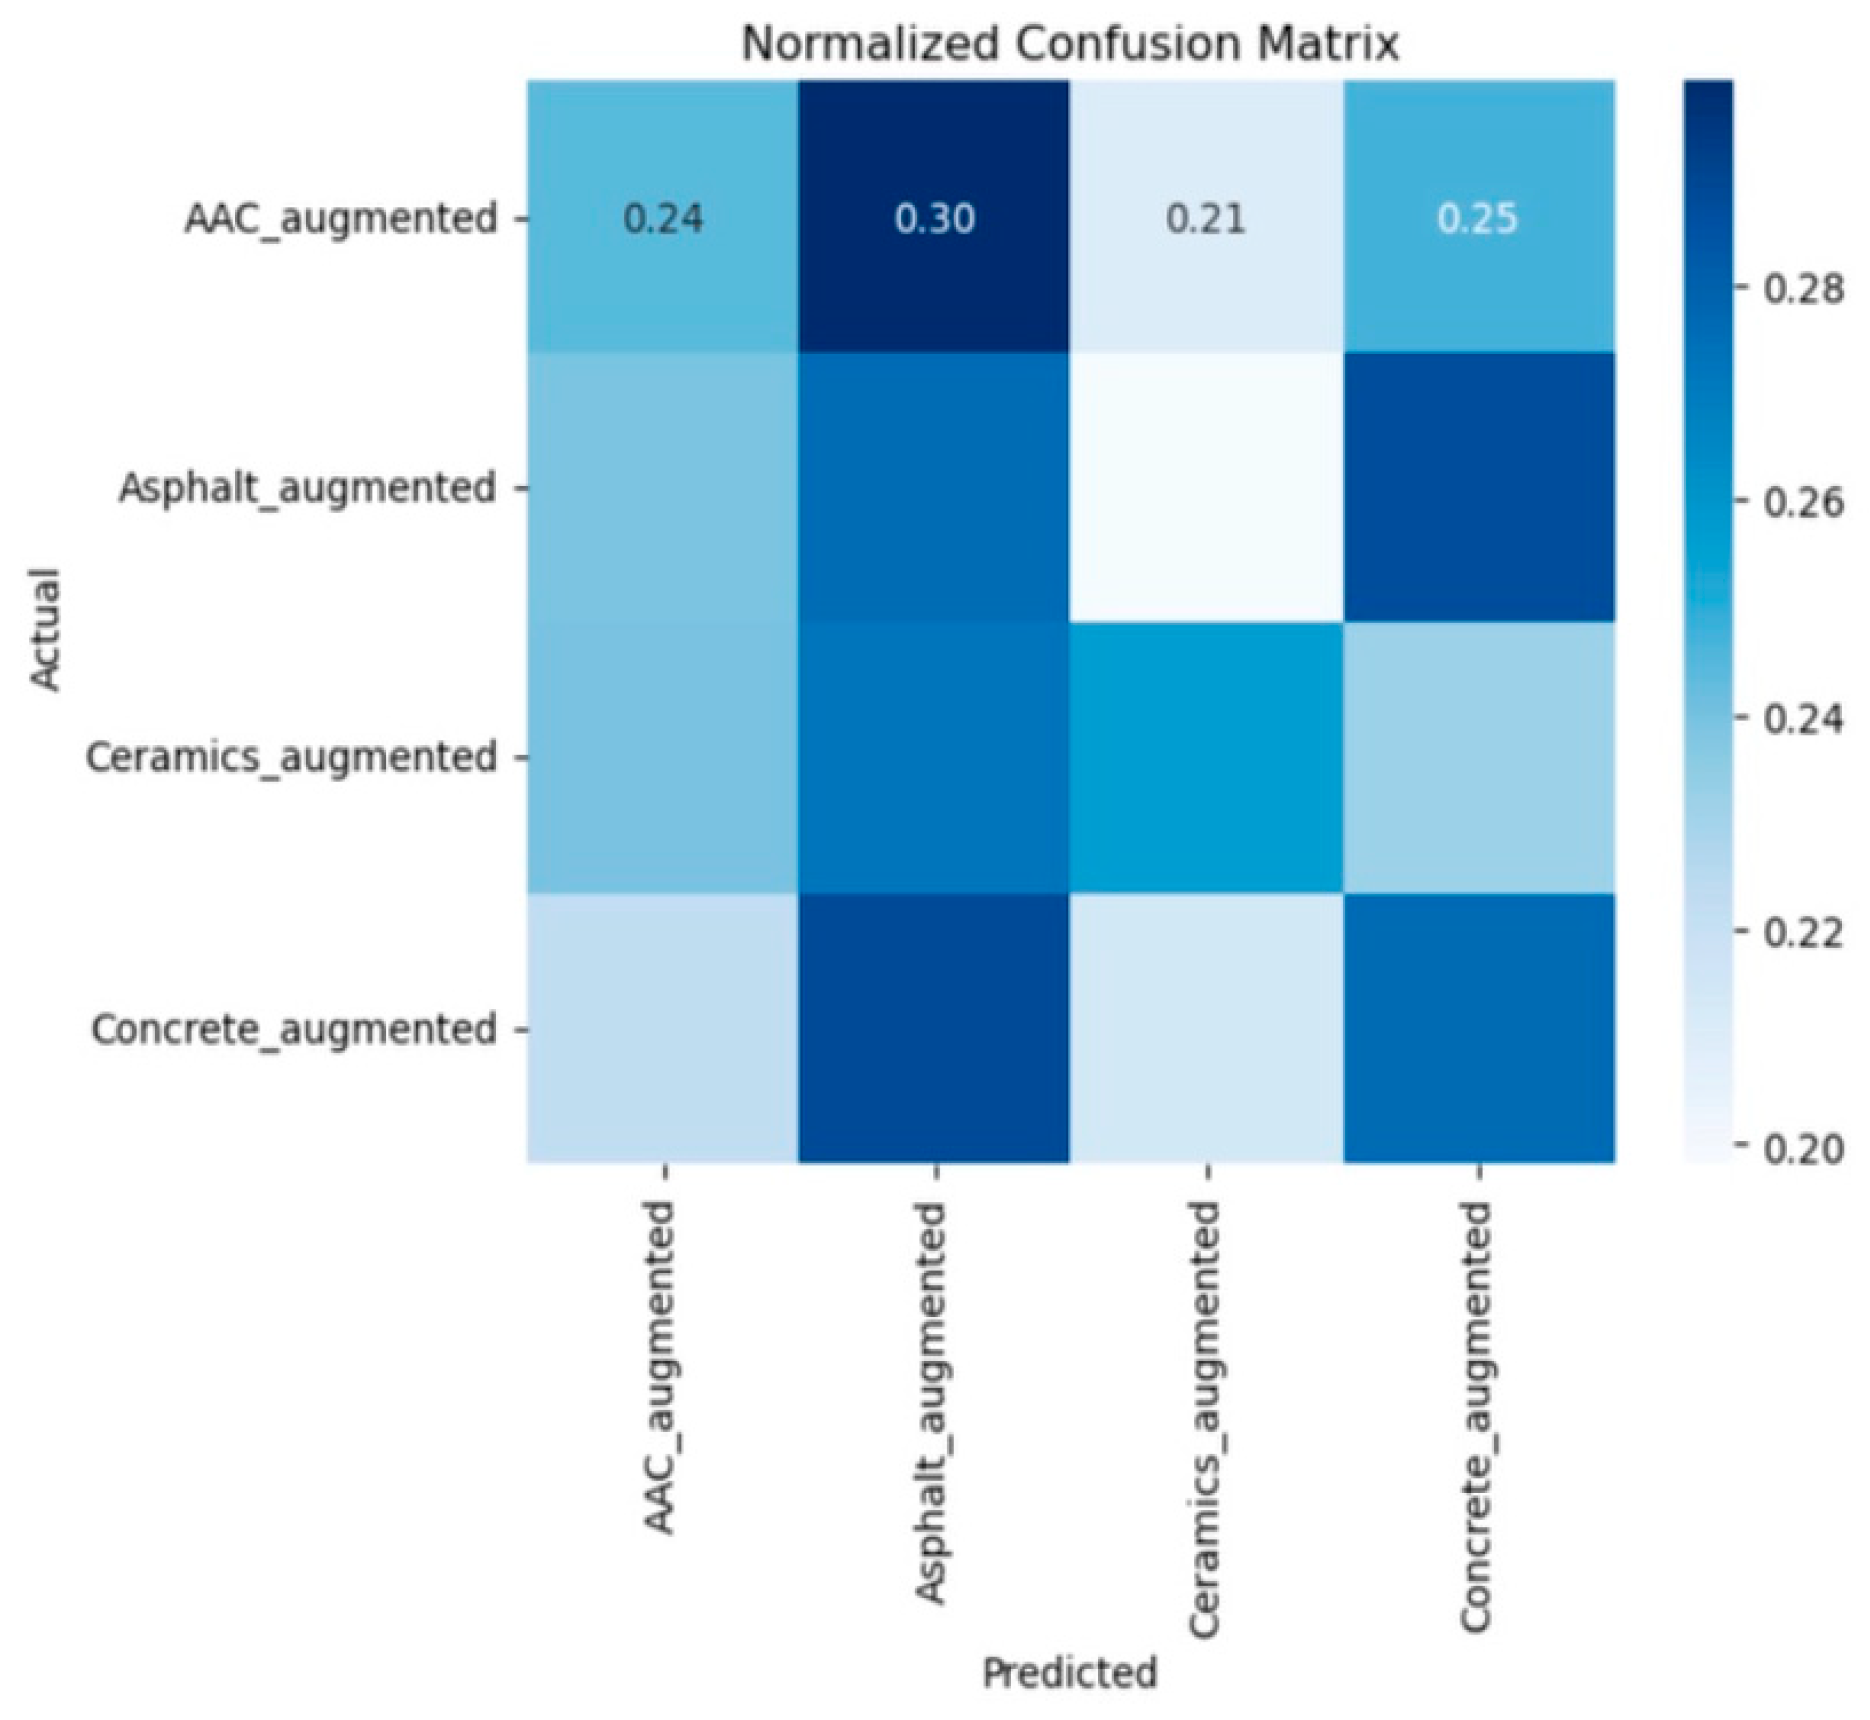
An evaluation method combining numerical and visual evaluation was used after 100 epochs to provide a comprehensive assessment of the model’s classification capability.
Figure 7 and
Figure 8 present the confusion matrix and its normalized counterpart, offering a detailed view of the model’s class-wise prediction behavior. The normalized confusion matrices revealed a relatively balanced performance across the four classes, with the proportion of correctly classified samples ranging between 21% and 30%. Approximately 24% of AAC samples were accurately predicted, whereas 30% were misclassified as asphalt. Similarly, the concrete class showed a 25% correct classification rate with a moderate degree of misclassification in the other classes. The patterns suggest that certain material types have overlapping visual characteristics, which may have contributed to the uncertainty associated with prediction.
Additionally,
Table 9 presents precision, recall, F1-score, and support for each class. Across all categories, the F1-scores ranged from 0.22 to 0.28, showing a consistent distribution of performance. Accordingly, the concrete class achieved a precision of 0.29, a recall of 0.27, and an F1-score of 0.28, indicating moderate yet stable classification performance. According to these metrics, no single class disproportionately influenced overall accuracy, and the model maintained similar behavior across all material types.
Table 10 presents the macro and weighted averages, both of which registered at 0.25. The closeness of these values confirms the validity of the model, while also acknowledging the influence of class imbalance. The classification report and confusion matrix provide an in-depth evaluation of the model, demonstrating its generalization potential while highlighting areas for further refinement, primarily in improving interclass separability and reducing misclassification among visually similar categories. There are inherent challenges associated with distinguishing materials with overlapping textures, such as concrete and asphalt, that contribute to the observation of misclassification between visually similar classes. Future work must incorporate advanced feature extraction methods and refine the dataset balance further.
Additionally, detailed counts of true positives (TPs) and false negatives (FNs) are provided in
Table 11, offering a closer look at where the model succeeded or failed in its predictions. For instance, the model identified 210 true positives for concrete but also had 577 false negatives, indicating a significant number of instances where the model failed to correctly classify concrete images. This analysis is critical for understanding the specific challenges faced by the model and guiding future improvements, such as incorporating more diverse training data or refining the model’s architecture.
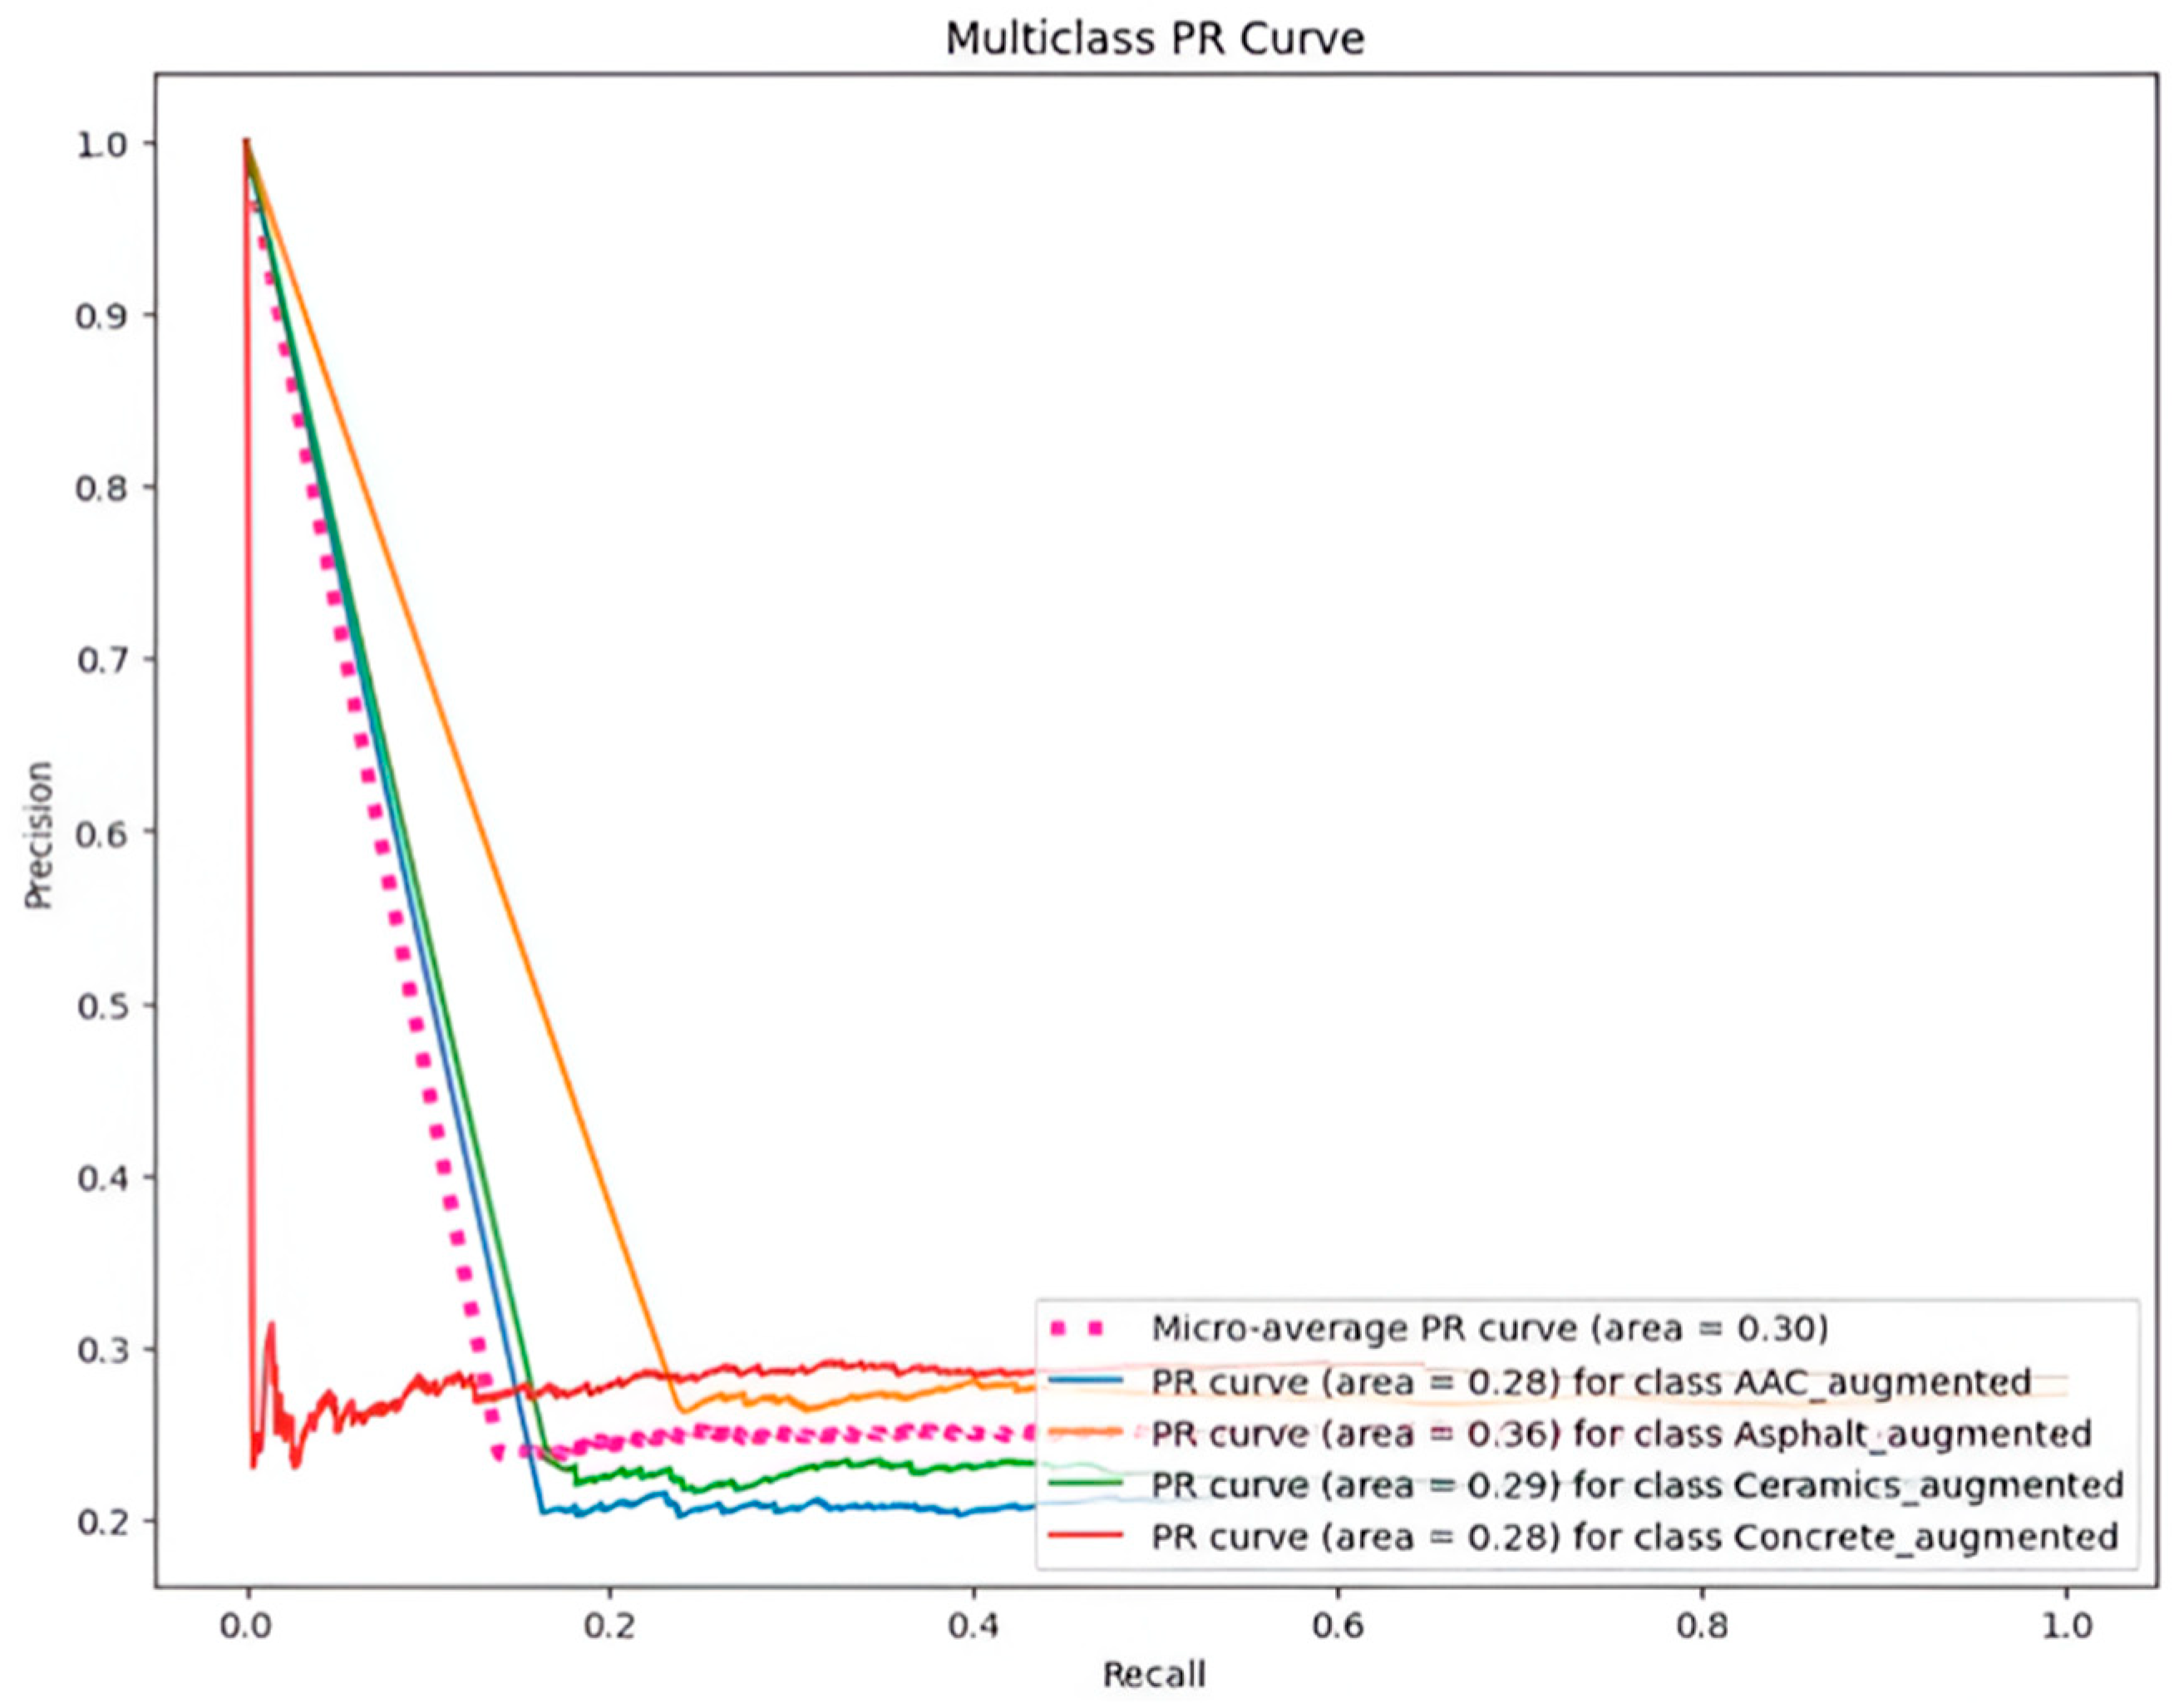
Figure 9 presents the multiclass precision–recall (PR) curve, which further assesses the model’s precision and recall across all classes. This curve is particularly useful for visualizing the trade-offs between precision and recall, helping to identify classes where the model performs well and others where it struggles. The curve also provides insights into the model’s behavior under different thresholds, offering guidance on how to adjust the model to improve its performance for specific applications.
In conclusion, the results indicate that increasing the number of training epochs generally results in an improvement in prediction accuracy. In addition, they emphasize the need for a balanced approach to model training, where the risk of overfitting must be carefully managed. While the model’s performance on external images suggests that it might be applicable to real-world scenarios, further refinement and validation on a wider range of materials are required to fully realize its potential.
This study presents an analysis of three deep learning models: the 15-layer CNN for plastic waste classification [
58], the NoWa model for real-time waste classification [
59], and the proposed Green Ground model. A summary of the key attributes, including accuracy, dataset size, image resolution, training configuration, and dataset composition, is presented in
Table 12.
A comparative assessment of the models remains useful in understanding their relative performance and practical potential despite their differences in structure, application, and dataset characteristics. Although the data types and model depths vary, the comparisons provided above help contextualize the effectiveness of the proposed Green Ground model within the broader context of waste classification efforts.
5. Discussion
Significant insights were gained from developing and training a prediction model using an upgraded dataset of 9273 photos, split into 70% for training and 30% for testing. The first model, trained for 50 epochs, attained an accuracy of 96.69%. This early accomplishment, while excellent, demonstrated difficulties in precisely forecasting all materials, pointing to potential issues such as class imbalances, image quality variances, or intrinsic similarities between material kinds. This emphasizes the complexity of the categorization problem and the necessity for additional improvement.
The model’s accuracy improved by 97.12% after 100 epochs of training. This incremental improvement in accuracy demonstrates the relevance of longer training times in allowing the model to grasp more intricate patterns in the dataset. However, the risk of overfitting, in which the model becomes unduly suited to the training data and thus less successful when faced with fresh data, must be carefully examined and managed. To further analyze the models, an external image of concrete that was not included in the original dataset was used as a test case. The model trained for 50 epochs misidentified the concrete image as asphalt, demonstrating the importance of training length on classification accuracy. In contrast, a model trained over 100 epochs correctly classified the image as concrete. This result emphasizes the importance of sufficient training epochs to improve the model’s capacity to generalize to new data, thereby improving its prediction ability.
Following 100 epochs of training, the model was evaluated using a variety of CDW images. These photos featured AAC, asphalt, ceramics, and concrete from both the dataset and other sources. The algorithm correctly predicted all labels for the dataset photos, suggesting its potential use in real-world applications. It is critical to recognize the possibility of dataset bias influencing the model’s success on individual photos, and to exercise caution when generalizing its performance with a broader variety of CDW materials.
Key performance indicators such as precision, recall, F1-score, and confusion matrix were used to evaluate the model after 100 epochs. Precision, which measures the accuracy of positive predictions, and recall, which reflects the model’s capacity to identify all relevant instances of a class, were critical indicators of the model’s success.
In the classification report post-100 epochs, varying levels of precision, recall, and F1-score were observed across different classes. For instance, the model achieved a precision of 0.29 and a recall of 0.27 for the concrete class, resulting in an F1-score of 0.28. While the model performed reasonably well overall, there is still room for improvement, particularly in enhancing recall to ensure accurate identification of all instances within a class.
In-depth analysis of true positives (TPs) and false negatives (FNs) provided further insights into the model’s performance strengths and weaknesses. For instance, while the model correctly identified 210 true positives for concrete, it also had 577 false negatives, indicating areas for improvement. The multiclass precision–recall (PR) curve analysis offered a comprehensive view of the model’s precision and recall dynamics across all classes, aiding in visualizing performance discrepancies and guiding adjustments for enhanced predictive accuracy.
To conclude, the results underscore the positive impact of increasing training epochs for prediction accuracy and the importance of a balanced approach to model training to effectively mitigate overfitting risks. While the model’s performance on external images indicates its potential applicability in practical scenarios, further refinement and validation across a broader material spectrum are essential to fully unlock its capabilities for CDW material classification.


 ,
, 


