Abstract
Climate change, driven by natural factors and human activity, produces significant environmental changes worldwide. One consequence is increased rainfall, which leads to intense and increasingly frequent storms, sudden increases in river flows, and increased likelihood of emergencies linked to natural disasters. This framework proposes a model based on the System Dynamics (SD) approach that aims to monitor the increase in flow in rapid-response catchments (RRCs). The model evaluates humanitarian logistics strategies to manage supplies during emergency situations and it is based on dynamic simulation, whose advantages are the analysis of causal relationships between variables and their behavior over time, mathematical support during the creation of the simulation model, and the creation of a graphical interface that allows the user to carry out a visual analysis of the variables involved in the model. The results show, through a case study, the implementation of a containment plan based on early decision-making from rapid-response catchment monitoring to generate humanitarian logistics strategies preventing material and human damage. Therefore, the main contribution of this framework is the creation of a simulation model that involves the synergy between two different systems: the analysis of RRC behavior and the humanitarian logistics plan to establish provision policies (food, water and medicine) based on the number of people at risk.
1. Introduction
In recent years, the Earth has experienced various climate changes, some due to natural causes and others due to human factors [1]. Climate change’s effects include more intense and recurrent rainfall [2], droughts [3], melting glaciers [4,5], more destructive hurricanes [6], and extreme heat waves [7,8]. Climate change produces global warming that leads to an increase in the Earth’s temperature [9]. This temperature increase impacts the water cycle, generating heavy rainfall and affecting the natural balance [10]. Greater intensity of rainfall increases flow in all rivers [11]. However, some rivers contain rapid-response catchments (RRCs) whose growth in their channel is faster and more sensitive to changes caused by storms and hurricanes [12]. Because of this ease of growth, RRCs require special attention and constant monitoring due to changing climatic conditions. Sudden and unexpected flow increases in RRCs are a priority issue in several mountainous regions with very steep slopes. This natural physical condition causes water velocity to increase and accelerate, resulting in reduced soil infiltration capacity and excess water, which can cause flooding and become a hazard for cities [13]. Hence, elaborating models and monitoring natural disaster risk are becoming increasingly important [14,15]. Containment strategies and prior decision-making in the face of emergencies caused by natural disasters are relevant factors for governments, civil protection departments, fire departments, and citizens in general [16,17].
For the above reasons, this framework aims to generate provision-sourcing strategies based on humanitarian logistics by creating a dynamic simulation model that allows the flow of RRCs to be monitored. The current literature review describes some frameworks focused on analyzing natural disasters due to flooding caused by river overflow. The framework described by [18] shows the development of an approach transferred between two similar German river catchments: Ahr and Mulde. The data obtained from the flooding caused by the Ahr River were used to develop an approach—based on this information set—to observe possible consequences on the Mulde River and, thus, evaluate the results of possible floods. In turn, the framework proposed by [19] uses the catchment of the Meenachil River located in India as a case study. This research analyzes the impact of current and future urbanization and its relationship with floods generated by environmental damage from socioeconomic growth in the region. The results of the hydrological models enable the prediction of events in the coming decades. In addition, the research of [20] analyzes trends in climate variables, taking the Cross River basin in Nigeria as a case study. In this framework, the authors use correlation and segmented regression models to measure the impact of various variables related to climate change, including annual precipitation, to analyze trends in river catchment and future impacts of the El Niño–Southern Oscillation (ENSO) weather phenomenon. In addition to the case studies described above, there is more research focused on analyzing the increase in rainfalls generated by climate change [21,22,23], making it a relevant topic in preventing emergencies caused by natural disasters. Consequently, the previous state of the art shows the need to carry out strategic plans to prevent damage caused by increased flow in RRCs.
Due to the complexity of analyzing rainfall and flood behavior, it is necessary to implement complementary techniques such as machine learning [24] and multivariate analysis [25]. In addition, software plays a vital role in studying the behavior of RRCs. Specialized software is available for river modeling to analyze river behavior. Each software has different features that focus on different river modeling analyses. Table 1 briefly compares the main features of some software used in various frameworks.

Table 1.
Comparison between characteristics of specialized software for river modeling.
However, the above software only involves river behavior analysis and does not include decision-making analysis regarding humanitarian logistics. This framework aims to show the development of a simulation model based on the Systems Dynamics (SD) approach that allows for the monitoring of the increase in flow in a rapid-response catchment due to intense rainfalls as well as making decisions based on humanitarian logistics based on the simulation model’s results, representing an original contribution. The SD approach is a suitable technique to achieve the objective of this framework due to its ability to model systems of all types. This technique has some relevant advantages:
- Analysis of variables over time. The SD approach allows for the analysis of complex relationships between variables and the impact of their combination over time using mathematical models through continuous simulation [26].
- Creation of graphical interface models. This technique allows the creation of interfaces that allow the user to visually analyze the behavior of the system through tables and graphs [27].
- Policy setting. The results of a dynamic simulation model facilitate the user’s decision-making process [28].
For the above reasons, the SD approach is a tool that allows for the creation of a model that monitors the behavior of the flow increase in a rapid response catchment and provides humanitarian logistics provision-sourcing strategies in emergencies. This framework consists of five sections. Section 2 (Materials and Methods) describes the case study, its geographical context, and the research methodology. This methodology is based on the approach to create dynamic simulation models and involves the first two phases: Conceptualization and Formulation. Section 3 presents the complementary phases (Evaluation and Implementation), which involve the deployment of simulations, their validation, and decision-making. Section 4 and Section 5 discuss and conclude the case study and the methodology presented in Section 2 and Section 3.
2. Materials and Methods
The SD approach has a defined methodology for creating simulation models. This methodology, which consists of four phases and allows users to create continuous simulation models, was initially proposed by [29] and synthesized by [30]. The SD methodology has been applied in many investigations: design [31,32], sustaining natural resource systems [33], product analysis [34], logistics systems [35], and the health sector [36], among other applications. Our framework applies the SD methodology to monitor RRC behavior and support decision-making regarding humanitarian logistics. Table 2 shows some components of the SD methodology modified to solve the problem described in this paper.
Table 2.
The SD methodology.
Section 2 (Materials and Methods) shows two phases of the SD methodology: Conceptualization and Formulation. Section 3 (Results) shows the third and fourth phases, i.e., the Evaluation and Implementation, of the developed simulation model.
2.1. Conceptualization
This stage involves defining the context and purpose of creating the simulation model. In addition, this phase involves defining the variables involved in the system because, in the next stage, this will be used to create the corresponding diagrams. In turn, the user defines the time horizon for the simulation. The SD approach is a continuous simulation tool, so setting the time in the model is a determining factor.
2.1.1. Definition of the Scenario and Purpose of the Simulation Model
Pico de Orizaba is the highest volcano in Mexico. This mountain, whose summit reaches 5610 m above sea level, has perpetual glaciers that supply water to the surrounding ecosystems. The melting of the ice in the glaciers forms rivers that run hundreds of kilometers from their source to their mouth in the Atlantic Ocean. Orizaba River is a tributary that originates in Pico de Orizaba and flows approximately 36.5 km before joining the Rio Blanco River and continuing to the ocean. Along its route, the Orizaba River flows through Orizaba City. This city is in the province of Veracruz and has a population of approximately 120,000 inhabitants.
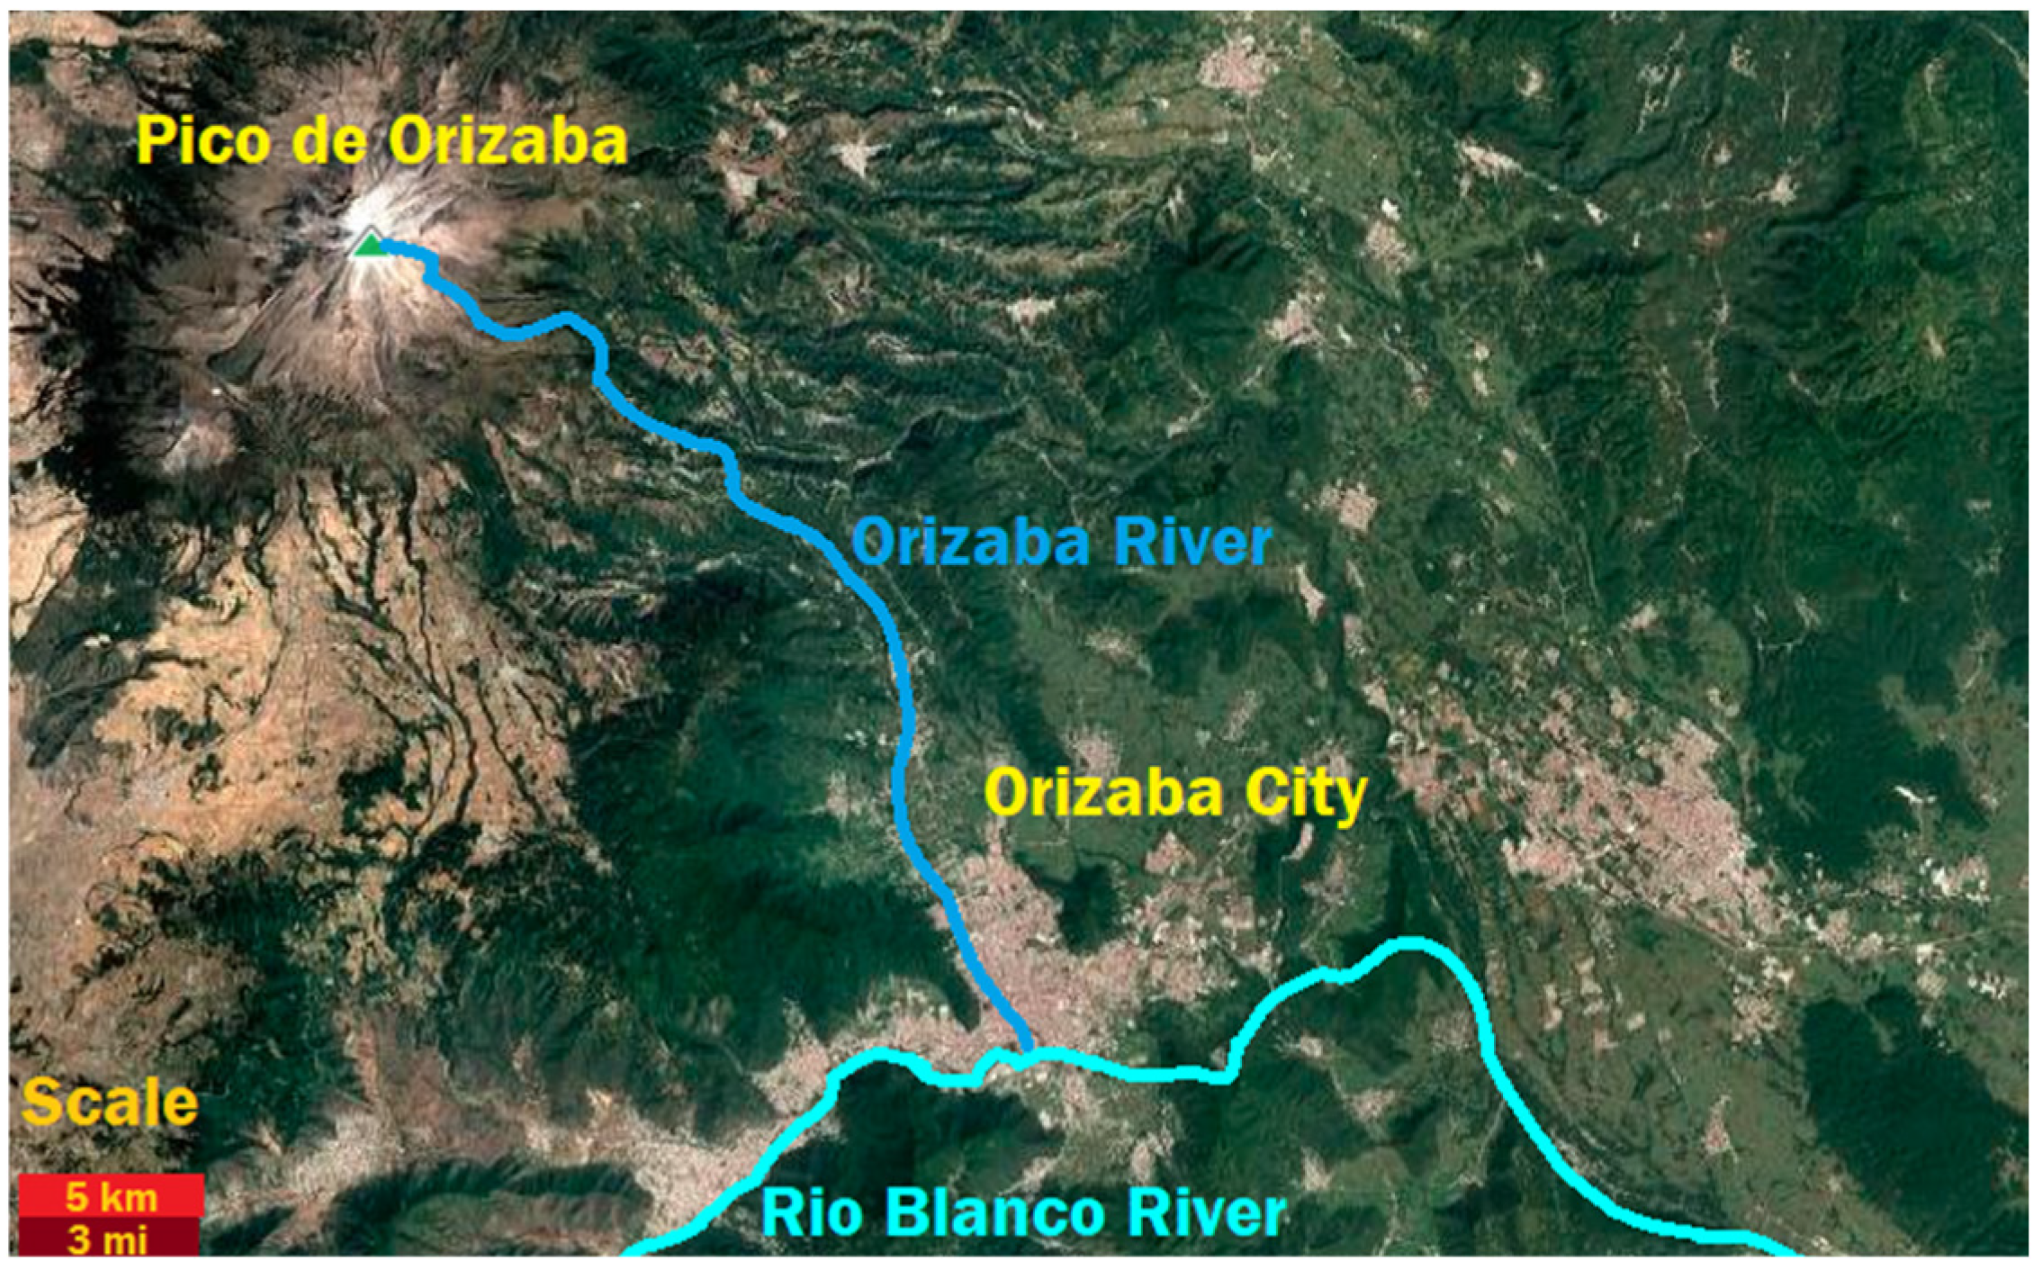
The case study of this framework presents the following problem: a greater intensity of rainfall causes a rapid and accelerated growth in the water level of the Orizaba River. Therefore, this river is classified as one of Mexico’s rivers with rapid-response catchments (RRCs). The sudden and accelerated increase in the depth of the Orizaba River represents a problem because the distance between the volcano and Orizaba City is very short. During the rainy season (June–October), rainfall is intense and random throughout the day. This intensity is due to the great height of Pico de Orizaba, which generates very changeable weather conditions. Figure 1 shows an edited satellite map that includes the top view of Pico de Orizaba, Orizaba River, and Rio Blanco River, as well as a scale to measure their distances.

Figure 1.
Edited satellite map [37].
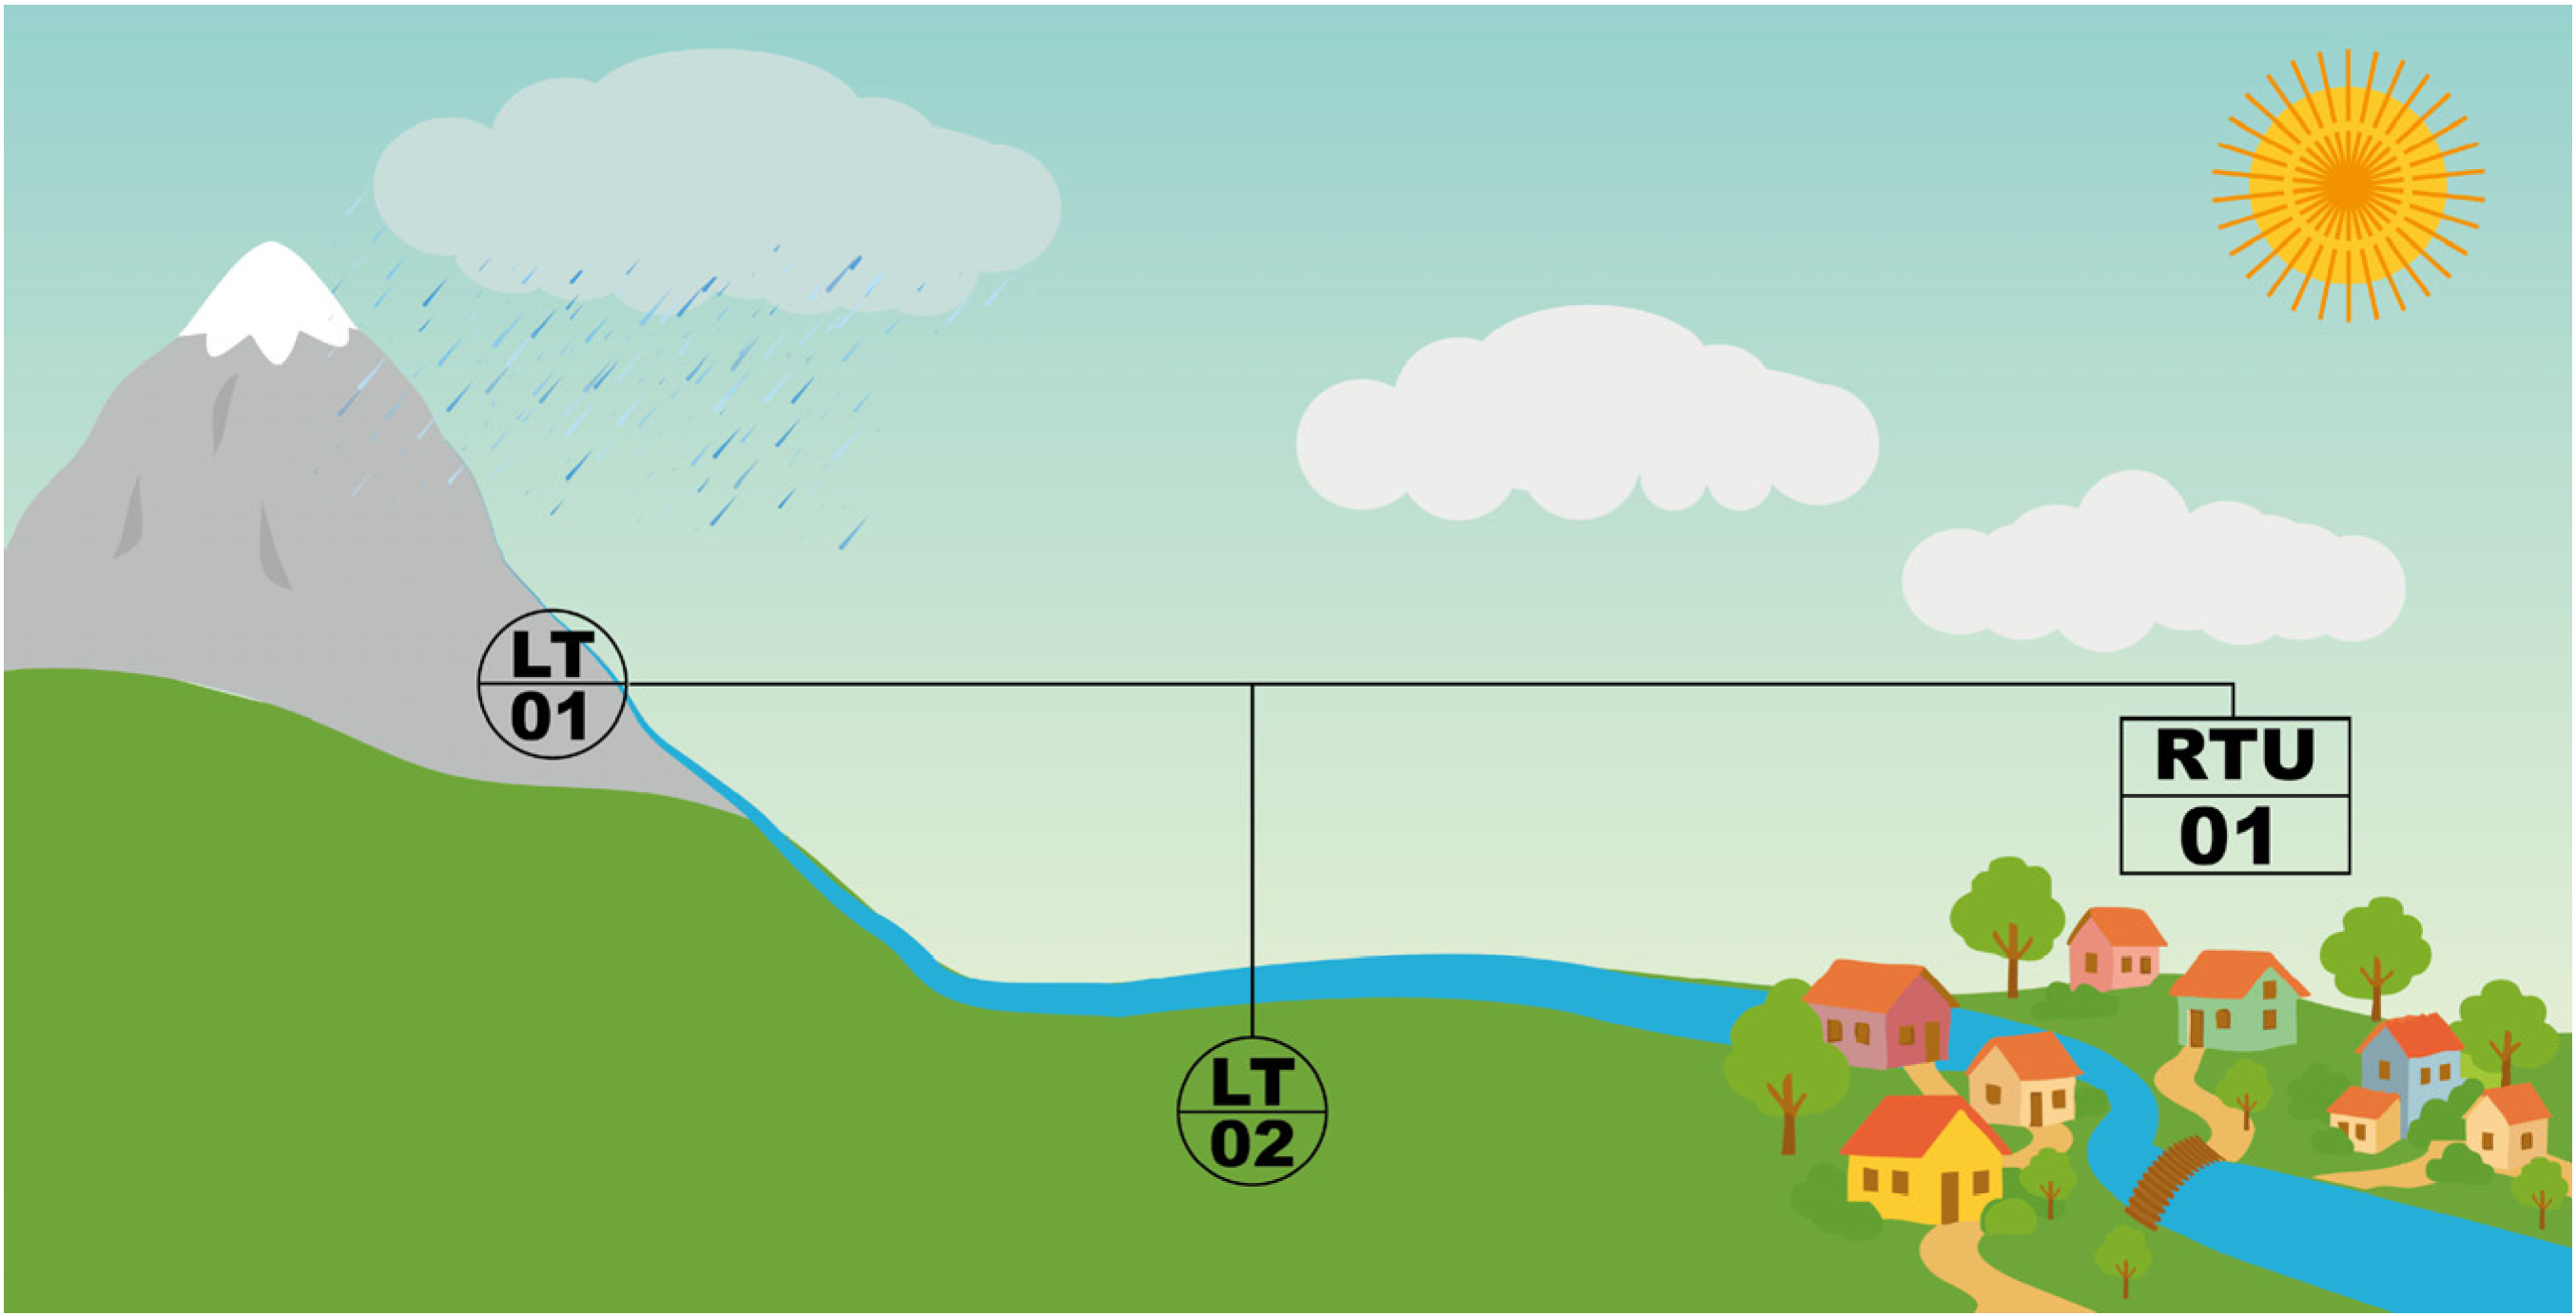
This framework proposes monitoring the growth of the flow in the Orizaba River from a Remote Transmission Unit (RTU-01) using two Level Transmitters (LT-01 and LT-02) sensors to prevent an emergency caused by an overflow. Figure 2 shows a schematic of the location of the two LTs and the RTU. LT-01 is located closer to the volcano (5 km from it), and its primary function is to monitor the increase in river depth caused by snow and precipitation. This monitoring is very useful because it allows for early-stage analysis of flow growth. If LT-01 detects considerable growth, it preemptively alerts the RTU’s monitoring center.
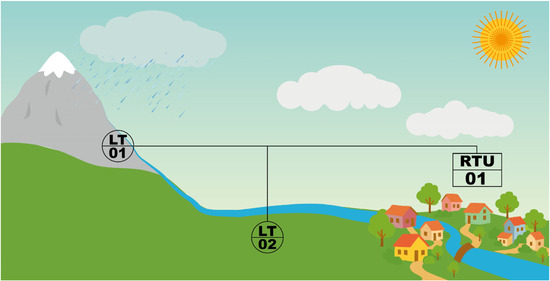
Figure 2.
Schematic of the location of the two LTs and the RTU.
On the other hand, LT-02 is located further from the volcano (15 km from it) but closer to the RTU. LT-02 is tasked with validating the information received from LT-01 and measuring the river’s depth at that location. Depending on the increase in the water level measured by LT-02, the RTU determines the severity of the problem and, in the case of an emergency, has a certain time to make decisions regarding humanitarian logistics before the accumulated water reaches Orizaba City.
The above is the actual use of Level Transmitters. However, this framework uses historical data to develop the case study.
2.1.2. Identification of Variables and Establishment of Time Horizon
A river has many physical variables that affect its flow. These variables contain many other sub-variables that interact with each other and affect the main variable. Below is a brief explanation of the main variables involved in the river’s behavior:
- River depth: This is the variable of most significant interest in creating the simulation model. In the event of a rise in river level, the Level Transmitters send an alert signal to the Remote Transmission Unit to begin the containment plan with a humanitarian logistics approach.
- Volumetric flow rate: This variable is the product of the multiplication between the cross-sectional area and the velocity of the fluid (this is measured through flow sensors). It consists of the volume of fluid that passes through a cross-section per unit of time. The volumetric flow rate involves complementary variables such as slope (if this is very pronounced, the speed increases, which therefore increases the acceleration of the fluid), river width, and river depth, among others [38].
- Distance: It is the separation distance between the Level Transmitters and their position concerning Pico de Orizaba and the Remote Transmitter Unit located in Orizaba City.
- Precipitation: Orizaba City is in a region with a warm-humid climate. In addition, the city is surrounded by high mountains that exceed 2000 m above sea level. These factors cause intense rainfall in June–October, the season with the highest probability of river overflow.
The variables described above correspond to the river flow. However, this framework also involves the analysis of humanitarian logistics. The main variables involved in this are as follows:
- People at risk: These are the people who must evacuate. Activating this variable in the simulation model depends on the volumetric flow rate because if the amount of water flowing per unit of time is high, then the emergency probability increases, resulting in the evacuation of the population at risk.
- Number of shelters required: This variable depends on the number of people undergoing evacuation. The location of shelters is strategic to ensure the survival of those at risk.
- Provision demand: This variable consists of the logistics of supplying provisions to meet the number of people in the evacuation process.
Within the “provision demand” variable, there is a specific quantification for water, food, and medical provisions as follows:
- Water provisions: To survive, a person requires three to four liters (one gallon) of drinking water daily. This amount is used for drinking, cooking, and personal hygiene [39].
- Food provisions: An adult must consume approximately 2000 kcal daily. This diet consists of two meals made up of servings from different groups: fruit, vegetables, meat, bread, cereals, fish, and cheese, among others [40,41].
- Medical provisions: The American Red Cross recommends that each aid kit for a family of four include absorbent compress dressings, adhesive bandages, adhesive cloth tape, antibiotic ointment packets, antiseptic wipe packets, packets of aspirin, an emergency blanket, sterile gauze pads, an oral thermometer, a roller bandage, and tweezers, among other medical provisions [42].
The main variable in a continuous simulation model is time. Therefore, it is necessary to establish the simulation horizon. In a disaster situation, the response time must be minimal. In addition, the short distance from the volcano to Orizaba City means the flow quickly reaches the city. For these reasons, the simulation time horizon is given in hours, which allows for the analysis of smaller time units (minutes) or larger ones (days).
2.2. Formulation
This phase consists of creating the basic diagrams for developing continuous simulation. The river and humanitarian logistics variables above are the basis for developing the Causal-Loop diagram (CLD) and Forrester Diagram (FD). The following subsections describe the function of both diagrams.
2.2.1. Elaboration of the Causal-Loop Diagram (CLD)
A CLD consists of an oriented graph containing arrows that relate one variable to another. These relationships have positive or negative polarities, indicating that increasing the values of one variable can increase or decrease the variable they affect. The relationship between variables generates closed causal circuits, resulting in balancing and feedback loops. Balancing loops stabilize the system and arise when there is at least one relationship with negative polarity, while feedback loops feed the other relationships, producing causal growth. Sometimes, adding extra variables to create a CLD to link some variables properly is necessary. Figure 3 shows the CLD.
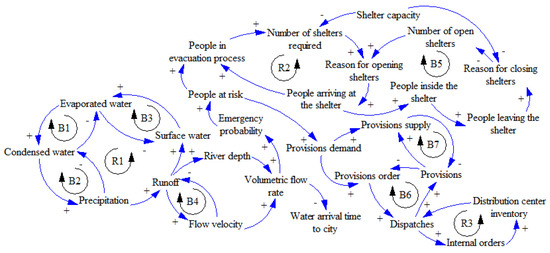
Figure 3.
Causal-Loop diagram (CLD).
The CLD has three main sections: river growth analysis, the supply of provisions, and the need to use shelters. In these sections, the CLD has six balancing loops and three feedback loops, making this system dynamic. Below is a brief description of these three sections:
- River growth analysis: This section of the CLD involves loops B1, B2, B3, B4, and R1. These loops are related to the water cycle that produces river growth, and the variables associated with flow velocity and volumetric flow rate.
- Supply of provisions: The variables involved form loops B6, B7, and R3. Causal relationships link variables focused on the analysis of the supply of provisions during the emergency.
- Use of shelters: Loops R2 and B5 represent the dynamics of the need for shelters in an emergency, depending on the number of people at risk.
According to Figure 3, the most important variable in the CLD is “people at risk” because it relates to the abovementioned three sections. The decision-making process to open shelters and supply provisions directly depends on the number of people who must evacuate.
2.2.2. Creating the Forrester Diagram (FD) and Its Graphical Interface
After developing the CLD, the next step is creating the Forrester Diagram (FD). This diagram transforms the causal relationships found in the CLD into a dynamic simulation model. The transformation process consists of converting the loops into level variables (represented by stocks), information flow valves (input and output of mathematical relationships), and auxiliary variables that complement the programming. There are numerous software for creating the FD. Some of them are iThink Architect ©, Vensim ©, and Stella ©. Our framework uses Stella © to create the FD. Figure 4 shows this diagram.
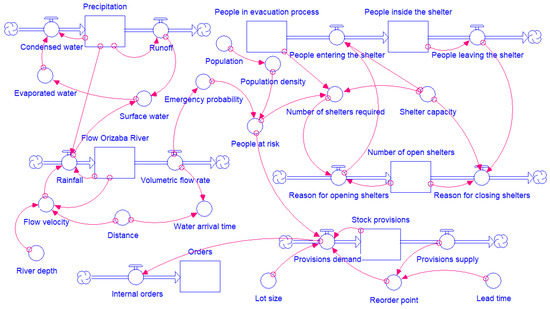
Figure 4.
Forrester Diagram (FD).
The Forrester Diagram uses mathematical operations in its programming. The level variables (stocks), information flows (valves), and auxiliary variables have operation logic based on differential equations measured through time differentials. This differential consists of the difference between the information input and output valves, taking the level variables as the information stock. Auxiliary variables (represented by circles) provide complementary information to the stocks through the valves. This information includes mathematical relationships such as constant values, physical formulas, random numbers, and other operations. An example of this programming logic is the differential equation shown in Equation (1):
Equation (1) represents the level variable Orizaba River flow (F(t)), and the input (rainfall—R) and output (volumetric flow rate—V) information flow. These flows change over time as a differential (dt), starting from an input value denoted by F(t0). This differential equation is represented in the Forrester Diagram, and the rest of the level variables also represent differential equations.
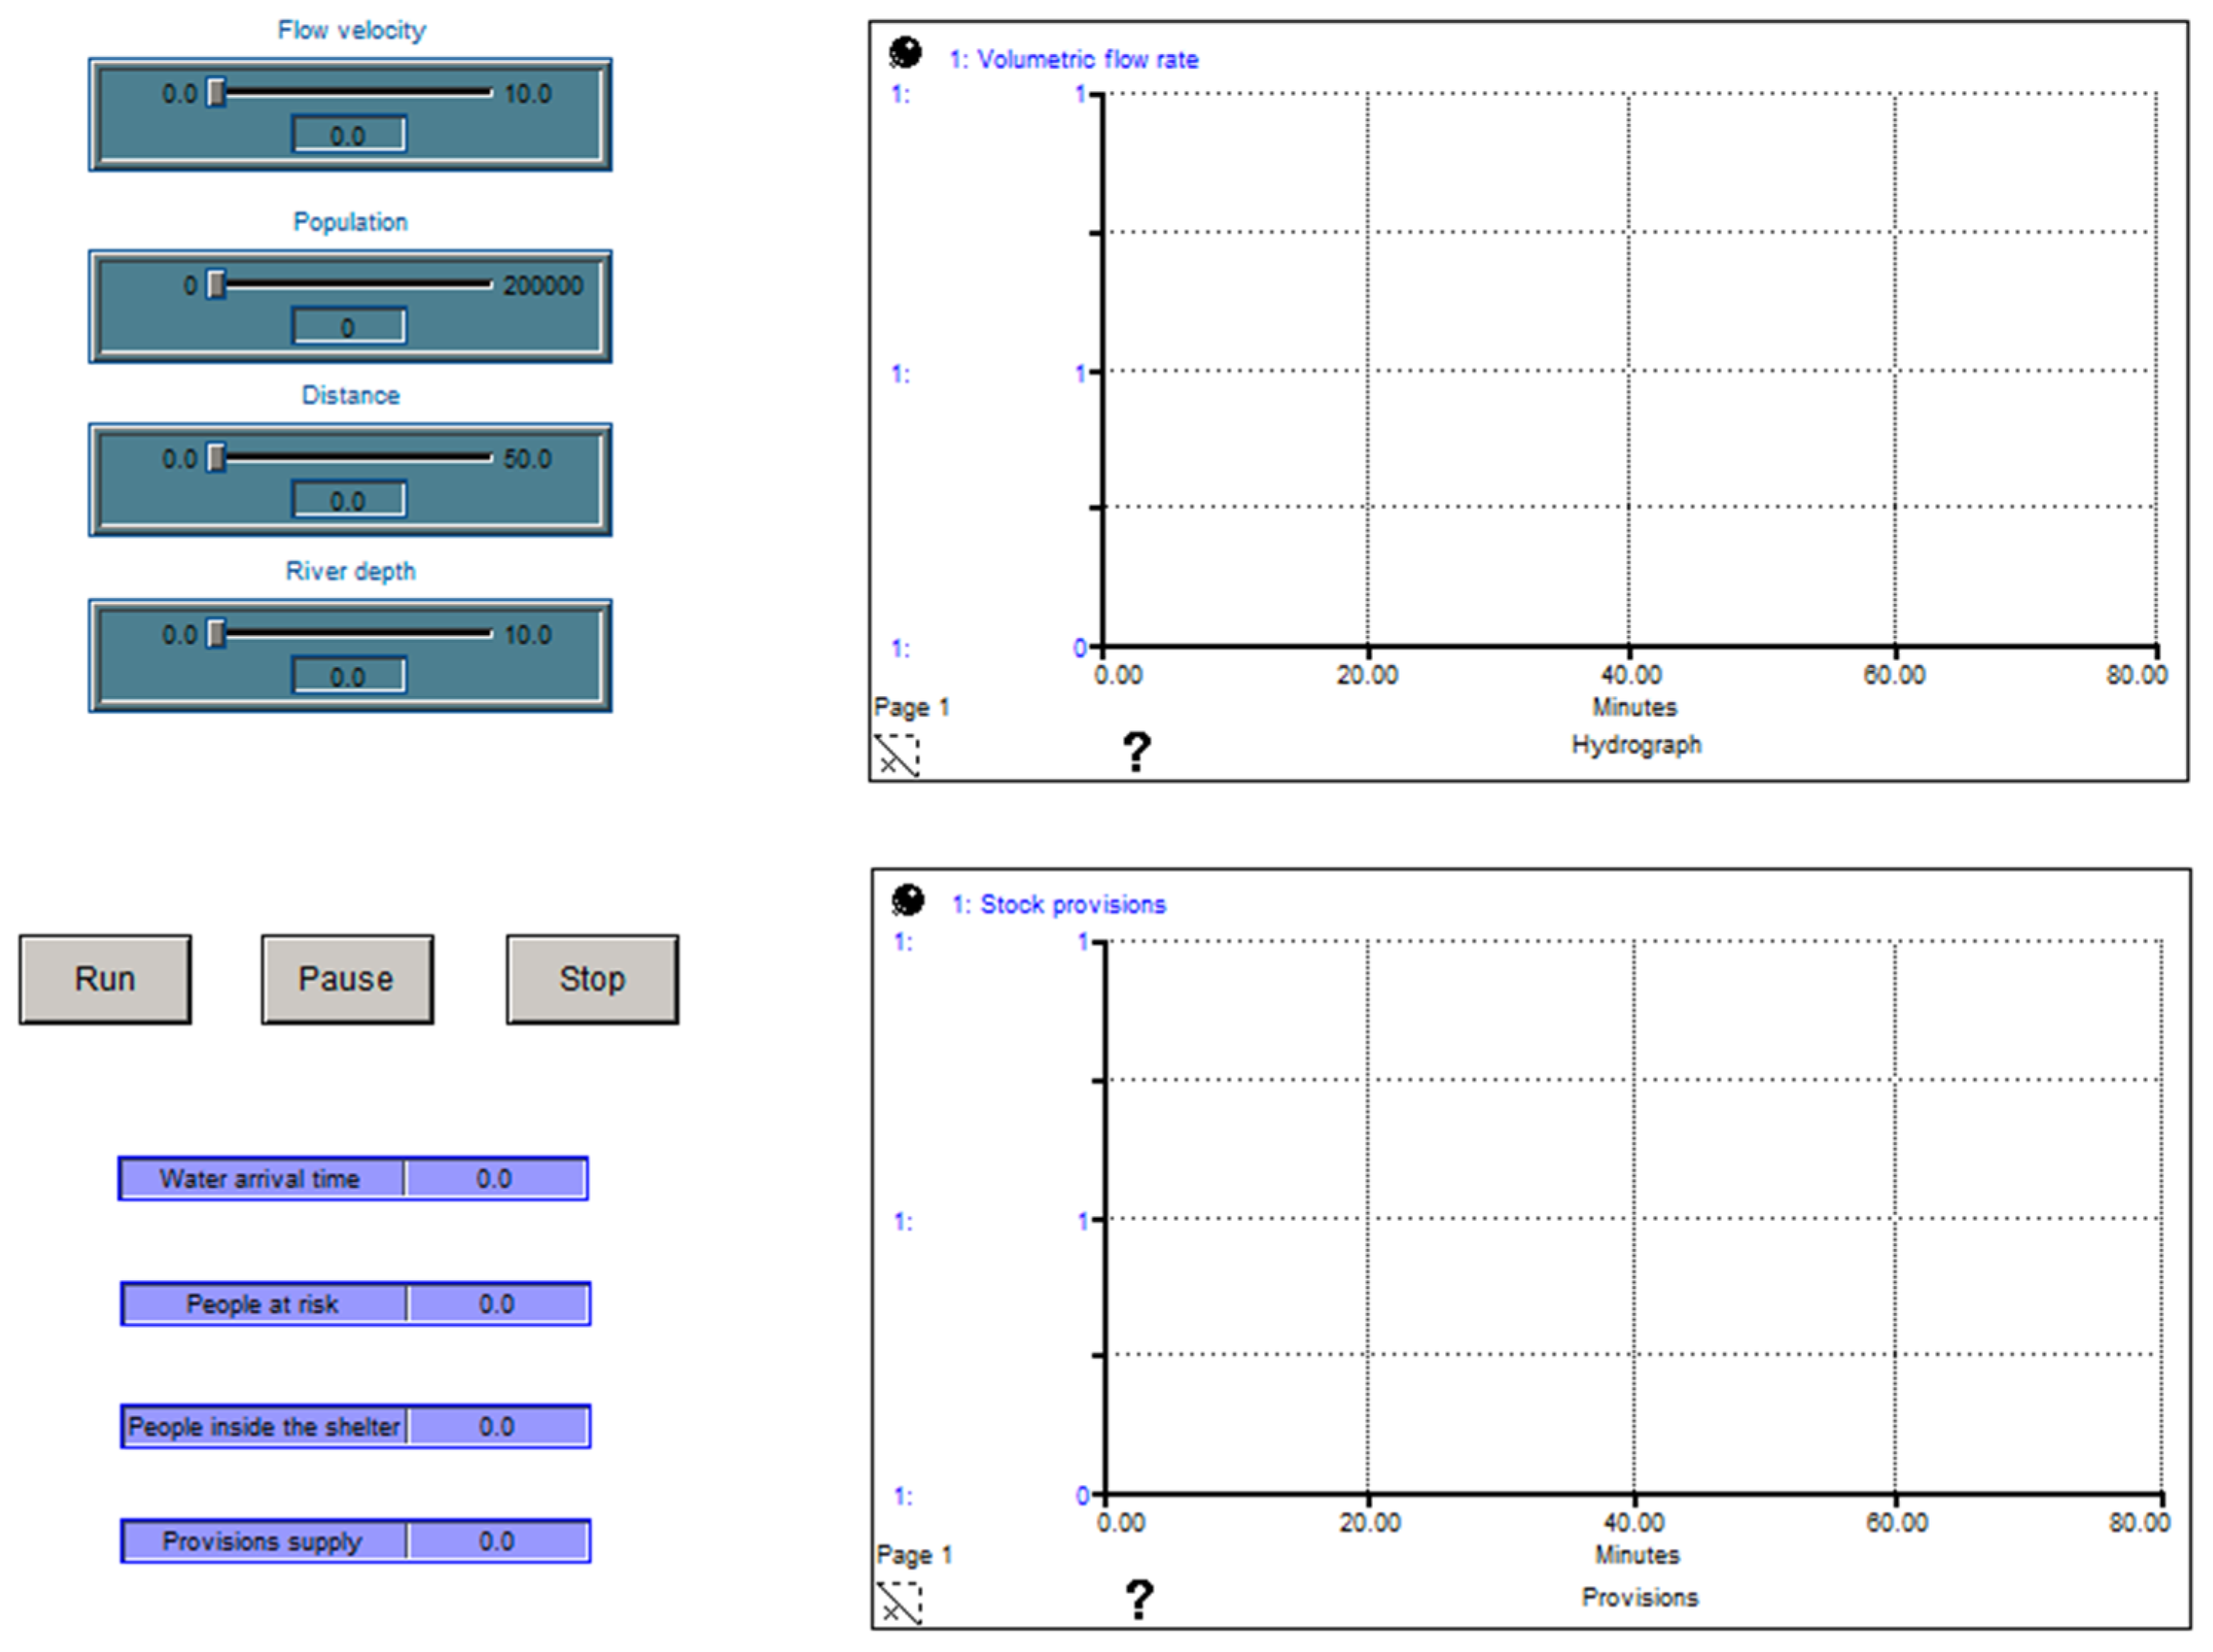
This framework uses datasets from the reported literature, such as the quantities of food, water, and medicines [39,40,41,42], physical measurements carried out with sensors in LT1 and LT2, and historical data collected by subject matter experts from the Civil Protection Department. This dataset results in the FD shown in Figure 4 and allows for the creation of a graphical interface. Stella © allows for the creation of graphical interfaces to more easily manipulate the Forrester Diagram. These interfaces allow for the insertion of buttons, graphs, tables, and numeric displays to analyze the dynamics in the simulation model. Figure 5 shows the graphical interface for analyzing river behavior and humanitarian logistics in emergencies.
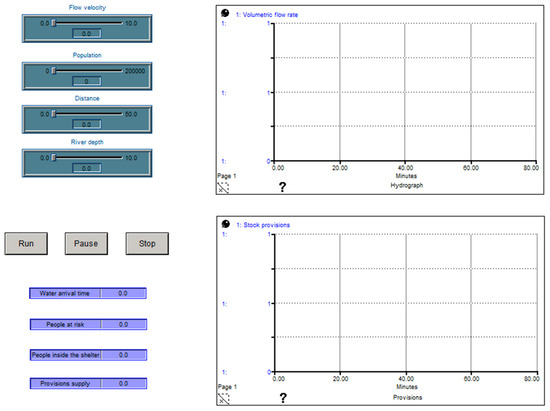
Figure 5.
Graphical interface.
The graphical interface has two displays to analyze the graphical behavior over time of the volumetric flow rate and the stock provisions variables. In addition, this interface has buttons and slider input devices to modify input variables and numeric displays to observe output data. The following section (Results) shows the application of the simulation model based on a case study.
3. Results
This section involves the SD methodology’s third (Evaluation) and fourth (Implementation) phases. The interface presented in this framework uses input data to carry out simulations. These data can be historical (information collected by the Comision Nacional del Agua [43] in Mexico), hypothetical, or obtained in real-time according to the measurement of speed and depth sensors (Figure 2).
The interface displays the graphical analysis of two variables: the volumetric flow rate and the stock provisions. The hydrograph is the typical archetype that describes the variations in water flow in a river over time [44,45]. Therefore, this simulation model is programmed to display a hydrograph to analyze the increase in flow in the Orizaba River. For the analysis of the supply of provisions, the interface displays a graphical behavior similar to the Economic Order Quantity (EOQ) model [46]. This behavior is suitable for supply because, in an emergency, continuous supply that varies depending on changing conditions and sudden rising needs is required. Therefore, a model similar to the EOQ model provides advanced strategies during an emergency. Section 3.1 shows some graphic examples of the volumetric flow rate and the stock provisions.
3.1. Evaluation
The third phase evaluates the simulation model created in the previous phase. The evaluation process consists of various simulations to analyze the system’s graphical behavior and visualize potential solutions for the implementation phase. In addition, the validation process occurs in this third stage to ensure that the simulation model provides reliable results.
3.1.1. Simulation of the Model Testing Different Scenarios
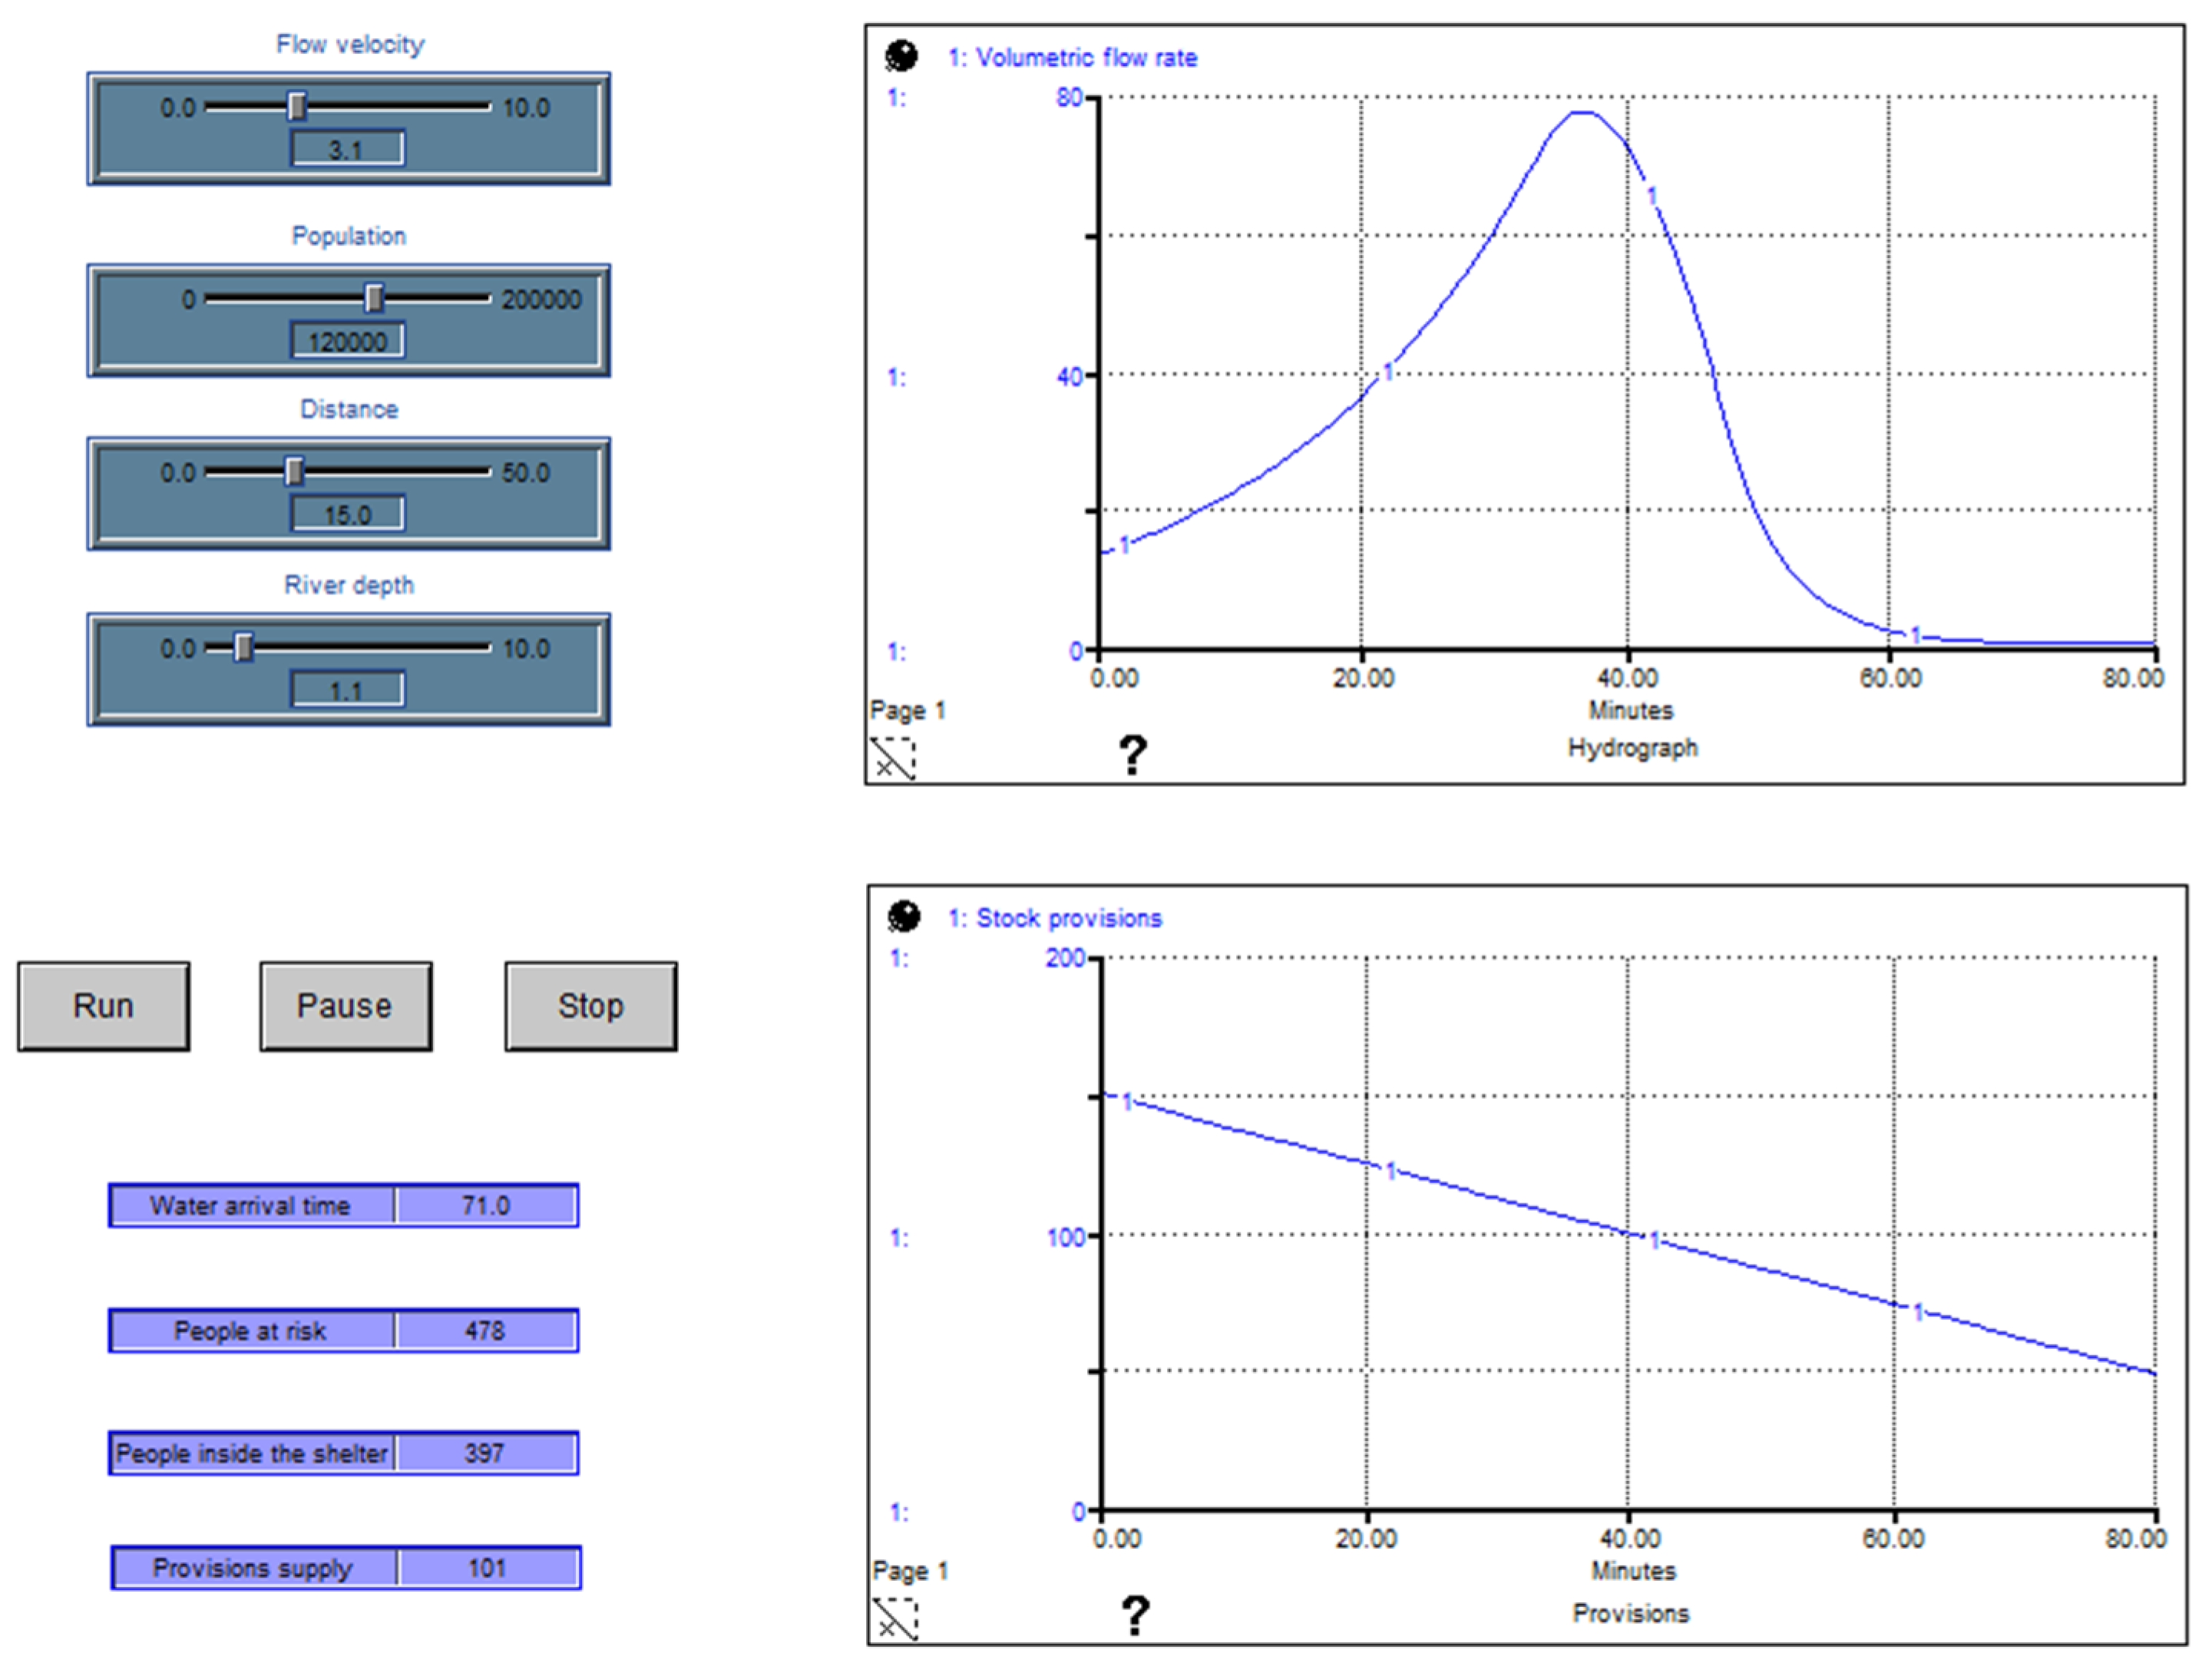
The graphical interface created in Stella © allows for model analysis by assigning different values to variables and observing different scenarios. These scenarios allow the user to understand the system’s behavior and facilitate decision-making. Figure 6 shows an example: Entering 3.1 m/s as the flow velocity and considering the 120,000 inhabitants in Orizaba City, the 15 km distance of LT2 from Pico de Orizaba, and an increase in the river depth of 1.1 m above its normal level, the graphical interface generates a hydrograph that represents the increase in the amount of water. The input variables for flow velocity and river depth were obtained from sensor measurements. Specifically, LT1 and LT2 are responsible for measuring depth. These input data generate output values represented through numerical displays, which include the water arrival time in Orizaba (time to activate the emergency containment plan), the number of people at risk, the people inside the shelter, and the supplies to assist the refugees.
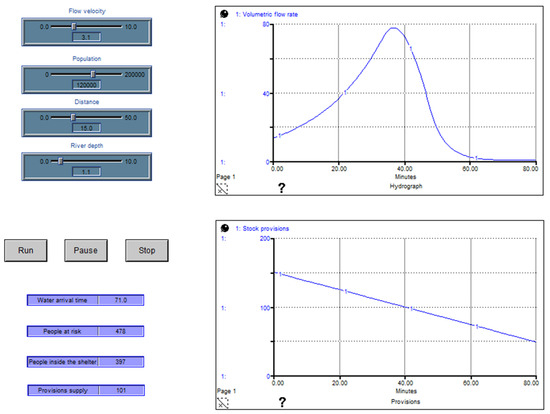
Figure 6.
Testing different scenarios.
The interface in Figure 6 shows the growth of the river through a hydrograph. However, it also shows a descending linear graph, representing the decrease in the initial stock of provisions over time. This behavior is linear because there is a direct proportional relationship between the number of people at risk and the number of supplies. One supply of provisions meets the basic needs of four people because it contains a one aid kit, 16 L of water (4.22 gallons), and eight food rations (considering two daily mealtimes per person and providing 2000 kcal of energy per two rations). It is important to mention that the case study shelter has a capacity of 600 people. Therefore, the initial stock is 150 provisions. For this reason, it must be continually replenished depending on the number of days the shelter is occupied.
3.1.2. Validation of the Simulation Model
The validation process is important before the implementation phase. This process involves verifying the results through expert review, some of whom are Mexican Civil Protection Department members, to ensure that the simulation model produces results that reflect reality. The paired-t confidence interval is a statistical test to validate simulation models by comparing real and simulated data [47]. The water arrival time is the variable of priority interest in this framework because these data are critical for decision-making in the humanitarian logistics plan. Table 3 shows the comparison between real and simulated data regarding water arrival time using a paired-t confidence interval test.
Table 3.
The paired-t confidence interval test.
Equations (2) and (3) are necessary to calculate variance and confidence intervals:
The t-statistical value for a 95% confidence interval is . Applying Equation (2), the variance is
The confidence intervals use Equation (3):
The operations above produce the following confidence interval:
The confidence interval above includes the value of zero. This test demonstrates that the water arrival time programmed in the simulation model is statistically valid and has a reliability of 95%.
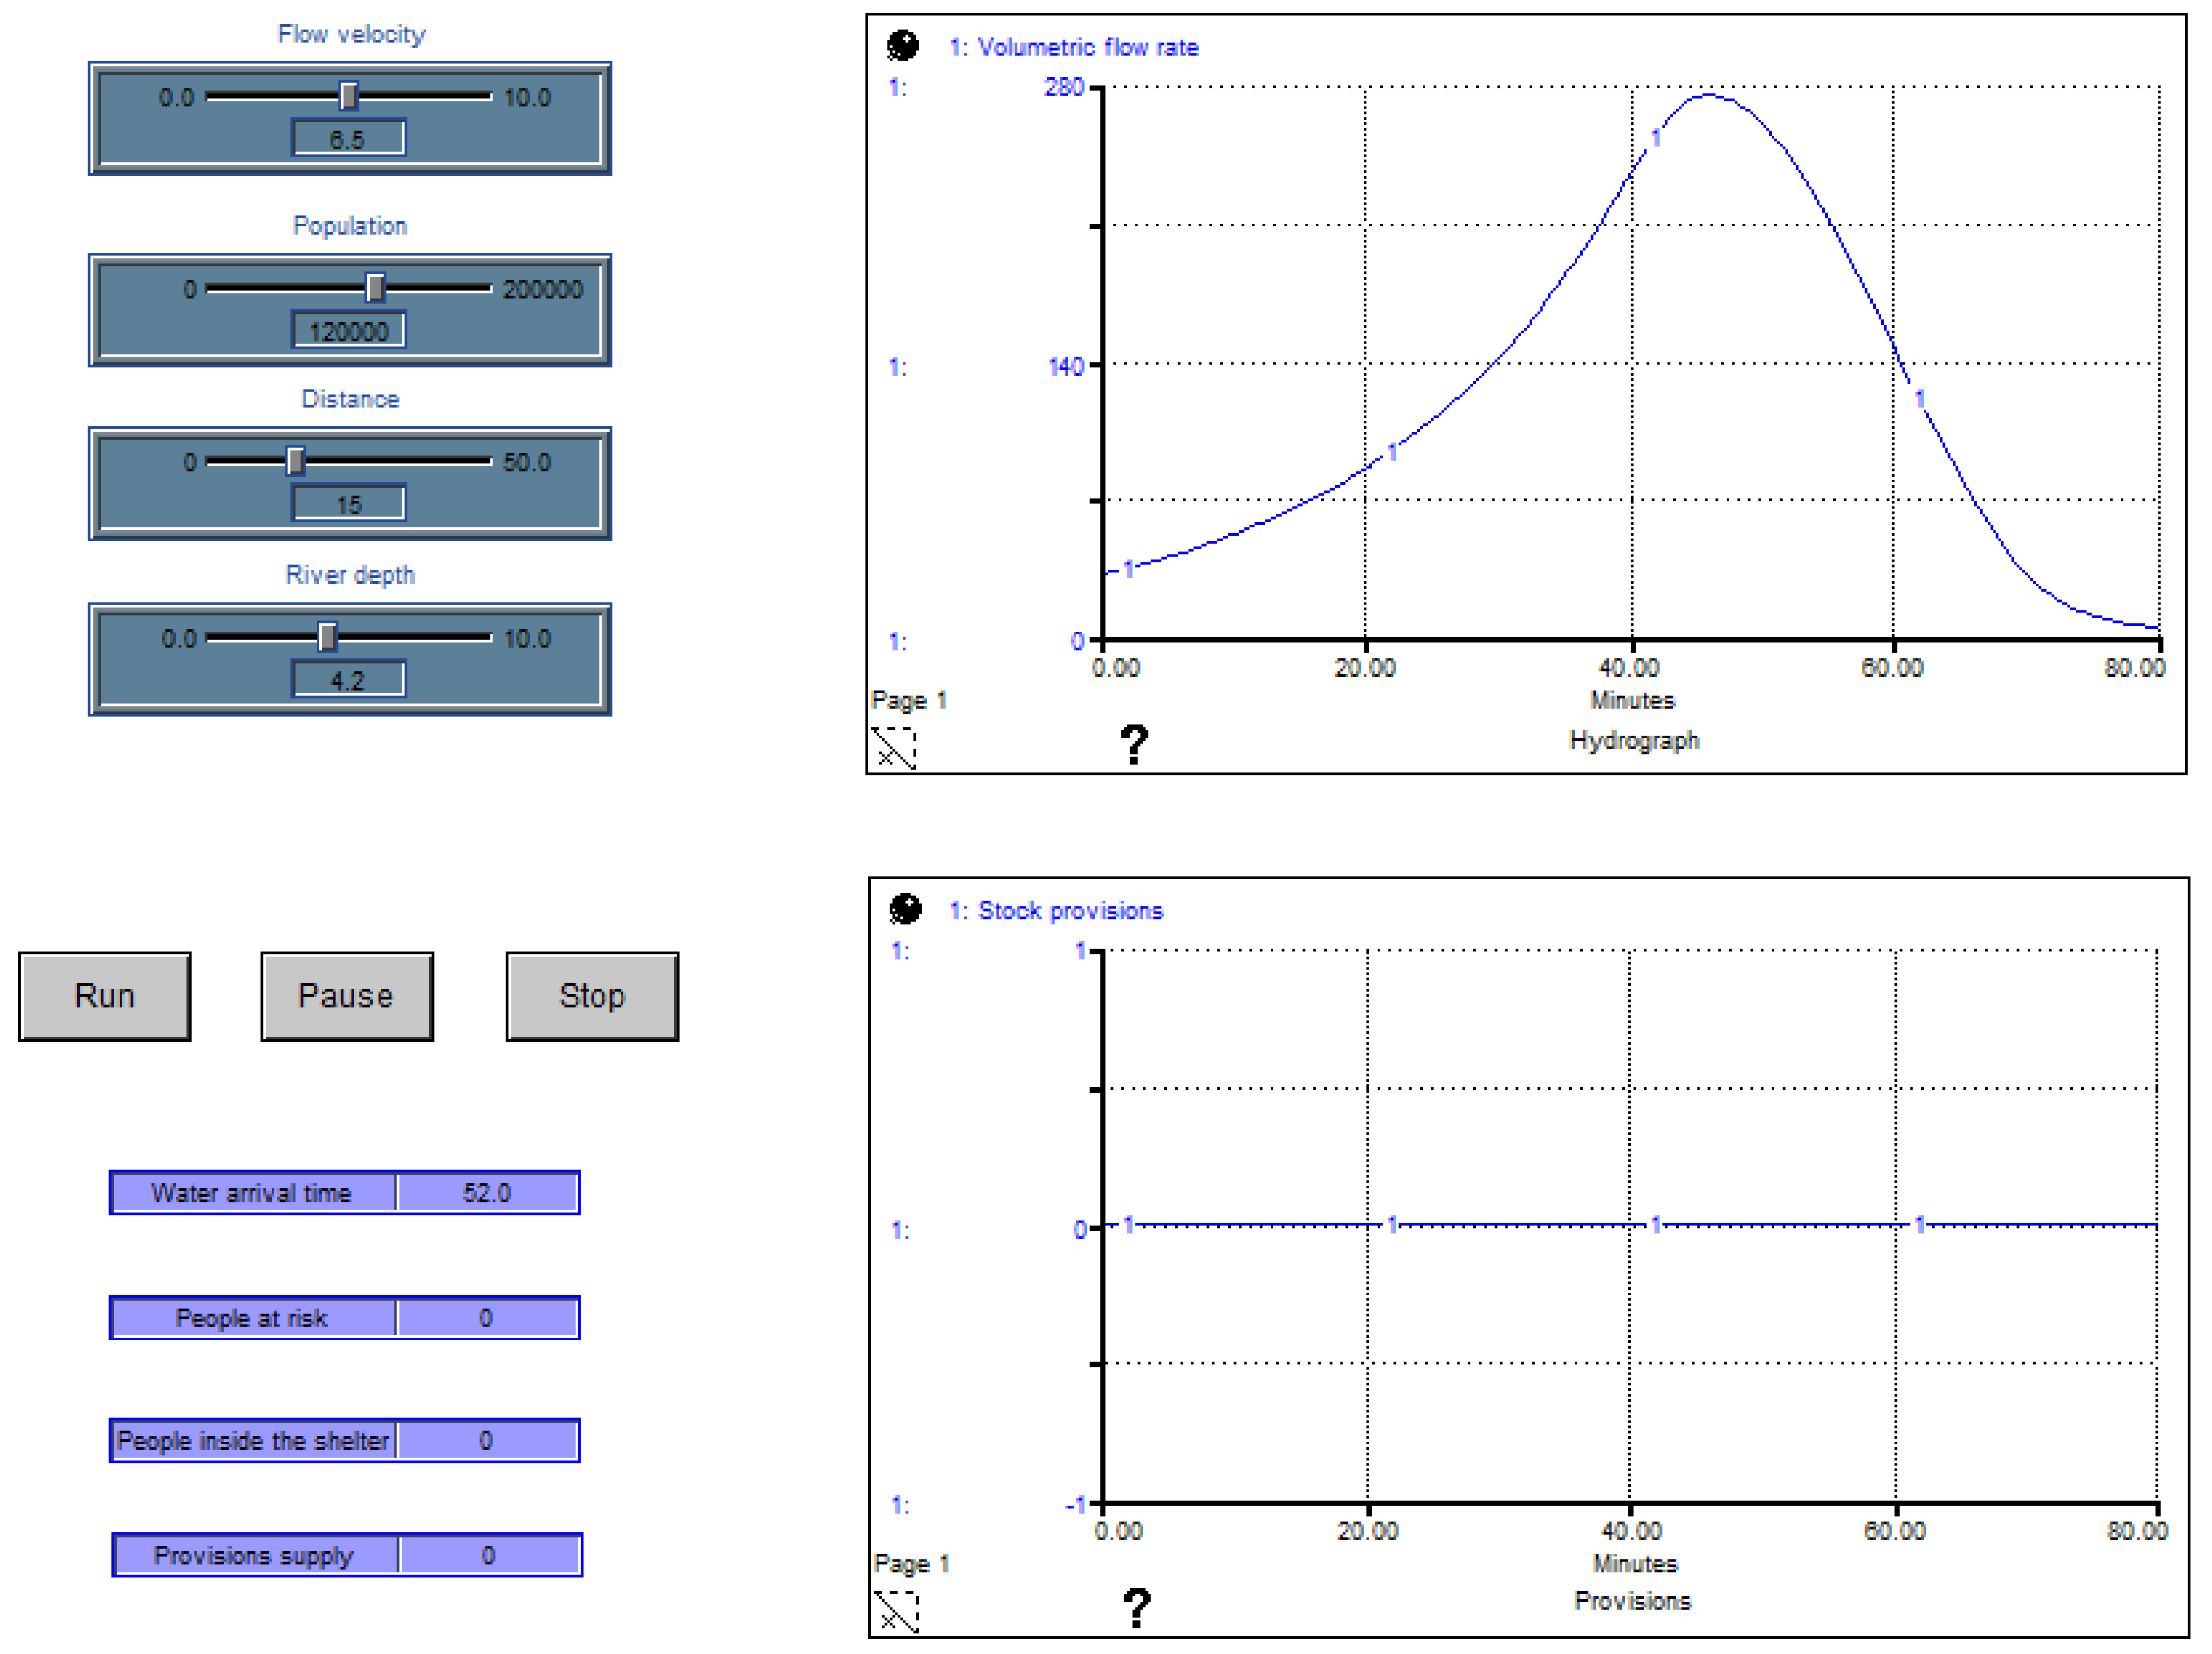
Another way to validate this simulation model is by comparing results concerning the software used by El Instituto Nacional de Estadistica y Geografia (INEGI) in Mexico. This institute uses software that simulates water flows in hydrographic basins in Mexico named SIATL v4 © [48]. The results from SIATL v4 are similar to those obtained using this simulation model. However, a more practical method for validating simulation models is through extreme conditions testing. This test aims to determine whether the simulation model generates consistent results from extreme input values entered by the user [49]. Figure 7 shows an example of the application of this test. There are rivers whose streams during floods exceed 25 km per hour (6.94 m/s) [50]; considering a speed of 6.5 m/s and 4.2 m as the river depth as extreme conditions, and leaving the variables of population and distance constant, the volumetric flow increases rapidly.

Figure 7.
Extreme conditions testing.
Figure 7 shows the water arrival time with a value of 52 min. According to the regional Civil Protection Department, the minimum time required for the humanitarian logistics plan is 60 min. This is the reason why the variables people at risk, people inside the shelter, and the supply of provisions all have zero values, and the stock provisions graph is empty. In other words, the simulation model is programmed not to respond to this situation since it is not feasible to prepare for these conditions due to resource and infrastructure issues. Therefore, the simulation model reacts appropriately to an extreme conditions test.
3.2. Implementation
Orizaba City is in a region with high levels of rainfall from June to October. During these months, rainfall is abundant in the city and surrounding areas. However, global warming has produced significant changes in climatic conditions in recent years, some reflected in lack of rain and others in increased and more intense rainfall.
Hurricane Ernesto was a devastating tropical cyclone that affected several areas of the Caribbean and Central America in 2012. This hurricane was the fifth named storm and the second hurricane of the season. On 9 August 2012, it affected the Orizaba region, causing two rivers to swell: the La Carbonera River and the Orizaba River. This incident affected 140 houses; one person went missing and was not found [51,52]. Hurricane Ingrid entered Mexico from the Atlantic and Hurricane Manuel from the Pacific Ocean. This hurricane collision left 157 people dead, more than a million people affected, nearly 40,000 tourists stranded in Acapulco, Mexico, and more than 150,000 hectares of agricultural land damaged [53]. The Orizaba region was also affected by this meteorological event. The Orizaba River’s water level rose rapidly (approximately 4 m) and overflowed its banks [54]. This flooding affected dozens of homes in Orizaba City. In addition, this flood resulted in the death of some animals at the city zoo, which is located just a few meters from the river [55].
Implementing the dynamic model proposed in this framework simulates a situation similar to 2013, offering a previously unconsidered humanitarian logistics plan. For this reason, the framework’s main contribution is to integrate a humanitarian logistics plan into monitoring a rapid-response catchment through the SD approach.
3.2.1. Simulation of the Model to Establish Policies
The case study presented in this section operates with variables that represent conditions like those that occurred in 2013; however, the simulation model is not limited to simulating past events; it can also use variables that represent current or simply hypothetical conditions to assist in the decision-making process in the face of possible future emergencies.
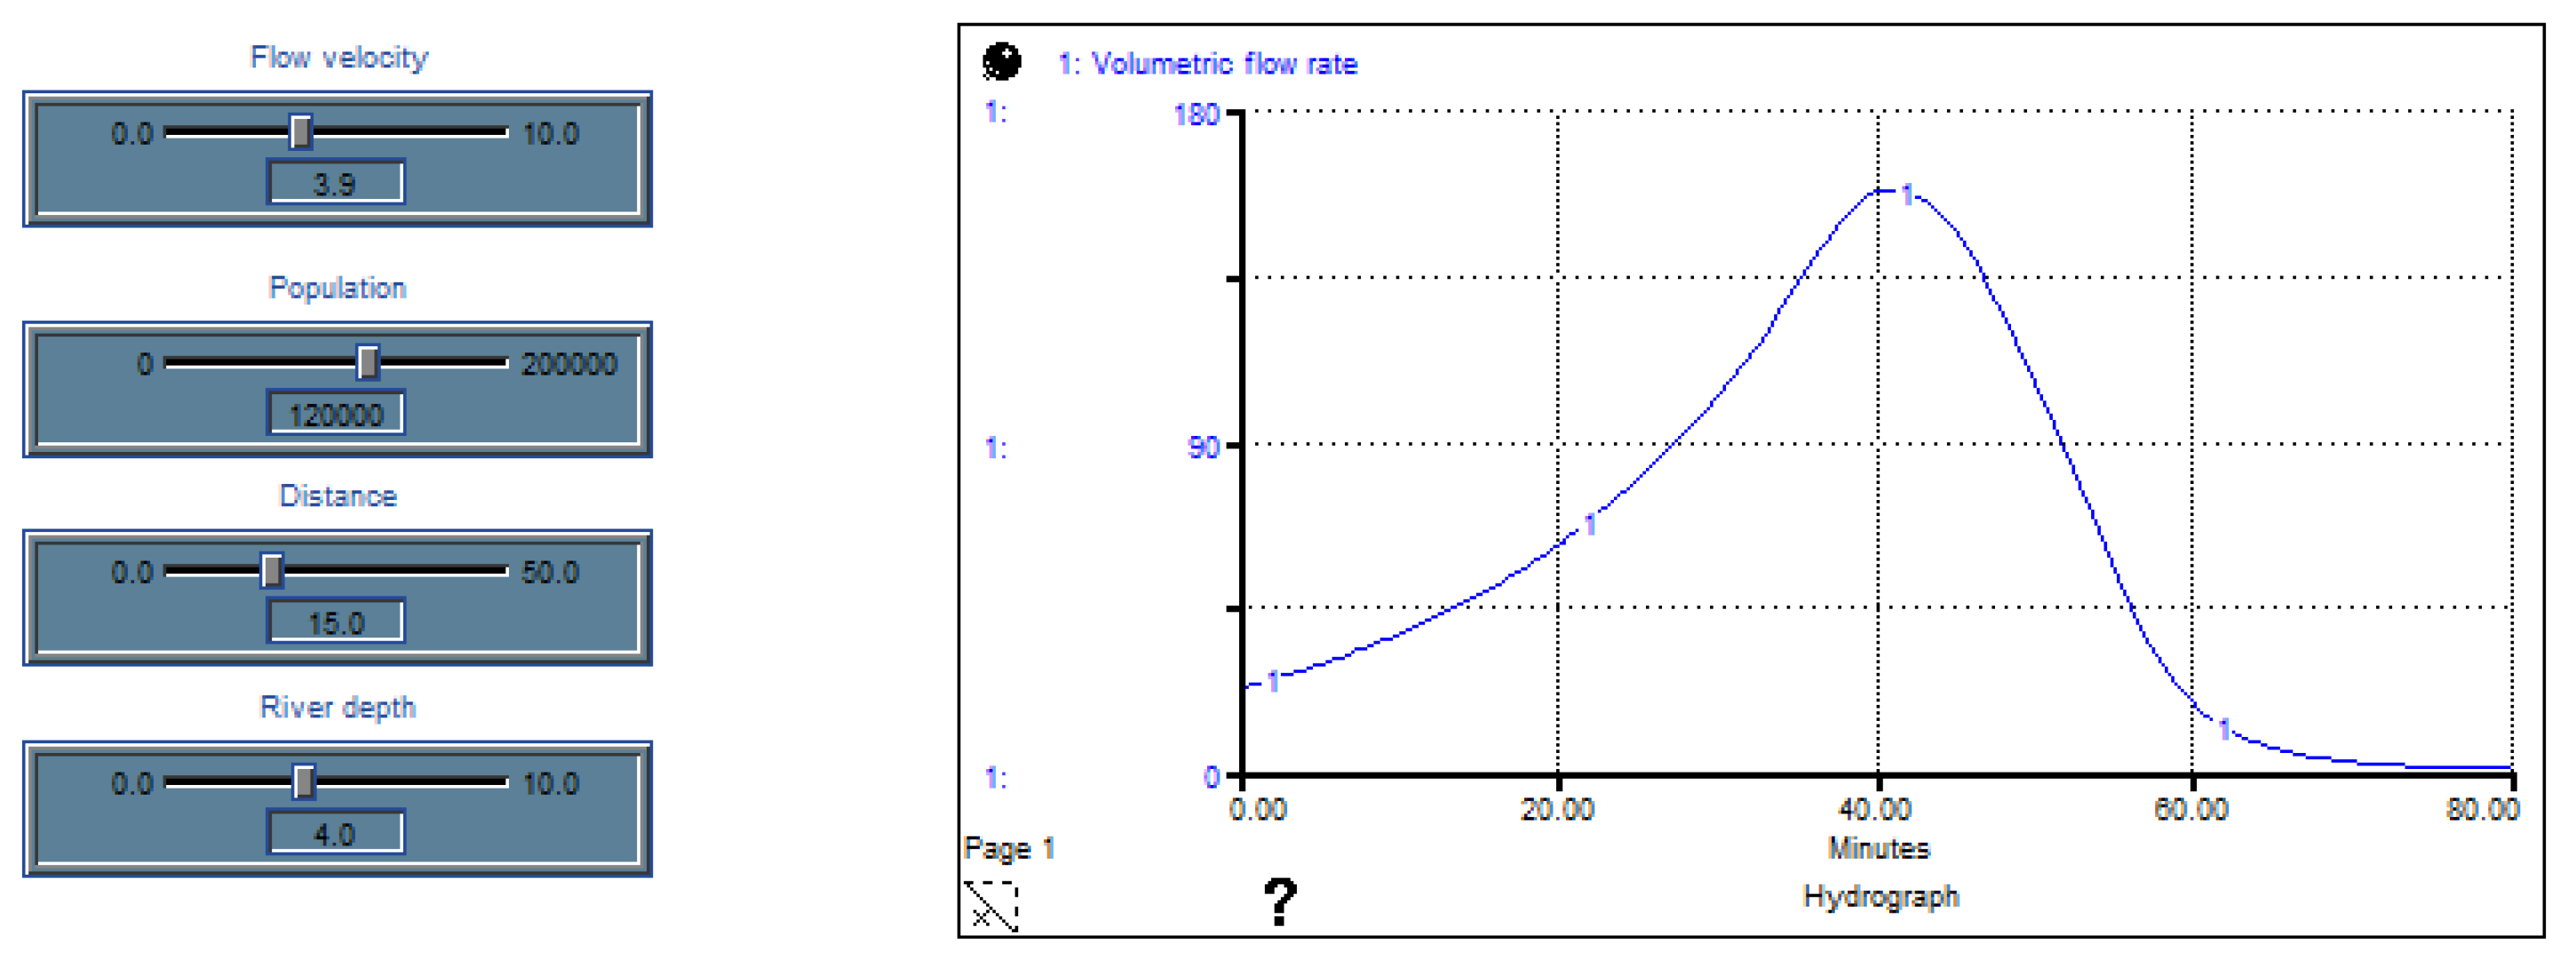
According to historical data, the population of Orizaba City has seen slight variation in recent years (approximately 120,000 inhabitants). Records indicate that during the 2013 emergency, the river level reached 4 m, and the estimated river velocity was approximately 3.9 m/s. Figure 8 shows the behavior of the hydrograph using the above values in a fragment of the created interface.
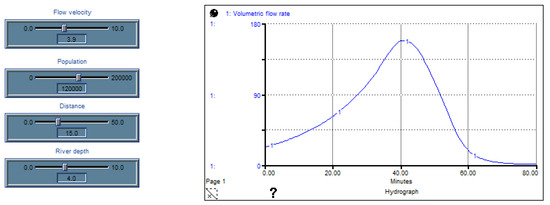
Figure 8.
Volumetric flow rate analysis.
Figure 8 shows the behavior of the volumetric flow rate, whose maximum is approximated at 160 cubic meters per second. This hydrograph represents the growth of the river flow measured through LT2. For this reason, the flow does not begin at the axis origin of the graph but rather at a value close to 25 cubic meters per second since it considers the flow coming from the previous section and already measured by LT1.
The graph shown in Figure 8 has a maximum period of 80 min. During this time, LT2 alerts the RTU by sending emergency signals and initiating the humanitarian logistics containment plan, considering that the minimum time required to carry out the containment plan is at least one hour.
3.2.2. Decision-Making Based on Simulation Model Results
The graphical interface makes the decision-making process based on previously entered data much easier. The input data allow for a simulation of the system’s behavior as river flow increases along with an analysis of output data involving humanitarian logistics. Figure 9 shows these results.
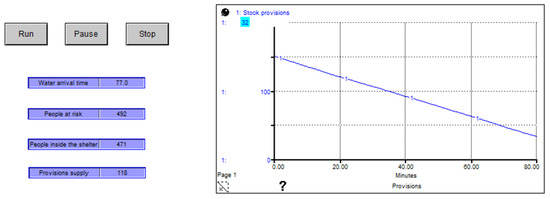
Figure 9.
Stock provisions’ supply analysis.
According to Figure 9, the water arrival time is 77 min. This time is sufficient to prepare a containment plan because the minimum time needed to implement the humanitarian logistics plan is one hour. The simulation model shows that 492 people are at risk because their homes are too close to the Orizaba River, or the building structure was not designed to withstand heavy rain or severe flooding. The rest of Orizaba’s population is at low risk of flooding because the city’s drainage infrastructure is efficient, and their homes are far from the river. This situation is due to several factors: some are issues of lack of awareness, others lack information, and others are because some residents can seek shelter elsewhere than the municipal shelter. The last indicator displayed through the graphical interface is the supply of provisions. This shows a quantity of 118 provisions. According to Section 2.1.2, this quantity satisfies the 471 people in the shelter because one supply contains sufficient food, drinking water, and medication to sustain four people in an emergency, as reported in the literature. In Orizaba City, there are two shelters near the Orizaba River. However, one is considered a temporary shelter (equipped only for sudden emergencies and with limited response capacity), while the other has the necessary infrastructure to serve the affected population. This shelter can serve 600 people, and its stock of supplies is 150. Since the number of people who will use the shelter is 471 inhabitants, the number of provisions required is 118, so the total inventory is left with 32 provisions, as shown in Figure 9.
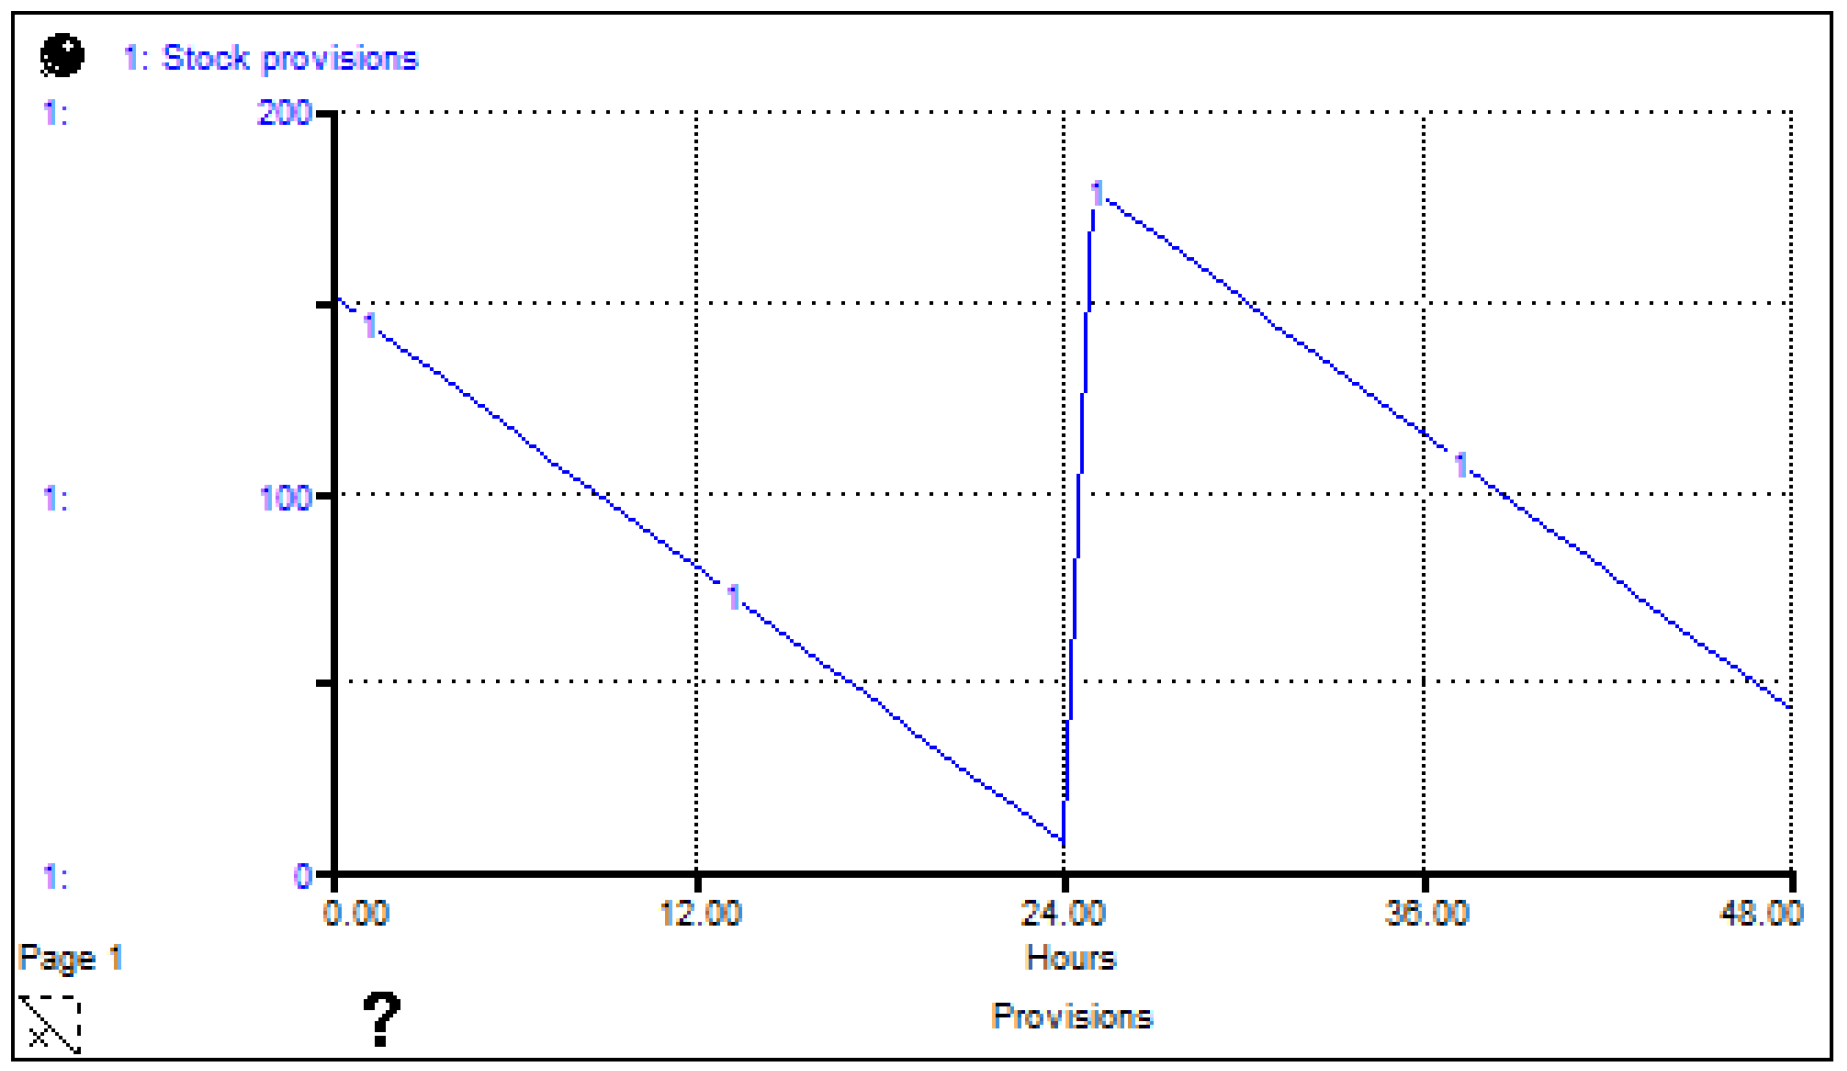
The graphical behavior of the stock provisions shown is linear since the number of provisions is directly proportional to the people inside the shelter. However, this supply only includes an initial stock of 150 supplies to protect a maximum of 600 people. This stockpile can assist people inside shelters for just one day because the weather phenomenon is relatively short-lived, as storms are dynamic and move constantly. Nevertheless, people inside the shelter may need to stay longer than a day. Consequently, the stock provisions will reach zero and need to be replenished. Implementing the EOQ model is an appropriate strategy for addressing the need for provisioning when people stay inside the shelter for longer than a day. Figure 10 shows the replenishment of stock provisions under the assumption of a more extended stay of people inside the shelter.
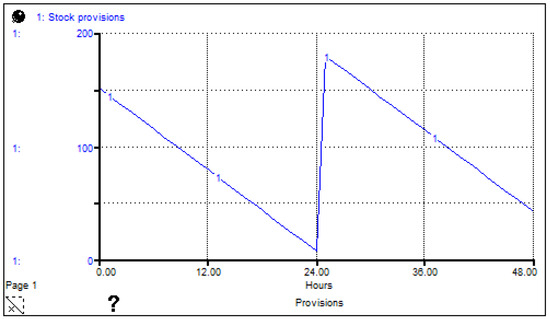
Figure 10.
EOQ model.
Figure 10 shows the classic behavior of the EOQ model. The initial value of provisions is 150, and as the hours pass, the amount of food, drinking water, and medicine decreases. However, before the end of the day or before the provisions run out, the replenishment policy sends an order to the Civil Protection Department to ensure sufficient provisions for the following day, even requesting an extra amount to meet the needs of the victims.
4. Discussion
A dynamic simulation model allows the user to analyze a system’s behavior over time and explore multiple scenarios in complex systems, overcoming some of the limitations of analytical models. The main advantage of the SD approach is its ability to model complex systems and analyze the interrelationship of their variables without affecting usability. The use of the graphical interface is an important advantage due to the visual results it generates and the easy manipulation of data. An adequate design allows any user to manipulate the simulation model without needing to be an expert in programming. Furthermore, the simplified interface created in Stella © has important advantages since, although the software shown in Table 1 is more specialized in river analysis, the large quantity of variables and technical information generates a limitation of use for non-expert users. Therefore, a simplified interface that summarizes the most important output values is more efficient in emergencies since time is the most valuable resource for preparing humanitarian logistics strategies and making appropriate decisions.
An important feature of the SD approach is the ability to integrate systems with different purposes, unifying them in a single diagram that varies over time. The literature reports that most software are focused on the analysis of the physical and chemical behavior of rivers (Table 1), and each city, region, or country has its emergency containment plans for natural disasters. However, despite the existence of extensive software specialized in river monitoring and developing strategies to contain emergencies caused by natural disasters, these programs operate independently. For this reason, the main contribution to knowledge is the integration of two simulation models operating simultaneously. In other words, existing software that analyze river behavior focus solely on measuring their physical and chemical properties to understand their characteristics and the potential effects they can have if they flood and affect a region. It does not include a humanitarian logistics plan that proposes the number of provisions and their supply for a given number of people within a shelter. This synergy between a river behavior analysis model and a humanitarian logistics model is feasible because, although both are independent systems, they co-occur over time. As the volumetric flow of the river increases, the humanitarian logistics containment plan simultaneously goes into effect. Therefore, the SD methodology through Stella © is the best approach to integrate both systems. Hence, the time variable allows for unifying many systems with diverse variables into a single system with more components and greater dynamism.
This simulation model has another important advantage: the flexibility to evaluate past events, such as the case study presented in this framework, analyzing real-time data, or experiment with hypothetical data to gather information on non-historical scenarios. This advantage is of great interest to countries with emerging economies, such as Mexico. Significant technological delays exist in various lines of research due to a lack of data or resources. For this reason, in 2012 and 2013, when the events described in this framework occurred, the Orizaba region did not have an adequate strategy to address climate events of this magnitude. However, the simulation model’s results will positively impact urban planning and the development of more detailed emergency containment plans. The flexibility of the simulation model, which displays different scenarios depending on the initially programmed variables, allows for decision-making to address an emergency with the current infrastructure. However, the model can include more variables to explore hypothetical scenarios, such as the construction of more shelters, the placement of supply distribution centers to meet demand, the construction of dikes to reduce velocity, and excavation to increase the depth of the river within the city to contain the impact.
Due to climate change in various parts of the world, these simulation models are becoming increasingly relevant, as monitoring enables timely decision-making. Furthermore, the concept of unifying the dynamic analysis of river flow increases and the containment strategies of a humanitarian logistics plan addressed in this framework can contribute to analyzing the behavior of other rapid-response catchments in other regions or countries.
The simulation model presented in this framework is pioneering because it encompasses the two systems described, thus representing an opportunity for further development. Some recommendations for future work are the following:
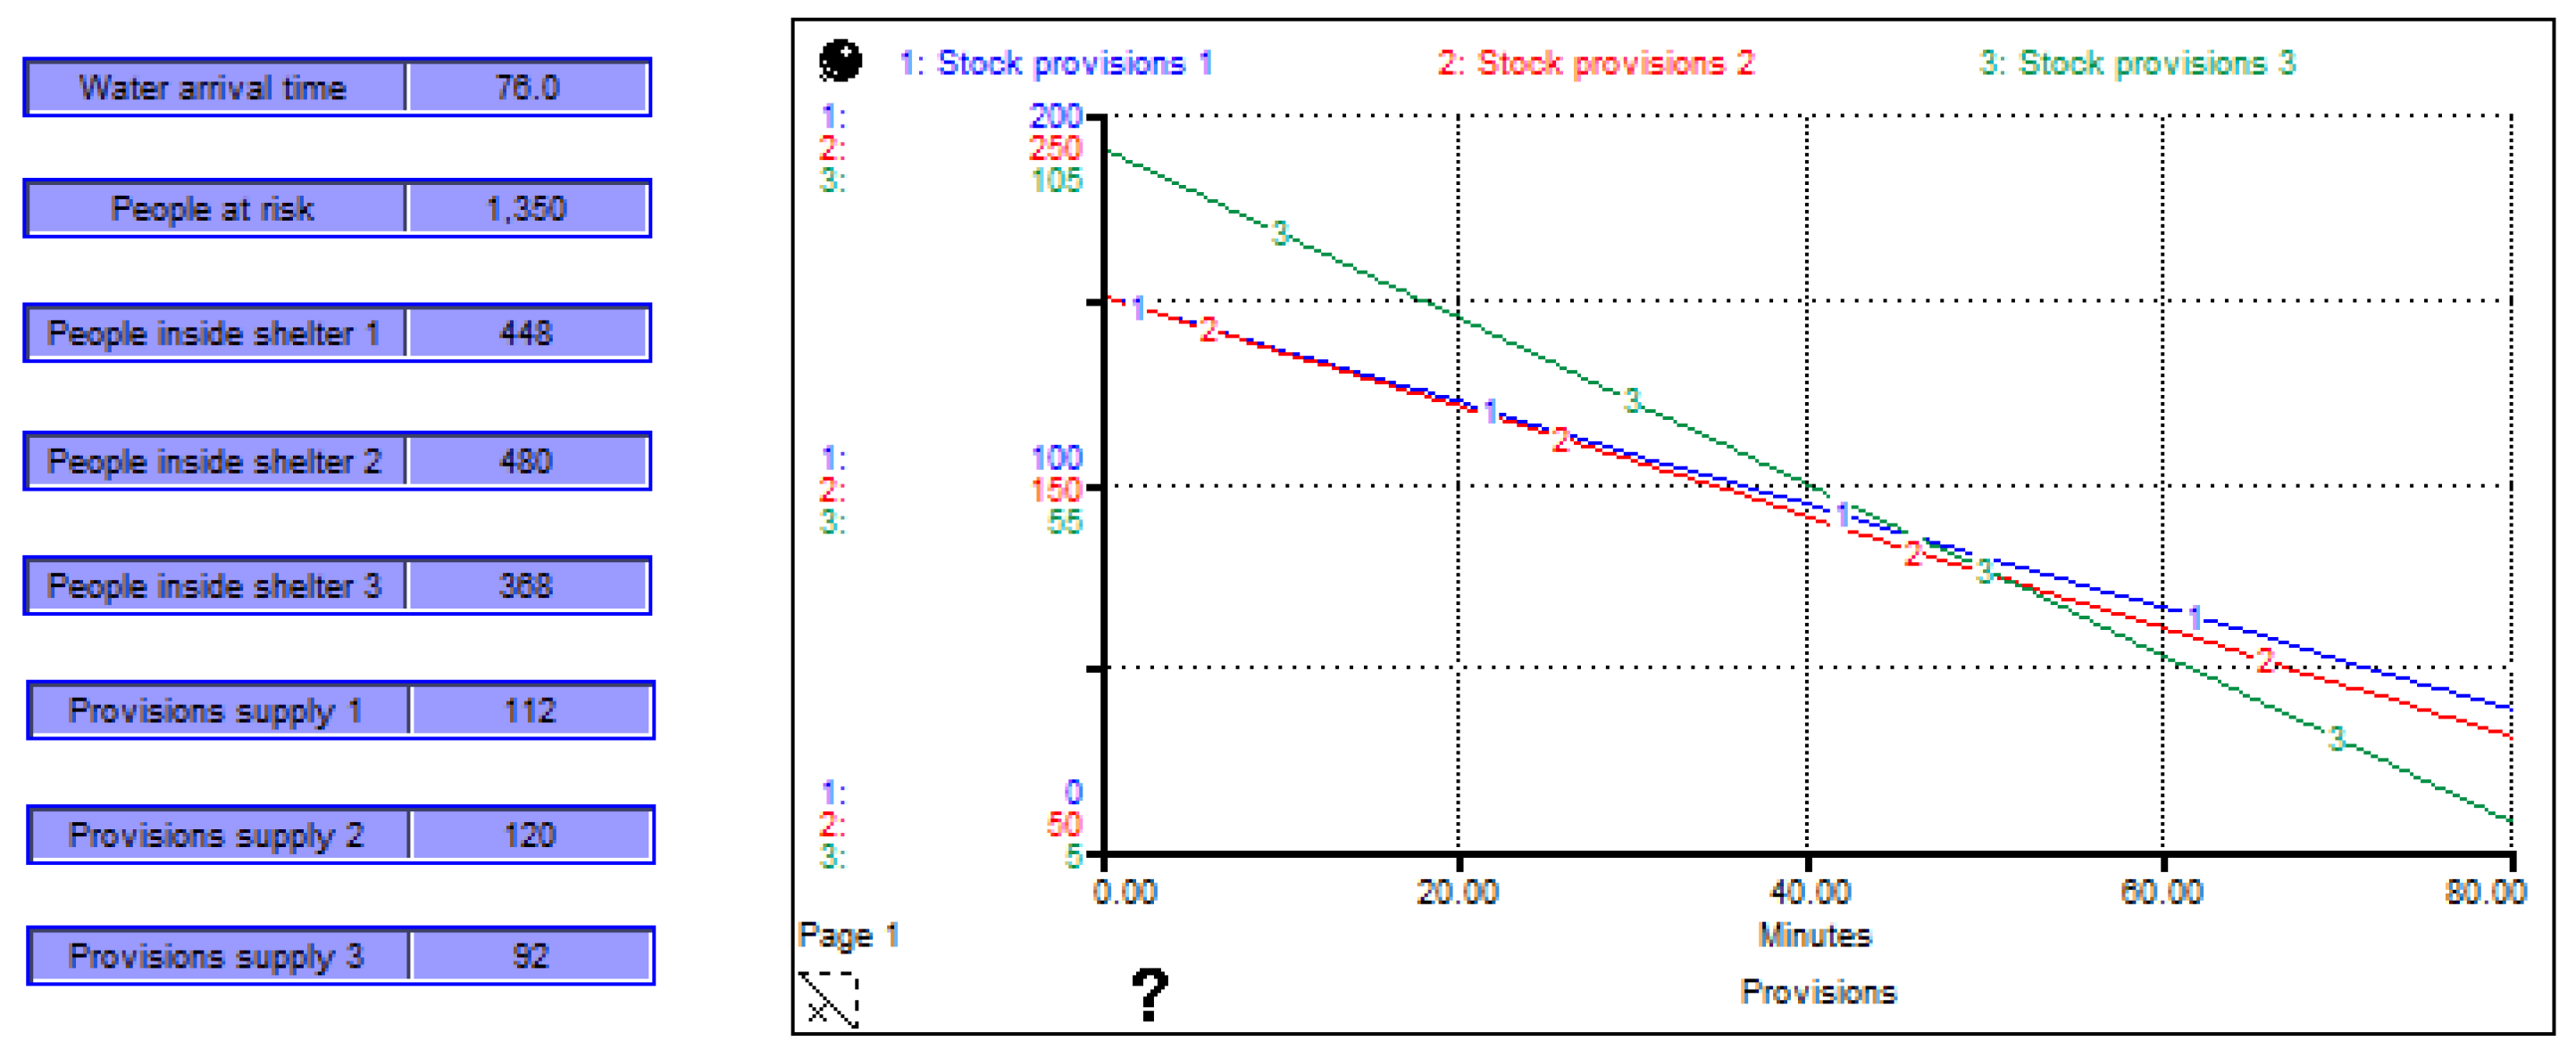
- Incorporation of more variables. The simulation model considers the most important variables for analyzing river flow and preparing the humanitarian logistics plan. However, the software review shown in Table 1 shows that there are many physical and chemical variables involved in fluid mechanics. Furthermore, the humanitarian logistics model presented generally considers the contents of supplies but not the specific type and quantity of food that meets the 2000 kcal requirement, representing an improvement over the simulation model. The model presented assumes that the shelter has sufficient capacity to serve 100% of the affected population since the number of victims is less than 600. However, there is a possibility that the shelter will not be able to meet the needs, and a second or third shelter will need to be built in areas near the Orizaba River. This framework presents an interface for the simulation process, assuming that Orizaba City has only one shelter. Mexico is an emerging economy, and the financial resources to invest in the construction of multiple shelters are limited. However, emergencies often exceed initial expectations, and climate change causes more frequent and destructive flooding. For this reason, additional shelters will likely need to be built in the short to medium term. In the hypothetical case of having more shelters in Orizaba City, or applying this simulation model to another region, the interface would have some modifications. Figure 11 shows the hypothetical case of an emergency where the number of people at risk exceeds the capacity of the current shelter in Orizaba City (1350 victims) and the city’s infrastructure has three shelters.
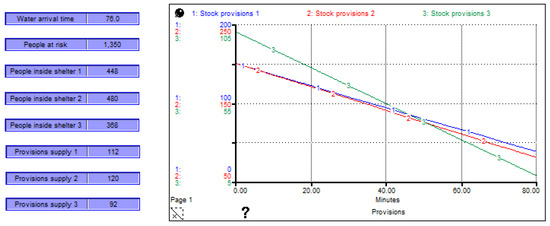 Figure 11. Multiple shelters.
- Figure 11 shows the distribution of victims in the three shelters. The capacity of each shelter is 600, 800, and 400 people, respectively. The graph shows a similar behavior to Figure 9 on stock provisions, and the numeric displays show the number of people in each shelter as well as the number of provision supplies needed to care for victims during the emergency.
- Involve artificial intelligence technologies. In recent years, the inclusion of artificial intelligence technologies in various areas of knowledge has grown significantly. Including these technologies allows for exploring complex scenarios that traditional tools’ algorithms cannot easily address. Incorporating Data Science would be a beneficial contribution because this tool allows large volumes of data to be processed in real-time. The main advantage of this is the direct monitoring of current system conditions, resulting in a faster decision-making process and, consequently, a reduction in the time required to prepare for an emergency, as established in this framework (one hour). On the other hand, a challenge faced by this framework is using existing historical data to create the simulation model, as this factor could limit the accuracy of the simulation results due to increasingly unpredictable weather patterns. To overcome this limitation, it is recommended that climate prediction models based on artificial intelligence be incorporated, such as recurrent neural networks (RNNs), specifically the LSTM (long short-term memory) type. These architectures are effective in analyzing nonlinear and nonstationary time series and have been effective in analyzing meteorological phenomena [56,57]. Its main strength is that this technique is trained with historical and real-time data and incorporates highly variable variables that are difficult to predict with traditional techniques, such as accumulated precipitation, temperature, relative humidity, and atmospheric pressure. LSTM networks can anticipate extreme rainfall events anticipating possible flooding. The output data can be incorporated into the simulation, providing more accurate, adaptive, and up-to-date weather forecasts, resulting in the use of real-time data and improving the ability to anticipate and respond to sudden events. Furthermore, incorporating LSTM networks provides another benefit: the ability to adapt this model to other regions of the world. While the case study for this framework focuses on the Orizaba region, the integration of artificial intelligence allows the model to be replicated in other regions of the world with different and rapidly changing climatic conditions.
- Inclusion of forecast models for weather prediction. The root cause that underpins this framework is closely related to the water cycle because the growth of the river flow depends directly on rainfall. The water cycle is a complex and changing system, so it is difficult to model. However, this process is facilitated by focusing on a particular region if historical data allow for the analysis of weather behavior. Including climate data from climate forecast models in the simulation model is an opportunity to improve the precision of the results. This addition of data would impact the CLD, specifically loops R1, B1, B2, and B3 (Figure 3).
- Add other techniques. A simulation model is not considered an optimization model because it numerically analyzes various scenarios but does not analytically determine the best of them. Some techniques focused on optimization indirectly complement the simulation model. The swarm intelligent clustering algorithm is a technique for grouping a set of objects and for problems of locating distribution centers. Implementing this algorithm helps to establish additional shelters in the event of population growth in the coming years or in an emergency that exceeds the current capacity of existing shelters. In addition, some classic Operations Research techniques, such as the p-median algorithm, help minimize costs or distances in humanitarian logistics.
5. Conclusions
The simulation model presented in this framework is a pioneer in linking a dynamic simulation model that monitors the growth of a rapid-response catchment and a humanitarian logistics model. The main compatibility between these two models is that they run simultaneously, and their main advantage is the analysis of results through an interface that displays the behavior of variables using graphs and numerical displays, facilitating decision-making. The importance of creating these simulation models lies in analyzing the consequences of emergencies such as those shown in the case study. In emerging economies such as Mexico, timely planning is crucial because many people lack the resources to cope with and recover from natural disasters. The Orizaba region has a current emergency response guideline [58]. However, this document contains limited information. For this reason, the simulation model proposed in this framework represents an opportunity to explore scenarios and strengthen this document. The Systems Dynamics approach is beneficial for modeling complex systems; however, implementing the models created requires the joint participation of the government, the Civil Protection Department, researchers, and the public to achieve successful results. Furthermore, continuously updating values, adding variables, and incorporating other auxiliary techniques will contribute to better decision-making.
Author Contributions
The tasks in this research are divided among the authors as follows: conceptualization, J.D.-M. and G.C.-R.; methodology, G.C.-R.; software, J.D.-M.; validation, L.R.G.-N., J.E.D.-H. and R.A.-J.; formal analysis, G.C.-R.; investigation, J.D.-M.; resources, E.D.-A.; data curation, J.R.G.-R.; writing—original draft preparation, L.R.G.-N.; writing—review and editing, J.E.D.-H.; visualization, R.A.-J.; supervision, J.R.G.-R.; project administration, J.D.-M.; funding acquisition, G.C.-R. All authors have read and agreed to the published version of the manuscript.
Funding
This research was funded by The Secretary of Science, Humanities, Technology and Innovation (SECIHTI) through postdoctoral grant BP-PA-20230425211421138-4500112 (CVU/grant holder 508703).
Institutional Review Board Statement
Not applicable.
Informed Consent Statement
Not applicable.
Data Availability Statement
All data are available upon request.
Acknowledgments
We appreciate support from the Secretariat of Public Education (SEP) through the Tecnológico Nacional de México—Instituto Tecnológico de Orizaba, who sponsored this work. In addition, we thank the Mountaineering and Exploration Institute of the State of Veracruz, Civil Association, for their advice and data validation.
Conflicts of Interest
The authors declare no conflicts of interest. The funders had no role in the design of the study; in the collection, analyses, or interpretation of data; in the writing of the manuscript, or in the decision to publish the results.
References
- Wang, M.; Jiang, S.; Ren, L.; Xu, C.-Y.; Menzel, L.; Yuan, F.; Xu, Q.; Liu, Y.; Yang, X. Separating the effects of climate change and human activities on drought propagation via a natural and human-impacted catchment comparison method. J. Hydrol. 2021, 603, 126913. [Google Scholar] [CrossRef]
- Liu, X.; Wang, Y. Quantifying impacts of precipitation scenarios projected under climate change on annual probability of rainfall-induced landslides at a specific slope. Comput. Geotech. 2024, 167, 106063. [Google Scholar] [CrossRef]
- Khazaei, M.R. Projected changes to drought characteristics in Tehran under CMIP6 SSP-RCP climate change scenarios. Heliyon 2025, 11, e41811. [Google Scholar] [CrossRef] [PubMed]
- Castellazzi, G.; Previtali, M. A Multi-Criteria GIS-Based Approach for Risk Assessment of Slope Instability Driven by Glacier Melting in the Alpine Area. Appl. Sci. 2024, 14, 11524. [Google Scholar] [CrossRef]
- Stone, M.S.; Doran, P.T.; Myers, K.F. Rethinking the Lake History of Taylor Valley, Antarctica During the Ross Sea I Glaciation. Geosciences 2025, 15, 9. [Google Scholar] [CrossRef]
- Remond-Noa, R.; Torres-Reyes, A.; Matos-Pupo, F.; Echarri-Chávez, M.; Bouta-Numbo, A.; Crespo-García, L.; Gómez-Martín, M.B. The Location of Hotels and Their Exposure to Hurricanes in Cuba—Implication for Tourism Development in the Context of Climate Change. Atmosphere 2024, 16, 24. [Google Scholar] [CrossRef]
- Lopes, H.S.; Nascimento, D.T.F. The vulnerability of tourism to climate change in Portuguese and Brazilian cities—A review. Proceedings 2025, 113, 4. [Google Scholar] [CrossRef]
- Ju, S.-D.; Choi, W.-J.; Song, H.-J. Critical Role of Area Weighting on Estimated Long-Term Global Warming and Heat Wave Trends. AppliedMath 2024, 4, 1618–1628. [Google Scholar] [CrossRef]
- Guo, Q.; Chen, Y.; Miao, X.; Hao, Y. The Response of Cloud Precipitation Efficiency to Warming in a Rainfall Corridor Simulated by WRF. Atmosphere 2024, 15, 1381. [Google Scholar] [CrossRef]
- Arellano, B.; Zheng, Q.; Roca, J. Analysis of Climate Change Effects on Precipitation and Temperature Trends in Spain. Land 2025, 14, 85. [Google Scholar] [CrossRef]
- Vinod, D.; Mahesha, A. Modeling non-stationary 1-hour extreme rainfall for Indian river basins under changing climate. J. Hydrol. 2025, 652, 132669. [Google Scholar] [CrossRef]
- The Flood Hub. Available online: https://thefloodhub.co.uk/rapid-response-catchments/ (accessed on 17 January 2025).
- Pour, M.A.; Zare, N.; Maknoon, R. Urban flood resilience assessment & stormwater management (case study: District 6 of Tehran). Int. J. Disaster Risk Reduct. 2024, 102, 104280. [Google Scholar] [CrossRef]
- Ma, Q.; Wang, W.; Leng, R.; Deveci, M.; Liu, R.; Delen, D. The impact of natural disasters on agricultural credit Risk: A theoretical model and empirical test. Comput. Ind. Eng. 2025, 200, 110846. [Google Scholar] [CrossRef]
- Zhang, Y.; Chen, W.; Huang, B.; Zhang, Z.; Li, J.; Gao, R.; Wang, K.; Hu, C. An event logic graph for geographic environment observation planning in disaster chain monitoring. Int. J. Appl. Earth Obs. Geoinf. 2024, 134, 104220. [Google Scholar] [CrossRef]
- Benito, O.P.; Ahmed, N.I.; Prasetyo, Y.T.; Cahigas, M.M.L.; Nadlifatin, R. Factors Affecting the Drought Preparedness in Somaliland. Sustainability 2025, 17, 668. [Google Scholar] [CrossRef]
- Naderi, A.; Benis, K.Z.; Dowlati, M.; Seyedin, H.; Behnami, A.; Farzadkia, M. Identifying methods and challenges of waste management in natural disasters. J. Environ. Manag. 2024, 373, 123514. [Google Scholar] [CrossRef]
- Aslantas, B.; Maleska, V.; Alvarez, L.V.; Babalola, S.O. Flood risk assessment for Mulde River Catchment transferring data from an observed meteorological flood event. Results Eng. 2024, 24, 103029. [Google Scholar] [CrossRef]
- Sukumaran, S.T.; Birkinshaw, S.J. Investigating the Impact of Recent and Future Urbanization on Flooding in an Indian River Catchment. Sustainability 2024, 16, 5652. [Google Scholar] [CrossRef]
- Agbiji, N.M.; Agunwamba, J.C.; Eshiet, K.I.-I.I. Trend Analysis of Climatic Variables in the Cross River Basin, Nigeria. Geosciences 2024, 14, 172. [Google Scholar] [CrossRef]
- Goldberg, S.L.; Schmidt, M.J.; Perron, J.T. Fast Response of Amazon Rivers to Quaternary Climate Cycles. J. Geophys. Res. Earth Surf. 2021, 126, e2021JF006416. [Google Scholar] [CrossRef]
- Jawad, M.; Bhattacharya, B.; Young, A.; Van Andel, S.J. Evaluation of Near Real-Time Global Precipitation Measurement (GPM) Precipitation Products for Hydrological Modelling and Flood Inundation Mapping of Sparsely Gauged Large Transboundary Basins—A Case Study of the Brahmaputra Basin. Remote Sens. 2024, 16, 1756. [Google Scholar] [CrossRef]
- Moya, H.; Althoff, I.; Celis-Diez, J.L.; Huenchuleo-Pedreros, C.; Reggiani, P. Impact of Future Climate Scenarios and Bias Correction Methods on the Achibueno River Basin. Water 2024, 16, 1138. [Google Scholar] [CrossRef]
- Pour, M.A.; Ghiasi, M.B.; Karkehabadi, A. Applying Machine Learning Tools for Urban Resilience Against Floods. arXiv 2024. [Google Scholar] [CrossRef]
- Moghisi, S.S.; Yazdi, J.; Neyshabouri, S.A.A.S. Multivariate Analysis of Rainfall Spatial Distribution and Its Effect on Stormwater Magnitudes. J. Hydrol. Eng. 2024, 29. [Google Scholar] [CrossRef]
- Delgado-Maciel, J.; Cortés-Robles, G.; Alor-Hernández, G.; Alcaráz, J.G.; Negny, S. A comparison between the Functional Analysis and the Causal-Loop Diagram to model inventive problems. Procedia CIRP 2018, 70, 259–264. [Google Scholar] [CrossRef]
- Delgado-Maciel, J.; Cortés-Robles, G.; Sánchez-Ramírez, C.; García-Alcaraz, J.; Méndez-Contreras, J.M. The evaluation of conceptual design through dynamic simulation: A proposal based on TRIZ and system Dynamics. Comput. Ind. Eng. 2020, 149, 106785. [Google Scholar] [CrossRef]
- Sinsuw, A.A.E.; Suriandjo, H.S.; Chu, C.-Y.; Sompie, O.B.; Sangkertadi, S.; Tumaliang, H.; Lefrandt, L.I.R.; Lai, C.M. Sustainable strategic policies for biohythane production technology and its dissemination in rural and small island communities using system dynamics. Int. J. Hydrog. Energy 2025, in press, corrected proof. [Google Scholar] [CrossRef]
- Forrester, J. Industrial Dynamics, 4th ed.; The Massachusetts Institute of Technology: Cambridge, MA, USA, 1965; pp. 13–14. [Google Scholar]
- Sterman, J.D. Business Dynamics: Systems Thinking and Modeling for a Complex World, 1st ed.; McGraw-Hill Education: New York, NY, USA, 2000; pp. 85–87. [Google Scholar]
- Sánchez, J.M.B.; Serrato, R.B. Design and Development of an Optimal Control Model in System Dynamics through State-Space Representation. Appl. Sci. 2023, 13, 7154. [Google Scholar] [CrossRef]
- Sánchez, J.M.B.; Serrato, R.B.; Bianchetti, M. Design and Development of a Mathematical Model for an Industrial Process, in a System Dynamics Environment. Appl. Sci. 2022, 12, 9855. [Google Scholar] [CrossRef]
- Nyam, Y.S.; Kotir, J.H.; Jordaan, A.J.; Ogundeji, A.A.; Adetoro, A.A.; Orimoloye, I.R. Towards Understanding and Sustaining Natural Resource Systems through the Systems Perspective: A Systematic Evaluation. Sustainability 2020, 12, 9871. [Google Scholar] [CrossRef]
- Lagarda-Leyva, E.A. System Dynamics and Lean Approach: Development of a Technological Solution in a Regional Product Packaging Company. Appl. Sci. 2021, 11, 7938. [Google Scholar] [CrossRef]
- Andruetto, C.; Stenemo, E.; Pernestål, A. Towards sustainable urban logistics: Exploring the implementation of city hubs through system dynamics. Transp. Res. Interdiscip. Perspect. 2024, 27, 101204. [Google Scholar] [CrossRef]
- Lock, R.; Benavente, Y.; Gatica, G.; Olivares, P.; Ramirez, J.; Gonzalez-Holgado, A. Modeling hospital logistics capacity through system dynamics during the COVID-19 pandemic: Case of Pasco Healthcare Network in Peru. Procedia Comput. Sci. 2024, 238, 1042–1047. [Google Scholar] [CrossRef]
- Google Earth. Available online: https://earth.google.com/web/ (accessed on 14 February 2025).
- Tourian, M.J.; Elmi, O.; Mohammadnejad, A.; Sneeuw, N. Estimating River Depth from SWOT-Type Observables Obtained by Satellite Altimetry and Imagery. Water 2017, 9, 753. [Google Scholar] [CrossRef]
- Toland, J.C.; Wein, A.M.; Wu, A.-M.; Spearing, L.A. A conceptual framework for estimation of initial emergency food and water resource requirements in disasters. Int. J. Disaster Risk Reduct. 2023, 90, 103661. [Google Scholar] [CrossRef]
- Colorado State University—Extension. Available online: https://extension.colostate.edu/ (accessed on 24 February 2025).
- Thomas, J.A.; Mora, K. Community resilience, latent resources and resource scarcity after an earthquake: Is society really three meals away from anarchy? Nat. Hazards 2014, 74, 477–490. [Google Scholar] [CrossRef]
- American Red Cross. Available online: https://www.redcross.org/ (accessed on 27 February 2025).
- The National Water Commission in Mexico. Available online: https://www.gob.mx/conagua/acciones-y-programas/veracruz-74779 (accessed on 10 March 2025).
- Hannah, D.M.; Smith, P.G.; Gurnell, A.M.; McGregor, G.R. An approach to hydrograph classification. Hydrol. Process. 2000, 14, 317–338. [Google Scholar] [CrossRef]
- Nash, J.E. Systematic determination of unit hydrograph parameters. J. Geophys. Res. Atmos. 1959, 64, 111–115. [Google Scholar] [CrossRef]
- Khan, M.; Jaber, M.; Guiffrida, A.; Zolfaghari, S. A review of the extensions of a modified EOQ model for imperfect quality items. Int. J. Prod. Econ. 2011, 132, 1–12. [Google Scholar] [CrossRef]
- Law, A.M. Simulation Modeling and Analysis, 5th ed.; McGraw Hill Higher Education: New York, NY, USA, 2015; pp. 560–561. [Google Scholar]
- SIATL v4 Software ©. Available online: https://antares.inegi.org.mx/analisis/red_hidro/siatl/ (accessed on 9 March 2025).
- Barlas, Y. Credibility, Validity and Testing of Dynamic Simulation Models. In Proceedings of the International Conference on Simulation and Modeling Methodologies, Technologies and Applications, Madrid, Spain, 29 July 2017. [Google Scholar] [CrossRef]
- World Rivers. Available online: https://worldrivers.net/2020/03/28/how-fast-are-rivers/ (accessed on 14 March 2025).
- Orizaba en Red. Available online: http://www.orizabaenred.com.mx/cgi-bin/web2?p=orizabaenred&b=VERNOTICIA&%7Bnum%7D=98919 (accessed on 16 March 2025).
- Al Calor Politico. Available online: https://www.alcalorpolitico.com/informacion/inundaciones-de-hasta-1-metro-de-profundidad-en-orizaba-deja-ernesto--98146.html (accessed on 17 March 2025).
- El Economista. Available online: https://www.efinf.com/clipviewer/files/0490ee001dc6a2d66456963daa5b44ea.pdf (accessed on 17 March 2025).
- Agencia de Noticias Rtv. Available online: https://www.masnoticias.mx/rio-orizaba-arraso-con-todo-a-su-paso/ (accessed on 18 March 2025).
- Enlace Veracruz. Available online: https://www.enlaceveracruz212.com.mx/noticias-veracruz/pico-de-orizaba/49432/devasta-rio-orizaba-a-zoologico-por-segunda-vez.html?id=49432 (accessed on 18 March 2025).
- Kratzert, F.; Klotz, D.; Brenner, C.; Schulz, K.; Herrnegger, M. Rainfall–runoff modelling using Long Short-Term Memory (LSTM) networks. Hydrol. Earth Syst. Sci. 2018, 22, 6005–6022. [Google Scholar] [CrossRef]
- Zhu, Q.; Qin, X.; Zhou, D.; Yang, T.; Song, X. Impacts of spatiotemporal resolutions of precipitation on flood event simulation based on multimodel structures—A case study over the Xiang River basin in China. Hydrol. Earth Syst. Sci. 2024, 28, 1665–1686. [Google Scholar] [CrossRef]
- Recomendaciones y Medidas de Proteccion Civil. Available online: https://www.veracruz.gob.mx/proteccioncivil/wp-content/uploads/sites/5/2024/05/Prog-Especial-TLLyCT-2024.pdf (accessed on 9 May 2025).


Disclaimer/Publisher’s Note: The statements, opinions and data contained in all publications are solely those of the individual author(s) and contributor(s) and not of MDPI and/or the editor(s). MDPI and/or the editor(s) disclaim responsibility for any injury to people or property resulting from any ideas, methods, instructions or products referred to in the content. |
© 2025 by the authors. Licensee MDPI, Basel, Switzerland. This article is an open access article distributed under the terms and conditions of the Creative Commons Attribution (CC BY) license (https://creativecommons.org/licenses/by/4.0/).