Abstract
This study investigates disparities in upper limb motor skills between children with and without Attention Deficit Hyperactivity Disorder (ADHD), employing one-dimensional (1D) and two-dimensional (2D) point-and-click experiments using a mouse and a joystick and introducing one new metric for mouse cursor trajectory analysis. The participant pool comprised 46 children with combined type ADHD and an equivalent number of children without ADHD. The Input Device Evaluation Application (IDEA) system monitored the mouse pointer’s trajectory. Ten trajectory parameters were computed, including Index of Difficulty, Movement Time, Throughput, Missed Clicks, Target Re-Entry, Task Axis Crossing, Movement Direction Change, Movement Variability, Movement Error, Movement Offset, and Sample Entropy. The 2D joystick experiment trajectory parameters analysis conducted using a hierarchical logistic regression model achieved a 78% success rate in identifying children with ADHD. This research sheds light on the motor skill differences associated with ADHD in the context of computer-based tasks, providing valuable insights into potential diagnostic applications and intervention strategies and introducing one new metric makes for a deeper cursor trajectory analysis.
1. Introduction
Attention Deficit Hyperactivity Disorder (ADHD) has been introduced in the medical literature with the revised third version of the American Psychiatric Association’s “Diagnostic and Statistical Manual of Mental Disorders” (DSM-III-R, 1987) [1]. It is a common behavioral neurodevelopmental disorder associated with childhood and adolescence. It is characterized by age-inappropriate carelessness, hyperactivity, and impulsivity [2,3].
ADHD occurs in 5–7% of the student population, with a ratio usually 3:1 in favor of males. Researchers, however, believe that the incidence is about the same in both sexes, with the difference that females are often less hyperactive and better manage their disorder [3]. Children with ADHD usually see a specialized healthcare provider between the ages of 3 and 7. The recognition of the symptoms coincides, in most cases, with the beginning of school due to the increased requirements for concentration, organization, and compliance with rules [4].
With the fourth version of DSM (DSM-IV, 1994), three types of ADHD were defined as follows [5]:
- Predominantly Inattentive type ADHD (ADHD-PI): Children with this type of ADHD have difficulty concentrating and following instructions. They seem to not listen, ignore details, avoid activities that require systematic spiritual effort, and are disorganized;
- Predominantly Hyperactive–Impulsive type ADHD (ADHD-PHI): Hyperactive children move or talk constantly. They feel intense anxiety and do multiple tasks at the same time. Impulsive children have difficulty controlling their immediate reactions or thinking before doing something. They express and act without calculating the consequences of their behavior;
- Combined type ADHD (ADHD-C): In this type, the main symptoms of ADHD are the behavioral deficits in the executive functions, mainly in inhibitory control and working memory, as well as the delay aversion, i.e., the behavioral tendency of these individuals to show a preference for smaller-immediate over larger-delayed rewards (choice impulsivity) [6,7]. Deficits in executive functions and delay aversion are two distinct early (preschool) neurodevelopmental characteristics in individuals with this type of ADHD [8,9]. Combined ADHD affects cognitive, family, social, emotional, behavioral, and academic behavior. We had children with this type of ADHD in our study.
The recent release of the DSM’s fifth edition (DSM-5, 2013) [10] is the latest update to ADHD nosology, and the “types” are now referred to as “presentations”. Later, modifiers were added so that the severity of the disorder (i.e., mild, moderate, or severe) could be specified, and the disorder could be coded as “in partial remission” if full diagnostic criteria were not currently met [11].
ADHD can coexist in people of any level of intelligence, with various psychopathologies and psychosocial statuses. It does not indicate intellectual disabilities or limited intelligence, laziness or lack of motivation, intentional misbehavior, or complete absence of the ability to focus [5]. Although the scientific community has not been able to pinpoint specific factors responsible for the disorder, increasing evidence is emerging that suggests neurological and hereditary factors as probable causes of ADHD [10].
Children with ADHD face fine and gross motor control difficulties [12,13]. Furthermore, compared to typically developing children, children with ADHD present increased motor variability in temporal [14] and spatial [15,16] domains of assessment. Children with ADHD also struggle with tasks demanding manual dexterity and bimanual coordination [17]. Furthermore, children with ADHD also obtain lower scores during dominant, non-dominant, and bimanual Purdue pegboard (PPB) tasks than non-ADHD controls [14]. Mokobane et al. [13] conclude that difficulties in fine motor skills are prevalent in children with ADHD, particularly in ADHD-PI and ADHD-C. Problems are encountered in distal, complex, and speeded tasks. This effect may lead to poor handwriting and academic performance.
We will present our experiments using the Input Device Evaluation Application (IDEA) system to assess children’s hand dexterity and compare the results of children with ADHD and those without ADHD. We initially designed the IDEA system [18] at the Speech and Accessibility Laboratory, National and Kapodistrian University of Athens (NKUA), to implement one- and two-dimensional point-and-click experiments and the corresponding measurement protocols for research purposes. Our initial goal was to evaluate users’ performance using various computer input devices for GUI interaction [19,20,21]. The IDEA system can assess any input device that emulates a computer mouse functionality, i.e., mouse pointer movement and target selection on a computer screen. We initially designed IDEA following ISO 9241-9:2000—“Ergonomic requirements for office work with visual display terminals (VDTs)—Part 9: Requirements for non-keyboard input devices” [22]. The IDEA system determines how an input device’s operation complies with Fitts’s law [23,24,25,26] and performs a detailed analysis of point-and-click tasks. It tracks and analyzes the mouse pointer trajectory on a computer screen in detail, using pixel coordinates as raw data. The calculated trajectory parameters quantify the mouse pointer movement and contribute to evaluating the user’s performance [23,24,25,26,27,28].
Our first experiment with the IDEA system (2001) aimed to compare a Brain–Computer Interface (BCI) input device to a mouse on point-and-click tasks performed by non-disabled and upper limb motion-impaired users [18]. Fitts’s law could only describe the performance of non-disabled users when selecting targets with a mouse, and BCI performance was significantly lower than mouse performance in both user groups. In 2010, we expanded the IDEA system’s functionality to three-dimensional (3D) tasks and introduced new trajectory parameters, an improved user interface, and improved accuracy. Our research team assessed 3D pointing devices, specifically the Wiimote [20] and Kinect [21], and found that Kinect performed better in 3D tasks. We continued to evaluate users with early-stage Multiple Sclerosis compared to control users in typical point-and-click tasks with a mouse [29,30]. In [30], we improved the IDEA system’s versatility and validity, complying with the more recent ISO/TS 9241-411:2012 “Ergonomics of human-system interaction—Part 411: Evaluation methods for the design of physical input devices” [31]. The statistical analysis of the results predicted the presence of the disease with a 70.9% success rate [30]. In our recent study [32], IDEA objectively distinguished control participants from children with Learning Disabilities using the upper limb kinematics tests, and the prediction success rate was 70%.
Both Multiple Sclerosis (MS) and Attention Deficit Hyperactivity Disorder (ADHD) share overlapping challenges, including cognitive deficits (e.g., difficulties with attention, planning, working memory, and slowed processing speed), motor impairments (e.g., fine motor skill issues and movement variability), and fatigue, albeit from differing underlying causes.
Today in our lab, the IDEA system objectively examines and compares mouse emulation input devices for motor-disabled people in the context of Human–Computer Interaction and Assistive Technology research. The IDEA system aids in discovering a device’s optimal settings for optimal user performance and tracks performance changes over time to research learning effects. The IDEA system is also utilized in Biomedical Informatics to assess patients’ upper extremity kinematic performance in motion-related disorders at an early stage.
A similar study by Leontyev [33] regarding mouse cursor motion measures on college students with ADHD makes use of the OpenSesame (version 0.24) software environment [34] with the plug-in “Mousetrap” for mouse cursor movement tracking [35]. The IDEA (Input Device Evaluation and Analysis) system and Mousetrap represent two distinct approaches to assessing the human–computer interaction, particularly in cursor movement and input device evaluation. While both share the overarching goal of analyzing user interactions with input devices, they differ significantly in their methodologies, applications, and the specific metrics they employ. Mousetrap, operating within the OpenSesame environment, offers functionalities such as data collection, trajectory recording, and various measures specific to cursor movements. These measures include position-related parameters like maximum and minimum positions, curvature measures, flips, and cursor dynamics. Notably, the framework emphasizes the importance of documenting mouse-tracking studies in detail, making it suitable for research that necessitates replication and comparison across different experiments. In a comparative context, IDEA and Mousetrap serve distinct purposes. IDEA is a versatile evaluation tool primarily used to assess the performance of input devices, including traditional computer mice, using a comprehensive set of metrics. Its applicability extends to various input methods and interfaces. In contrast, Mousetrap offers a toolkit to investigate cognitive processes by analyzing cursor movements during decision-making tasks rather than input device performance.
In our ongoing efforts toward the evolution of the IDEA system, we are adopting a new parameter known as Sample Entropy (SE) [36] in the current study. Sample Entropy is a powerful analytical tool for quantifying complexity, predictability, and regularity within time series data. SE is particularly adept at characterizing the structure and predictability of data, making it a valuable addition to our investigation into motor control and behavioral aspects.
The motivation for initiating this line of research was to explore the extent to which different medical conditions, particularly those known to impair fine motor skills, impact the kinetic abilities of affected individuals.
The current study’s goals are to (a) investigate systematic differences in upper limb motor skills between children with ADHD and children without ADHD using the IDEA system, enriched with Sample Entropy analysis, and (b) determine whether the IDEA system has the potential to become a tool for ADHD detection in addition to clinical examination. By introducing Sample Entropy into our IDEA system, we aim to enhance the precision and comprehensiveness of our findings, shedding new light on the relationship between motor control difficulties and ADHD in children.
2. Materials and Methods
2.1. Fitts’s Law and Trajectory Parameters
The IDEA system computes trajectory parameters of point-and-click tasks that have been thoroughly described in our previous research [30], according to Fitts’s Law [23,24] and the ISO/TS 9241-411:2012 [31].
Fitts’s law in point-and-click tasks predicts that the time required for a person to hit a target is related to the target distance divided by the target size. Therefore, the longer the distance and the smaller the target’s size, the longer it takes. In 1954, Fitts quantified the human rate of information processing in aimed movements using “bits per second” as units. He named the metric “Index of Performance” [24]; today, it is more commonly known as Throughput (TP) in bits/s. This metric was grounded on an information analogy, where the distance to the center of the target (D) is like a signal and the tolerance or width of the target (W) is like noise. The metric depends on the Index of Difficulty (ID, in bits). The method for calculating TP involves a division of means: dividing the Index of Difficulty ID (bits) by the mean MT (sec), calculated over a block of trials for a specific session: . The subscript in reflects a small but essential adjustment, which Fitts and Peterson endorsed in a follow-up paper in 1964 [23]: the “adjustment for accuracy” requires first computing the Effective Target Width () as where is the observed standard deviation within a participant’s selection coordinates over repeated trials with a particular condition. In practice, it captures what a user did rather than what they were asked to do. The adoption of We requires a similar adjustment to ID, yielding an Effective Index of Difficulty : .
The ISO/TS standard [31] specifies ergonomic design guidelines for input devices like mice, trackballs, touch screens, and light pens. It also specifies methods for evaluating input devices and includes instructions and layouts for designing experiments to assess the user’s speed and accuracy when pointing and clicking.
IDEA performs a detailed movement investigation using mouse pointer trajectory analysis. TP constitutes a human performance metric that incorporates both the speed and accuracy of the user responses. We have adopted the parameters proposed by McKenzie et al. [25] to analyze the mouse pointer’s trajectory. A detailed description and the formulas for calculating these parameters are given in [30]. The parameters used in this work are Index of Difficulty (ID), Movement Time (MT), Throughput (TP), Missed Clicks (MCL), Target Re-Entry (TRE), Task Axis Crossing (TAC), Movement Direction Change (MDC), Movement Variability (MV), Movement Error (ME), Movement Offset (MO), and Sample Entropy (SE), introduced in the current work (see Section 2.2). The IDEA system assesses the efficacy of any mouse-emulating input device, whether conventional (e.g., a mouse, a joystick) or non-conventional (e.g., a Brain–Computer Interface or a 3D game controller).
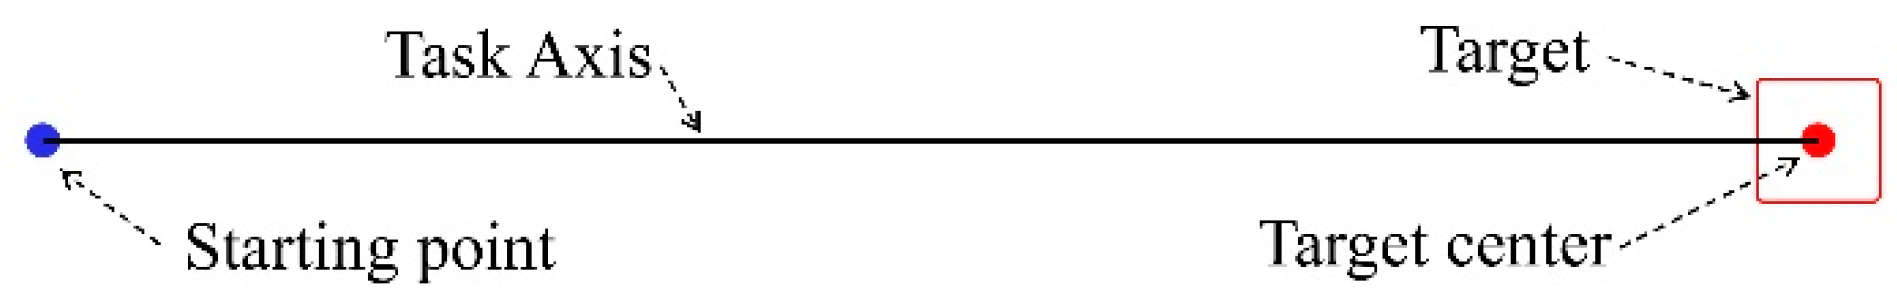
The IDEA system calculates all parameters over a defined set of user trials. In Figure 1, the starting point of a trial is the blue dot, and the center of the target is the red one. A “perfect” trial’s trajectory coincides with the “Task Axis” drawn as a black line. We define the Task Axis as the straight line connecting the starting point with the center of the target. The target area is marked as a red square.

Figure 1.
Task axis illustration.
The Index of Difficulty (ID) is defined as
where D and W are the targets’ distance and width, as shown in Figure 2.
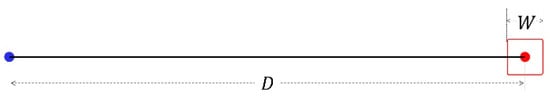
Figure 2.
Target distance and width.
The Movement Time (MT) is the time needed to select a target (in milliseconds), as follows:
where a and b are constants specified through linear regression.
Throughput (TP) is defined as
where
and
is the standard deviation observed in a participant’s selection coordinates. TP is measured in bits/sec.
Missed Clicks (MCL): A missed click occurs when the user fails to click the target and selects a point off-target instead. MCL is a pure number representing the times the user misses the target per trial. This happens twice in the trajectory shown in Figure 3 (green line), where the little blue dotted circles designate the wrongly clicked locations, as follows:
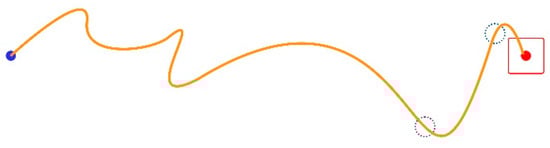
Figure 3.
Two missed clicks and one successful click.
When a trial session is complete, the average MCL per trial is registered. In a perfect trial, MCL = 0.
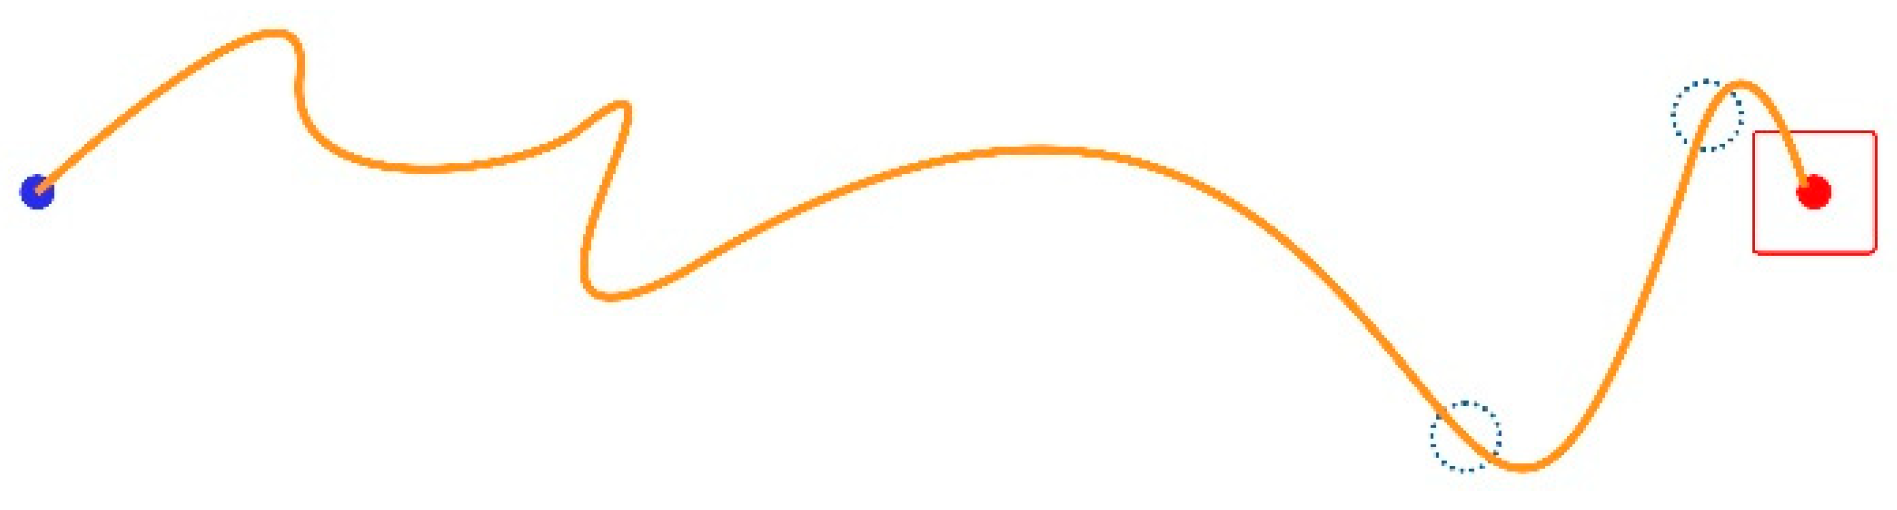
A Target Re-Entry (TRE) occurs when the mouse pointer enters the target area and exits without the user being able to click it, then enters the target again. In the example illustrated in Figure 4, this happens two times; dotted circles mark the locations of the two incidents.
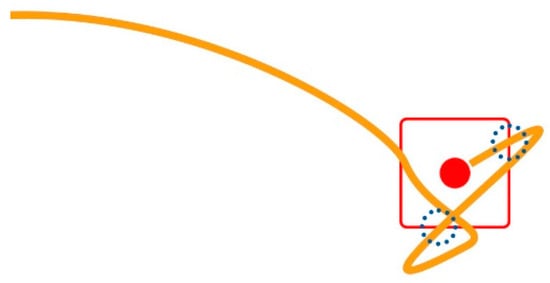
Figure 4.
Trajectory detail (magnified) at the target’s side, an example of two target re-entries.
In each trial, the system counts the TREs and registers the final number (average) of TRE incidents per trial at the end of the session. For instance, if three target re-entries exist in a 20-trial session, the TRE will be 0.15. In a perfect trial, TRE = 0.
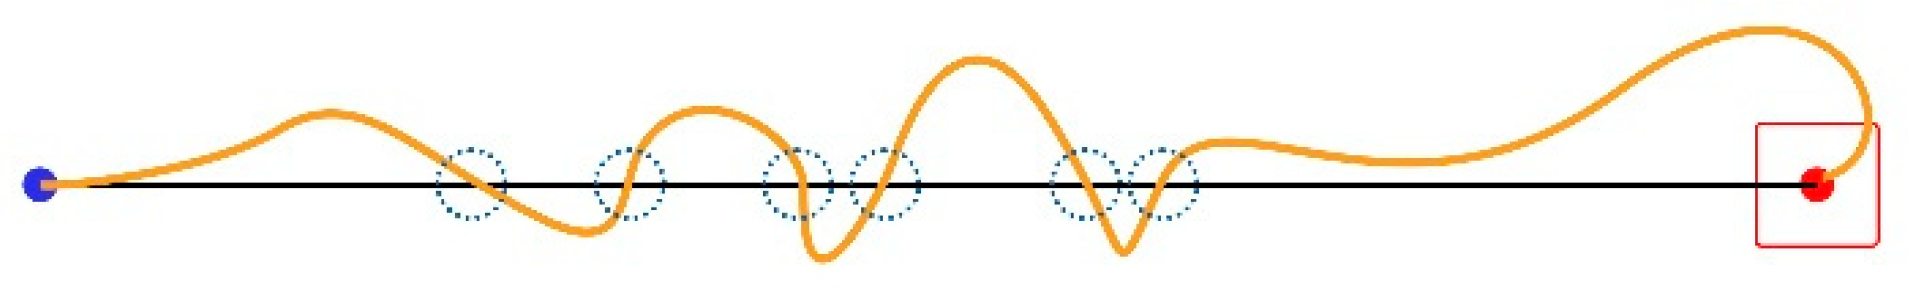
A Task Axis Crossing (TAC) occurs every time the mouse pointer crosses the Task Axis. Figure 5 illustrates an example of six incidents.
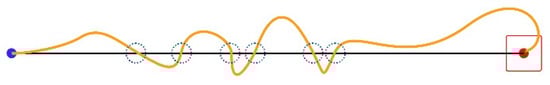
Figure 5.
Six TAC incidents.
We calculate TAC as an average score per trial for every session.
A Movement Direction Change (MDC) occurs when the mouse pointer’s path’s tangent is parallel to the Task Axis.
First, we calculate the difference (yi − yi+1) of all the (x, y) pixel coordinates’ samples; i ranges from 1 to n, where n is the total number of all the (x, y) samples taken for the current trial. Then, we multiply all the consecutive pairs of results (yi − yi+1) × (yi+1 − yi+2). The MDC value equals the number of times a sign swap appears in the products. For example, seven MDCs occur in the instance in Figure 6.
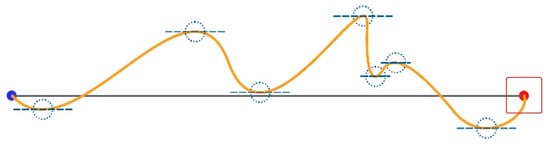
Figure 6.
Seven MDCs.
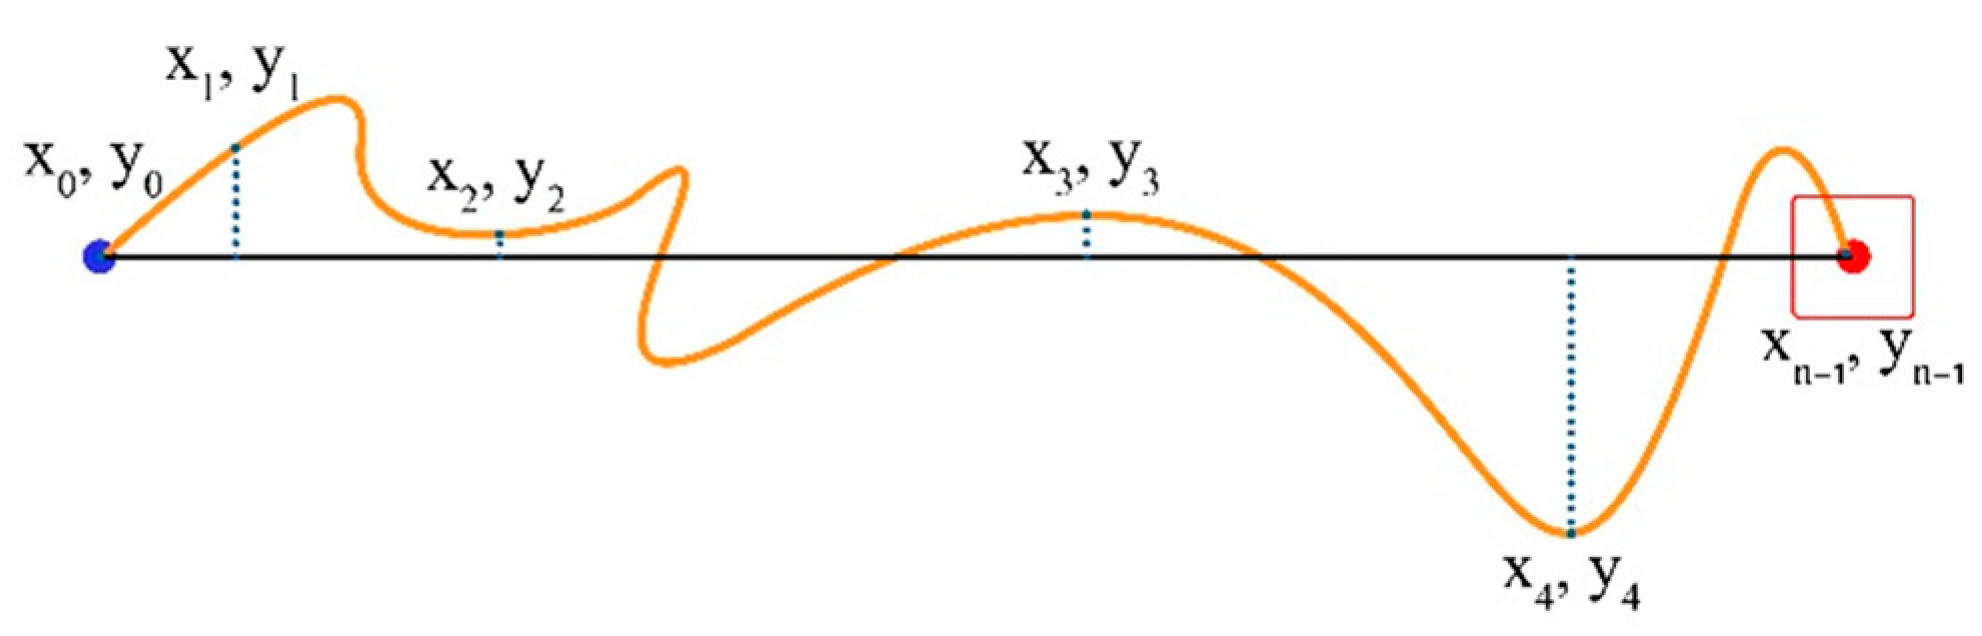
Movement Variability (MV) represents the degree to which sample points align along the task axis. We calculate the average distance of the path followed from the Task Axis for all sampled points of the trial (sampled points are x and y coordinates in pixels; see Figure 7).

Figure 7.
Coordinates of the start point, endpoint, and four additional random points in between.
If yi is the current cursor distance, and is the average distance, then MV is given by the formula, as follows:
where is the number of trajectory samples taken for the current trial and is the distance of each cursor position sample point from the Task Axis. on the Task Axis, positive above it and negative below it.
Movement Error (ME) is the mean absolute value per trial of the cursor path distance from the Task Axis.
This parameter accumulates absolute distances regardless of whether the cursor is above or below the Task Axis. In a perfect trial, MO = 0.
Movement Offset (MO): Calculates the total average distance of the cursor’s track from the Task Axis for every trial.
where is the distance of each sample point from the Task Axis. This parameter and ME differ because MO’s negative distances (below the Task Axis) compensate for positive ones.
2.2. New Metric: Sample Entropy
Sample Entropy (SE) is a quantitative metric to assess the degree of complexity, predictability, and regularity within time series data [37,38,39]. It offers insights into the underlying structure and repetitiveness of patterns present in the data, thus aiding in the characterization and understanding of temporal sequences.
Key Parameters: Embedding Dimension (m): SE begins by defining an embedding dimension, denoted as ‘m’. This parameter determines the length of subsequences for comparison. It signifies the number of data points considered in each similarity assessment.
Tolerance (r): The tolerance, or similarity criterion, is represented as ‘r’ and serves as a threshold for considering two subsequences as similar. It quantifies the maximum allowable difference between data points within these subsequences.
The Calculation Process: Construction of Vectors: SE constructs ‘m’ length vectors from the time series data. These vectors are generated by selecting consecutive data points from the time series. For example, in a time series represented as [x1, x2, x3, x4, …], vectors like [x1, x2, x3], [x2, x3, x4], and so forth, are created.
Pairwise Distance: It calculates the Euclidean distance for all pairs of vectors. This step involves quantifying the similarity of each vector with every other vector in the dataset. In other words, it measures the extent of resemblance or dissimilarity between these subsequences.
Counting Matching Pairs: SE identifies the number of pairs of vectors with a distance less than or equal to the specified tolerance ‘r’. These pairs are considered matching or similar, indicating instances where the data behave consistently within this tolerance range.
Probability of Similarity: The probability of similarity is computed for each vector by dividing the number of matching pairs by the total number of vector comparisons. It provides a statistical measure of the likelihood of observing similar patterns within the data.
Sample Entropy is determined as the negative natural logarithm of the average probability of similarity, and it is expressed as
In practical terms, a lower Sample Entropy value suggests a higher degree of regularity or predictability within the time series data. This implies that the data are likelier to exhibit consistent repetitive patterns. Conversely, higher Sample Entropy values indicate greater complexity or randomness in the data, signifying that the underlying patterns are less predictable.
2.3. The IDEA System Experiments
We used the IDEA system to conduct one-dimensional (1D) and two-dimensional (2D) point-and-click experiments using two devices, a mouse and a joystick; thus, our study included four (4) experiments in total. Participants used a standard Microsoft Wheel Mouse Optical with 400 dpi resolution, placed on a mouse pad on the desk, and a Traxsys Roller II Joystick. A 17-inch LCD monitor with a 1024 × 768 screen resolution was used for output at a viewing distance of 600 mm.
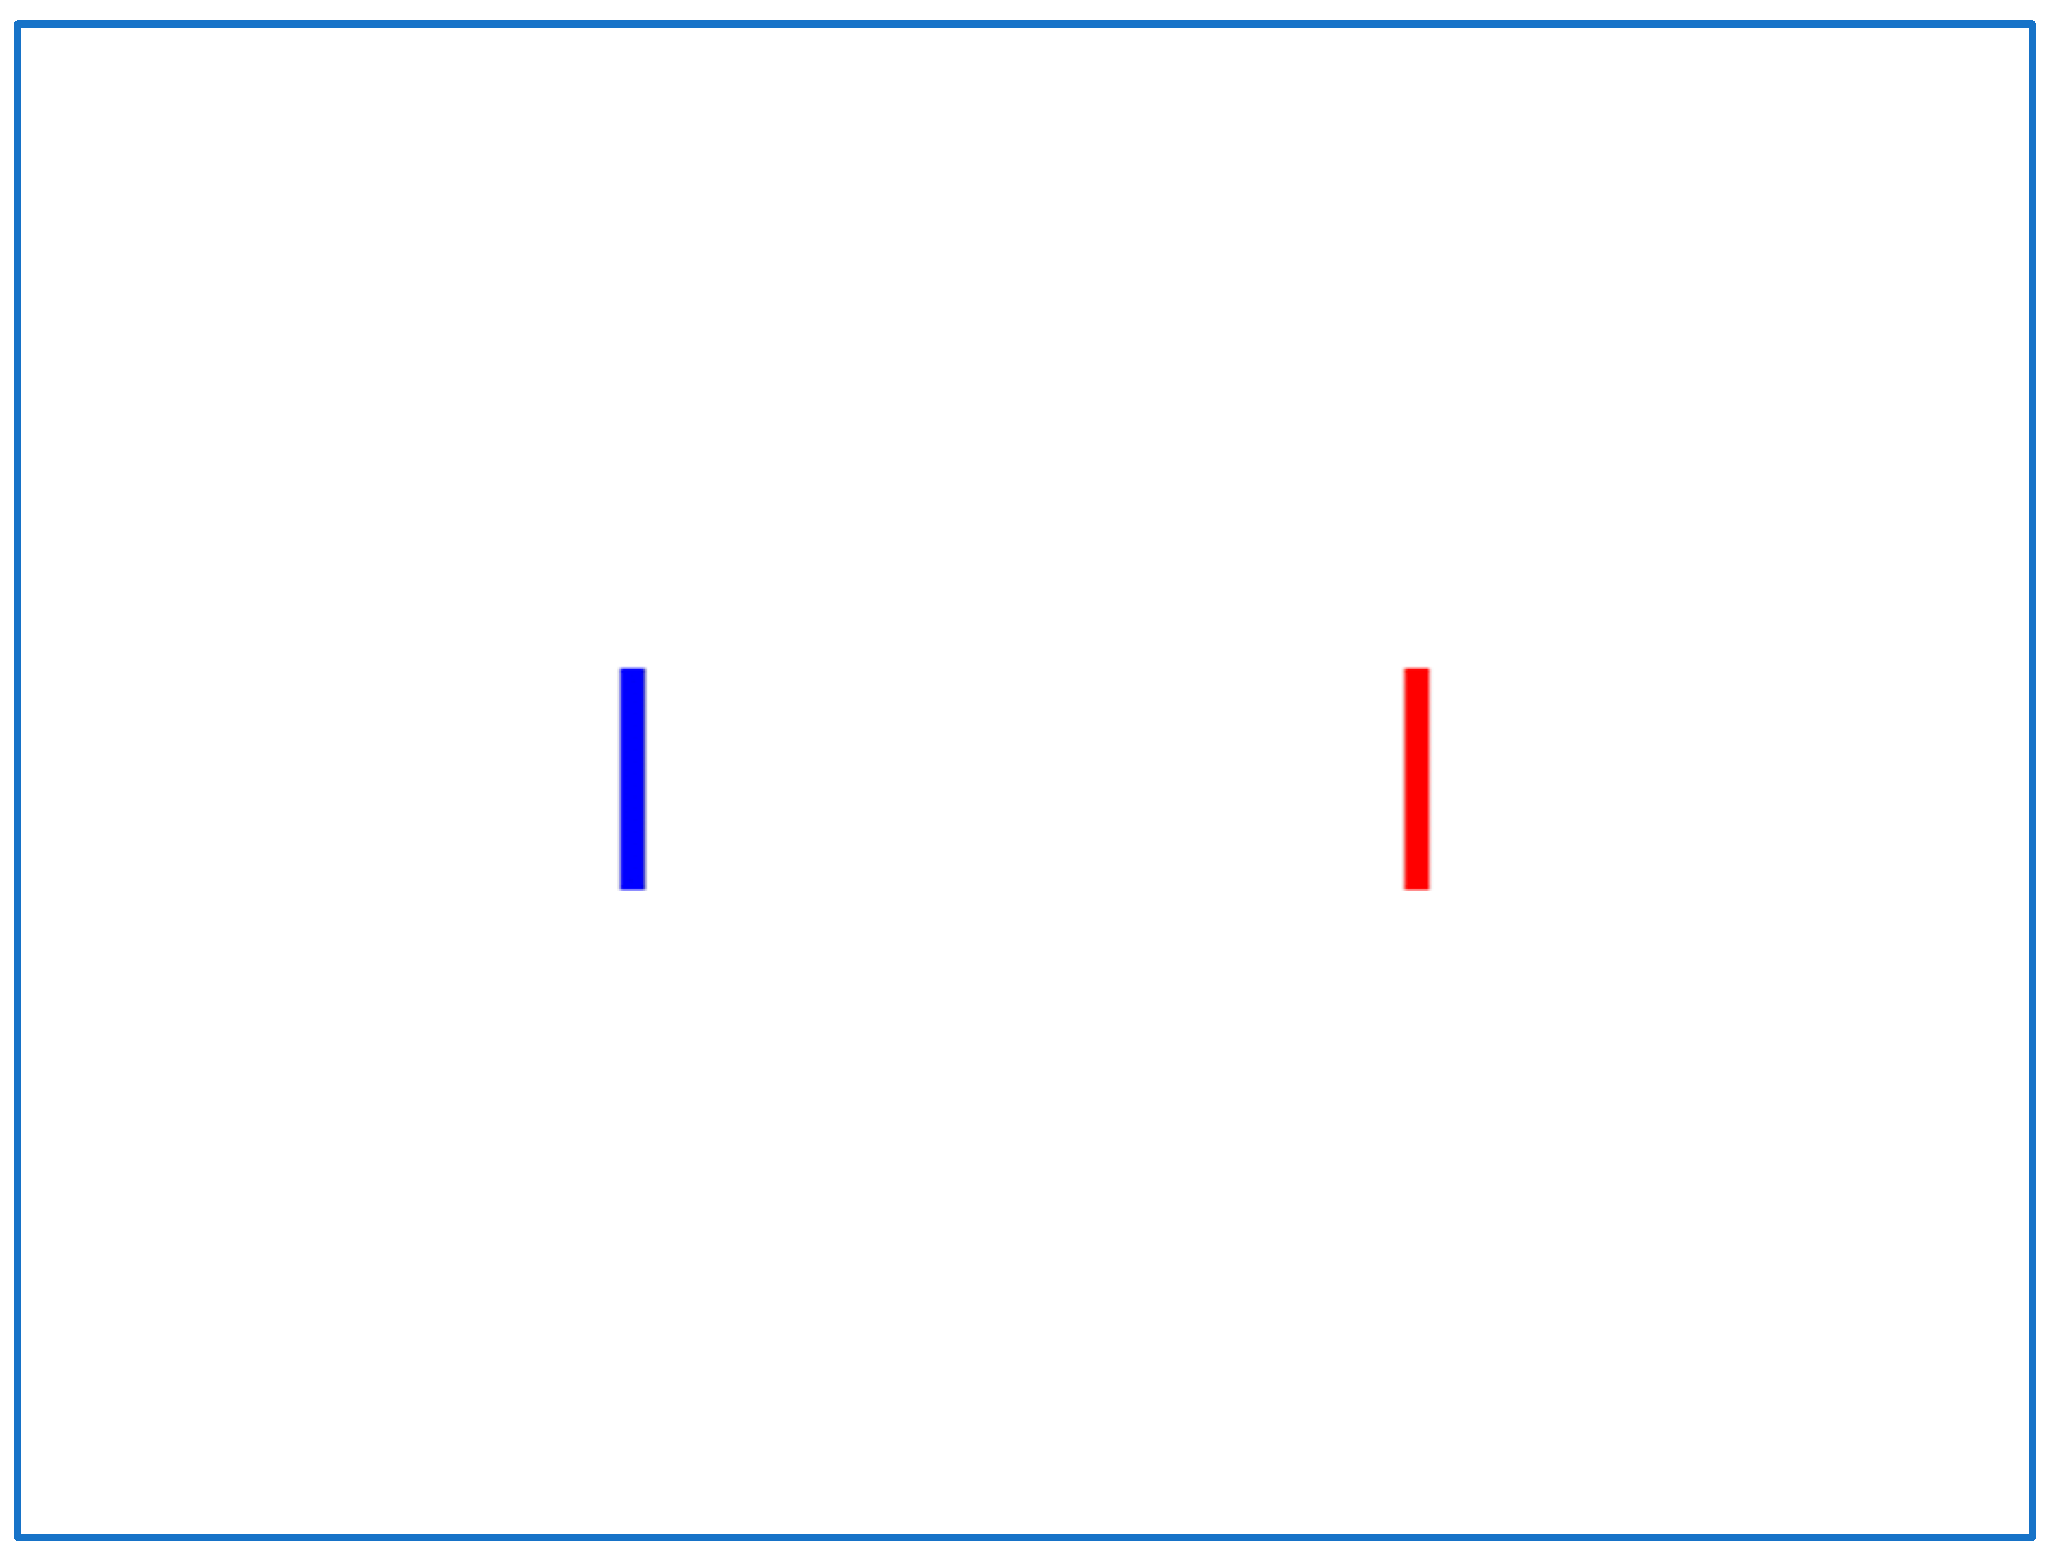
Every experiment consists of three sessions, each with a different Index of Difficulty (ID) achieved with three different target width and distance combinations. We used rectangular targets in the 1D experiment, with each session comprising 20 trials (i.e., 60 trials per 1D experiment). On the computer screen, two targets are graphically displayed (Figure 8), and the user must move the mouse pointer from the blue target (start) to the red target (end) and click it. Following a successful selection, the previously selected start and end targets toggle roles and colors, requiring the user to perform repetitive point-and-click tasks while moving the mouse pointer back and forth on two targets on the horizontal axis. A warm-up session is conducted before the experiment, and the experiment instructor prompts the user to click as close to the target’s center as possible.
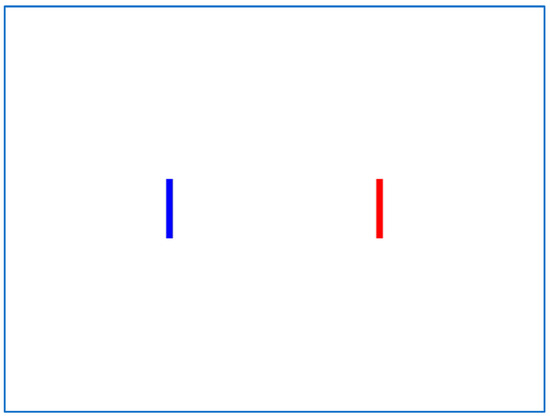
Figure 8.
Typical screen for the IDEA 1D experiment.
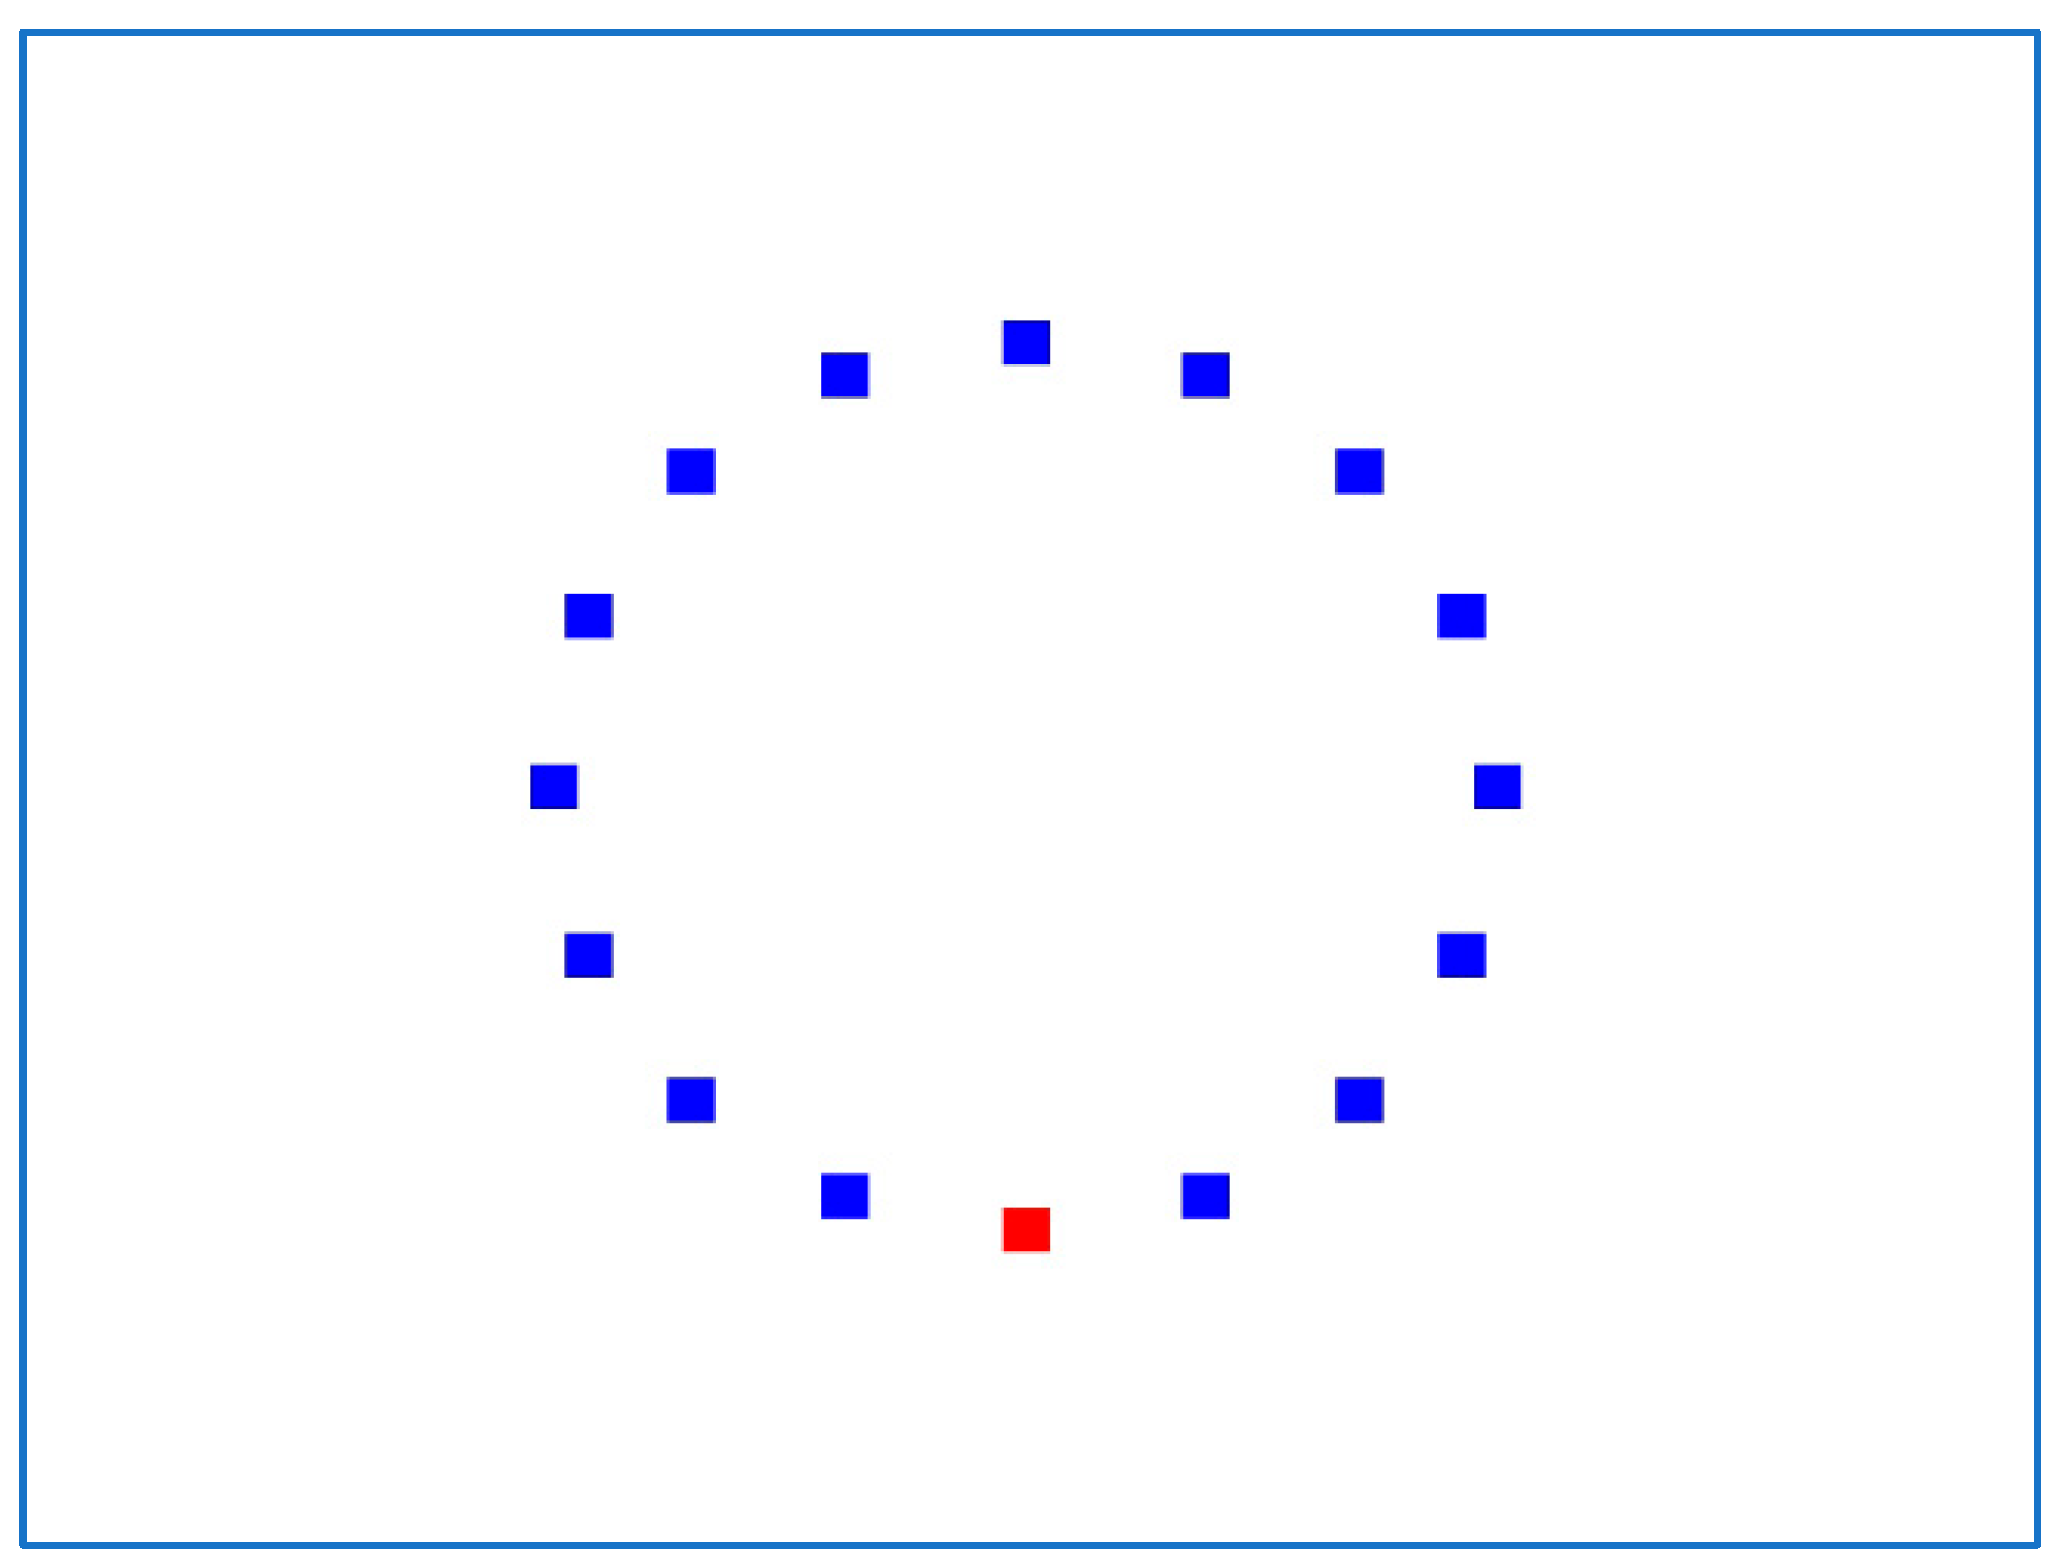
In the 2D experiment (Figure 9), the IDEA system displays 16 square targets in a circular layout, and each session consists of 17 trials. The first trial begins with the mouse pointer fixed on the center of the uppermost target and ends by selecting the opposite (bottommost) target. The second trial begins with the mouse pointer fixed on the center of the lowest target, ends with the target next to the highest (on the right), and so on clockwise until the top target is reached. As a result, each 2D experiment has 51 trials.
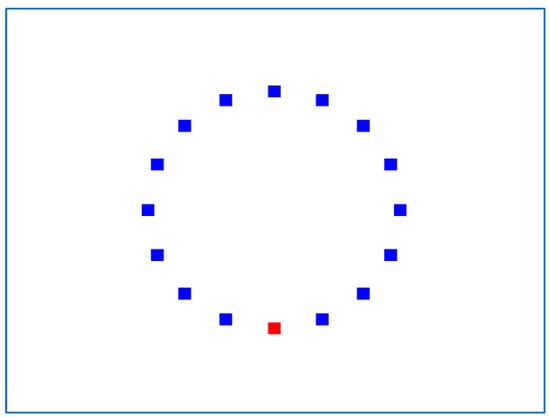
Figure 9.
Typical screen for the IDEA 2D experiment.
We used three Indexes of Difficulty (IDs) for the three Sessions: ID1 = 2.3, ID2 = 3.2, and ID3 = 4.1. These IDs correspond to three different target widths: 76, 37, and 19 pixels in the 1D experiment and 59, 28, and 14 pixels in the 2D experiment. In the 1D experiment, the targets’ height is fixed at 150 pixels, and their distance is also fixed at 300 pixels, whereas in the 2D experiment, the targets have equal width and height, and their distance is fixed at 230 pixels. Our previous published study [30] describes the Index of Difficulty (ID) and all other parameters that IDEA calculates.
2.4. Participants
The current study included 92 children: 46 children with combined-type ADHD aged 5 to 16 and 46 children without ADHD (control group). All children attended the Developmental and Behavioral Pediatrics Unit, 1st Pediatric Clinic, Children’s Hospital “Hagia Sophia”, National and Kapodistrian University of Athens. The participants were all right-handed. Overall, 85 children, 42 with ADHD and 43 without, took part in the 1D experiment using the mouse. There was a matching of the two groups for age (controls: 8.42 ± 0.198 SD years, ADHD: 8.98 ± 1.875 SD years, p = 0.17) and gender (controls: 20/23 males/females, ADHD: 15/27 males/females, p = 0.138). In total, 60 children participated in the 1D experiment using the joystick as an input device: 21 with ADHD and 39 without (controls). The two groups were matched for age (controls: 8.5 ± 2.05 SD, ADHD: 8.94 ± 1.76 SD years, p = 0.404) and gender (controls: 20/19 males/females, ADHD: 15/6 males/females, p = 0.033). Overall, 83 children participated in the 2D experiment using the mouse as an input device, 41 of whom had ADHD and 42 who did not (controls). There was a matching of the two groups for age (controls: 8.47 ± 1.96 SD years, ADHD: 9.01 ± 1.94 SD years, p = 0.903) and gender (controls: 20/22 males/females, ADHD: 15/26 males/females, p = 0.138). The last experiment using a joystick in a two-dimensional point-and-click task included 59 children, 21 of whom had ADHD and 38 who did not (controls). The two groups matched for age (controls: 8.6 ± 2.04 SD years, ADHD: 8.91 ± 0.76 SD years, p = 0.234) and gender (controls: 20/18 males/females, ADHD: 15/6 males/females, p = 0.033).
Children with intellectual disability, chromosomal abnormalities, genetic syndromes, neurological or metabolic disorders, or children taking any medication were excluded from the study. There were no hearing or other disabilities among the participants.
According to Green [40], a general guideline for the multivariate regression analysis we conducted is N ≥ 50 + 8 m for testing the overall model and N ≥ 104 + m for testing individual predictors, where N is the total number of participants and m is the number of predictors (ten metrics in our case). We focused on testing individual predictors, especially our new one, SE, as our model has been tested successfully in one of our previous studies [32], so we needed 114 participants preferably. Our limited sample is due to our choice to conduct the study in a controlled hospital environment, ensuring standardized conditions and selection inclusion criteria for all participants, including age, gender, medical history, and cognitive abilities. However, the high specificity of our sample enhances internal validity, partially compensating for its smaller size. Furthermore, our results provided sufficient prediction power (78%) for detecting meaningful effects, which justifies our sample size’s marginal adequacy [40].
Parents were briefed on the research study’s objectives and methodology and signed a consent form allowing their children to participate. The study adhered to the principles of the Helsinki Declaration and the ethical committee of the Hospital “Hagia Sophia”, NKUA.
2.5. Protocol
ADHD in children was clinically diagnosed by a developmental pediatrician and a child psychiatrist based on the DSM-IV/DSM-5 criteria through a clinical interview with parents, observation, and testing [5,10]. During the study, all participants were subjected to the following protocols: (i) clinical evaluation, (ii) parent and child questionnaire completion, and (iii) experimental tests using the IDEA system:
(i). Each child’s clinical evaluation included ADHD in-service clinical diagnosis, complete medical examination, assessment of cognitive dynamics (Wechsler Intelligence Scale for Children, WISC-III) [41] by a specialist psychologist, learning assessment by a specialist educator, comorbid problems, or disorders check through clinical interviewing with parents;
(ii). Filling in questionnaires: Children fill in the State–Trait Anxiety Inventory for Children (STAIC) [42] and Children’s Depression Inventory (CDI) [43] questionnaires that are standardized and weighted in the Greek population. The Child Behavior Checklist (CBCL) [44,45], the ADHD Rating Scale [46], and their versions for teachers (CDI Teacher Report and ADHD Diagnostic Teacher Rating Scale) were sent through parents to pupils’ schools where they were completed. Furthermore, parents were asked to complete the following self-administered questionnaires: Symptom Checklist-90-Revised (SCL- 90-R) [47,48], State–Trait Anxiety Inventory (STAI-Gr I and II) [49,50], Beck Depression Inventory (BDI) [51], and Eysenck Personality Questionnaire (EPQ) [52,53]. Completing the questionnaires for the present study was crucial as it enabled us to homogenize the groups of participants and not include people with psychiatric problems in the study;
(iii). Children were instructed to complete the 1D and 2D experiments with the IDEA system, using the mouse and the joystick as input devices with their dominant hand. The order of the four experiments was randomized. Participants sat on a chair with an adjustable height in front of a desk in an ergonomically defined position according to ISO 9241-5 [54]. The duration of the experiments was approximately 8 min for participants who used only one device and 15 min for the participants who used both input devices
2.6. Data Processing and Statistical Tools
The IDEA system generates ASCII files containing the coordinates of the mouse pointer’s position on the screen at a sampling rate of 1 sample every 10 milliseconds (100 Hz). These files contain flags (for example, for clicks) that aid in the computation of mouse pointer trajectory parameters and metadata (for example, input device name, subject name, date, and time). The ASCII file data are preprocessed in Microsoft Excel 2010 (x and y coordinates are extracted from comma-separated text files into separate sheet columns) before being imported into MATLAB R20018a to calculate each parameter by implementing the corresponding mathematical algorithms [30].
To examine the obtained parameters for each experiment, we utilized SPSS Statistics v23 [55]. The Kolmogorov–Smirnov test was used to determine the normality of the distributions of age and mouse pointer trajectory parameters. All parameters were averaged and computed over each session, along with their standard errors and 95% confidence intervals (CI). We used the T-test and chi-square test (Fisher exact test) to compare the age and gender distributions of the control and ADHD groups. We applied a multivariate analysis of covariance (MANCOVA) on the parameters, with group and gender as fixed factors and age as a covariate. The age effect on the parameters was quantified using the matching Spearman correlation coefficient (r) during univariate between-group comparisons with multiple comparison adjustments. Finally, to assess the predictive value of the two groups, we entered the parameters as independent predictors in a hierarchical logistic regression model with the group as the dependent variable. The level of significance for the correlation approach was set at 0.05.
3. Results
3.1. One-Dimensional Experiment Mouse
The MANCOVA analysis (Table 1) demonstrated significant age correlations (p < 0.05) with all point-and-click mouse pointer trajectory parameters in the case of the 1D mouse experiment except MO.

Table 1.
Age parameters correlation in the 1D experiment with the mouse.
Among the IDEA parameters, neither gender nor group had a significant effect. Table 2 lists groups as “Children with ADHD” and “Controls” (which are children without ADHD).
Table 2.
Performance parameters in the 1D experiment with the mouse.
The hierarchical logistic regression model results for the 1D experiment with the mouse (Table 2) revealed that the inclusion of four predictors in the logistic regression equation, namely MV, MT, TP, and ME, could correctly predict the group membership of 34/43 controls and 25/42 children with ADHD, giving a total of 69.4% correct classifications (59/85).
3.2. One-Dimensional Experiment Joystick
For the case of the 1D experiment using the joystick, the MANCOVA procedure (Table 3) revealed significant age correlations (p < 0.01) with all the mouse pointer trajectory parameters except MCL and MO. Specifically, children’s age is positively correlated only with TP (r = 0.732, p < 0.001) and a negative correlation with MT, TRE, TAC, MDC, MV, and ME.
Table 3.
Age parameters correlation in the 1D experiment with the joystick.
Regarding the group (Table 4), no significant effect was observed.
Table 4.
Performance parameters in the 1D experiment with the joystick.
In terms of gender (Table 5), the MANCOVA procedure demonstrated significant (p < 0.05) relationships with MT, TP, TRE, TAC, MDC, ME, and MO. MCL and MV, on the other hand, have no gender association. Males outperform females in the TP parameter (males mean: 1.2, 95% CI [1.1, 1.3], females mean: 1.0, 95% CI [0.93, 1.14]) and the MO parameter (males mean: 0.58, 95% CI [0.056, 1.123], females mean: −0.46, 95% CI [−1.34, 0.40]). Females score higher on the MT parameter (males mean: 3677.60, 95% CI [3252.79, 4102.40], females mean: 4249.12, 95% CI [3818.25, 4679.99]), TRE (males mean: 1.03, 95% CI [0.88, 1.18], females mean: 1.39, 95% CI [1.19, 1.59]), TAC (males mean: 0.19, 95% CI [0.14, 0.24], females mean: 0.31, 95% CI [0.23, 0.39]), and ME (males mean: 3.89, 95% CI [3.12, 4.67], females mean: 5.23, 95% CI [3.89, 6.58]).
Table 5.
Gender parameters correlation in the 1D experiment with the joystick.
The hierarchical logistic regression model results for the 1D joystick experiment revealed that the best prediction model among children from the control population and children with ADHD achieved a 63.3% correct classification (32/39 control group and 6/21 ADHD group), including all the parameters.
3.3. Two-Dimensional Experiment Mouse
In the case of the 2D mouse experiment, the MANCOVA analysis indicated significant age correlations (p < 0.01) with all mouse pointer trajectory characteristics (Table 6). Children’s ages mostly have a positive correlation with TP (r = 0.669, p < 0.001) and a negative correlation with the remaining factors. Gender had no discernible effect on the IDEA parameters.
Table 6.
Age parameters correlation in the 2D experiment with the mouse.
The findings of the hierarchical logistic regression model for the 2D mouse experiment (Table 7) revealed that the best predictors among children of controls and children with ADHD attained a 67.5% correct classification (30/42 controls and 26/41 ADHD group) with five predictions, namely ME, TRE, MDC, MV, and MO.
Table 7.
Performance parameters in the 2D experiment with the mouse.
3.4. Two-Dimensional Experiment Joystick
The MANCOVA analysis indicated (Table 8) significant age associations (p < 0.05) with all kinetic parameters except MCL in the case of the 2D experiment with the joystick. Children’s ages had a positive correlation with TP (r = 0.715, p < 0.001) but a negative correlation with the other parameters.
Table 8.
Age parameters correlation in the 2D experiment with the joystick.
In terms of gender (Table 9), the MANCOVA analysis demonstrated significant (p < 0.05) associations with MT, TP, TRE, and MDC. In circumstances of strong correlations, males outperform females in the TP parameter (males mean: 1.0, 95% CI [0.9, 1.1], females mean: 0.87, 95% CI [0.8, 0.9]). On the contrary, females have a higher score on the MT parameter (males mean: 5383.61, 95% CI [4845.74, 5921.48], females mean: 6156.52, 95% CI [5612.45, 6700.58]), TRE (males mean: 1.16, 95% CI [1.03, 1.30], females mean: 1.53, 95% CI [1.137, 1.70]), and MDC (males mean: 113.34, 95% CI [100.04, 126.63], females mean: 128.72, 95% CI [112.39, 145.05]).
Table 9.
Gender parameters correlation in the 2D experiment with the joystick.
The significant group effect (Table 10) relates to one parameter, namely MCL (Figure 10), where children with ADHD had higher mean values (p = 0.017) than controls.
Table 10.
Performance parameters in the 2D experiment with the joystick.
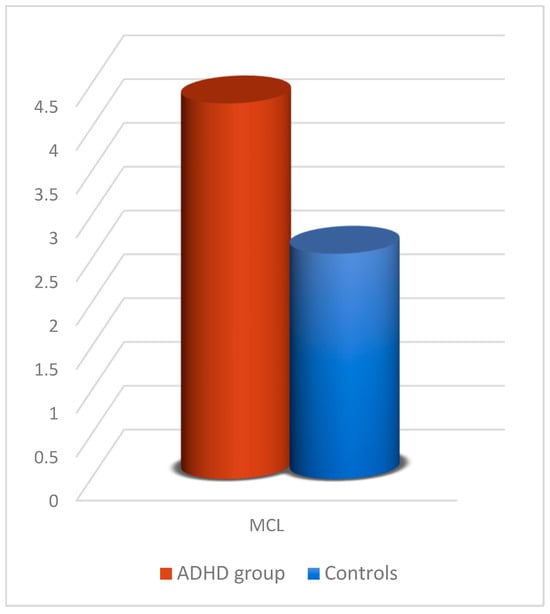
Figure 10.
MCL comparison between participants with ADHD and controls in the 2D experiment with the joystick.
The hierarchical logistic regression model results for the 2D joystick experiment revealed that the best prediction model among children in the control group and children with ADHD achieved a 78% correct classification (35/38 controls and 11/21 ADHD) with five predictors, namely MCL, MV, MO, MT, and MDC.
Finally, we repeated the statistical analysis for the experiments, integrating data from psychometric questionnaires. The results revealed no discernible influence, and none of the psychometric factors were significant enough to be included in any of the above-mentioned prediction models; hence, these parameters were omitted from this study.
4. Discussion
The current study’s findings reflect Hotham’s [15] findings that children with ADHD have lower upper-limb motor ability than children without ADHD. In all experiments, we discovered significant correlations between the variables of interest. Except for MO in one of the four experiments, the association of age with all kinetic parameters indicates that as children grow, they require less time and effort to accomplish each action. This assumption has been previously noticed by McQuiddy [56].
In the 2D experiment with the joystick as an input device, there is a significant difference in MCL mean values between controls and children with ADHD. This finding indicates that children with ADHD exert more effort than controls to correctly click the red target (endpoint), making more “mistakes”. Furthermore, mean MT times in all experiments show that ADHD children are slower than non-ADHD children. A significant difference in mean values of MV is also visible in the 1D experiment with the mouse. This finding demonstrates that ADHD youngsters perform fewer accurate movements. This result was also obtained in relevant research by Barkley [16] and Kadesjö [17], who explained that ADHD children are predisposed to poor gross motor function and balance. It is also worth noting that, according to Pitcher et al. [57], in their study based on MABC-2 [14], inferior fine motor skills in children with ADHD could not be linked to attention and concentration deficiencies but to characteristics relating to their motor ability.
Regarding the input device, TP scores are more outstanding with the mouse than with the joystick. Regarding the effect of gender, it is worth noting that males performed better than females across all kinetic parameters in both experiments using the joystick. The observed gender difference in joystick performance could be related to varying levels of familiarity with the device, possibly influenced by prior gaming experience [58]; however, this remains speculative and is not supported by data from the current study.
Comparing the results of our study to the ones of Leontyev’s [33], it is evident that mouse movement features have significant associations with ADHD patients, particularly variability coefficients such as Velocity Peaks and Acceleration, which are used to quantify motor behaviors associated with impulsivity and executive dysfunction and can be reflected with IDEA’s Movement Variability and Movement Offset. More particularly, Velocity Peaks represent the maximum cursor speed during task performance. Individuals exhibiting higher ADHD symptoms tend to display elevated peak velocities, especially in inhibitory tasks (No-go trials), reflecting reduced behavioral control. Acceleration refers to the rate at which the mouse pointer reaches its peak velocity. Higher acceleration values were consistently linked to ADHD traits, indicating difficulty in regulating motor execution and decision-making speed. Consequently, this even more profoundly suggests that dynamic assessment in mouse motion can be a measure of ADHD.
While the results of this study did not demonstrate a statistically significant contribution of Sample Entropy (SE) to the assessment of motor skills in ADHD children, the inclusion of SE was still justified due to its capacity to capture complexity and variability in physiological signals. SE is well-regarded for its ability to quantify the predictability of time series data, making it a suitable candidate for exploring motor behavior, where irregularities in movement dynamics are often hypothesized to reflect neurodevelopmental differences. Even in the absence of statistical significance, testing such robust metrics is essential in comprehensive investigations, as it broadens our understanding of data patterns and contributes to the refinement of future analytical frameworks in ADHD research.
When the current study’s findings are compared to three others in our previously published work [29,30,32], we see that the IDEA system can be effective and adaptable to other upper limb motion dysfunctions while maintaining its reliability and sensitivity across an even wider range of age and familiarity with the input device. As a result, the IDEA system could screen various diseases or disorders that affect the motor function of the upper limbs (Table 11).
Table 11.
Comparison between the current research and our previous ones [29,30,32].
Limitations: This study demonstrates the potential of our system as a diagnostic tool; however, it does not propose it as such. The primary reasons are that the statistical model was tested on a small and specific sample group, and whether the system would produce accurate predictions for other populations (e.g., individuals with different disorders or conditions) remains unknown. The observed True Positives across different input device experiments—1D mouse [25/42], 1D joystick [6/21], 2D mouse [26/41], and 2D joystick [11/21]—further underscore that assumption. The system must account for and effectively evaluate all relevant disorders to become a reliable diagnostic tool.
5. Conclusions
The current study demonstrates that the IDEA system is an objective, sensitive, and consistent method for measuring upper limb motor skills in children with Attention Deficit Hyperactivity Disorder (ADHD). The findings allow for a better understanding of ADHD’s effects on the upper limbs, although Sample Entropy did not significantly impact the final results. We investigated the IDEA system’s potential utility as a predictor of ADHD in conjunction with clinical evaluations, assessing its sensitivity and reliability.
The novelty of our study was the addition of a new metric for the first time in our results analysis, namely Sample Entropy, for a deeper understanding of trajectory analysis and further investigation of metrics that could contribute to a higher prediction rate. However, our analysis with the new metric did not yield a significant contribution of SE or a change to the overall findings. Our older metrics proved adequate for yielding concrete results. Furthermore, this study investigated participants with ADHD for the first time in our research series, and there are no similar computer-based studies using a mouse and a joystick with the aim of yielding a successful detection rate.
Based on research that supports the notion that motor task training can improve executive functioning in children with ADHD [58], the IDEA system has the potential to play an essential role in ADHD rehabilitation. Given that the logistic regression equation predicted 78% of the classifications in the 2D experiment using the joystick, we may conclude that the IDEA system can be a potential prediction tool for children with ADHD. However, it does not position it as a definitive diagnostic instrument. This is primarily because the statistical model was tested on a small and specific sample group, and its ability to generate accurate predictions across other populations (e.g., individuals with different disorders or conditions) remains uncertain. For the system to be considered a reliable diagnostic tool, it would need to comprehensively account for and evaluate all relevant disorders. The observed True Positives across different input device experiments—1D mouse [25/42], 1D joystick [6/21], 2D mouse [26/41], and 2D joystick [11/21]—further underscore that the system currently serves as a prediction tool rather than a diagnostic one. In addition to the 1D and 2D trials outlined above, future studies will enhance our experiments with combinations of novel repeated activities (such as 3D tasks, labyrinths, and paths). Based on the IDEA system’s additional features (e.g., support for 3D input devices, multidimensional assessments, and a configurable user interface), we anticipate that future studies will examine the kinematic parameters that provide evidence of the derived motor deficit in greater depth while we keep testing new metrics. Our future research will focus on detecting autistic spectrum disease, minimal brain damage, and dysphasia.
Author Contributions
Conceptualization, A.P., N.P. and G.K.; methodology, A.P., N.P. and G.K.; validation, G.K. and C.P.; investigation, N.P. and A.P.; data curation, N.P., P.-A.G. and G.M.; writing—original draft preparation, N.P.; writing—review and editing, A.P. and G.K.; visualization, N.P.; supervision, G.K.; project administration, G.K. and C.P. All authors have read and agreed to the published version of the manuscript.
Funding
This research received no external funding.
Institutional Review Board Statement
The study was conducted in accordance with the Declaration of Helsinki and approved by the Ethics Committee of the National and Kapodistrian University of Athens.
Informed Consent Statement
Parents were briefed on the research study’s objectives and methodology and signed a consent form allowing their underage children to participate. The study was conducted in accordance with the Declaration of Helsinki, and the protocol was approved by the Ethics Committee of 11204 (Project identification code) on 24 May 2018.
Data Availability Statement
The data presented in this study are available on request from the corresponding author due to privacy and ethical reasons.
Conflicts of Interest
The authors declare no conflicts of interest.
Abbreviations
The following abbreviations are used in this manuscript, as follows:
| MT | Movement Time |
| TP | Throughput |
| MCL | Missed Clicks |
| TRE | Target Re-Entry |
| TAC | Task Axis Crossing |
| MDC | Movement Direction Change |
| MV | Movement Variability |
| ME | Movement Error |
| MO | Movement Offset |
| SE | Sample Entropy |
References
- American Psychiatric Association. Work Group to Revise DSM-III: Diagnostic and Statistical Manual of Mental Disorders, 3rd ed.; revised (DSM-III-R); American Psychiatric Association: Washington, DC, USA, 1987. [Google Scholar]
- Shoemaker, K.; Bunte, T.; Wiebe, S.A.; Espy, K.A.; Dekovic, M.; Matthys, W. Executive function deficits in preschool children with ADHD and DBD. J. Child. Psychol. Psychiatry 2011, 53, 111–119. [Google Scholar] [CrossRef] [PubMed]
- Wohnhas-Baggerd, U. ADHS und Psychomotorik. Systemische Entwicklungsbegleitung als Therapeutische Intervention; Hofmann-Verlag: Schorndorf, Germany, 2008. [Google Scholar]
- Scahill, L.; Schwab-Stone, M. Epidemiology of ADHD in school-age children. Child. Adolesc. Psychiatr. Clin. N. Am. 2000, 9, 541–555. [Google Scholar] [CrossRef] [PubMed]
- American Psychiatric Association. Diagnostic and Statistical Manual of Mental Disorders, 4th ed.; (DSM IV); American Psychiatric Association: Washington, DC, USA, 1994. [Google Scholar]
- Sonuga-Barke, E.J.S. Psychological heterogeneity in AD/HD—A dual pathway model of behaviour and cognition. Behav. Brain Res. 2002, 130, 29–36. [Google Scholar] [CrossRef]
- Castellanos, F.X.; Tannock, R. Neuroscience of attention deficit/hyperactivity disorder: The search for endophenotypes. Nat. Rev. Neurosci. 2002, 3, 617–628. [Google Scholar] [CrossRef] [PubMed]
- Sonuga-Barke, E.J.S.; Dalen, L.; Remington, B. Do executive deficits and delay aversion make independent contributions to preschool attention deficit/hyperactivity disorder symptoms? J. Am. Acad. Child. Adolesc. Psychiatry 2003, 42, 1335–1342. [Google Scholar] [CrossRef]
- Paloyelis, Y.; Asherson, P.; Kuntsi, J. Are ADHD symptoms associated with delay aversion or choice impulsivity? A general population study. J. Am. Acad. Child. Adolesc. Psychiatry 2009, 48, 837–846. [Google Scholar] [CrossRef]
- American Psychiatric Association. Diagnostic and Statistical Manual of Mental Disorders, 5th ed.; (DSM-5); American Psychiatric Association: Arlington, VA, USA, 2013. [Google Scholar]
- Epstein, J.N.; Loren, R.E. Changes in the definition of ADHD in DSM-5: Subtle but important. Neuropsychiatry 2013, 3, 455–458. [Google Scholar] [CrossRef]
- Fietsam, A.C.; Tucker, J.R.; Kamath, M.S.; Huang-Pollock, C.; Wang, Z.; Neely, K.A. Manual dexterity and strength and in young adults with and without attention-deficit/hyperactivity disorder (ADHD). Neurosci. Lett. 2021, 766, 136349. [Google Scholar] [CrossRef]
- Mokobane, M.; Pillay, B.J.; Meyer, A. Fine motor deficits and attention deficit hyperactivity disorder in primary school children. S. Afr. J. Psychiatry 2019, 25, 7. [Google Scholar] [CrossRef]
- Brown, T.; Lalor, A. The movement assessment battery for children—Second edition (MABC-2): A review and critique. Phys. Occup. Ther. Pediatr. 2009, 29, 86–103. [Google Scholar] [CrossRef]
- Hotham, E.; Haberfield, M.; Hillier, S.; White, J.M.; Todd, G. Upper limb function in children with attention-deficit/hyperactivity disorder (ADHD). J. Neural Transm. 2018, 125, 713–726. [Google Scholar] [CrossRef]
- Barkley, R.A. Behavioral inhibition, sustained attention, and executive functions: Constructing a unifying theory of ADHD. Psychol. Bull. 1997, 121, 65–94. [Google Scholar] [CrossRef] [PubMed]
- Kadesjö, B.; Gillberg, C. Attention deficits and clumsiness in Swedish 7-year-old children. Dev. Med. Child Neurol. 1998, 40, 796–804. [Google Scholar] [CrossRef] [PubMed]
- Pino, A.; Kalogeros, E.; Salemis, I.; Kouroupetroglou, G. Brain computer interface cursor measures for motion-impaired and able-bodied users. In Universal Access in HCI: Inclusive Design in the Information Society; HCI 2003 Proc 4; Stephanidis, C., Ed.; Lawrence Erlbaum Associates, Inc.: Mahwah, NJ, USA, 2003; pp. 1462–1466. [Google Scholar]
- Kouroupetroglou, G.; Pino, A.; Balmpakakis, A.; Chalastanis, D.; Golematis, V.; Ioannou, N.; Koutsoumpas, I. Performance evaluation of gesture-based 2d and 3d pointing tasks. In Gesture in Embodied Communication and Human Computer Interaction, Proceedings of the 9th International Gesture Workshop, GW 2011, Athens, Greece, 25–27 May 2011; Efthimiou, E., Kouroupetroglou, G., Eds.; ATHENA Research Center and University of Athens: Athens, Greece, 2011; pp. 10–15. Available online: https://speech.di.uoa.gr/sppages/spppdf/gw2011%20%20koupe%20wiimote.pdf (accessed on 17 December 2024).
- Kouroupetroglou, G.; Pino, A.; Balmpakakis, A.; Chalastanis, D.; Golematis, V.; Ioannou, N.; Koutsoumpas, I. Using wiimote for 2d and 3d pointing tasks: Gesture performance evaluation. In Gesture and Sign Language in Human-Computer Interaction and Embodied Communication, Proceedings of the 9th International Gesture Workshop, GW 2011, Athens, Greece, 25–27 May 2011; Revised Selected Papers; LNAI 7206; Efthimiou, E., Kouroupetroglou, G., Fotinea, S.E., Eds.; Springer: Berlin/Heidelberg, Germany, 2012; pp. 13–23. [Google Scholar] [CrossRef]
- Pino, A.; Tzemis, E.; Ioannou, N.; Kouroupetroglou, G. Using kinect for 2d and 3d pointing tasks: Performance evaluation. In Human-Computer Interaction. Interaction Modalities and Techniques, Proceedings of the 15th International Conference, HCI International 2013, Las Vegas, NV, USA, 21–26 July 2013; Part IV; LNCS 8007; Kurosu, M., Ed.; Springer: Berlin/Heidelberg, Germany, 2013; pp. 358–367. [Google Scholar] [CrossRef]
- Douglas, A.; Kirkpatrick, E.; MacKenzie, I.S. Testing pointing device performance and user assessment with the ISO 9241, part 9 standard. In Proceedings of the CHI ‘99: SIGCHI Conference on Human Factors in Computing Systems, Pittsburgh, PA, USA, 15–20 May 1999; pp. 215–222. [Google Scholar] [CrossRef]
- Fitts, P.M.; Peterson, J.R. Information capacity of discrete motor responses. J. Exp. Psychol. 1964, 67, 103–112. [Google Scholar] [CrossRef]
- Fitts, P.M. The information capacity of the human motor system in controlling the amplitude of movement. J. Exp. Psychol. 1954, 47, 381–391. [Google Scholar] [CrossRef]
- MacKenzie, I.S.; Kauppinen, T.; Silfverberg, M. Accuracy measures for evaluating computer pointing devices. In Proceedings of the CHI ‘01: SIGCHI Conference on Human Factors in Computing Systems, Seattle, WA, USA, 1 March 2001; pp. 9–16. [Google Scholar] [CrossRef]
- Gillan, D.J.; Holden, K.; Adam, S.; Rudisill, M.; Magee, L. How does Fitts’ law fit pointing and dragging? In Proceedings of the CHI90: Conference on Human Factors in Computing Systems, Seattle, WA, USA, 1–5 April 1990; pp. 227–234. [Google Scholar] [CrossRef]
- MacKenzie, I.S.; Sellen, A.; Buxton, W.A.S. A comparison of input devices in elemental pointing and dragging tasks. In Proceedings of the CHI91: SIGCHI Conference on Human Factors in Computing Systems, New Orleans, LA, USA, 27 April–2 May 1991; pp. 161–166. [Google Scholar] [CrossRef]
- Accot, J.; Zhai, S. Beyond Fitt’s law: Models for trajectory-based HCI tasks. In Proceedings of the CHI97: ACM SIGCHI Conference on Human Factors in Computing Systems, Atlanta, GA, USA, 22–27 March 1997; pp. 295–302. [Google Scholar] [CrossRef]
- Pino, A.; Kouroupetroglou, G.; Papatheodorou, N.; Andreadou, E.; Papageorgiou, C. Upper Limb motor skills evaluation in patients with early multiple sclerosis using the idea system. In Proceedings of the 2015 IEEE Symposium Series on Computational Intelligence, Cape Town, South Africa, 7–10 December 2015; pp. 1658–1664. [Google Scholar] [CrossRef]
- Papatheodorou, N.; Pino, A.; Kouroupetroglou, G.; Constantinides, V.; Andreadou, E.; Papageorgiou, C. Upper limb motor skills performance evaluation based on point-and-click cursor trajectory analysis: Application in early multiple sclerosis detection. IEEE Access 2019, 7, 28999–29013. [Google Scholar] [CrossRef]
- ISO/TS 9241-411:2012; Ergonomics of Human-System Interaction—Part 411: Evaluation Methods for the Design of Physical Input Devices. ISO (International Organization for Standardization): Genève, Zwitserland, 2012.
- Papatheodorou, N.; Kouroupetroglou, G.; Pino, A.; Giannopoulos, P.A.; Makris, G.; Papageorgiou, C. Hand dexterity assessment based on mouse pointer trajectory measurements in children with learning disabilities. Univ. Access Inf. Soc. 2021, 20, 321–331. [Google Scholar] [CrossRef]
- Leontyev, A.; Sun, S.; Wolfe, M.; Yamauchi, T. Augmented Go/No-Go task: Mouse cursor motion measures improve ADHD symptom assessment in healthy college students. Front. Psychol. 2018, 9, 496. [Google Scholar] [CrossRef]
- Mathôt, S.; Schreij, D.; Theeuwes, J. OpenSesame: An open-source, graphical experiment builder for the social sciences. Behav. Res. Methods 2012, 44, 314–324. [Google Scholar] [CrossRef]
- Kieslich, P.J.; Henninger, F. Mousetrap: An integrated, open-source mouse-tracking package. Behav. Res. Methods 2017, 49, 1652–1667. [Google Scholar] [CrossRef]
- Chen, C.; Sun, S.; Cao, Z.; Shi, Y.; Sun, B.; Zhang, X.D. A comprehensive comparison and overview of R packages for calculating sample entropy. Biol. Methods Protoc. 2019, 4, bpz016. [Google Scholar] [CrossRef]
- Richman, J.S.; Moorman, J.R. Physiological time-series analysis using approximate entropy and sample entropy. Am. J. Physiol. Heart Circ. Physiol. 2000, 278, H2039–H2049. [Google Scholar] [CrossRef]
- Jin, Y.; Chen, C.; Cao, Z.; Sun, B.; Lo, I.L.; Liu, T.M.; Zheng, J.; Sun, S.; Shi, Y.; Zhang, X.D. Entropy change of biological dynamics in COPD. Int. J. Chronic Obstr. Pulm. Dis. 2017, 12, 2997–3005. [Google Scholar] [CrossRef]
- Ahmed, M.U.; Mandic, D.P. Multivariate multiscale entropy analysis. IEEE Signal Process. Lett. 2011, 19, 91–94. [Google Scholar] [CrossRef]
- Green, S.B. How many subjects does it take to do a regression analysis? Multivar. Behav. Res. 1991, 26, 499–510. [Google Scholar] [CrossRef]
- Woolger, C. Wechsler intelligence scale for children-third edition (WISC-III). In Understanding Psychological Assessment Perspectives on Individual Differences; Dorfman, I., Hersen, M., Eds.; Springer: Boston, MA, USA, 2001; pp. 219–233. [Google Scholar] [CrossRef]
- Psychountaki, M.; Zervas, Y.; Karteroliotis, K.; Spielberger, C. Reliability and validity of the Greek version of the STAIC. Eur. J. Psychol. Assess. 2003, 19, 124–130. [Google Scholar] [CrossRef]
- Giannakopoulos, G.; Kazantzi, M.; Dimitrakaki, C.; Tsiantis, J.; Kolaitis, G.; Tountas, Y. Screening for children’s depression symptoms in Greece: The use of the Children’s Depression Inventory in a nation-wide school-based sample. Eur. Child. Adolesc. Psychiatry 2009, 18, 485–492. [Google Scholar] [CrossRef]
- Roussos, A.; Francis, K.; Zoubou, V.; Kiprianos, S.; Prokopiou, A.; Richardson, C. The standardization of Achenbach’s Youth Self-Report in Greece in a national sample of high school students. Eur. Child. Adolesc. Psychiatry 2001, 10, 47–53. [Google Scholar] [CrossRef]
- Roussos, A.; Karantanos, G.; Richardson, C.; Hartman, C.; Karajiannis, D.; Kyprianos, S.; Lazaratou, H.; Mahaira, O.; Tassi, M.; Zoubou, V. Achenbach’s Child Behavior Checklist and Teachers’ Report Form in a normative sample of Greek children 6–12 years old. Eur. Child. Adolesc. Psychiatry 1999, 8, 165–172. [Google Scholar] [CrossRef] [PubMed]
- Kalantzi-Azizi, A.; Ageli, K.; Efstathiou, G. Greek Version of ADHD-IV Rating Scale, Scale for Parents, Scale for Teachers. Standardization of ADHD Rating Scale-IV; Hellenika Grammata: Athens, Greece, 2005. (In Greek) [Google Scholar]
- Donias, S.; Karastergiou, A.; Manos, N. Standardization of the symptom checklist-90-R rating scale in a Greek population. Psychiatriki 1991, 2, 42–48. [Google Scholar]
- Derogatis, L.R. SCL-90-R: Administration, Scoring & Procedures Manual-II for the (Revised) Version and Other Instruments of the Psychopathology Rating Scale Series; Clinic Psychometric Research: Towson, MD, USA, 1992. [Google Scholar]
- Spielberger, D.; Gorsuch, L.; Lushene, E. Manual for the State-Trait Anxiety Inventory; Consulting Psychologists Press: Palo Alto, CA, USA, 1970. [Google Scholar]
- Liakos, A.; Giannitsis, S. Reliability and validity of the Greek translation of the Spielberger’s Anxiety Inventory. Engefalos 1984, 21, 71–76. [Google Scholar]
- Tzemos, I. The Standardization of the Beck Depression Inventory in a Greek Population Sample. Ph.D. Dissertation, National and Kapodistrian University of Athens, Athens, Greece, 1984. Available online: https://www.didaktorika.gr/eadd/handle/10442/19687 (accessed on 17 December 2024). (In Greek).
- Eysenck, J.; Eysenck, B. Manual of the Eysenck Personality Questionnaire; Hodder and Stoughton: London, UK, 1975. [Google Scholar]
- Eysenck, B.; Dimitriou, C. Cross-cultural comparison of personality: Greek children and English children. Soc. Behav. Pers. 1984, 12, 45–54. [Google Scholar] [CrossRef]
- ISO 9241-5:2024; Ergonomics of Human-System Interaction Part 5: Workstation Layout and Postural Requirements. ISO (International Organization for Standardization): Geneva, Switzerland, 2024.
- IBM SPSS Statistics 20 Algorithms. Available online: https://www.ibm.com/support/pages/spss-statistics-20-available-download (accessed on 3 March 2024).
- McQuiddy, V.A.; Scheerer, C.R.; Lavalley, R.; McGrath, T.; Lin, L. Normative values for grip and pinch strength for 6-to 19-year-olds. Arch. Phys. Med. Rehabil. 2015, 96, 1627–1633. [Google Scholar] [CrossRef]
- Pitcher, T.M.; Piek, J.P.; Hay, D.A. Fine and gross motor ability in males with ADHD. Dev. Med. Child. Neurol. 2003, 45, 525–535. [Google Scholar] [CrossRef]
- Harwell, K.W.; Boot, W.R.; Ericsson, K.A. Looking behind the score: Skill structure explains sex differences in skilled video game performance. PLoS ONE 2018, 13, e0197311. [Google Scholar] [CrossRef]


Disclaimer/Publisher’s Note: The statements, opinions and data contained in all publications are solely those of the individual author(s) and contributor(s) and not of MDPI and/or the editor(s). MDPI and/or the editor(s) disclaim responsibility for any injury to people or property resulting from any ideas, methods, instructions or products referred to in the content. |
© 2025 by the authors. Licensee MDPI, Basel, Switzerland. This article is an open access article distributed under the terms and conditions of the Creative Commons Attribution (CC BY) license (https://creativecommons.org/licenses/by/4.0/).