Article

Application of Foundation Models for Colorectal Cancer Tissue Classification in Mass Spectrometry Imaging

by
Alon Gabriel
1,
Amoon Jamzad
1,*,
Mohammad Farahmand
1,
Martin Kaufmann
2,3,
Natasha Iaboni
4,
David Hurlbut
4,
Kevin Yi Mi Ren
4,
Christopher J. B. Nicol
4,5,
John F. Rudan
2,
Sonal Varma
4,
Gabor Fichtinger
1 and
Parvin Mousavi
1
1
School of Computing, Queen’s University, Kingston, ON K7L 2N8, Canada
2
Department of Surgery, Kingston Health Sciences Centre, Kingston, ON K7L 2V7, Canada
3
Gastrointestinal Diseases Research Unit, Kingston Health Sciences Centre, Kingston, ON K7L 2V7, Canada
4
Department of Pathology and Molecular Medicine, Queen’s University and Kingston Health Sciences Centre, Kingston, ON K7L 3N6, Canada
5
Queen’s Cancer Research Institute, Division of Cancer Biology and Genetics, Kingston, ON K7L 3N6, Canada
*
Author to whom correspondence should be addressed.
Technologies 2025, 13(10), 434; https://doi.org/10.3390/technologies13100434
Submission received: 7 August 2025 / Revised: 6 September 2025 / Accepted: 21 September 2025 / Published: 27 September 2025
(This article belongs to the Special Issue Application of Artificial Intelligence in Medical Image Analysis)

Abstract

Colorectal cancer (CRC) remains a leading global health challenge, with early and accurate diagnosis crucial for effective treatment. Histopathological evaluation, the current diagnostic gold standard, faces limitations including subjectivity, delayed results, and reliance on well-prepared tissue slides. Mass spectrometry imaging (MSI) offers a complementary approach by providing molecular-level information, but its high dimensionality and the scarcity of labeled data present unique challenges for traditional supervised learning. In this study, we present the first implementation of foundation models for MSI-based cancer classification using desorption electrospray ionization (DESI) data. We evaluate multiple architectures adapted from other domains, including a spectral classification model known as FACT, which leverages audio–language pretraining. Compared to conventional machine learning approaches, these foundation models achieved superior performance, with FACT achieving the highest cross-validated balanced accuracy ( 93.27 % ± 3.25 % ) and AUROC ( 98.4 % ± 0.7 % ). Ablation studies demonstrate that these models retain strong performance even under reduced data conditions, highlighting their potential for generalizable and scalable MSI-based cancer diagnostics. Future work will explore the integration of spatial and multi-modal data to enhance clinical utility.

Graphical Abstract

1. Introduction

Colorectal cancer (CRC) is the third most diagnosed cancer worldwide and the second leading cause of cancer-related deaths [1]. The incidence and mortality of CRC is increasing year over year, with the latest reported statistics of approximately 1.93 million new cases and 900,000 deaths in 2022, and projections indicating a 68% increase by 2040 [2,3]. More than half of all cases can be attributed to modifiable risk factors, such as poor diet patterns, alcohol consumption, smoking, physical inactivity, and obesity [4]. The presence of non-cancerous diseases, such as inflammatory bowel disease and ulcerative colitis, further increases the risk of developing CRC [5,6]. Carcinogenesis in CRC typically takes 10–15 years and is characterized by the progression of benign polyps in the colonic or rectal epithelium to a malignant tumor [6]. Early diagnosis is essential, with a five-year survival rate of 90% for CRC diagnosed at an early stage, relative to 13% for those diagnosed later; yet only 40% of CRC cases are detected in the early stages [7]. This is due to the expression of CRC in early stages and in younger individuals; symptoms mimic non-cancerous conditions, often presenting as benign, leading to delayed intervention [8].
The current gold standard for clinical diagnosis of CRC is the histopathological evaluation of a tissue biopsy sample by a pathologist [6]. Emerging technologies, such as mass spectrometry imaging (MSI), can be used as a complementary approach to histopathology, utilizing metabolic signatures to provide valuable insights through molecular-level interactions. MSI has already significantly advanced cancer research through the identification of biomarkers associated with different cancer subtypes. This technique maps the spatial distribution of biomolecules (i.e., lipids, peptides, proteins, etc.) within a tissue sample whilst preserving its morphology [9]. Desorption electrospray ionization (DESI) is one of the MSI technologies. DESI-MSI concurrently ionizes and samples tissue in a grid, such that each pixel of the resulting mass spectrometry image contains thousands of ions, expressed in a mass spectrum, that represent the individual biomolecules.
The complexity of MSI data, due to the sheer volume and dimensionality of the pixel-level spectra, introduces unique challenges for downstream analysis. Each image generated through DESI-MSI is not a typical visual representation, but a dense matrix of mass-to-charge (m/z) values, requiring specialized processing techniques beyond conventional image analysis. Standard models trained on RGB or grayscale images fail to capture the spectral complexity or spatial distribution of biomolecules encoded in MSI data. Additionally, MSI datasets often suffer from low signal-to-noise ratios, irregular pixel coverage, and missing values—artifacts that make consistent pattern extraction difficult.
To overcome these limitations, deep learning (DL) has increasingly been applied not only to MSI but across the broader spectrum of medical imaging, where it has demonstrated success in cancer detection and diagnosis.
In the realm of medical imaging, DL models have shown impressive results in the detection and diagnosis of colorectal, pancreatic, ovarian, and breast cancer, with comparable or superior performance to radiologists [10,11,12,13]. In addition, the development of foundation models has further revolutionized cancer diagnostics. Foundation models are trained on significant amounts of data and are characterized by their ability to generalize across multiple tasks. Medical foundation models such as MedSAM [14] and BioMedParse [15] have been trained on extensive medical image datasets across various imaging modalities for the purpose of organ and lesion segmentation. Finetuning these models for specific segmentation tasks has shown improved performance relative to previous DL approaches and has been used to enhance cancer detection [16,17]. In terms of diagnosis, a number of models have been developed to identify various cancer types from whole-slide images. Notably, a RESNET model trained for 8-class classification of colorectal histopathology slides achieved a staggering 99% classification accuracy on tumorous tissue [18].
While such DL models reduce diagnostic subjectivity, they are still dependent on the quality and availability of a prepared histopathology slide. Recently, DL models for point-based mass spectrometry modalities have been implemented in clinical settings, and alleviate the reliance on structural information, instead of focusing on molecular signatures. One such example, is the intraoperative characterization of tissues in surgical resections. ImSpect [19] surpassed previous benchmarks with an area under the receiver operating curve of 81.6%, demonstrating solid performance in margin assessment. On a broader scale, foundation models have been created or adapted to point-based mass spectrometry. For example, Deep Representations Empowering the Annotation of Mass Spectra, or DreaMS [20], is a foundation model trained on an extensive tandem mass spectrometry dataset. Similarly, our group recently introduced FACT, a foundation model for assessing cancer tissue margins from rapid evaporative ionization mass spectrometry (REIMS) [21]. FACT leverages transfer learning from a language–audio foundation model, capitalizing on the structural similarity between spectral data and audio signals to enable accurate classification of cancerous tissue.
While promising developments have emerged for point-based modalities, such as FACT and ImSpect, extending these successes to the more complex MSI domain presents additional challenges. The absence of large-scale annotated datasets in MSI complicates supervised learning and has prompted researchers to explore DL strategies—particularly self-supervised and contrastive learning techniques—that can extract informative representations from unlabeled data. Recent studies have applied convolutional neural networks (CNNs) to cluster ion images based on molecular co-localization without requiring manual annotations. Models like DeepION [22] embed ion images into low-dimensional representations optimized to reflect spatial and spectral similarity, allowing for more efficient comparison and downstream classification. These representation learning strategies are now being applied to cancer detection tasks. For instance, massNet [23] is a deep learning framework developed to process and classify MSI data using fully connected neural networks, offering scalability and speed while addressing the data’s high dimensionality. It has demonstrated robust performance in tumor classification tasks, reinforcing its potential for clinical cancer diagnostics. In a related direction, Li et al. proposed a self-supervised method that fuses MSI with high-resolution whole-slide images to identify colorectal cancer biomarkers, achieving high classification accuracy (F1-score = 0.9069) even in data-scarce settings [24].
Despite the growing application of deep learning in MSI analysis, existing models often lack generalizability and require retraining for each new sample. Foundation models offer a promising solution to this limitation, though none have yet been developed for this modality. Unlike in radiology or histopathology—where models like MedSAM and BioMedParse demonstrate strong cross-task adaptability—MSI remains limited to task-specific architectures trained on relatively small datasets. This is largely due to the unique structure of MSI data: each pixel contains a high-dimensional mass spectrum rather than a fixed RGB value, making it incompatible with conventional vision models without substantial preprocessing. In addition, MSI datasets are often scarce and rarely standardized, making them unsuitable for training large, generalizable models.
Here, we repurpose FACT for application to MSI, rather than the point based mass spectrometry modality for which it was originally developed. We compare it to DreaMS and machine learning baselines, along with running several ablations to assess the performance under varying training strategies, dataset sizes, and overall architectures. To our knowledge, this represents the first implementation of foundation models for analyzing MSI data.

2. Materials and Methods

In this study, we utilize foundation models to classify cancerous tissue in mass spectrometry imaging data and compare them to traditional methods. The spectra were extracted from DESI-MSI, through the selection of representative regions of malignant and benign tissue. The spectra are broken up into tokens and fed into the respective model backbone, to ultimately be classified by a multi-layer perceptron (MLP). Each foundation model undergoes a two-stage training process: first, it is pretrained using either supervised or self-supervised learning to refine its feature representations, followed by finetuning for cancer classification. An overview of the entire workflow is illustrated in Figure 1. To ensure robust evaluation, we compare each model across a 10-fold cross-validation and perform statistical analyses.

2.1. Data

The data used in this study were obtained from CRC tissue samples from 10 randomly selected patients undergoing surgical resection at Kingston Health Sciences Centre (KHSC), Canada, as a part of a previously published study [25]. Tumour cross-sections were affixed to slides and analyzed using DESI-MSI in negative ionization mode (see Figure 2 for an illustration of the sampling procedure and resulting data). The same slides were subsequently H&E stained and annotated by trained pathologists. Samples included both malignant adenocarcinoma and adjacent non-malignant tissue regions from each case. Pathologists annotated regions of adenocarcinoma, serosa, inflammatory cells, submucosa, benign mucosa, and smooth muscle, where present. These annotated regions served as the basis for spectral extraction and classification, as described in Section 2.1.1.

2.1.1. Dataset Curation

For this study, pathologist annotations were grouped into two classes: cancerous and non-cancerous. The annotated histopathology slides were spatially registered to their corresponding MSI data using MassVision [26] software in Slicer 3D. Regions of interest (ROIs) were selected based on localized annotations within each tissue type. Following registration, we extracted a total of 16,678 spectra from labeled regions. This approach of spatially registering histology to MSI and selecting annotated ROIs for spectral extraction is widely used in MSI research [27], and forms a reliable basis for downstream supervised learning tasks. In addition, we extracted ∼147,000 spectra from unlabeled regions on the tissue surface, which were treated as a separate “unlabeled” class for pretraining purposes only.

2.1.2. Preprocessing

Slight shifts in m/z values between pixels are common in MSI data, making mass alignment a standard preprocessing step. To ensure consistent feature representation across patients, we aligned the m/z values globally across all 10 slides. We then performed signal normalization to the total ion current (TIC), the most widely used approach for the normalization of MSI data. We subsequently reduced the number of peaks to the 900 most abundant ions. This was achieved by calculating the sum of the intensity of each ion in our dataset and retaining the 900 ions with the largest sums. With the dataset fully preprocessed, we extracted the unlabeled class for use only in pretraining.

2.2. Models

We applied five models for tissue classification on the DESI-MSI data: a standard machine learning model, three models leveraging the Contrastive Language–Audio Pretraining (CLAP) [28] foundation model, and one additional foundation model trained on tandem mass spectrometry data. The first model, PCA-LDA, served as a traditional benchmark. Principal component analysis (PCA) was applied dynamically, retaining 99% of the variance in the data, followed by Linear Discriminant Analysis (LDA) to maximize class separation in the reduced space. This approach is commonly used in MSI analysis and provided a linear baseline for comparison.
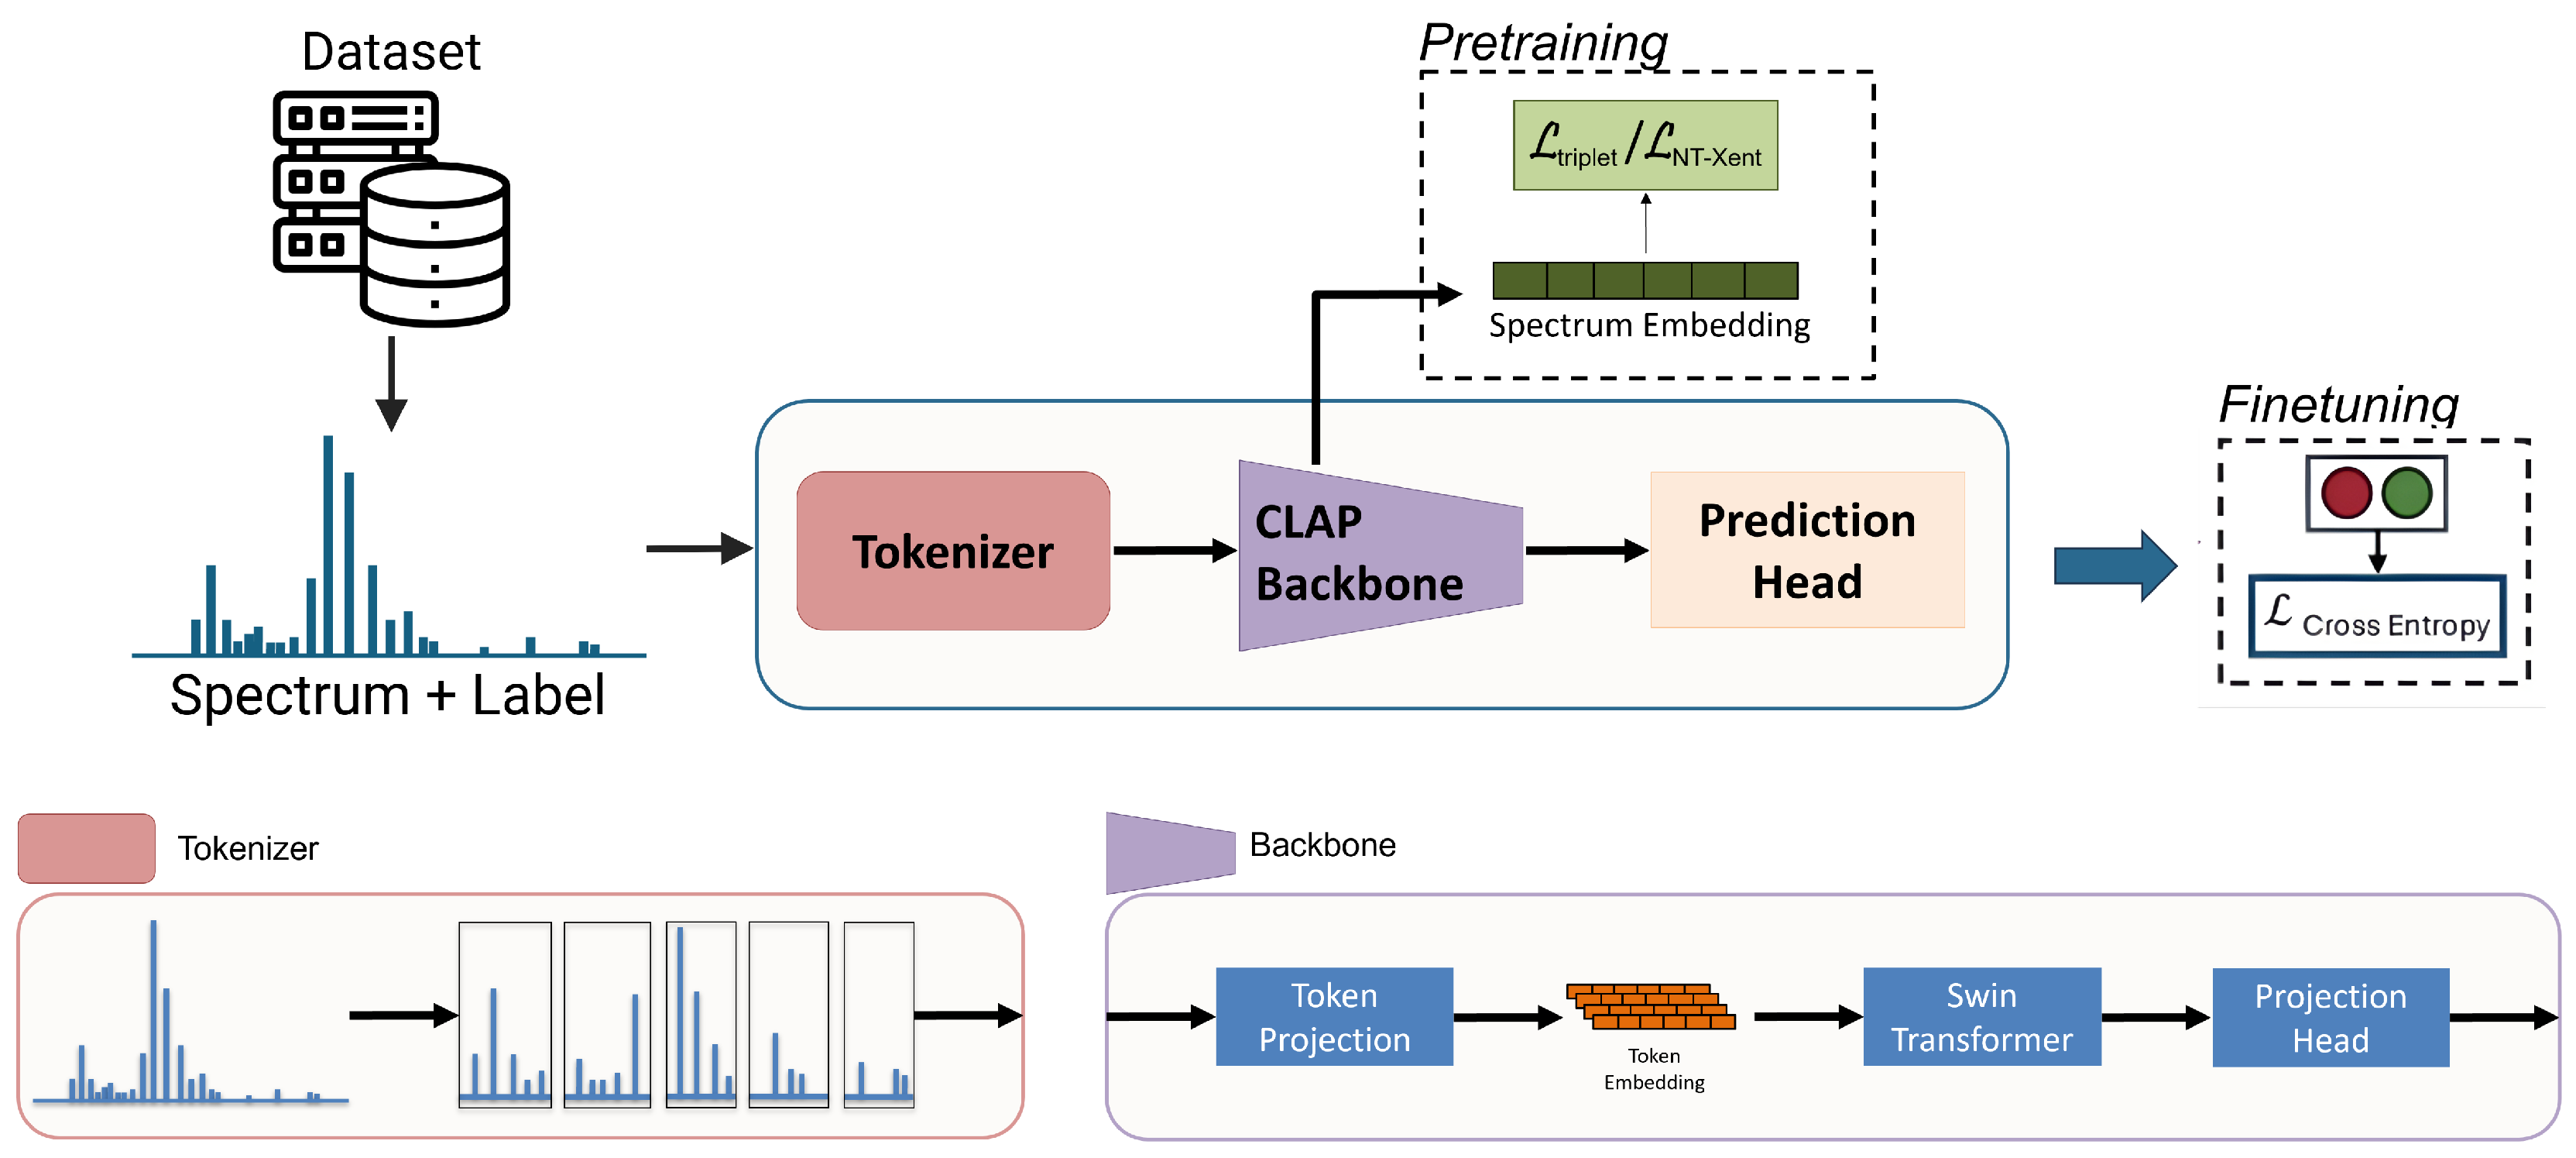
FACT employs transfer learning via the CLAP model to process and classify mass spectra, leveraging its capacity to interpret spectral patterns analogous to those found in audio signals. Since CLAP was originally developed as a general-purpose audio–language foundation model, repurposing it for spectral data enables cross-domain transfer of pretrained representations. The model backbone consists of the audio encoder from CLAP, along with its associated projection layers. These are preceded by a token projection layer and followed by an embedding projection head. The spectra are tokenized by splitting them into non-overlapping 64-bin windows, which are projected into a 96-dimensional embedding space before being passed to the audio encoder—a Swin transformer [29]—as a sequence. The encoder acts as a feature extractor, processing the tokens and combining the features in a 512-dimensional embedding vector. A 2-layer multi-layer perceptron (MLP) head is used to classify the input spectrum. This architecture (Figure 3) is also used for two other CLAP-based models in this study, which differ from FACT only in their pretraining strategies.
The final model we examine is Deep Representations Empowering the Annotation of Mass Spectra (DreaMS) [20], a foundation model originally trained on tandem mass spectrometry data. While tandem mass spectrometry and DESI differ in their acquisition methods, data output, and subsequent analysis, the core principle aligns; both data types contain ion intensity information in the form of mass spectra. In tandem mass spectrometry, the signal comes from the ionization of molecules, followed by the fragmentation and detection of the fragmented ions. DreaMS is designed to exploit fragmentation patterns, which are not present in DESI data; nevertheless, as one of the only foundation models tailored towards mass spectrometry, we include it in this study.

2.3. Training

2.3.1. Pretraining

We utilized the openly available FACT and DreaMS models and pretrained them to our specific task. To update the feature extractor for our task, the models were pretrained as described in [21], using triplet loss [30], a contrastive loss function widely used in metric learning. Triplet loss encourages the model to learn an embedding space where samples from the same class are closer together than those from different classes. Each triplet consists of an anchor (a), a positive sample (p) from the same class, and a negative sample (n) from a different class. The loss is defined as
L triplet ( a , p , n ) = max D ( a , p ) D ( a , n ) + margin , 0 ,
where D is the distance between embeddings. During pretraining, spectra from the same and different classes were used to form triplets, and we employed online hard negative mining to focus training on the most challenging negative examples. This setup encourages FACT to learn discriminative features in the embedding space, which is particularly useful for distinguishing between spectrally similar benign and malignant samples.
Given the large amount of unlabeled data and the demonstrated success of self-supervised learning in MSI, we also explored Simple Contrastive Learning of Representations (SimCLR) [31] for pretraining CLAP. SimCLR learns representations by maximizing agreement between differently augmented views of the same input (positive pairs) and minimizing agreement with other inputs (negative pairs). This makes it well suited for pretraining the CLAP audio encoder, as it extracts meaningful features from the signal data without requiring labels.
SimCLR’s performance depends heavily on effective data augmentation, which remains limited for mass spectrometry. To address this, we used the intensity-aware augmentation strategy proposed in [32] and introduced a channel dropout technique, where a subset of ion channels is randomly dropped from each spectrum. For optimization, we employed the normalized temperature-scaled cross entropy (NT-Xent) loss, which brings positive pairs closer and pushes apart negatives, encouraging the model to focus on a structure that is invariant to augmentation.
Throughout this paper, we refer to CLAP as the model using the publicly available CLAP weights without additional pretraining on MSI data and CLAP+SimCLR to refer to CLAP pretrained on MSI data using SimCLR.

2.3.2. Finetuning

After pretraining, the models were finetuned for the classification task. During this phase, the embeddings from the encoder were passed through an MLP head that outputs a 2D vector representing the class scores. The model was then trained using cross-entropy loss to correctly predict whether a sample is cancerous or non-cancerous. This helps adapt the pretrained features to the specific goal of cancer classification. We report the Area Under the Receiver Operating Characteristic curve (AUROC), balanced accuracy, specificity, and sensitivity.

2.4. Experiments

2.4.1. Model Evaluation

To evaluate model performance, the dataset was split patient-wise into training, validation, and test sets, to ensure no patient overlap and prevent data leakage. We utilize a 5-4-1 split, where data from five patients was used for training, four for testing, and one for validation. Using this configuration, we randomly generated 10 folds for cross-validation, which remained consistent across all experiments. This configuration allowed us to assess model robustness by limiting the training data. We applied feature normalization based on the training data for each fold, to ensure that all data ranged from 0 to 1.
Model performance was assessed quantitatively using balanced accuracy, sensitivity, and specificity, with a 0.5 decision threshold. Additionally, AUROC was reported to evaluate classification performance across a range of thresholds. To determine whether observed differences in performance were statistically significant across cross-validated folds, we employed a non-parametric testing framework suitable for repeated measures. We first applied the Friedman test to each evaluation metric to assess overall differences among models. For pairwise comparisons, we then used one-tailed Wilcoxon signed-rank tests to evaluate whether one model significantly outperformed another across folds. This test accounts for the paired structure of the data and does not assume normality. No correction for multiple comparisons was applied, as the number of directional hypotheses was limited and pre-specified based on prior findings. ChatGPT (GPT-4o, OpenAI) was used to perform the Wilcoxon signed-rank tests, and outputs were reviewed.
The results were qualitatively assessed using a custom-built deployment module. The module takes the DESI-MSI data for a given patient, performs preprocessing and pixel-wise prediction using the specified model checkpoint, and outputs a reconstructed image displaying the pixel-level classification results. Each prediction is mapped to its corresponding spatial (X, Y) coordinate, and pixels are color-coded by predicted class to generate an interpretable image. Optional input parameters, such as binary tissue masks, can be used to restrict predictions to foreground tissue regions.
We compared the classification performance of five models: PCA-LDA, DreaMS, and three CLAP-based variants—CLAP (no pretraining), CLAP + SimCLR (SimCLR pretraining), and FACT (triplet loss pretraining). These models were first evaluated under consistent conditions to assess baseline performance before further analysis through ablation studies.

2.4.2. Ablation Studies

Despite software advancements, the manual annotation of MSI data is still a labor-intensive process. Thus, to assess model robustness under a reduced data scenario, we finetuned the best performing models using a smaller dataset. To simulate less labeled data, we performed spatial downsampling by manually reducing the ROI selection by approximately 70% for each patient. Moving forward, this reduced dataset will be referred to as the small dataset, and the original dataset will be referred to as the large dataset. The models were trained using the small dataset and evaluated using the large dataset. This experiment tested the models’ ability to generalize when trained on less data, mimicking real-world scenarios, where labeled data can be scarce.
To assess the effect of data abundance on pretraining, we compared FACT and DreaMS models pretrained using the small dataset against those from the previous experiment. Additionally, to determine the impact of pretraining itself, we compared both models to their respective versions without any additional pretraining. In all cases, the small dataset was used for finetuning, and the large dataset was reserved for evaluation.

2.5. Implementation Details

All experiments were conducted using Python 3.11 and Pytorch 2.1. To ensure a fair comparison across all models, identical data splits and cross-validation folds were used. Preprocessing steps outlined in Section 2.1.2 were consistently applied to all models. Intensity-aware augmentation [32], with the addition of ion channel dropout was used for all models, aside from DreaMS, where it adversely affected performance. Hyperparameters were tuned via manual search based on performance on the validation set. All models were trained using AdamW with a learning rate of 5 × 10 5 , β 1 = 0.9 , β 2 = 0.999 , a weight decay of 0.01, and a batch size of 256. A maximum of 100 epochs and 25 epochs were performed for pretraining and finetuning, respectively, with early stopping employed when validation loss did not continue to improve. All training was conducted on the Queen’s School of Computing GPU cluster. A single NVIDIA A40 (48 GB) GPU (NVIDIA Corporation, Santa Clara, CA, USA) was used for all experiments, except for the SimCLR pretraining, which required two A40 GPUs to accommodate a batch size of 256. Pretraining with SimCLR took approximately 5 h for the large dataset and 57 min for the small dataset. Triplet-loss pretraining required approximately 30 min and 10 min for the large and small datasets, respectively. Finetuning across all models took approximately 20 min for the large dataset and 3 min for the small dataset. The deployment module runtime depends on the size of the input MSI file; on average, it produces a pixel-wise prediction map of the slide in approximately 4 min on a single A40 GPU. To account for class imbalance, weighted sampling was implemented in the deep learning models, and downsampling, using scikit-learn, was applied to PCA-LDA.

3. Results

3.1. Baseline Comparison

Table 1 highlights the results from our comparative analysis. FACT outperformed all models across every metric. Notably, balanced accuracy ( 87.96 % ± 5.77 ) was found to be statistically significantly higher (one-tailed Wilcoxon test, p-value < 0.05) than the other four models, and likewise for AUROC ( 95.7 % ± 3.3 ), aside from DreaMS.
While DreaMS and PCA-LDA did not outperform FACT, they still demonstrated better balanced accuracy and AUROC than CLAP and CLAP + SimCLR, with both differences being statistically significant. PCA-LDA was also the only model that had a higher sensitivity ( 84.28 % ± 14.38 ) relative to specificity ( 81.69 % ± 10.24 ). This may be attributed to the downsampling method, relative to the weighted sampling used for the DL models. Interestingly, the balanced accuracy of CLAP + SimCLR ( 82.42 % ± 3.88 ) was significantly higher relative to that of CLAP ( 74.53 % ± 4.62 ).

3.2. Ablation Studies

Figure 4 depicts the results of training on the large dataset relative to the small dataset. In comparing the performance of the models when trained on the small dataset, FACT achieved the highest mean AUROC ( 98.4 % ± 0.7 ) and balanced accuracy ( 93.27 % ± 3.25 ), outperforming both DreaMS (AUROC: 96.7 % ± 1.6 ; BalAcc: 86.98 % ± 3.20 ) and PCA-LDA (AUROC: 87.4 % ± 4.7 ; BalAcc: 79.43 % ± 5.33 ). These differences were statistically significant, with FACT outperforming all other models. DreaMS also showed statistical significance over PCA-LDA and CLAP in both metrics.
In comparing the performance of the models across the different training dataset sizes, both DreaMS and FACT demonstrated improved performance in AUROC and balanced accuracy compared to PCA-LDA and CLAP. FACT shows statistically significant improvement in terms of balanced accuracy and AUROC when finetuned on the small dataset. Similarly, DreaMS significantly improves in AUROC. It is important to note that in this scenario, both models were pretrained using the full dataset.
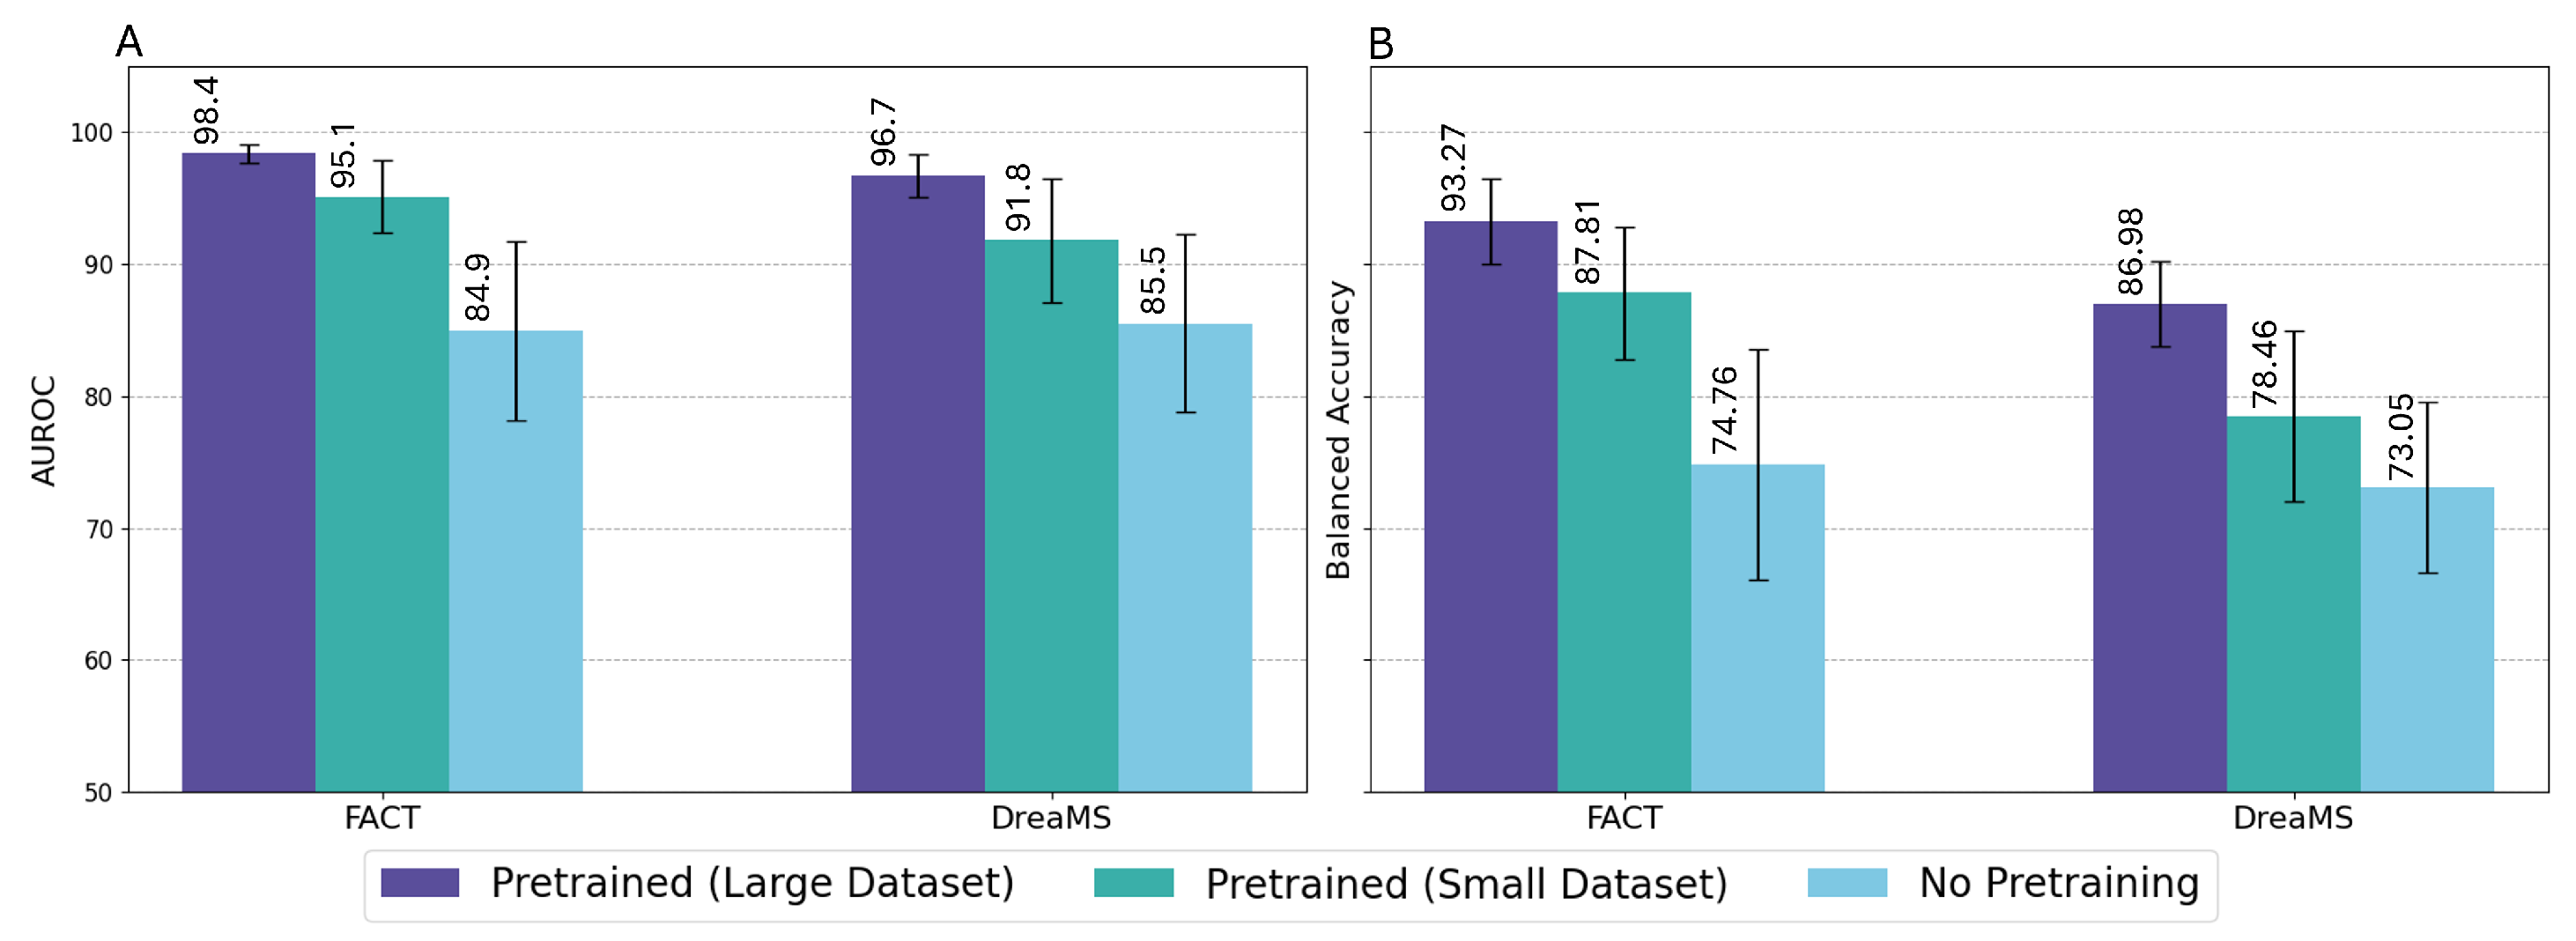
Figure 5 illustrates the impact of the pretraining dataset size on model performance for both DreaMS and FACT. Both models pretrained on the large dataset significantly outperformed their respective versions pretrained on the small dataset, confirming the benefit of having more annotated data for pretraining. FACT pretrained on the small dataset still achieved a significantly higher performance than the version with no pretraining, indicating the advantage of pretraining even with limited data. In contrast, DreaMS pretrained on the small dataset did not significantly outperform its non-pretrained counterpart, suggesting that limited data offers minimal benefit for its initialization. In the zero-shot scenario, DreaMS performed better than FACT, albeit not significantly, indicating slightly better generalizability. Notably, FACT pretrained on the small dataset significantly outperformed PCA-LDA in both balanced accuracy and AUROC, whereas DreaMS did not, further demonstrating FACT’s robustness in reduced data settings.

3.3. Qualitative Comparison

Figure 6 demonstrates the output of the deployment module for each of the five models from the comparative analysis. The pathologist-annotated histopathology slide is pictured as well. Noticeably, the output from the FACT model (Figure 6E) demonstrates better localization within the cancerous region than the other models.

4. Discussion

Our study evaluated the effectiveness of applying foundation models to classify colorectal cancer tissue using DESI-MSI data. We compared FACT to both traditional machine learning (PCA-LDA) and other deep learning-based models, including DreaMS and CLAP variants. Across all metrics and settings, FACT consistently achieved superior performance, demonstrating the promise of leveraging pretrained audio–language models for spectral data classification.
FACT’s performance gains appear to stem from its ability to learn transferable and discriminative representations from mass spectral data—likely due to the structural similarity between audio signals and spectral inputs. These findings are consistent with our prior work on FACT, where the model outperformed traditional and deep learning approaches on REIMS data. In this study, FACT again achieved significantly higher balanced accuracy and AUROC than both CLAP without pretraining and CLAP + SimCLR, suggesting that task-specific contrastive pretraining using triplet loss offers meaningful advantages over self-supervised alternatives when applied to DESI spectra.
That said, performance difference between CLAP and CLAP + SimCLR supports existing evidence that self-supervised learning is a viable strategy for MSI data. The relatively lower performance of CLAP + SimCLR may reflect the limited availability of robust data augmentation techniques for mass spectra, which SimCLR depends on heavily to learn invariant features. This limitation may also explain why CLAP + SimCLR underperformed relative to PCA-LDA—a simpler linear model—despite having a more complex architecture, as the lack of effective augmentations may have led to suboptimal representation learning.
Despite being a foundation model tailored to mass spectrometry, DreaMS underperformed relative to FACT. This is likely attributable to the differences between tandem mass spectrometry (for which DreaMS was designed) and DESI-MSI. DESI spectra tend to be simpler and less fragmented, possibly limiting the benefits of a fragmentation-aware model like DreaMS. Nonetheless, DreaMS outperformed baseline CLAP models, indicating that some level of generalization exists even across different mass spectrometry modalities.

4.1. Ablation Studies

The dataset size ablation underscores FACT’s strong generalization capability. While PCA-LDA suffered a noticeable drop in sensitivity under reduced training data, FACT not only maintained performance but improved in several metrics, including balanced accuracy and AUROC. This may suggest that the model’s inductive bias, shaped by contrastive pretraining, enables it to perform well even when finetuned on limited examples. Notably, the small dataset may have contained fewer ambiguous or noisy samples, potentially highlighting the importance of high-quality finetuning data for optimal model performance, particularly when paired with appropriate pretraining.
DreaMS also demonstrated resilience with less annotated data, outperforming PCA-LDA and the CLAP-based models. However, FACT remained the top performer, showing significantly better performance across all metrics. These results are especially relevant for clinical deployment, where large-scale annotations are often infeasible. FACT’s ability to learn from sparse, representative regions—and extrapolate across the tissue—could streamline diagnostic workflows and reduce pathologist workload.
The pretraining ablation isolates the role of both pretraining itself and the dataset used to perform it. As shown in Figure 5, both FACT and DreaMS benefited significantly from pretraining on the full dataset compared to no pretraining, validating the use of contrastive objectives for spectral data.
FACT continued to outperform even when pretrained on the small dataset. Notably, it showed no statistically significant difference from its performance when pretrained and finetuned on the large dataset versus the small dataset. Its performance also remained significantly better than that of CLAP finetuned on the large dataset, highlighting the effectiveness of task-specific contrastive pretraining using triplet loss. This suggests that FACT’s improvements stem from the quality of the learned representations during pretraining allowing it to generalize well even with limited data. In contrast, DreaMS pretrained on the small dataset showed no significant advantage over its non-pretrained version, indicating its performance is more sensitive to the volume of pretraining data.
Together, these findings highlight FACT’s robustness across both stages—pretraining and finetuning—and its relative independence from large labeled or unlabeled datasets. This flexibility makes it a strong candidate for deployment in varied clinical environments where data access and quality may vary.

4.2. Clinical Relevance and Use Cases

Binary classification aligns with certain clinical tasks, such as rapid intraoperative margin evaluation. However, in more detailed diagnostic settings, a finer-grained classification may be required, such as distinguishing adenoma from carcinoma or classifying tissue into histological subtypes. As such, while the binary approach is a useful proof-of-concept and could assist in flagging regions of interest, extending the model to multi-class settings remains an important future direction for broader clinical utility.
Beyond the classification task itself, it is also important to consider how such models may be integrated into real-world clinical workflows, which vary significantly depending on the diagnostic context—such as intraoperative margin assessment via frozen sections, diagnostic preoperative biopsies, and evaluation of surgical resections. Each of these settings involves unique diagnostic challenges, turnaround times, and decision criteria. Future work should include collaboration with practicing pathologists to adapt model outputs (e.g., probability heatmaps, uncertainty estimates) to better support clinical decision-making across diverse pathology workflows. Such clinician-guided development will be essential for translating spectral AI tools like FACT into usable clinical decision support systems.

4.3. Limitations and Future Work

This study was limited to a single cancer type: colorectal adenocarcinoma. As such, it remains uncertain how well the models would generalize to other cancer types, particularly those with differing metabolic or morphological profiles. The original FACT model used data collected from a different cancer type, and differing metabolic signatures relative to colorectal adenocarcinoma may help explain variation in performance trends across studies. Other notable differences in data collection and preprocessing, such as peak selection (peak picking vs. binning), may have also played a role in the improved results from the original study. Furthermore, this study was conducted using data from a single DESI-MSI system, and mass spectrometry data are known to vary based on instrument parameters, calibration, and sample preparation. As such, future work should assess the generalizability of the model across multiple institutions and acquisition protocols to ensure robustness in diverse clinical settings. Another key limitation is that our approach bypassed spatial information by analyzing individual spectra in isolation. Cancer disrupts local structure, and spatial features could help detect such patterns, potentially improving sensitivity to subtle variations. Prior studies in MSI have shown that incorporating spatial information can improve classification performance, though adapting such approaches to the high dimensionality of MSI data remains computationally challenging [23,24,33]. Future work will explore spatial-aware architectures to better capture local context and integrate structural features. To enhance clinical value, future work should involve pathologist input to identify practical needs, such as estimating tumor percentage or providing margin confidence scores. Expanding to multi-class classification, as well as incorporating spatial information and multi-modal data (e.g., MSI with histology or radiology), may also support more comprehensive diagnostics. Ultimately, integration into digital pathology platforms with explainable outputs would facilitate clinical adoption.

5. Conclusions

In this study, we present the first implementation of foundation models to mass spectrometry imaging data. Through the use of FACT, we reinforce the applicability of using the audio arm of a text–audio foundation model for meaningful feature extraction for downstream tissue classification in mass spectra. Our results demonstrate that FACT consistently outperforms both traditional machine learning models and alternative deep learning approaches across multiple evaluation metrics. Its performance held strong even in reduced-data scenarios, highlighting its robustness and potential for real-world clinical deployment where labeled data is often limited. These findings align with our prior work on FACT and extend its utility beyond REIMS to a new mass spectrometry modality, DESI-MSI. By showing that pretrained audio-based models can effectively classify mass spectra, this study opens a path for more scalable and generalizable approaches to cancer diagnostics. As MSI becomes integrated into clinical workflows, tools like FACT could support faster, more reproducible tissue assessments with reduced manual burden on pathologists. Future work will explore the integration of spatial and multi-modal data to further improve diagnostic accuracy and broaden the model’s clinical relevance across diverse cancer types.

Author Contributions

Conceptualization: C.J.B.N., J.F.R., S.V., G.F., and P.M.; methodology and software: A.G., A.J., M.F., and P.M.; validation and data curation: M.K., N.I., D.H., K.Y.M.R., C.J.B.N., and S.V.; writing, review, and editing: A.G., A.J., M.F., M.K., N.I., D.H., K.Y.M.R., C.J.B.N., J.F.R., S.V., G.F., and P.M. All authors have read and agreed to the published version of the manuscript.

Funding

This research was funded by the Natural Sciences and Engineering Research Council of Canada, Canadian Institutes for Health Research, Canada Foundation for Innovation—John R Evans fund. J.F.R is supported by the Department of Surgery Britton Smith Chair, and the Chair in Surgical Innovation. P.M is supported by the Canada CIFAR AI Chair and Canada Research Chair in Medical Informatics. G.F. is supported by the Canada Research Chair in Computer-Integrated Surgery.

Institutional Review Board Statement

Not applicable.

Informed Consent Statement

Not applicable.

Data Availability Statement

The MSI data was originally published for the MassVision [26] software and is available from the MetaboLights [34] repository under study identifier MTBLS12868. The code repository for this paper is publicly available at https://github.com/med-i-lab/FACT-DESI (accessed on 20 September 2025).

Conflicts of Interest

The authors declare no conflicts of interest.

References

  1. World Health Organization. Colorectal Cancer Fact Sheet. Available online: https://www.who.int/news-room/fact-sheets/detail/colorectal-cancer (accessed on 14 November 2024).
  2. Morgan, E.; Arnold, M.; Gini, A.; Lorenzoni, V.; Cabasag, C.J.; Laversanne, M.; Vignat, J.; Ferlay, J.; Murphy, N.; Bray, F. Global burden of colorectal cancer in 2020 and 2040: Incidence and mortality estimates from GLOBOCAN. Gut 2023, 72, 338–344. [Google Scholar] [CrossRef] [PubMed]
  3. World Cancer Research Fund. Colorectal Cancer Statistics. Available online: https://www.wcrf.org/preventing-cancer/cancer-statistics/colorectal-cancer-statistics/ (accessed on 10 March 2025).
  4. Siegel, R.L.; Wagle, N.S.; Cercek, A.; Smith, R.A.; Jemal, A. Colorectal cancer statistics, 2023. CA A Cancer J. Clin. 2023, 73, 233–254. [Google Scholar] [CrossRef] [PubMed]
  5. Duan, B.; Zhao, Y.; Bai, J.; Wang, B.J.; Duan, X.; Luo, X.; Zhang, R.; Pu, Y.; Kou, M.; Lei, J.; et al. Colorectal Cancer: An Overview. In Gastrointestinal Cancers; Morgado-Diaz, J.A., Ed.; Exon Publications: Brisbane City, QLD, Australia, 2022; Chapter 1. [Google Scholar] [CrossRef]
  6. Sawicki, T.; Ruszkowska, M.; Danielewicz, A.; Niedźwiedzka, E.; Arłukowicz, T.; Przybyłowicz, K.E. A Review of Colorectal Cancer in Terms of Epidemiology, Risk Factors, Development, Symptoms and Diagnosis. Cancers 2021, 13, 2025. [Google Scholar] [CrossRef] [PubMed]
  7. Hossain, M.S.U.; Karuniawati, H.; Jairoun, A.A.; Urbi, Z.; Ooi, D.J.; John, A.; Lim, Y.C.; Kibria, K.M.K.; Mohiuddin, A.K.M.; Ming, L.C.; et al. Colorectal cancer: A review of carcinogenesis, global epidemiology, current challenges, risk factors, preventive and treatment strategies. Cancers 2022, 14, 1732. [Google Scholar] [CrossRef]
  8. Zhou, D.; Tian, F.; Tian, X.; Sun, L.; Huang, X.; Zhao, F.; Zhou, N.; Chen, Z.; Zhang, Q.; Yang, M.; et al. Diagnostic evaluation of a deep learning model for optical diagnosis of colorectal cancer. Nat. Commun. 2020, 11, 2961. [Google Scholar] [CrossRef]
  9. Duncan, K.D.; Pětrošová, H.; Lum, J.J.; Goodlett, D.R. Mass spectrometry imaging methods for visualizing tumor heterogeneity. Curr. Opin. Biotechnol. 2024, 86, 103068. [Google Scholar] [CrossRef]
  10. Liu, K.; Wu, T.; Chen, P.; Tsai, Y.; Roth, H.; Wu, M.; Liao, W.; Wang, W. Deep learning to distinguish pancreatic cancer tissue from non-cancerous pancreatic tissue: A retrospective study with cross-racial external validation. Lancet Digit. Health 2020, 2, e303–e313. [Google Scholar] [CrossRef]
  11. Gao, Y.; Zeng, S.; Xu, X.; Li, H.; Yao, S. Deep learning-enabled pelvic ultrasound images for accurate diagnosis of ovarian cancer in China: A retrospective, multicentre, diagnostic study. Lancet Digit. Health 2022, 4, e179–e187. [Google Scholar] [CrossRef]
  12. Kim, H.; Kim, H.; Han, B.; Kim, K.; Han, K.; Nam, H.; Lee, E.; Kim, E.; Chang, J. Changes in cancer detection and false-positive recall in mammography using artificial intelligence: A retrospective, multireader study. Lancet Digit. Health 2020, 2, e138–e148. [Google Scholar] [CrossRef]
  13. Yao, L.; Li, S.; Tao, Q.; Mao, Y.; Dong, J.; Lu, C.; Han, C.; Qiu, B.; Huang, Y.; Huang, X.; et al. Deep learning for colorectal cancer detection in contrast-enhanced CT without bowel preparation: A retrospective, multicentre study. EBioMedicine 2024, 104, 105183. [Google Scholar] [CrossRef]
  14. Ma, J.; He, Y.; Li, F.; Han, L.; You, C.; Wang, B. Segment anything in medical images. Nat. Commun. 2024, 15, 654. [Google Scholar] [CrossRef]
  15. Zhao, T.; Gu, Y.; Yang, J.; Usuyama, N.; Lee, H.H.; Kiblawi, S.; Naumann, T.; Gao, J.; Crabtree, A.; Abel, J.; et al. A foundation model for joint segmentation, detection and recognition of biomedical objects across nine modalities. Nat. Methods 2025, 22, 166–176. [Google Scholar] [CrossRef]
  16. Wilson, P.F.R.; To, M.N.N.; Jamzad, A.; Gilany, M.; Harmanani, M.; Elghareb, T.; Fooladgar, F.; Wodlinger, B.; Abolmaesumi, P.; Mousavi, P. ProstNFound: Integrating Foundation Models with Ultrasound Domain Knowledge and Clinical Context for Robust Prostate Cancer Detection. In Proceedings of the Medical Image Computing and Computer Assisted Intervention—MICCAI 2024, Marrakesh, Morocco, 6–10 October 2024; Springer Nature: Cham, Switzerland, 2024; Volume LNCS 15006. [Google Scholar]
  17. Swinburne, N.C.; Jackson, C.B.; Pagano, A.M.; Stember, J.N.; Schefflein, J.; Marinelli, B.; Panyam, P.K.; Autz, A.; Chopra, M.S.; Holodny, A.I.; et al. Foundational Segmentation Models and Clinical Data Mining Enable Accurate Computer Vision for Lung Cancer. J. Imaging Inform. Med. 2024, 38, 1552–1562. [Google Scholar] [CrossRef]
  18. Ben Hamida, A.; Devanne, M.; Weber, J.; Truntzer, C.; Derangère, V.; Ghiringhelli, F.; Forestier, G.; Wemmert, C. Deep learning for colon cancer histopathological images analysis. Comput. Biol. Med. 2021, 136, 104730. [Google Scholar] [CrossRef]
  19. Connolly, L.; Fooladgar, F.; Jamzad, A.; Kaufmann, M.; Syeda, A.; Ren, K.; Abolmaesumi, P.; Rudan, J.F.; McKay, D.; Fichtinger, G.; et al. ImSpect: Image-driven self-supervised learning for surgical margin evaluation with mass spectrometry. Int. J. Comput. Assist. Radiol. Surg. 2024, 19, 1129–1136. [Google Scholar] [CrossRef] [PubMed]
  20. Bushuiev, R.; Bushuiev, A.; Samusevich, R.; Brungs, C.; Sivic, J.; Pluskal, T. Emergence of molecular structures from repository-scale self-supervised learning on tandem mass spectra. ChemRxiv 2024. [Google Scholar] [CrossRef]
  21. Farahmand, M.; Jamzad, A.; Fooladgar, F.; Connolly, L.; Kaufmann, M.; Ren, K.Y.M.; Rudan, J.; McKay, D.; Fichtinger, G.; Mousavi, P. FACT: Foundation Model for Assessing Cancer Tissue Margins with Mass Spectrometry. Int. J. Comput. Assist. Radiol. Surg. 2025, 20, 1097–1104. [Google Scholar] [CrossRef] [PubMed]
  22. Guo, L.; Xie, C.; Miao, R.; Xu, J.; Xu, X.; Fang, J.; Wang, X.; Liu, W.; Liao, X.; Wang, J.; et al. DeepION: A Deep Learning-Based Low-Dimensional Representation Model of Ion Images for Mass Spectrometry Imaging. Anal. Chem. 2024, 96, 3829–3836. [Google Scholar] [CrossRef]
  23. Abdelmoula, W.M.; Stopka, S.A.; Randall, E.C.; Regan, M.; Agar, J.N.; Sarkaria, J.N.; Wells, W.M.; Kapur, T.; Agar, N.Y.R. massNet: Integrated processing and classification of spatially resolved mass spectrometry data using deep learning for rapid tumor delineation. Bioinformatics 2022, 38, 2015–2021. [Google Scholar] [CrossRef]
  24. Li, Z.; Sun, Y.; An, F.; Chen, H.; Liao, J. Self-supervised clustering analysis of colorectal cancer biomarkers based on multi-scale whole slides image and mass spectrometry imaging fused images. Talanta 2023, 263, 124727. [Google Scholar] [CrossRef]
  25. Kaufmann, M.; Iaboni, N.; Jamzad, A.; Hurlbut, D.; Ren, K.Y.M.; Rudan, J.F.; Mousavi, P.; Fichtinger, G.; Varma, S.; Caycedo-Marulanda, A.; et al. Metabolically Active Zones Involving Fatty Acid Elongation Delineated by DESI-MSI Correlate with Pathological and Prognostic Features of Colorectal Cancer. Metabolites 2023, 13, 508. [Google Scholar] [CrossRef]
  26. Jamzad, A.; Warren, J.; Syeda, A.; Kaufmann, M.; Iaboni, N.; Nicol, C.J.B.; Rudan, J.; Ren, K.Y.M.; Hurlbut, D.; Varma, S.; et al. MassVision: An Open-Source End-to-End Platform for AI-Driven Mass Spectrometry Imaging Analysis. Anal. Chem. 2025, ASAP. [Google Scholar] [CrossRef]
  27. Connolly, L.; Jamzad, A.; Kaufmann, M.; Farquharson, C.E.; Ren, K.; Rudan, J.F.; Fichtinger, G.; Mousavi, P. Combined Mass Spectrometry and Histopathology Imaging for Perioperative Tissue Assessment in Cancer Surgery. J. Imaging 2021, 7, 203. [Google Scholar] [CrossRef] [PubMed]
  28. Wu, Y.; Chen, K.; Zhang, T.; Hui, Y.; Nezhurina, M.; Berg-Kirkpatrick, T.; Dubnov, S. Large-scale Contrastive Language-Audio Pretraining with Feature Fusion and Keyword-to-Caption Augmentation. arXiv 2024, arXiv:2211.06687. [Google Scholar] [CrossRef]
  29. Liu, Z.; Lin, Y.; Cao, Y.; Hu, H.; Wei, Y.; Zhang, Z.; Lin, S.; Guo, B. Swin Transformer: Hierarchical Vision Transformer using Shifted Windows. arXiv 2021, arXiv:2103.14030. [Google Scholar] [CrossRef]
  30. Chechik, G.; Sharma, V.; Shalit, U.; Bengio, S. Large scale online learning of image similarity through ranking. J. Mach. Learn. Res. 2010, 11, 1109–1135. [Google Scholar]
  31. Chen, T.; Kornblith, S.; Norouzi, M.; Hinton, G. A simple framework for contrastive learning of visual representations. In Proceedings of the 37th International Conference on Machine Learning, Virtual, 13–18 July 2020; Volume 119, pp. 1597–1607. [Google Scholar]
  32. Fooladgar, F.; Jamzad, A.; Connolly, L.; Santilli, A.M.L.; Kaufmann, M.; Ren, K.Y.M.; Abolmaesumi, P.; Rudan, J.F.; McKay, D.; Fichtinger, G.; et al. Uncertainty estimation for margin detection in cancer surgery using mass spectrometry. Int. J. Comput. Assist. Radiol. Surg. 2022, 17, 2305–2313. [Google Scholar] [CrossRef]
  33. Alexandrov, T. Spatial Metabolomics and Imaging Mass Spectrometry in the Age of Artificial Intelligence. Annu. Rev. Biomed. Data Sci. 2020, 3, 61–87. [Google Scholar] [CrossRef]
  34. Yurekten, O.; Payne, T.; Tejera, N.; Amaladoss, F.X.; Martin, C.; Williams, M.; O’Donovan, C. MetaboLights: Open data repository for metabolomics. Nucleic Acids Res. 2023, 52, D640–D646. [Google Scholar] [CrossRef]
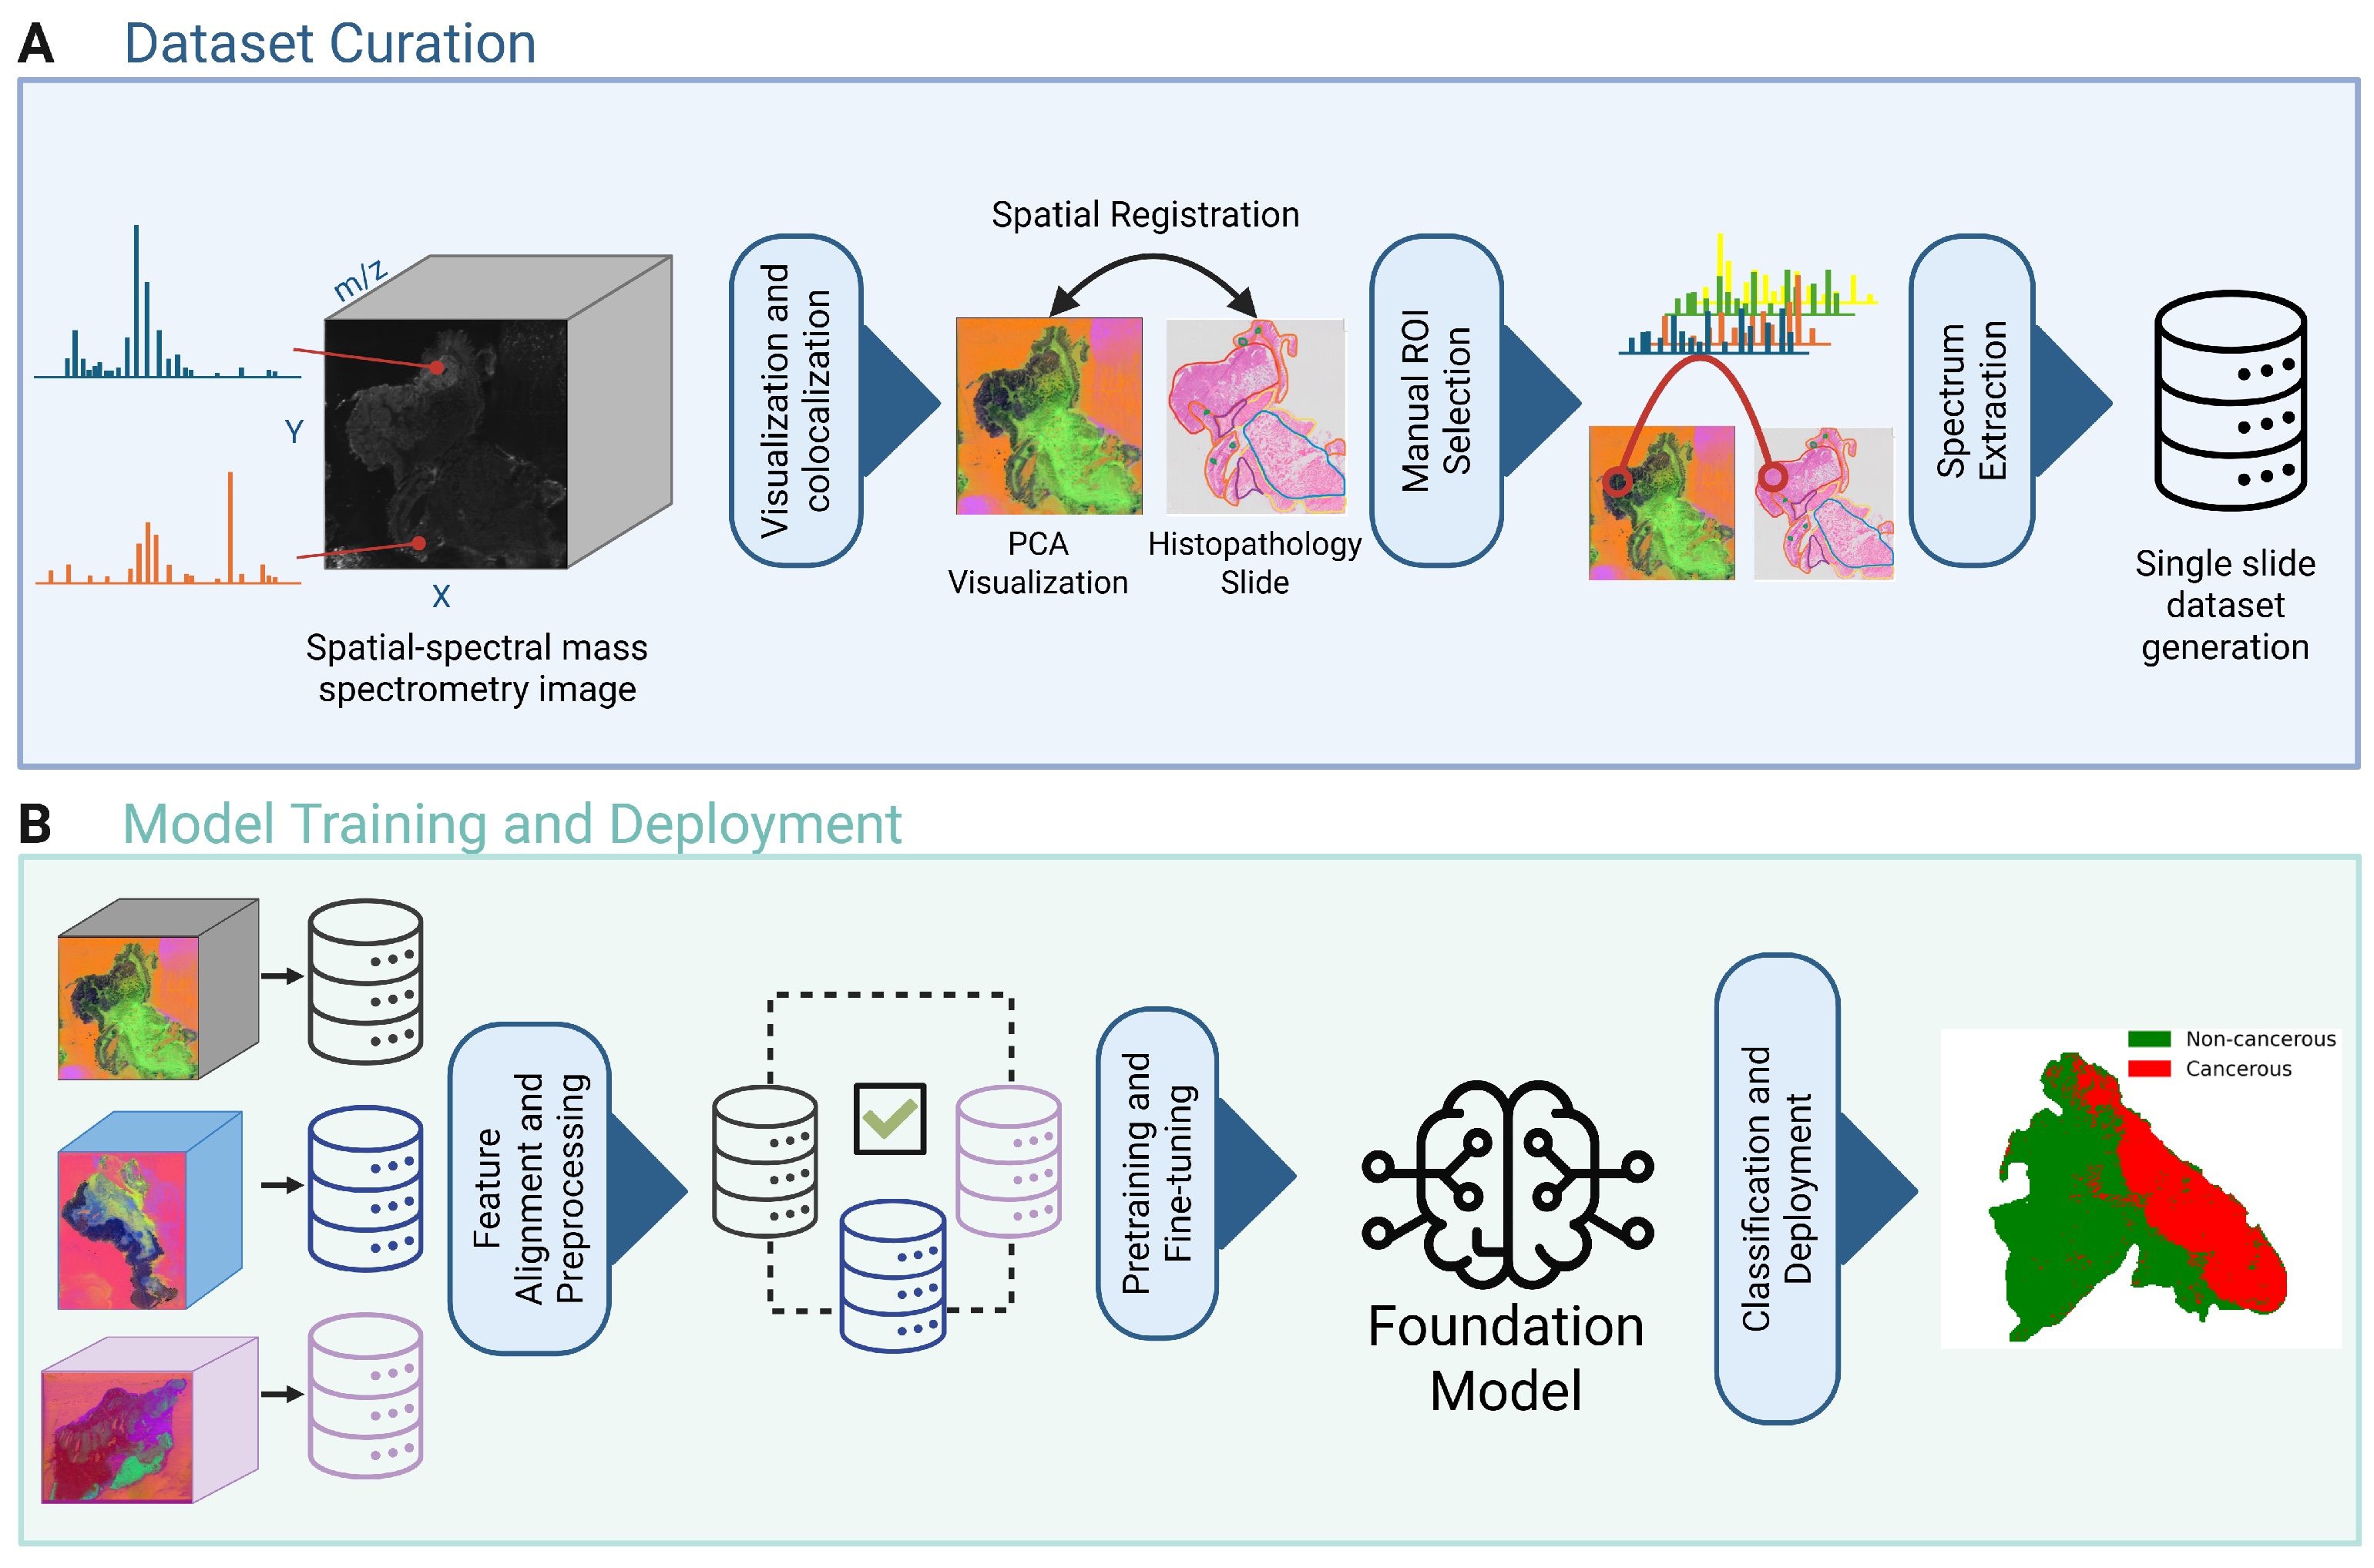
Figure 1. Overview of analytical workflow. (A) Dataset curation; DESI-MSI data is visualized and spatially registered to pathologist-annotated histopathology slides. Regions of interest (ROIs) are manually selected and the spectra from the selected region are extracted to a dataset file. (B) Model training and deployment; spectra from multiple dataset files are aligned and normalized, creating a single dataset for input into the FACT model. The deployment module outputs the pixel-wise prediction for a single whole DESI-MSI sample.
Technologies 13 00434 g001
Figure 2. (A) Schematic of desorption electrospray ionization (DESI) mass spectrometry, where charged droplets impact the tissue surface to desorb ions for analysis. (B) Resulting principal component analysis (PCA) visualization of DESI-MSI data from a tissue biopsy sample. Each pixel corresponds to a mass spectrum, with representative spectra shown for selected pixels.
Technologies 13 00434 g002
Figure 3. FACT model architecture. Input mass spectra are tokenized into non-overlapping binned windows. Each token is projected into a 96-dimensional embedding space and passed through the CLAP audio encoder backbone, implemented as a Swin transformer, as a sequence. The resulting 512-dimensional embedding is passed through a projection head and a 2-layer MLP prediction head for binary classification of spectra as cancerous or non-cancerous. Pretraining is performed using either triplet loss or NT-Xent loss, while downstream classification is optimized with cross-entropy loss.
Technologies 13 00434 g003
Figure 4. Performance of models under different dataset sizes. The figure illustrates the mean and standard deviation of AUROC (A) and balanced accuracy (B) under 10-fold cross-validation with finetuning on the large and small datasets.
Technologies 13 00434 g004
Figure 5. Performance of foundation models under varying pretraining dataset sizes. The figure illustrates the mean and standard deviation of AUROC (A) and balanced accuracy (B) under 10-fold cross-validation.
Technologies 13 00434 g005
Figure 6. Output of deployment module. (A) Output from PCA-LDA model; (B) output from CLAP+SimCLR model; (C) output from CLAP model; (D) output from DreaMS model; (E) output from FACT model; (F) pathologist-annotated histopathology slide. Predictions were rendered pixel-wise by mapping each spectrum to its spatial coordinate and color-coding pixels as cancerous (red) or non-cancerous (green).
Technologies 13 00434 g006
Table 1. Performance comparison across models trained on the large dataset. All values are reported as the mean ± standard deviation of the 10-fold cross validation.
ModelBalanced AccuracySensitivitySpecificityAUROC
PCA-LDA 83.45 % ± 5.13 84.02 % ± 14.17 82.89 % ± 9.93 91.7 % ± 4.7
CLAP 74.53 % ± 4.62 66.74 % ± 13.92 82.32 % ± 8.83 84.4 % ± 4.5
CLAP+SimCLR 82.42 % ± 3.88 76.72 % ± 10.73 87.46 % ± 7.13 91.8 % ± 3.7
DreaMS 85.21 % ± 2.88 81.22 % ± 6.56 89.21 % ± 5.38 94.0 % ± 2.2
FACT 87 . 96 % ± 5 . 77 85 . 98 % ± 10 . 05 89 . 94 % ± 7 . 98 95 . 7 % ± 3 . 3
Disclaimer/Publisher’s Note: The statements, opinions and data contained in all publications are solely those of the individual author(s) and contributor(s) and not of MDPI and/or the editor(s). MDPI and/or the editor(s) disclaim responsibility for any injury to people or property resulting from any ideas, methods, instructions or products referred to in the content.