The U-Net Family for Epicardial Adipose Tissue Segmentation and Quantification in Low-Dose CT
Abstract
1. Introduction
1.1. Related Work
1.2. Contributions
2. Data and Methods
2.1. Data Set-Up
2.2. Methods Description
2.2.1. The 3D U-Net
2.2.2. The 3D Attention U-Net
2.2.3. DAU-Net
2.2.4. U-Net++
3. Experiments and Results
3.1. Experiment Set-Up
3.2. Results
3.2.1. Four-Fold Cross-Validation
3.2.2. Hold-Out Test
3.3. Quantitative Analysis of EAT Volume
4. Discussion
Future Work
5. Conclusions
Author Contributions
Funding
Institutional Review Board Statement
Informed Consent Statement
Data Availability Statement
Conflicts of Interest
Abbreviations
| EAT | Epicardial adipose tissue |
| CT | Computed tomography |
| NCCT | Non-contrast CT |
| CCTA | CT angiography |
| MRI | Magnetic resonance images |
| DSC | Dice similarity coefficient |
| mIoU | Mean intersection of union |
| GPU | Graphical processing unit |
| CNN | Convolutional neural network |
| ReLU | Rectified linear unit |
| AG | Attention gate |
| BN | Batch normalization |
References
- Sacher, F.; Roberts-Thomson, K.; Maury, P.; Tedrow, U.; Nault, I.; Steven, D.; Hocini, M.; Koplan, B.; Leroux, L.; Derval, N. Epicardial ventricular tachycardia ablation: A multicenter safety study. J. Am. Coll. Cardiol. 2010, 55, 2366–2372. [Google Scholar] [CrossRef] [PubMed]
- Ouwens, D.; Sell, H.; Greulich, S.; Eckel, J. The role of epicardial and perivascular adipose tissue in the pathophysiology of cardiovascular disease. J. Cell. Mol. Med. 2010, 14, 2223–2234. [Google Scholar] [CrossRef]
- Mancio, J.; Azevedo, D.; Saraiva, F.; Azevedo, A.; Pires-Morais, G.; Leite-Moreira, A.; Falcao-Pires, I.; Lunet, N.; Bettencourt, N. Epicardial adipose tissue volume assessed by computed tomography and coronary artery disease: A systematic review and meta-analysis. Eur. Heart J. Cardiovasc. Imaging 2018, 19, 490–497. [Google Scholar] [CrossRef]
- Willens, H.; Byers, P.; Chirinos, J.; Labrador, E.; Hare, J.; Marchena, E. Effects of weight loss after bariatric surgery on epicardial fat measured using echocardiography. Am. J. Cardiol. 2007, 99, 1242–1245. [Google Scholar] [CrossRef] [PubMed]
- Natale, F.; Tedesco, M.; Mocerino, R.; Simone, V.; Di Marco, G.; Aronne, L.; Credendino, M.; Siniscalchi, C.; Calabro, P.; Cotrufo, M. Others Visceral adiposity and arterial stiffness: Echocardiographic epicardial fat thickness reflects, better than waist circumference, carotid arterial stiffness in a large population of hypertensives. Eur. J. Echocardiogr. 2009, 10, 549–555. [Google Scholar] [CrossRef] [PubMed]
- Nagayama, Y.; Nakamura, N.; Itatani, R.; Oda, S.; Kusunoki, S.; Takahashi, H.; Nakaura, T.; Utsunomiya, D.; Yamashita, Y. Epicardial fat volume measured on nongated chest CT is a predictor of coronary artery disease. Eur. Radiol. 2019, 29, 3638–3646. [Google Scholar] [CrossRef]
- Rodrigues, É; Morais, F.; Morais, N.; Conci, L.; Neto, L.; Conci, A. A novel approach for the automated segmentation and volume quantification of cardiac fats on computed tomography. Comput. Methods Programs Biomed. 2016, 123, 109–128. [Google Scholar] [CrossRef]
- Kazemi, A.; Keshtkar, A.; Rashidi, S.; Aslanabadi, N.; Khodadad, B.; Esmaeili, M. Segmentation of cardiac fats based on Gabor filters and relationship of adipose volume with coronary artery disease using FP-Growth algorithm in CT scans. Biomed. Phys. Eng. Express 2020, 6, 055009. [Google Scholar] [CrossRef]
- Zhang, Q.; Zhou, J.; Zhang, B.; Jia, W.; Wu, E. Automatic Epicardial Fat Segmentation and Quantification of CT Scans Using Dual U-Nets With a Morphological Processing Layer. IEEE Access 2020, 8, 128032–128041. [Google Scholar] [CrossRef]
- Hoori, A.; Hu, T.; Lee, J.; Al-Kindi, S.; Rajagopalan, S.; Wilson, D. Deep learning segmentation and quantification method for assessing epicardial adipose tissue in CT calcium score scans. Sci. Rep. 2022, 12, 2276. [Google Scholar] [CrossRef]
- Qu, J.; Chang, Y.; Sun, L.; Li, Y.; Si, Q.; Yang, M.; Li, C.; Zhang, X. Deep Learning-Based Approach for the Automatic Quantification of Epicardial Adipose Tissue from Non-Contrast CT. Cogn. Comput. 2022, 14, 1392–1404. [Google Scholar] [CrossRef]
- He, X.; Guo, B.; Lei, Y.; Wang, T.; Fu, Y.; Curran, W.; Zhang, L.; Liu, T.; Yang, X. Automatic segmentation and quantification of epicardial adipose tissue from coronary computed tomography angiography. Phys. Med. Biol. 2020, 65, 095012. [Google Scholar] [CrossRef] [PubMed]
- Zlokolica, V.; Krstanović, L.; Velicki, L.; Popović, B.; Janev, M.; Obradović, R.; Ralević, N.; Jovanov, L.; Babin, D. Semiautomatic Epicardial fat segmentation based on fuzzy c-means clustering and geometric ellipse fitting. J. Healthc. Eng. 2017, 2017, 5817970. [Google Scholar] [CrossRef] [PubMed]
- Li, X.; Sun, Y.; Xu, L.; Greenwald, S.; Zhang, L.; Zhang, R.; You, H.; Yang, B. Automatic quantification of epicardial adipose tissue volume. Med. Phys. 2021, 48, 4279–4290. [Google Scholar] [CrossRef]
- West, H.; Siddique, M.; Williams, M.; Volpe, L.; Desai, R.; Lyasheva, M.; Thomas, S.; Dangas, K.; Kotanidis, C.; Tomlins, P. Deep-learning for epicardial adipose tissue assessment with computed tomography: Implications for cardiovascular risk prediction. JACC Cardiovasc. Imaging 2023, 16, 800–816. [Google Scholar] [CrossRef]
- Bard, A.; Raisi-Estabragh, Z.; Ardissino, M.; Lee, A.; Pugliese, F.; Dey, D.; Sarkar, S.; Munroe, P.; Neubauer, S.; Harvey, N. Others Automated quality-controlled cardiovascular magnetic resonance pericardial fat quantification using a convolutional neural network in the UK Biobank. Front. Cardiovasc. Med. 2021, 8, 567. [Google Scholar] [CrossRef]
- Nakazato, R.; Shmilovich, H.; Tamarappoo, B.; Cheng, V.; Slomka, P.; Berman, D.; Dey, D. Interscan reproducibility of computer-aided epicardial and thoracic fat measurement from noncontrast cardiac CT. J. Cardiovasc. Comput. Tomogr. 2011, 5, 172–179. [Google Scholar] [CrossRef]
- Yalamanchili, R.; Dey, D.; Kukure, U.; Nakazato, R.; Berman, D.; Kakadiaris, I. Knowledge-based quantification of pericardial fat in non-contrast CT data. Med. Imaging Image Process. 2010, 7623, 76231X. [Google Scholar]
- Ding, X.; Terzopoulos, D.; Diaz-Zamudio, M.; Berman, D.; Slomka, P.; Dey, D. Automated epicardial fat volume quantification from non-contrast CT. Med. Imaging Image Process. 2014, 9034, 90340I. [Google Scholar]
- Ding, X.; Terzopoulos, D.; Diaz-Zamudio, M.; Berman, D.; Slomka, P.; Dey, D. Automated pericardium delineation and epicardial fat volume quantification from noncontrast CT. Med. Phys. 2015, 42, 5015–5026. [Google Scholar] [CrossRef]
- Shahzad, R.; Bos, D.; Metz, C.; Rossi, A.; Kirişli, H.; Lugt, A.; Klein, S.; Witteman, J.; Feyter, P.; Niessen, W. Automatic quantification of epicardial fat volume on non-enhanced cardiac CT scans using a multi-atlas segmentation approach. Med. Phys. 2013, 40, 091910. [Google Scholar] [CrossRef]
- Kazemi, A.; Keshtkar, A.; Rashidi, S.; Aslanabadi, N.; Khodadad, B.; Esmaeili, M. Segmentation of Cardiac Epicardial and Pericardial Fats by Using Gabor Filter Bank Based GLCM. In Proceedings of the 2019 26th National And 4th International Iranian Conference On Biomedical Engineering (ICBME), Tehran, Iran, 27–28 November 2019; pp. 177–182. [Google Scholar]
- Norlén, A.; Alvén, J.; Molnar, D.; Enqvist, O.; Norrlund, R.; Br Berg, J.; Bergström, G.; Kahl, F. Automatic pericardium segmentation and quantification of epicardial fat from computed tomography angiography. J. Med. Imaging 2016, 3, 034003. [Google Scholar] [CrossRef] [PubMed]
- Kazemi, A.; Keshtkar, A.; Rashidi, S.; Aslanabadi, N.; Khodadad, B.; Esmaeili, M. Automated Segmentation of Cardiac Fats Based on Extraction of Textural Features from Non-Contrast CT Images. In Proceedings of the 2020 25th International Computer Conference, Computer Society Of Iran (CSICC), Tehran, Iran, 25–26 January 2020; pp. 1–7. [Google Scholar]
- Albuquerque, V.; Rodrigues, D.; Ivo, R.; Peixoto, S.; Han, T.; Wu, W.; Rebouças Filho, P. Fast fully automatic heart fat segmentation in computed tomography datasets. Comput. Med. Imaging Graph. 2020, 48, 101674. [Google Scholar] [CrossRef] [PubMed]
- Chen, C.; Qin, C.; Qiu, H.; Tarroni, G.; Duan, J.; Bai, W.; Rueckert, D. Deep learning for cardiac image segmentation: A review. Front. Cardiovasc. Med. 2020, 7, 25. [Google Scholar] [CrossRef]
- Ronneberger, O.; Fischer, P.; Brox, T. U-net: Convolutional networks for biomedical image segmentation. In Proceedings of the International Conference on Medical Image Computing and Computer-Assisted Intervention, Munich, Germany, 5–9 October 2015; pp. 234–241. [Google Scholar]
- Çiçek, Ö.; Abdulkadir, A.; Lienkamp, S.; Brox, T.; Ronneberger, O. 3D U-Net: Learning dense volumetric segmentation from sparse annotation. In Proceedings of the International Conference On Medical Image Computing And Computer-assisted Intervention, Athens, Greece, 17–21 October 2016; pp. 424–432. [Google Scholar]
- Milletari, F.; Navab, N.; Ahmadi, S. V-net: Fully convolutional neural networks for volumetric medical image segmentation. In Proceedings of the 2016 Fourth International Conference On 3D Vision (3DV), Stanford, CA, USA, 25–28 October 2016; pp. 565–571. [Google Scholar]
- Oktay, O.; Schlemper, J.; Folgoc, L.; Lee, M.; Heinrich, M.; Misawa, K.; Mori, K.; McDonagh, S.; Hammerla, N.; Kainz, B. Attention u-net: Learning where to look for the pancreas. arXiv 2018, arXiv:1804.03999. [Google Scholar]
- Zhou, Z.; Siddiquee, M.; Tajbakhsh, N.; Liang, J. Unet++: A nested u-net architecture for medical image segmentation. In Proceedings of the Deep Learnin, Granada, Spain, 20 September 2018; pp. 3–11. [Google Scholar]
- Lee, C.; Xie, S.; Gallagher, P.; Zhang, Z.; Tu, Z. Deeply-supervised nets. In Proceedings of the Eighteenth International Conference on Artificial Intelligence and Statistics, Cadiz, Spain, 9–11 May 2015; Volume 38, pp. 562–570. Available online: http://proceedings.mlr.press/v38/lee15a.html (accessed on 19 February 2019).
- Commandeur, F.; Goeller, M.; Betancur, J.; Cadet, S.; Doris, M.; Chen, X.; Berman, D.; Slomka, P.; Tamarappoo, B.; Dey, D. Deep learning for quantification of epicardial and thoracic adipose tissue from non-contrast CT. IEEE Trans. Med. Imaging 2018, 37, 1835–1846. [Google Scholar] [CrossRef]
- Commandeur, F.; Goeller, M.; Razipour, A.; Cadet, S.; Hell, M.; Kwiecinski, J.; Chen, X.; Chang, H.; Marwan, M.; Achenbach, S. Others Fully automated CT quantification of epicardial adipose tissue by deep learning: A multicenter study. Radiol. Artif. Intell. 2019, 1, e190045. [Google Scholar] [CrossRef]
- Santini, G.; Latta, D.; Vatti, A.; Ripoli, A.; Chiappino, S.; Piagneri, V.; Chiappino, D.; Martini, N. Deep Learning for pericardial fat extraction and evaluation on a population study. MedRxiv 2020. [Google Scholar] [CrossRef]
- Guo, S.; Liu, X.; Zhang, H.; Lin, Q.; Xu, L.; Shi, C.; Gao, Z.; Guzzo, A.; Fortino, G. Causal knowledge fusion for 3D cross-modality cardiac image segmentation. Inf. Fusion 2023, 99, 101864. [Google Scholar] [CrossRef]
- Guo, S.; Xu, L.; Feng, C.; Xiong, H.; Gao, Z.; Zhang, H. Multi-level semantic adaptation for few-shot segmentation on cardiac image sequences. Med. Image Anal. 2021, 73, 102170. [Google Scholar] [CrossRef] [PubMed]
- Vonder, M.; Aalst, C.; Vliegenthart, R.; Ooijen, P.; Kuijpers, D.; Gratama, J.; Koning, H.; Oudkerk, M. Coronary artery calcium imaging in the ROBINSCA trial: Rationale, design, and technical background. Acad. Radiol. 2018, 25, 118–128. [Google Scholar] [CrossRef] [PubMed]
- Mihl, C.; Loeffen, D.; Versteylen, M.; Takx, R.; Nelemans, P.; Nijssen, E.; Vega-Higuera, F.; Wildberger, J.; Das, M. Automated quantification of epicardial adipose tissue (EAT) in coronary CT angiography; comparison with manual assessment and correlation with coronary artery disease. J. Cardiovasc. Comput. Tomogr. 2014, 8, 215–221. [Google Scholar] [CrossRef] [PubMed]
- Fedorov, A.; Beichel, R.; Kalpathy-Cramer, J.; Finet, J.; Fillion-Robin, J.; Pujol, S.; Bauer, C.; Jennings, D.; Fennessy, F.; Sonka, M. Others 3D Slicer as an image computing platform for the Quantitative Imaging Network. Magn. Reson. Imaging 2012, 30, 1323–1341. [Google Scholar] [CrossRef] [PubMed]
- Long, J.; Shelhamer, E.; Darrell, T. Fully convolutional networks for semantic segmentation. In Proceedings of the IEEE Conference on Computer Vision and Pattern Recognition, Boston, MA, USA, 7–12 June 2015; pp. 3431–3440. [Google Scholar]
- Simonyan, K.; Zisserman, A. Very deep convolutional networks for large-scale image recognition. arXiv 2015, arXiv:1409.1556. [Google Scholar]
- Liu, L.; Wolterink, J.; Brune, C.; Veldhuis, R. Anatomy-aided deep learning for medical image segmentation: A review. Phys. Med. Biol. 2021, 66, 11TR01. [Google Scholar] [CrossRef]
- Minaee, S.; Boykov, Y.; Porikli, F.; Plaza, A.; Kehtarnavaz, N.; Terzopoulos, D. Image segmentation using deep learning: A survey. IEEE Trans. Pattern Anal. Mach. Intell. 2021, 44, 3523–3542. [Google Scholar]

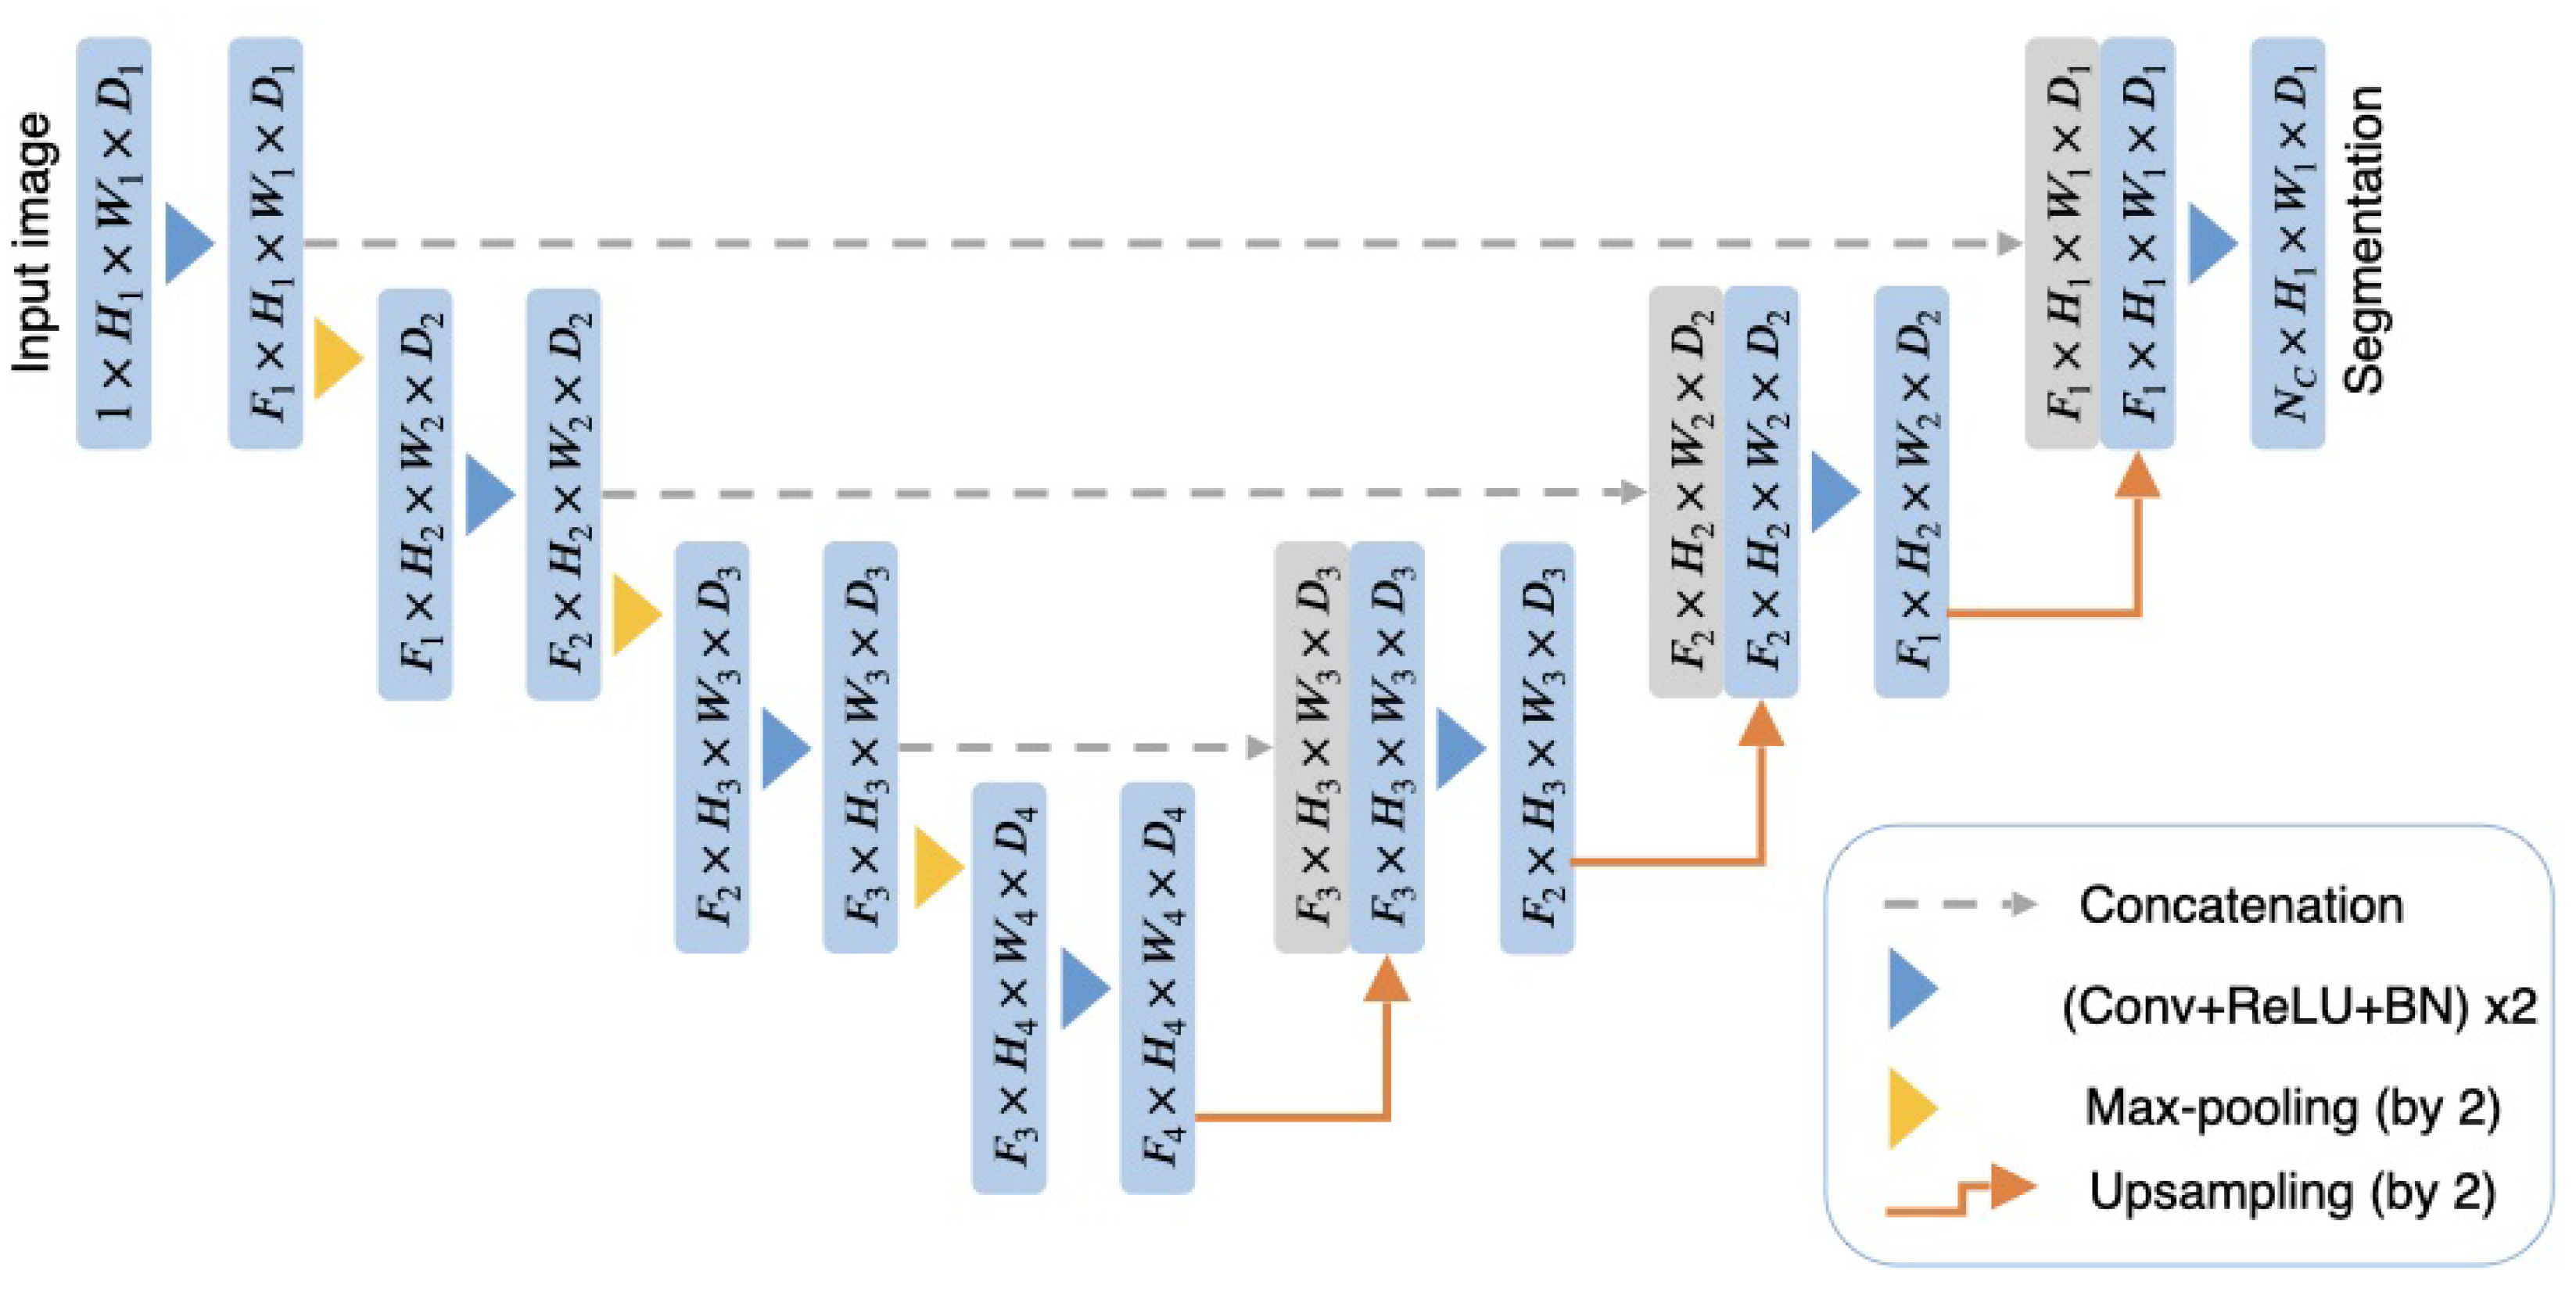
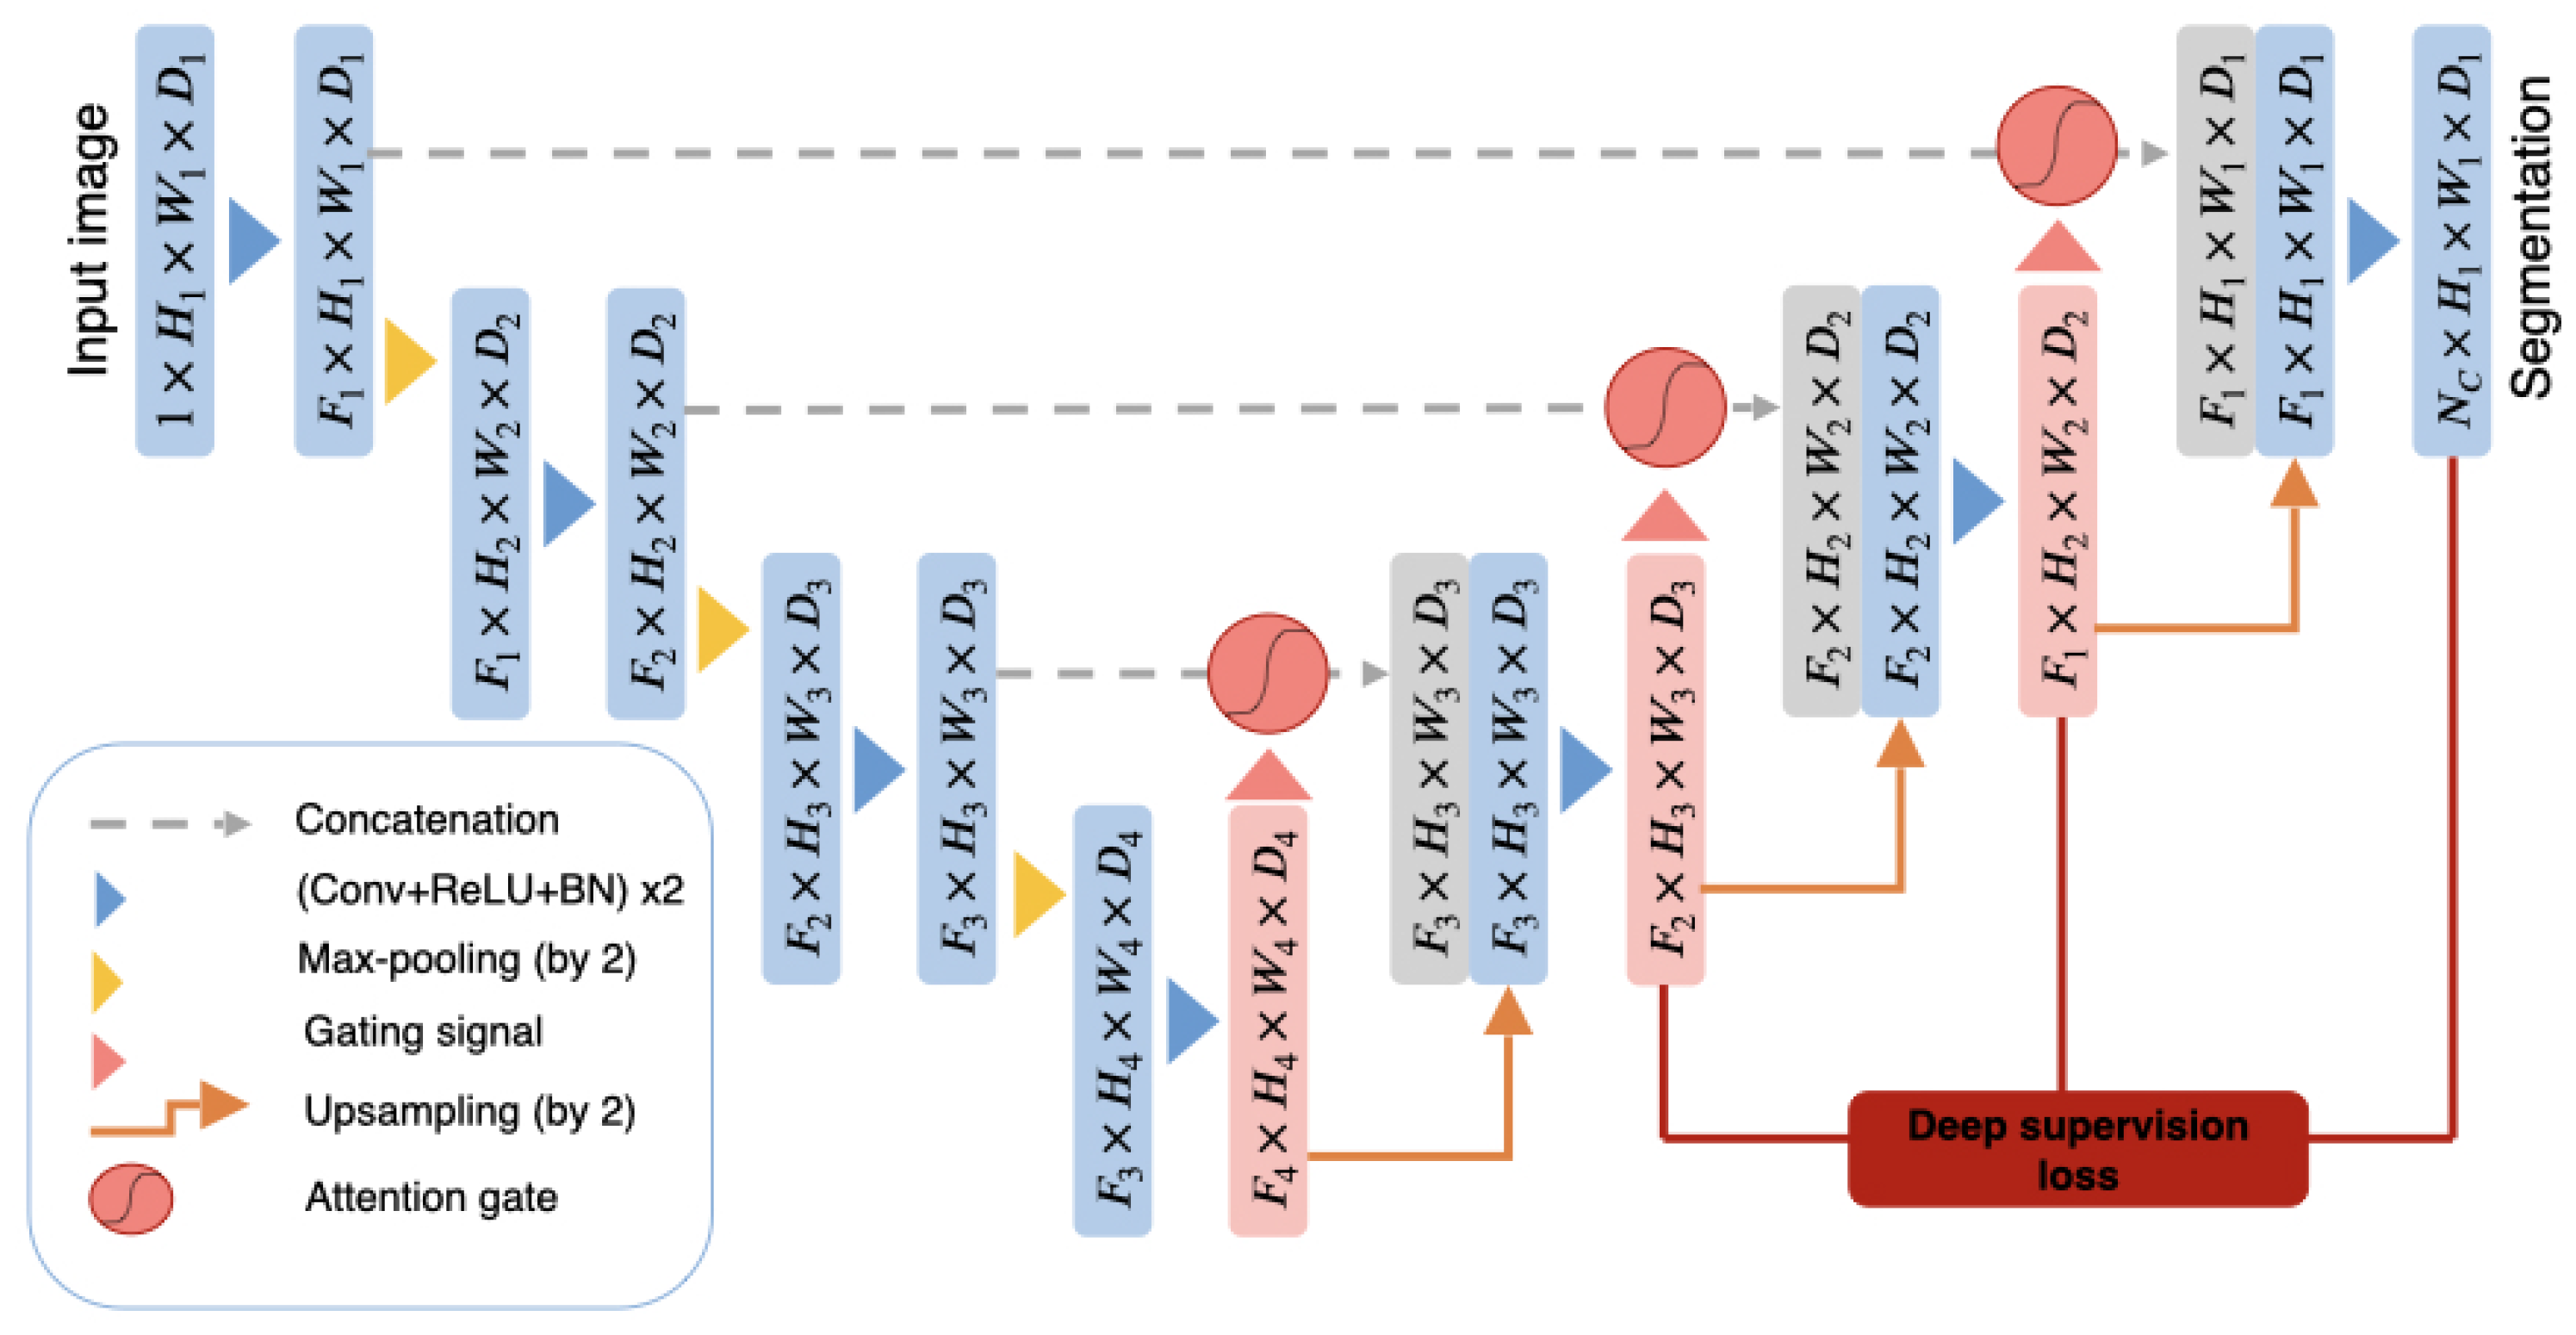
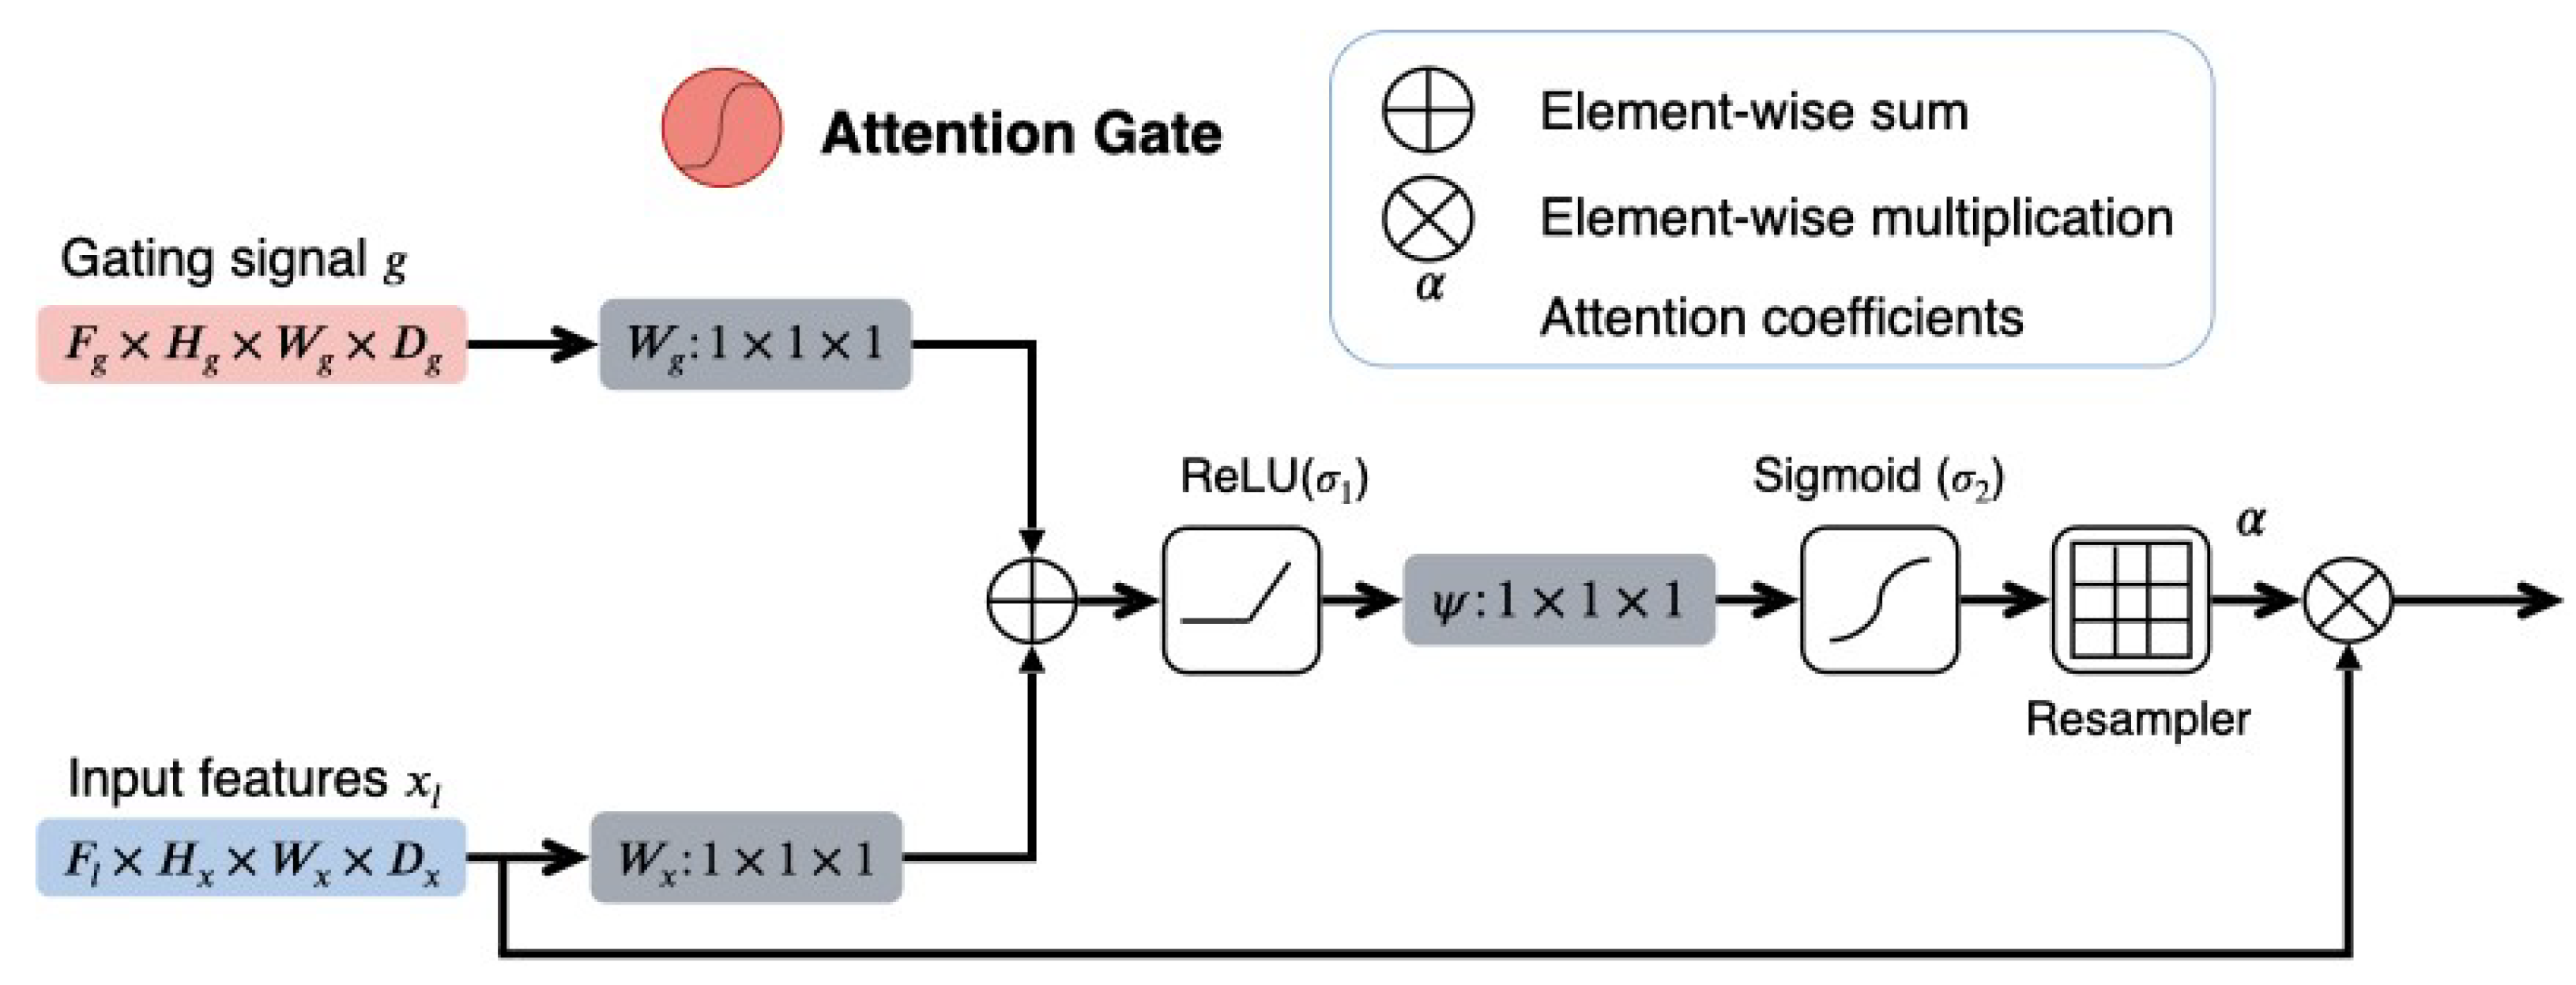
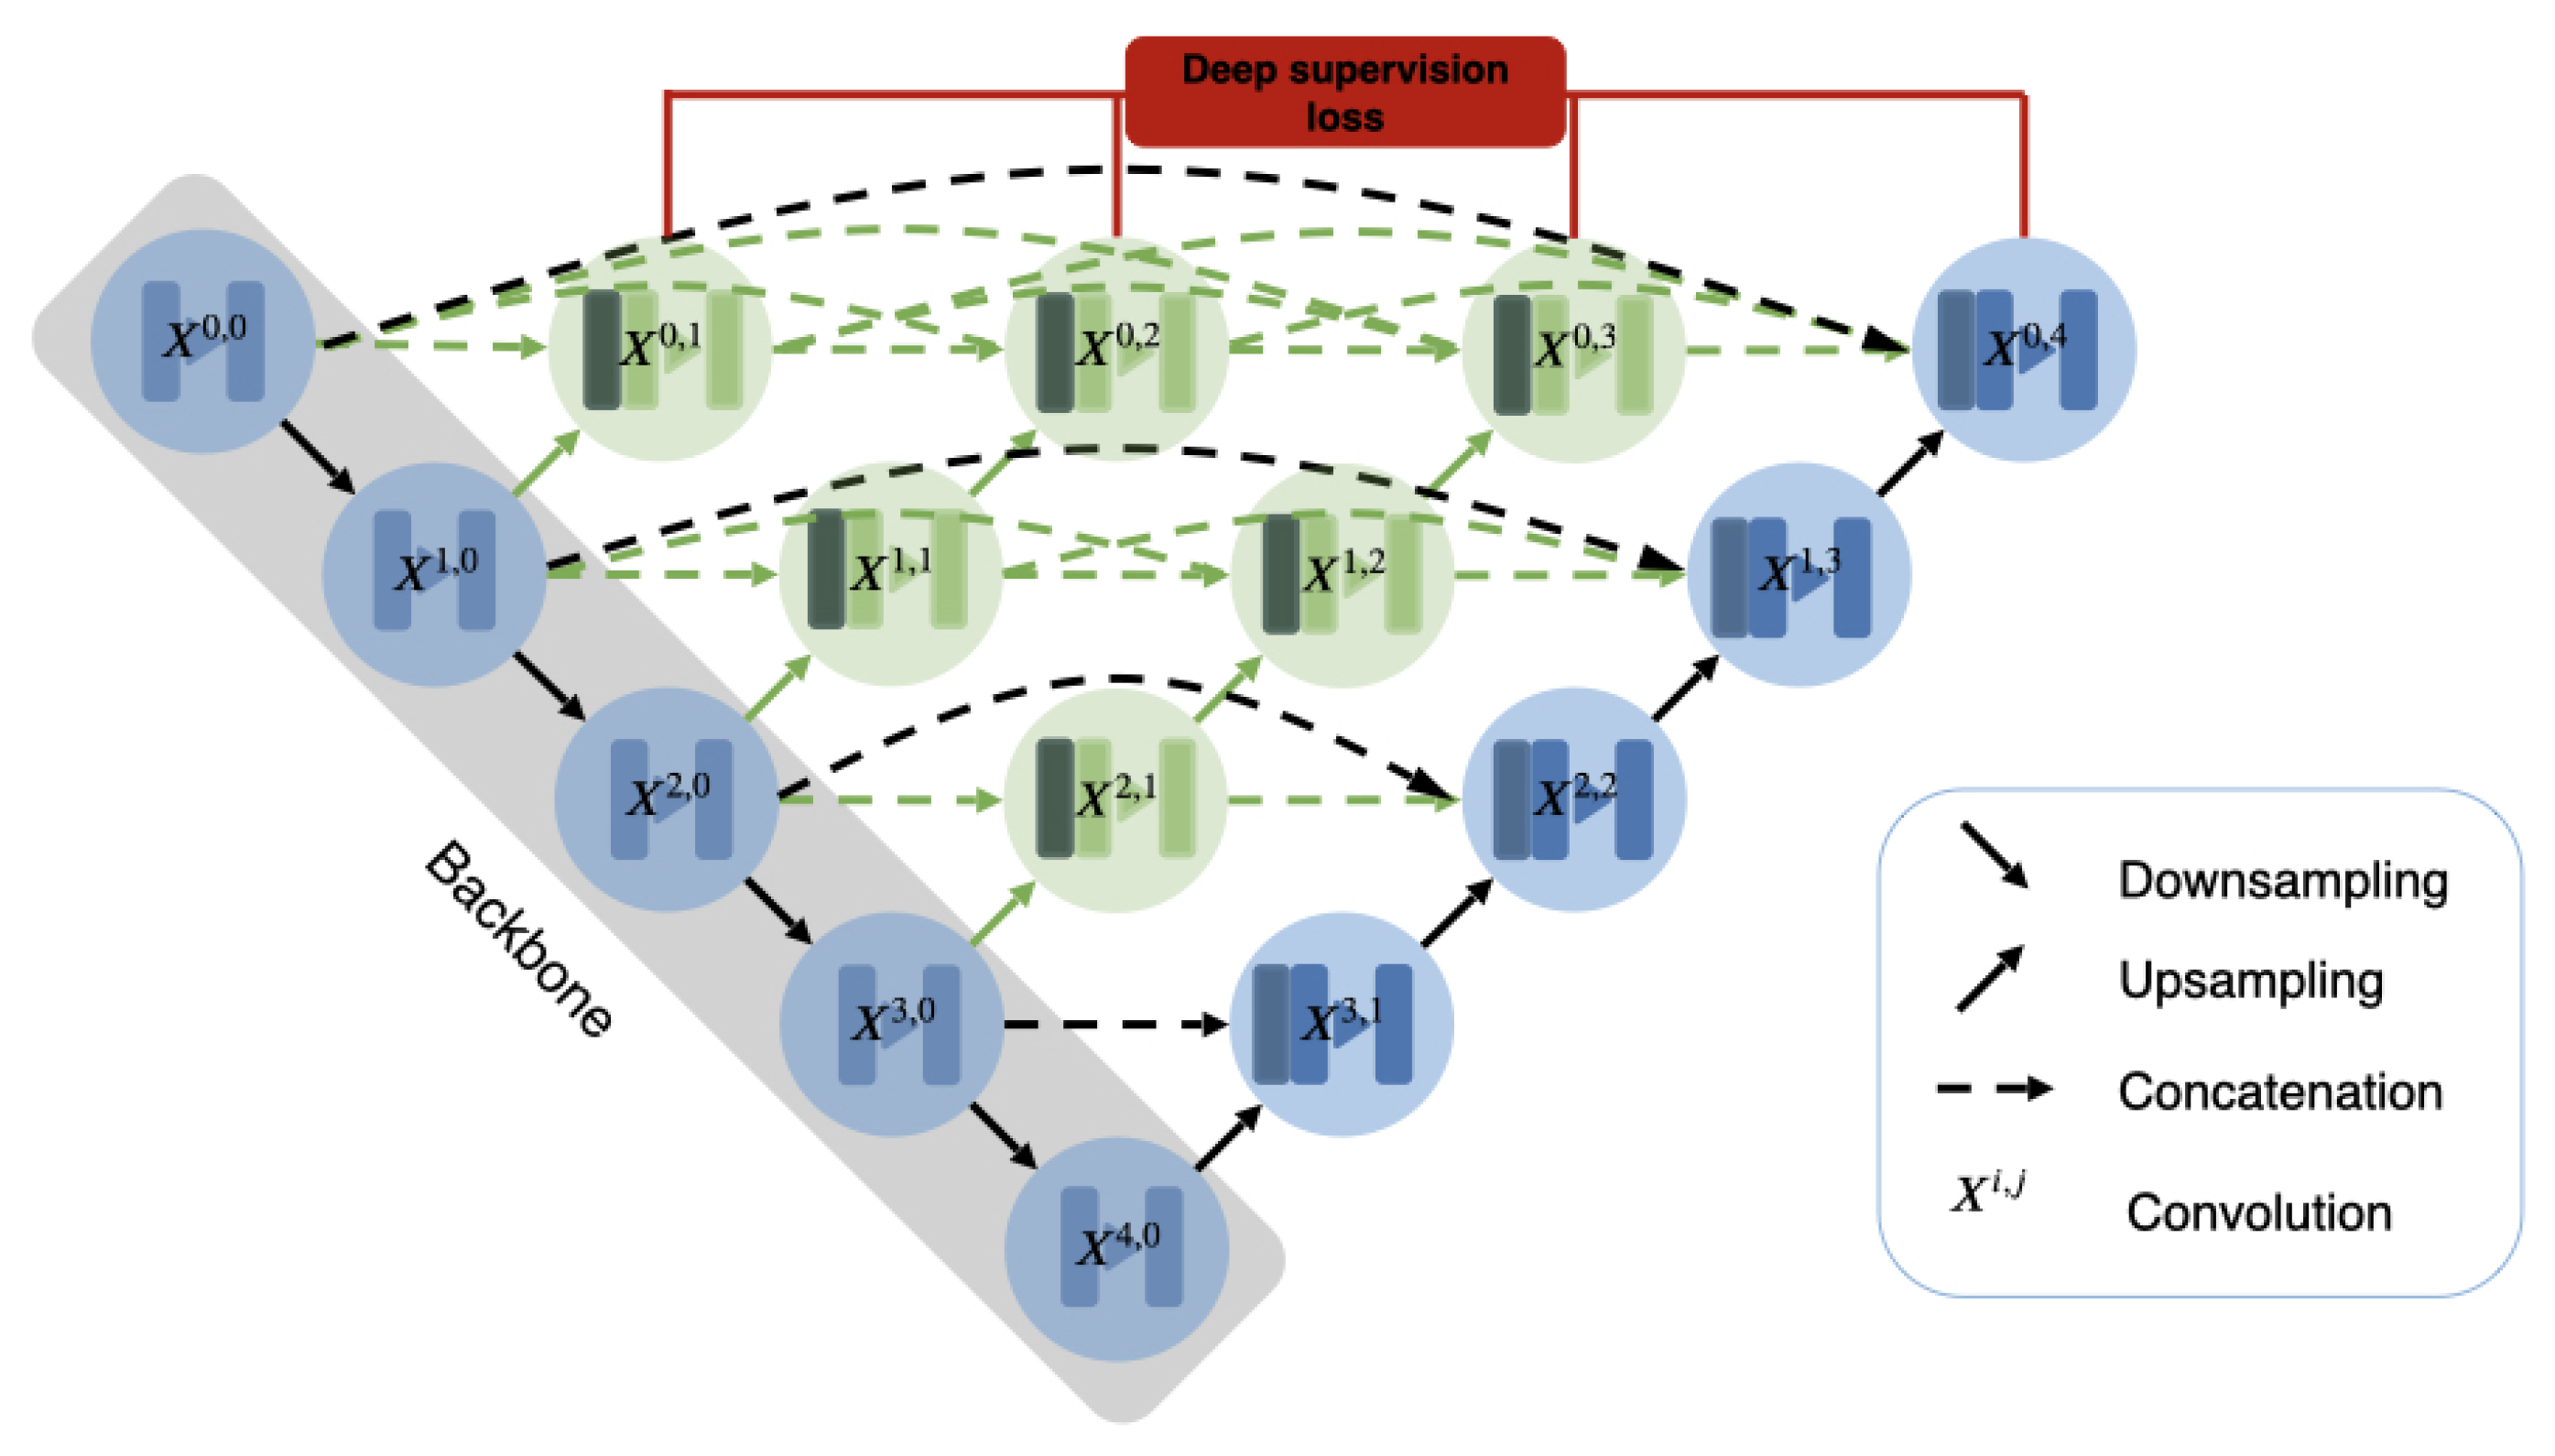
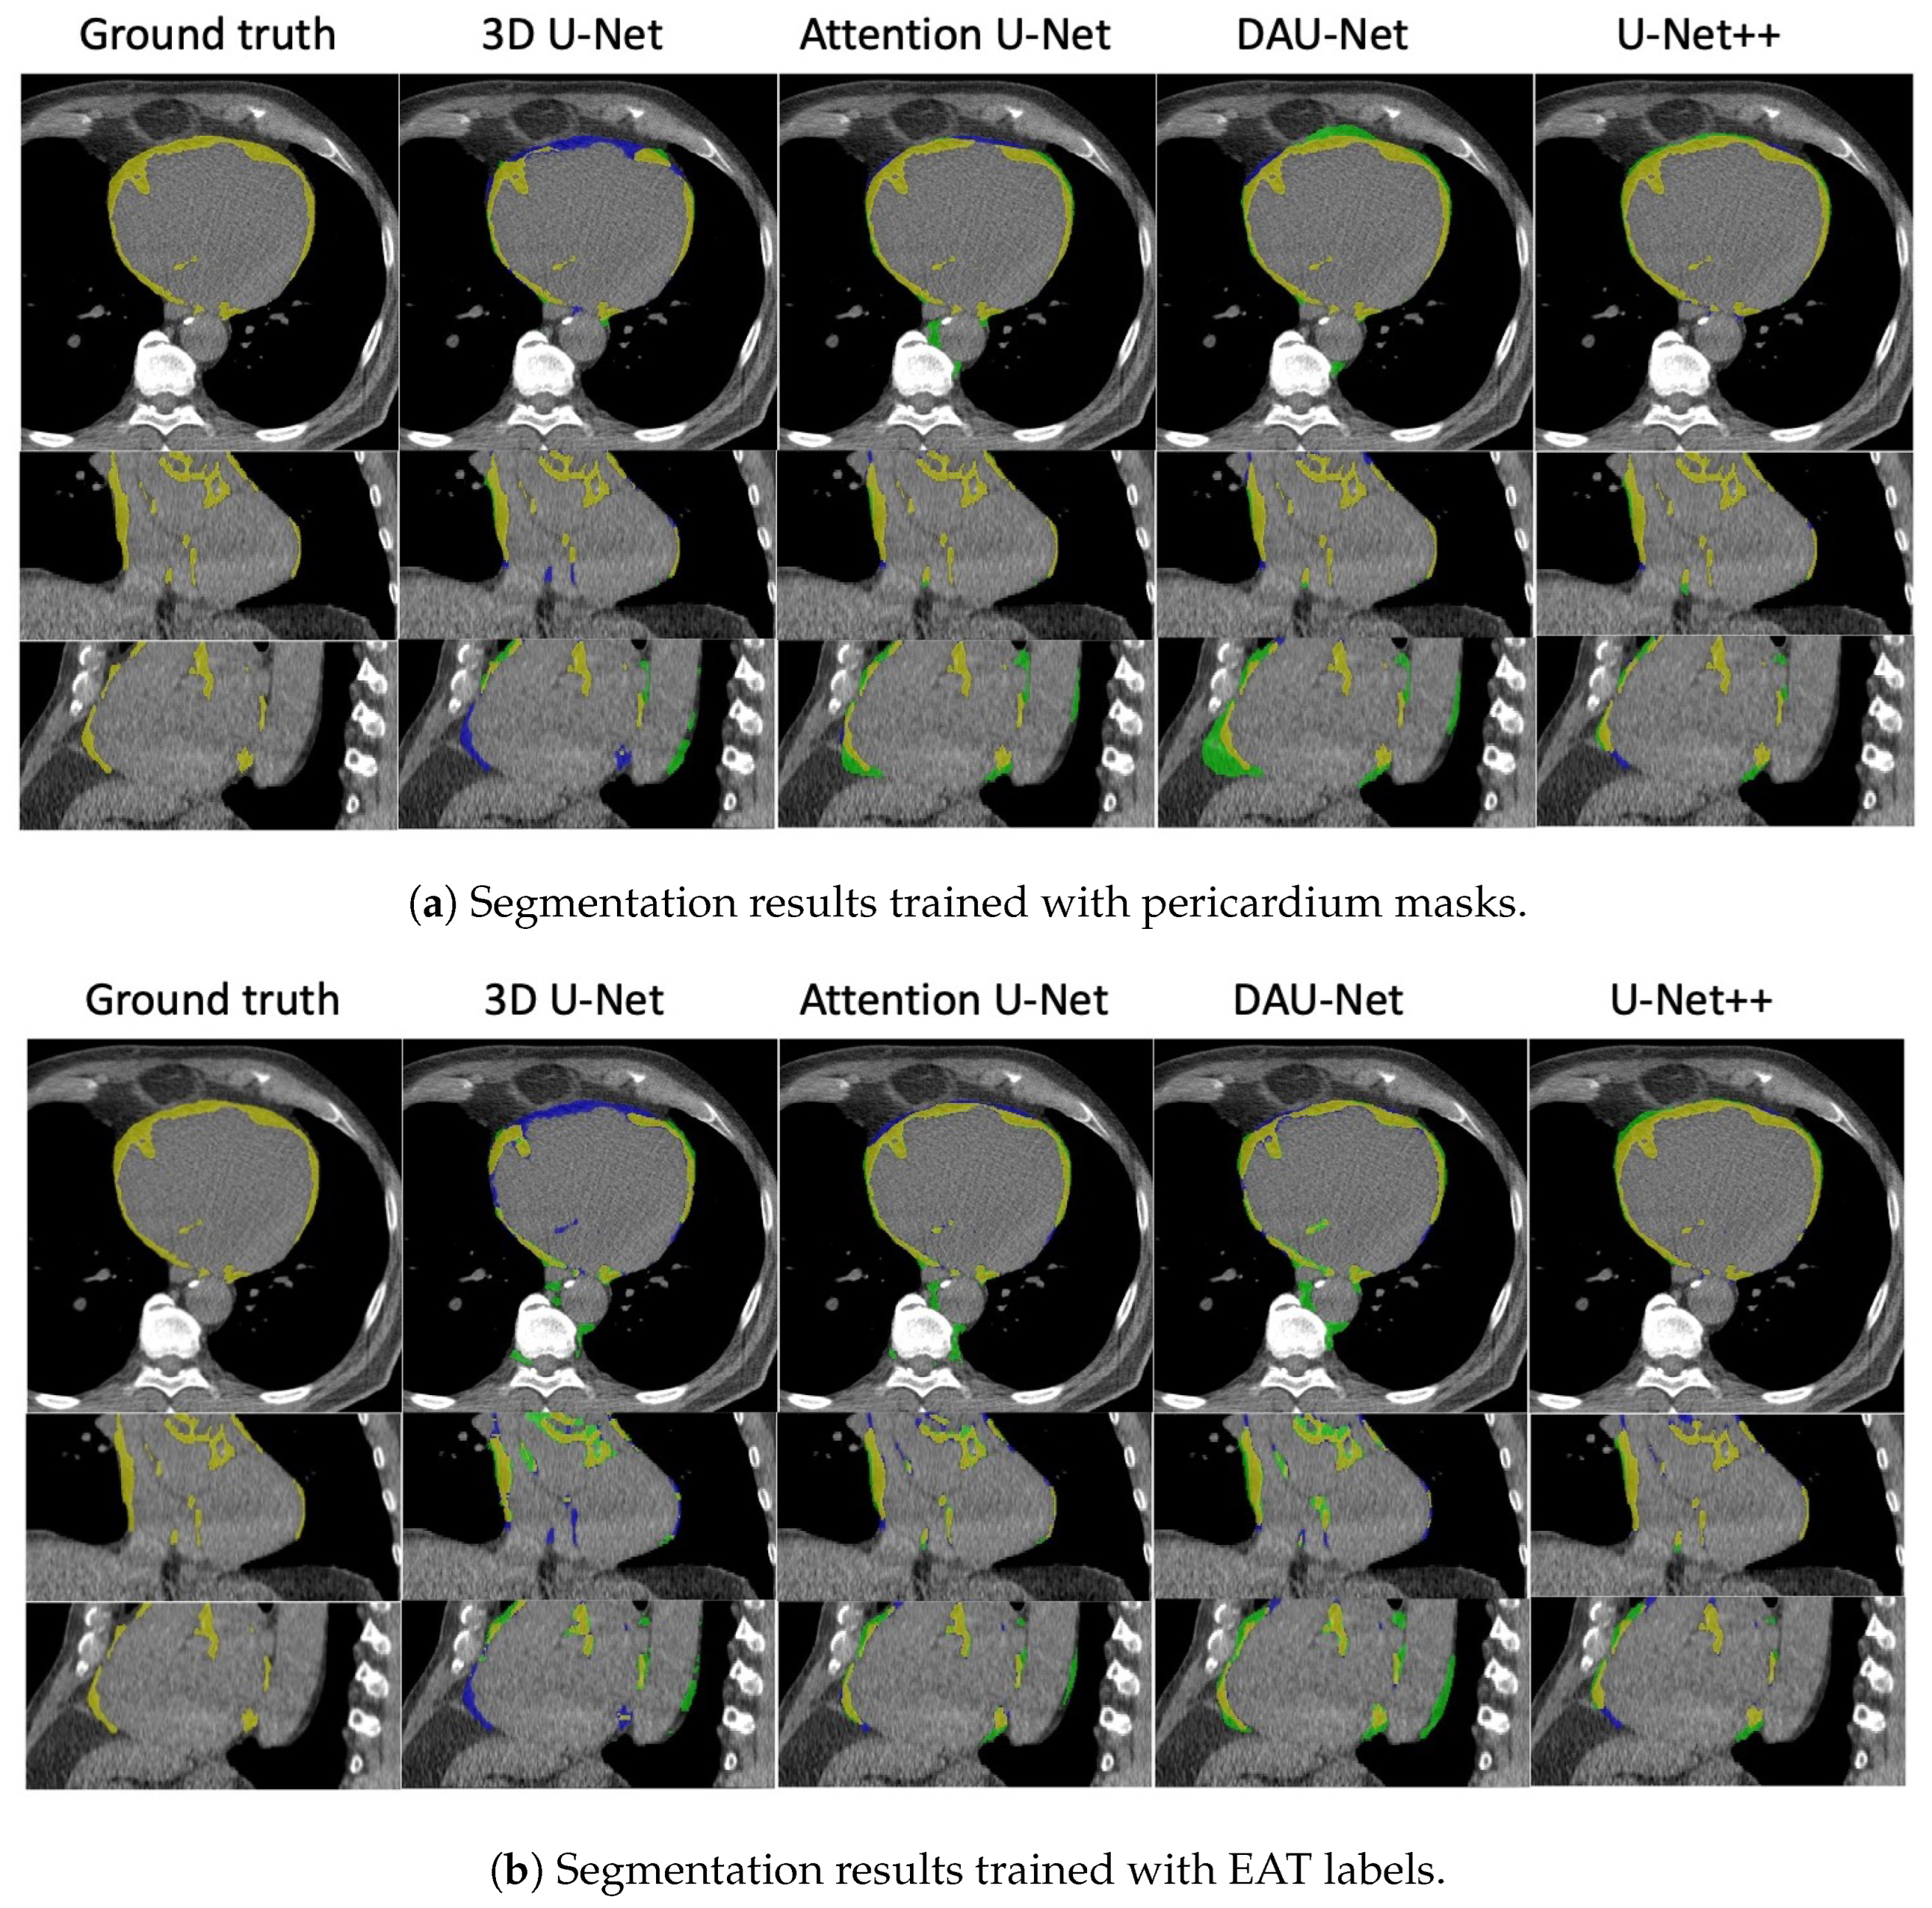
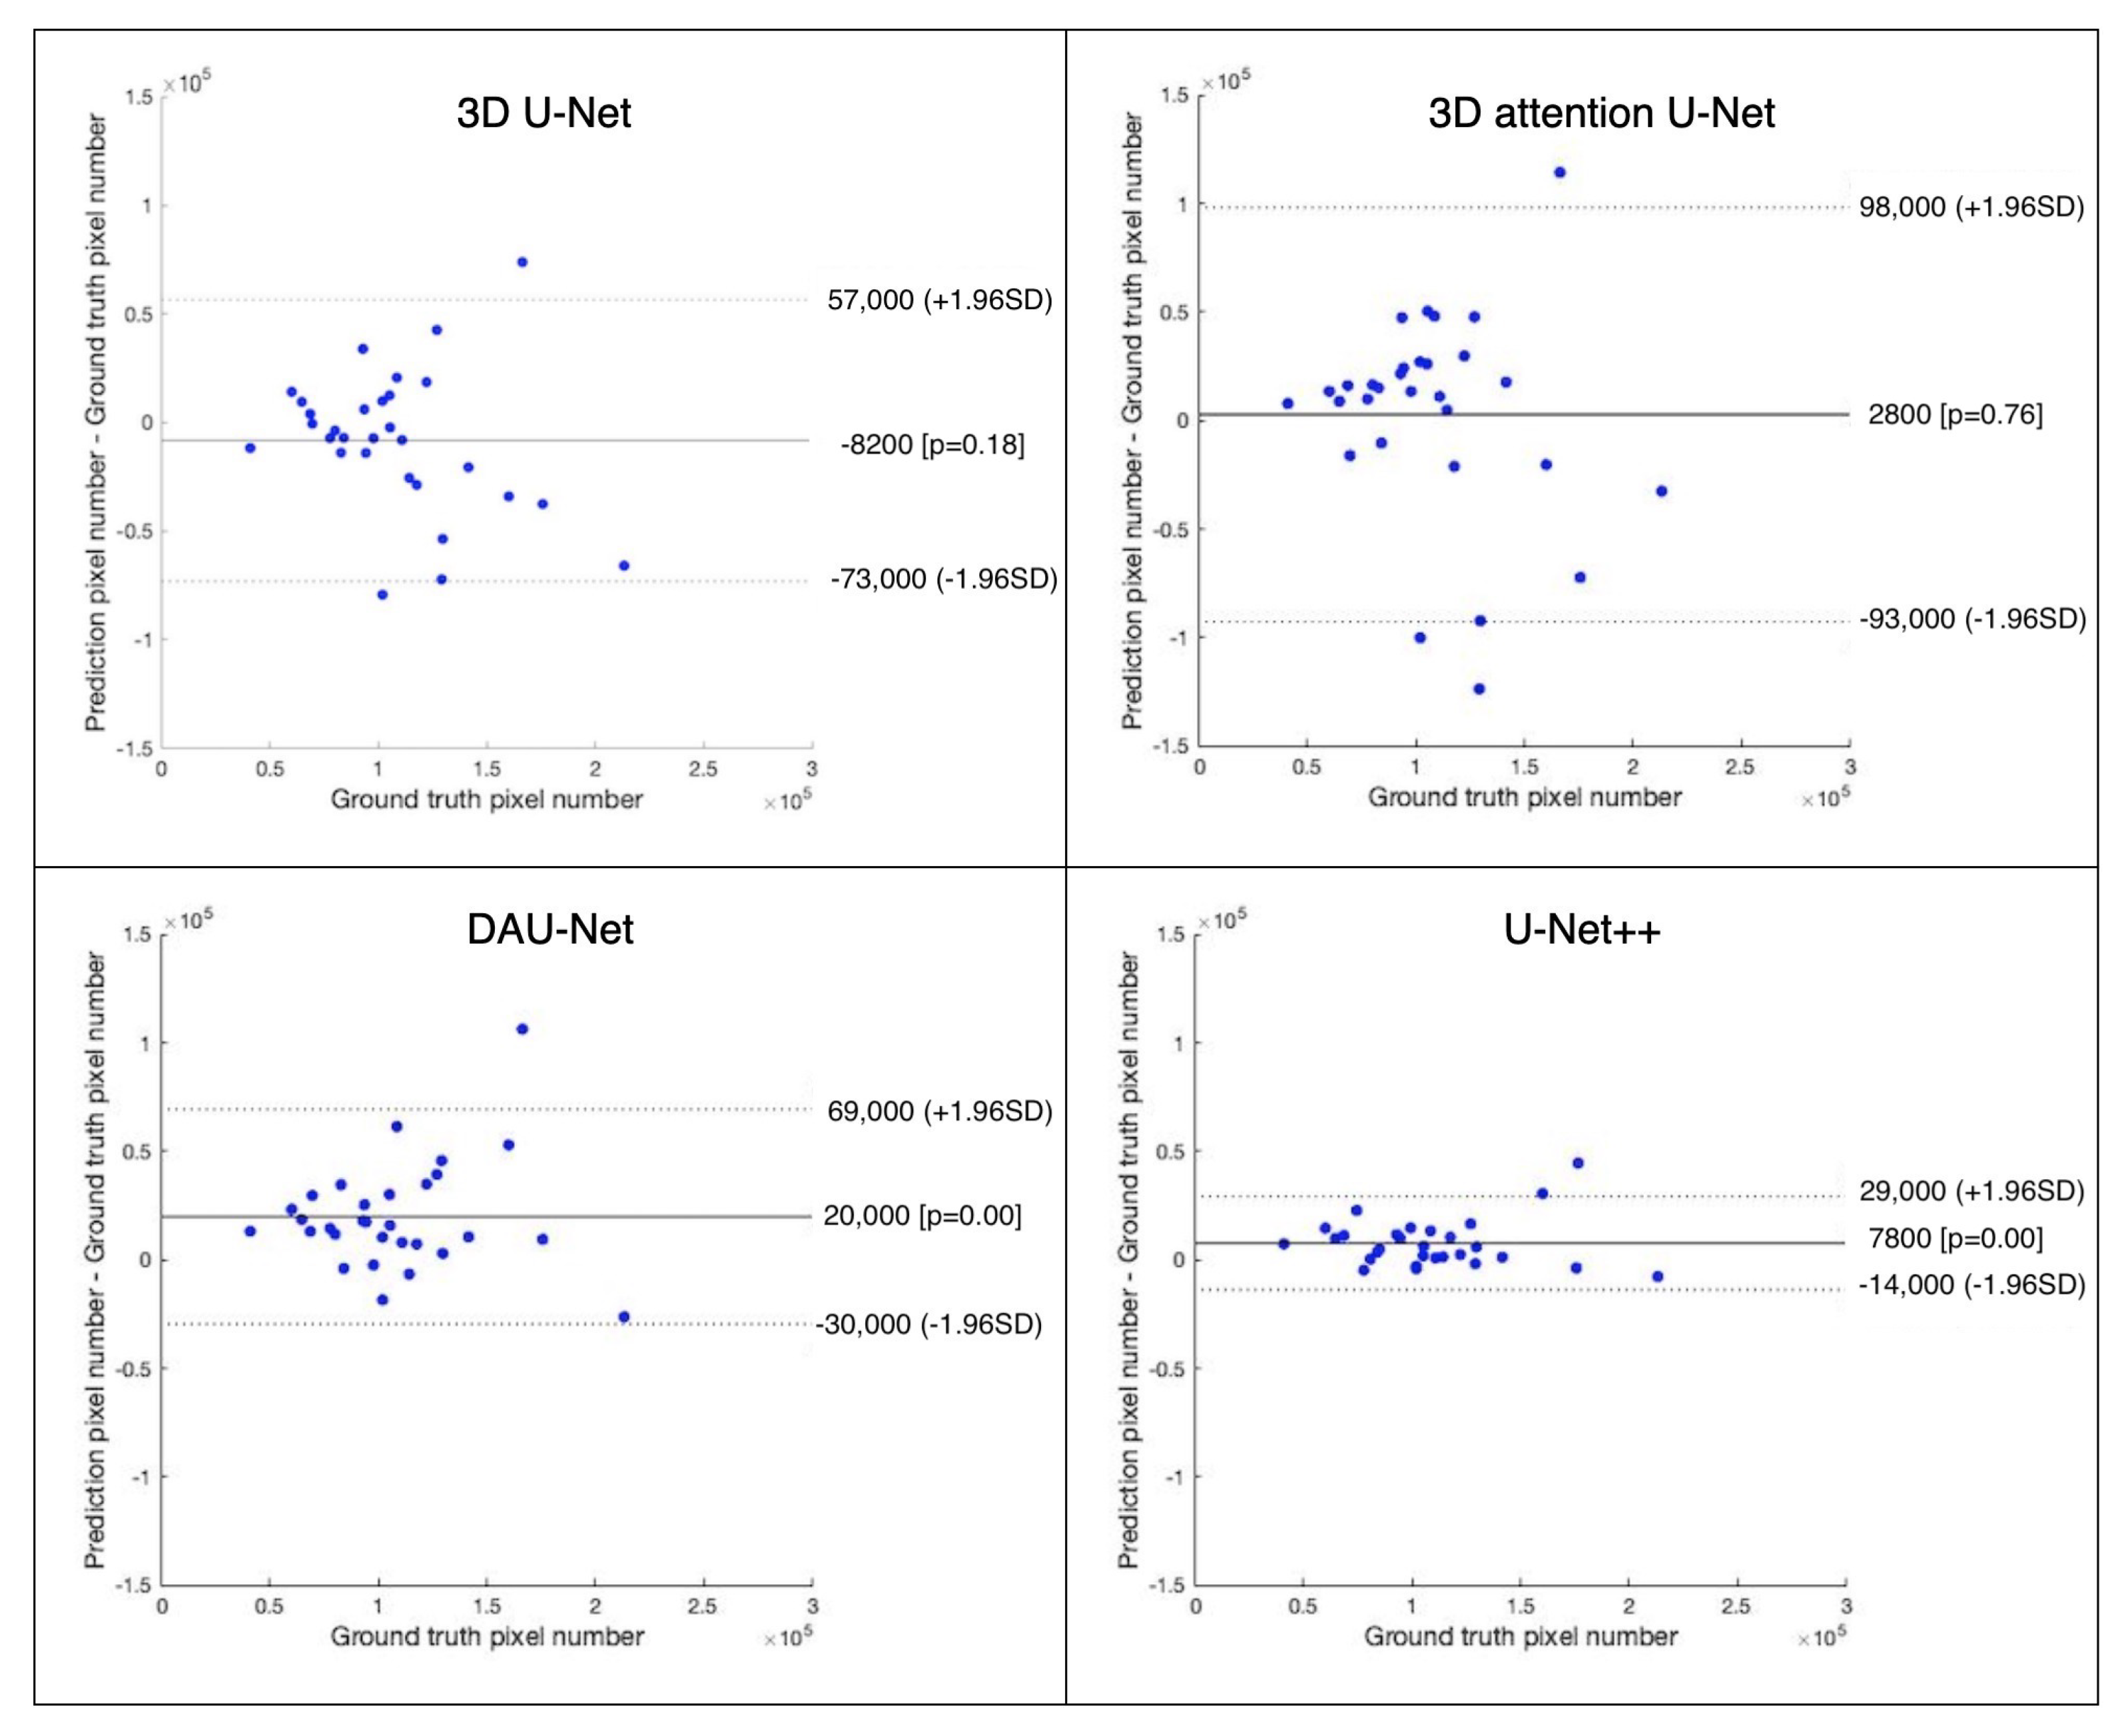
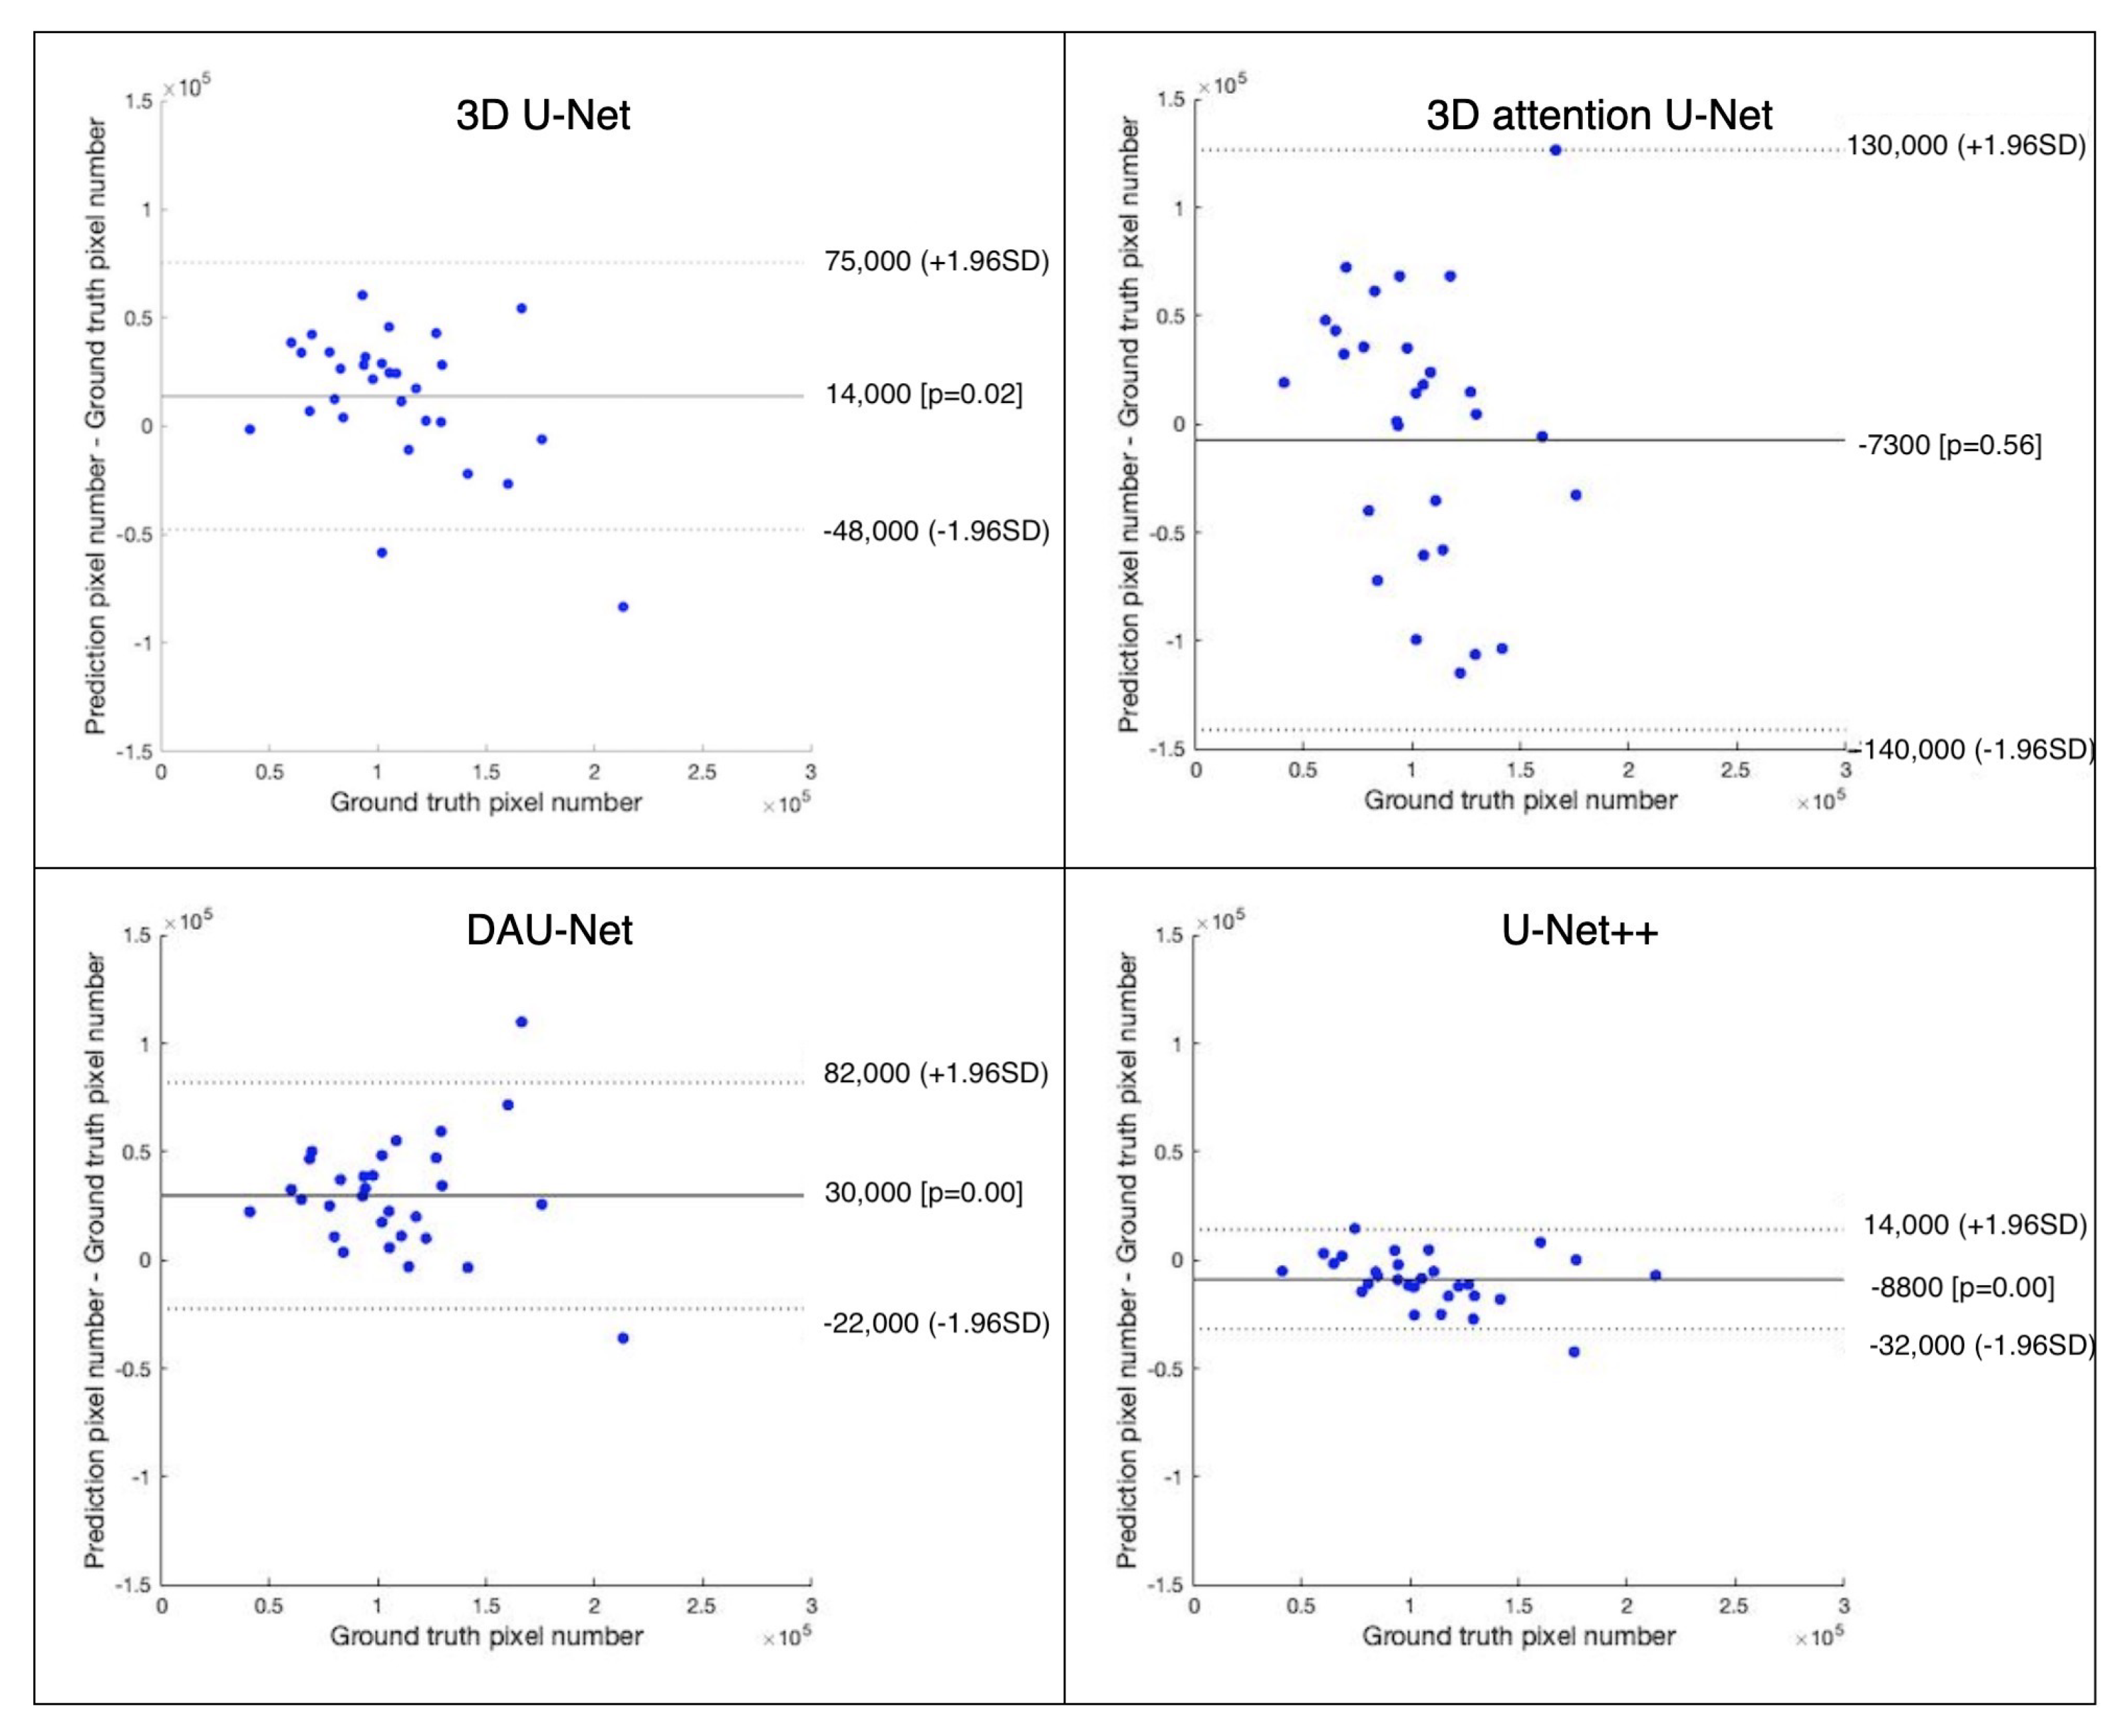
| Model | 3D U-Net | 3D Attention U-Net | DAU-Net | U-Net++ |
|---|---|---|---|---|
| convolution dimension | 3 | 3 | 3 | 2 |
| deep supervision | False | True | True | True |
| decoder block type | Upsample | Upsample | Upsample | Transpose |
| optimizer | SGD | SGD | SGD | Adam |
| Model | Label Type | DSC (%) | mIoU (%) | Sensitivity (%) | Specificity (%) | Correlation |
|---|---|---|---|---|---|---|
| 3D U-Net | Pericardium | 0.7588 | ||||
| EAT | 0.5648 | |||||
| 3D attention U-Net | Pericardium | 0.2085 | ||||
| EAT | 0.3883 | |||||
| DAU-Net | Pericardium | 0.8448 | ||||
| EAT | 0.8596 | |||||
| U-Net++ | Pericardium | 0.9123 | ||||
| EAT | 0.7303 |
| Model | Label Type | DSC (%) | mIoU (%) | Sensitivity (%) | Specificity (%) | Correlation |
|---|---|---|---|---|---|---|
| 3D U-Net | Pericardium | 0.6661 | ||||
| EAT | 0.6293 | |||||
| 3D attention U-Net | Pericardium | 0.5120 | ||||
| EAT | 0.1386 | |||||
| DAU-Net | Pericardium | 0.8445 | ||||
| EAT | 0.8047 | |||||
| U-Net++ | Pericardium | 0.9606 | ||||
| EAT | 0.9405 |
| Label Type | DSC (%) | mIoU (%) | Sensitivity (%) | Specificity (%) |
|---|---|---|---|---|
| Pericardium | (+1.62) | (+2.66) | (+0.15) | (+0.10) |
| EAT | (+7.03) | (+7.74) | (+6.62) | (+0.16) |
| Label Type | DSC (%) | mIoU (%) | Sensitivity (%) | Specificity (%) |
|---|---|---|---|---|
| Pericardium | (−9.39) | (−8.58) | (−19.04) | (+0.29) |
| EAT | (−9.54) | (−6.39) | (−20.85) | (+0.48) |
Disclaimer/Publisher’s Note: The statements, opinions and data contained in all publications are solely those of the individual author(s) and contributor(s) and not of MDPI and/or the editor(s). MDPI and/or the editor(s) disclaim responsibility for any injury to people or property resulting from any ideas, methods, instructions or products referred to in the content. |
© 2023 by the authors. Licensee MDPI, Basel, Switzerland. This article is an open access article distributed under the terms and conditions of the Creative Commons Attribution (CC BY) license (https://creativecommons.org/licenses/by/4.0/).
Share and Cite
Liu, L.; Ma, R.; van Ooijen, P.M.A.; Oudkerk, M.; Vliegenthart, R.; Veldhuis, R.N.J.; Brune, C. The U-Net Family for Epicardial Adipose Tissue Segmentation and Quantification in Low-Dose CT. Technologies 2023, 11, 104. https://doi.org/10.3390/technologies11040104
Liu L, Ma R, van Ooijen PMA, Oudkerk M, Vliegenthart R, Veldhuis RNJ, Brune C. The U-Net Family for Epicardial Adipose Tissue Segmentation and Quantification in Low-Dose CT. Technologies. 2023; 11(4):104. https://doi.org/10.3390/technologies11040104
Chicago/Turabian StyleLiu, Lu, Runlei Ma, Peter M. A. van Ooijen, Matthijs Oudkerk, Rozemarijn Vliegenthart, Raymond N. J. Veldhuis, and Christoph Brune. 2023. "The U-Net Family for Epicardial Adipose Tissue Segmentation and Quantification in Low-Dose CT" Technologies 11, no. 4: 104. https://doi.org/10.3390/technologies11040104
APA StyleLiu, L., Ma, R., van Ooijen, P. M. A., Oudkerk, M., Vliegenthart, R., Veldhuis, R. N. J., & Brune, C. (2023). The U-Net Family for Epicardial Adipose Tissue Segmentation and Quantification in Low-Dose CT. Technologies, 11(4), 104. https://doi.org/10.3390/technologies11040104


