
Benchmarking Analysis of the Panorama of Grid-Connected PV Installations in Spain

 , , and
Abstract
1. Introduction
2. Materials and Methods
3. Results
4. Conclusions
Supplementary Materials
Author Contributions
Funding
Institutional Review Board Statement
Informed Consent Statement
Data Availability Statement
Conflicts of Interest
References
- Horowitz, C.A. Paris Agreement. Int. Leg. Mater. 2016, 55, 740–755. [Google Scholar] [CrossRef]
- UNFCCC COP 26. Glasgow Climate Pact; United Nations: Glasgow, UK, 2021; pp. 1–8. Available online: https://unfccc.int/sites/default/files/resource/cma2021_10_add1_adv.pdf (accessed on 16 October 2022).
- British Petroleum. Statistical Review of World Energy globally consistent data on world energy markets and authoritative publications in the field of energy. BP Energy Outlook 2021, 70, 8–20. [Google Scholar]
- International Energy Agency. Global Energy Review 2020; IEA: Paris, France, 2020. [Google Scholar] [CrossRef]
- European Union. Council Regulation (EU) 2022/576 of 8 April 2022 Amending Regulation (EU) No 833/2014 Concerning Restrictive Measures in View of Russia’s Actions Destabilising the Situation in Ukraine; European Union: Luxembourg, 2022; Volume 2003, Available online: https://eur-lex.europa.eu/legal-content/EN/TXT/PDF/?uri=CELEX:32022R0576 (accessed on 16 October 2022).
- European Council. Versailles Declaration. 2022. Available online: https://www.consilium.europa.eu/media/54773/20220311-versailles-declaration-en.pdf (accessed on 16 October 2022).
- European Comission. REPowerEU Plan. 2022. Available online: https://eur-lex.europa.eu/legal-content/EN/TXT/HTML/?uri=CELEX:52022DC0230&from=EN (accessed on 16 October 2022).
- European Commission Annex—REPowerEU. Joint European Action for more affordable, secure and sustainable energy EN. Eur. Comm. 2022, 2022, 3. [Google Scholar]
- Dupont, I.M.; Carvalho, P.C.M.; Jucá, S.C.S.; Neto, J.S.P. Novel methodology for detecting non-ideal operating conditions for grid-connected photovoltaic plants using Internet of Things architecture. Energy Convers. Manag. 2019, 200, 112078. [Google Scholar] [CrossRef]
- Rus-Casas, C.; Hontoria, L.; Fernández-Carrasco, J.I.; Jiménez-Castillo, G.; Muñoz-Rodríguez, F. Development of a utility model for the measurement of global radiation in photovoltaic applications in the internet of things (IoT). Electronics 2019, 8, 304. [Google Scholar] [CrossRef]
- Paredes-Parra, J.M.; García-Sánchez, A.J.; Mateo-Aroca, A.; Molina-García, Á. An alternative internet-of-things solution based on LOra for PV power plants: Data monitoring and management. Energies 2019, 12, 881. [Google Scholar] [CrossRef]
- Pereira, R.I.S.; Dupont, I.M.; Carvalho, P.C.M.; Jucá, S.C.S. IoT embedded linux system based on Raspberry Pi applied to real-time cloud monitoring of a decentralized photovoltaic plant. Meas. J. Int. Meas. Confed. 2018, 114, 286–297. [Google Scholar] [CrossRef]
- Fernández-Ahumada, L.M.; Ramírez-Faz, J.; López-Luque, R.; Varo-Martínez, M.; Moreno-García, I.M.; Casares de la Torre, F. A novel backtracking approach for two-axis solar PV tracking plants. Renew. Energy 2020, 145, 1214–1221. [Google Scholar] [CrossRef]
- Fernández-Ahumada, L.M.; Ramírez-Faz, J.; López-Luque, R.; Varo-Martínez, M.; Moreno-García, I.M.; Casares de la Torre, F. Influence of the design variables of photovoltaic plants with two-axis solar tracking on the optimization of the tracking and backtracking trajectory. Sol. Energy 2020, 208, 89–100. [Google Scholar] [CrossRef]
- Gómez-Uceda, F.J.; Ramirez-Faz, J.; Varo-Martinez, M.; Fernández-Ahumada, L.M. New Omnidirectional Sensor Based on Open-Source Software and Hardware for Tracking and Backtracking of Dual-Axis Solar Trackers in Photovoltaic Plants. Sensors 2021, 21, 726. [Google Scholar] [CrossRef] [PubMed]
- Ahmed, N.; Naveed Khan, A.; Ahmed, N.; Aslam, A.; Imran, K.; Sajid, M.B.; Waqas, A. Techno-economic potential assessment of mega scale grid-connected PV power plant in five climate zones of Pakistan. Energy Convers. Manag. 2021, 237, 114097. [Google Scholar] [CrossRef]
- Rahnama, E.; Aghbashlo, M.; Tabatabaei, M.; Khanali, M.; Rosen, M.A. Spatio-temporal solar exergoeconomic and exergoenvironmental maps for photovoltaic systems. Energy Convers. Manag. 2019, 195, 701–711. [Google Scholar] [CrossRef]
- European Union. Progress on Competitiveness of Clean Energy Technologies; European Union: Brussels, Belgium, 2020; Available online: https://energy.ec.europa.eu/progress-competitiveness-clean-energy-technologies_en (accessed on 16 October 2022).
- EurObserv’ER Consortium. État des Énergies Renouvelables en Europe , 2021 ed.; 20th EurObserv’ER Report; urObserv’ER: Paris, France, 2022; Available online: https://www.eurobserv-er.org/etat-des-energies-renouvelables-en-europe-2021/ (accessed on 16 October 2022).
- Masson, G.; Kaizuka, I. Trends in Photovoltaic Applications 2021; Report IEA-PVPS T1-41; IEA: Paris, France, 2021; ISBN 9783906042916. Available online: https://iea-pvps.org/wp-content/uploads/2022/01/IEA-PVPS-Trends-report-2021-4.pdf (accessed on 16 October 2022).
- Ministry for Ecological Transition and the Demographic Change of the Spanish Government. Estrategia de Descarbonizacion a Largo Plazo 2050. 2020. Available online: https://energia.gob.es/_layouts/15/HttpHandlerParticipacionPublicaAnexos.ashx?k=16822 (accessed on 16 October 2022).
- Ministry for Ecological Transition and the Demographic Change of the Spanish Government. Real Decreto 960/2020, de 3 de Noviembre, por el que se Regula el Régimen Económico de Energías Renovables para Instalaciones de Producción de Energía Eléctrica; Ministry for Ecological Transition and the Demographic Change of the Spanish Government: Madrid, Spain, 2021; pp. 26798–26800. Available online: https://www.boe.es/eli/es/rd/2020/11/03/960 (accessed on 16 October 2022).
- Red Electrica de España. El Sistema Eléctrico Español 2020. Red Eléctrica de España (REE). 2021. Available online: https://www.ree.es/sites/default/files/publication/2022/05/downloadable/inf_sis_elec_ree_2020_0.pdf (accessed on 16 October 2022).
- Ministry for Ecological Transition and the Demographic Change of the Spanish Government. Real Decreto 244/2019, de 5 de Abril, Por el Que se Regulan Las Condiciones Administrativas, Técnicas y Económicas del Autoconsumo de Energía Eléctrica; Ministry for Ecological Transition and the Demographic Change of the Spanish Government: Madrid, Spain, 2019; Volume 6, pp. 35674–35719. Available online: https://www.boe.es/eli/es/rd/2019/04/05/244 (accessed on 16 October 2022).
- Head of State of the Spanish Government. Real Decreto-Ley 23/2020, de 23 de Junio, por el que se Aprueban Medidas en Materia de Energía y en Otros Ámbitos para la Reactivación Económica; Head of State of the Spanish Government: Madrid, Spain, 2020; pp. 43879–43927. Available online: https://www.boe.es/eli/es/rdl/2020/06/23/23/con (accessed on 16 October 2022).
- Ministry for Ecological Transition and the Demographic Change of the Spanish Government. Real Decreto 960/2020, de 3 de Noviembre, por el que se Regula el Régimen Económico de Energías Renovables para Instalaciones de Producción de Energía Eléctrica; Ministry for Ecological Transition and the Demographic Change of the Spanish Government: Madrid, Spain, 2020; Volume 13249, pp. 101239–101266. Available online: https://www.boe.es/eli/es/rd/2020/11/03/960/con (accessed on 16 October 2022).
- Ministry for Ecological Transition and the Demographic Change of the Spanish Government. Real Decreto 1183/2020, de 29 de Diciembre, de Acceso y Conexión a las Redes de Transporte y Distribución de Energía Eléctrica; Ministry for Ecological Transition and the Demographic Change of the Spanish Government: Madrid, Spain, 2020; Volume 2014, pp. 18987–19106. Available online: https://www.boe.es/eli/es/rd/2020/12/29/1183/con (accessed on 16 October 2022).
- Hemetsberger, W.; Couet, C.; Schmela, M. EU Market Outlook for Solar Power 2021–2025; Solar Power Europe: Brussels, Belgium, 2021; ISBN 9789464444292. Available online: https://www.solarpowereurope.org/insights/market-outlooks/market-outlook#downloadForm (accessed on 16 October 2022).
- Blyth, W.; Gross, R.; Speirs, J.; Sorrell, S.; Nicholls, J.; Dorgan, A.; Hughes, N. Low carbon jobs: The evidence for net job creation from policy support for energy efficiency and renewable energy. In Proceedings of the BIEE 10th Academic Conference, London, UK, 17–18 September 2014; Volume 31. [Google Scholar]
- Camp, R.C. Benchmarking: The search for industry best practices that lead to superior performance. Qual. Prog. 1989, 22, 66–68. [Google Scholar] [CrossRef]
- Spendolini, M.J. The benchmarking process. Compens. Benefits Rev. 1992, 24, 21–29. [Google Scholar] [CrossRef]
- Curtis, D. Benchmarking: A tool for facilitating organizational learning? Public Adm. Dev. 2002, 22, 109–122. [Google Scholar] [CrossRef]
- Saygin, D.; Worrell, E.; Patel, M.K.; Gielen, D.J. Benchmarking the energy use of energy-intensive industries in industrialized and in developing countries. Energy 2011, 36, 6661–6673. [Google Scholar] [CrossRef]
- Luque-Marínez, T.; Muñoz-Leiva, F. City benchmarking: A methodological proposal referring specifically to Granada. Cities 2005, 22, 411–423. [Google Scholar] [CrossRef]
- Chung, W. Review of building energy-use performance benchmarking methodologies. Appl. Energy 2011, 88, 1470–1479. [Google Scholar] [CrossRef]
- Chung, W.; Hui, Y.V.; Lam, Y.M. Benchmarking the energy efficiency of commercial buildings. Appl. Energy 2006, 83, 1–14. [Google Scholar] [CrossRef]
- Al-Homoud, M.S. Computer-aided building energy analysis techniques. Build. Environ. 2001, 36, 421–433. [Google Scholar] [CrossRef]
- Li, Z.; Han, Y.; Xu, P. Methods for benchmarking building energy consumption against its past or intended performance: An overview. Appl. Energy 2014, 124, 325–334. [Google Scholar] [CrossRef]
- Salleh, M.N.M.; Kandar, M.Z.; Sakip, S.R.M. Benchmarking for Energy Efficiency on School Buildings Design: A Review. Procedia Soc. Behav. Sci. 2016, 222, 211–218. [Google Scholar] [CrossRef][Green Version]
- Borgstein, E.H.; Lamberts, R. Developing energy consumption benchmarks for buildings: Bank branches in Brazil. Energy Build. 2014, 82, 82–91. [Google Scholar] [CrossRef]
- Geraldi, M.S.; Bavaresco, M.; Gnecco, V.M.; Azevedo, L.D.; de Ghisi, E.; Fossati, M. Análise estatística da intensidade do uso de energia de edificações escolares no Brasil: Proposição de benchmarking simplificado. Rev. Sítio Novo 2022, 7, 21–34. [Google Scholar] [CrossRef]
- Rodríguez-Díaz, J.A.; Camacho-Poyato, E.; López-Luque, R.; Pérez-Urrestarazu, L. Benchmarking and multivariate data analysis techniques for improving the efficiency of irrigation districts: An application in spain. Agric. Syst. 2008, 96, 250–259. [Google Scholar] [CrossRef]
- Rodríguez Díaz, J.A.; Camacho Poyato, E.; López Luque, R.; Pérez Urrestarazu, L. Los indicadores de gestión y las técnicas de benchmarking aplicados a la mejora de las comunidades de regantes. Ing. Agua 2005, 12, 63–76. [Google Scholar] [CrossRef]
- Delegation of the Government of Castilla La Mancha Public Information Procedures Notice Board of the Government of Castilla La Mancha. Available online: https://www.mptfp.gob.es/portal/delegaciones_gobierno/delegaciones/castillalamancha/proyectos-ci/informacion-publica.html%0D%0A (accessed on 20 March 2022).
- Regional Government of Extremadura Public Information of the Department of Ecological Transition and Sustainability of the Regional Government of Extremadura. Available online: http://industriaextremadura.juntaex.es/kamino/index.php/area-de-energia/generacion-de-energia/informacion-publica%0D%0A (accessed on 14 February 2022).
- Government of Andalucía Public Information Procedures Notice Board of the Government of Andalucía. Available online: https://www.juntadeandalucia.es/organismos/haciendayfinanciacioneuropea/servicios/participacion/todos-documentos.html%0D%0A (accessed on 23 February 2022).
- Government of Aragon Public Information Procedures Notice Board of the Government of Aragon. Available online: https://www.aragon.es/buscador/-/search/type/20501/portal/0/filter/0-465154-466682/page/0/q/fotovoltaico%0A%0A (accessed on 27 March 2022).
- Autonomous Community of Madrid Public Information Board for Industry, Energy and Mines of the Autonomous Community of Madrid. Available online: https://www.comunidad.madrid/inversion/industria/informacion-publica-materia-industria-energia-minas (accessed on 27 April 2022).
- Delegation of Goverment of Castilla Leon Public Information Notice Board on electricity Installations of the Delegation of Goverment of Cstilla Leon. Available online: https://www.mptfp.gob.es/portal/delegaciones_gobierno/delegaciones/castillaleon/proyectos-ci/Informaci-n-P-blica/INSTALACIONES-EL-CTRICAS.html (accessed on 2 March 2022).
- Delegation of Government of Region of Murcia Public Information Procedures Notice Board of the Delegation of Government of Region of Murcia. Available online: https://www.mptfp.gob.es/portal/delegaciones_gobierno/delegaciones/comunidad_valenciana/proyectos-ci/Procedimientos-de-informacion-publica.html (accessed on 15 February 2022).


| Blocks | Variables | |
|---|---|---|
| General characteristics of the installation | Denomination, municipal district, municipality, area (Ha), UTM location coordinates (X, Y), peak power (MWp), nominal power (MW), production (MWh/year). | |
| Characteristics of the photovoltaic modules | Manufacturer, model, number of modules in the installation, STC peak power (Wp), NOCT peak power (Wp), module width (mm), module height (mm), cell type, number of cells, efficiency (%). | |
| Characteristics of the inverters | Brand and model, number of inverters, power of the inverter(s) (kVA), maximum DC input voltage (V), output voltage (VAc), modules per string, strings per inverter, total strings. | |
| Type of Monitoring | Monitoring 1 axis | Tracker model, module layout in the tracking structure, backtracking, table width (mm), tracker length (m), tracker axis height (mm), orientation, angular range (°), pitch (m). |
| Monitoring 2 axis | Tracker model, module layout in the tracking structure, backtracking, table surface (mm2), tracker axis height (mm), orientation, angular range (°), pitch (m). | |
| Fixed arrangement | Table width (mm), table length (m), azimuth (°), angle above horizontal (°), pitch (m). | |
| Characteristics of the transformation center/s | Power of transformers (MVA), number of transformers, input voltage rise (kV), evacuation line length (km). | |
| Economic characteristics | Global and partial budget (EUR): civil works, PV modules, installation and assembly of PV modules, monitoring structure, installation and assembly of monitoring structure, electrical installation (low voltage), inverters, transformation centers. | |
| Index | Units | Definition |
|---|---|---|
| % | Oversizing or ratio between the peak power (kWp) and the nominal power of the installation (kW) expressed in % | |
| kWp/Ha | Density of use or ratio between peak power (kWp) and land area (Ha) | |
| kWh·year−1/kWp | Ratio between the annual production of the installation (kWh/year) and the installed peak power (kWp) | |
| MWh·year−1/Ha | Energy density or ratio between energy production (MWh/year) and land area (Ha) | |
| kEUR/Ha | Ratio between the global budget (kEUR) and the land area (Ha) | |
| EUR/W | Ratio between the global budget (EUR) and the nominal power of the installation (W) | |
| EUR/Wp | Ratio between the global budget (EUR) and the peak power of the installation (Wp) | |
| Wp | Peak power (Wp) of photovoltaic modules under Standard Test Conditions (STC) | |
| Wp | Peak power (Wp) of photovoltaic modules under Nominal Operating Cell Temperature (NOCT) | |
| % | Efficiency of solar modules | |
| kVA | Inverter power (kVA) | |
| Dimensionless | Number of strings per inverter | |
| % | Ratio between the budget dedicated to PV modules (kEUR) and the total budget for the installation (kEUR) | |
| % | Ratio between budget dedicated to the power station (inverters + transformation center) (kEUR) and the total budget of the installation (kEUR) | |
| % | Ground Cover Ratio or ratio between the area dedicated to photovoltaic modules and the total area of the installation |
| Index | Units | Maximum | Minimum | Mean | Median | Standard Deviation | Variation Coefficient |
|---|---|---|---|---|---|---|---|
| % | 139.96 | 94.44 | 116.57 | 115.64 | 8.61 | 0.07 | |
| kWp/Ha | 1569.37 | 153.47 | 661.55 | 564.81 | 298.71 | 0.45 | |
| kWh·year−1/kWp | 2496.95 | 1411.89 | 1850.36 | 1878.77 | 230.96 | 0.12 | |
| MWh·year−1/Ha | 2223.42 | 343.98 | 1178.67 | 1095.14 | 411.23 | 0.34 | |
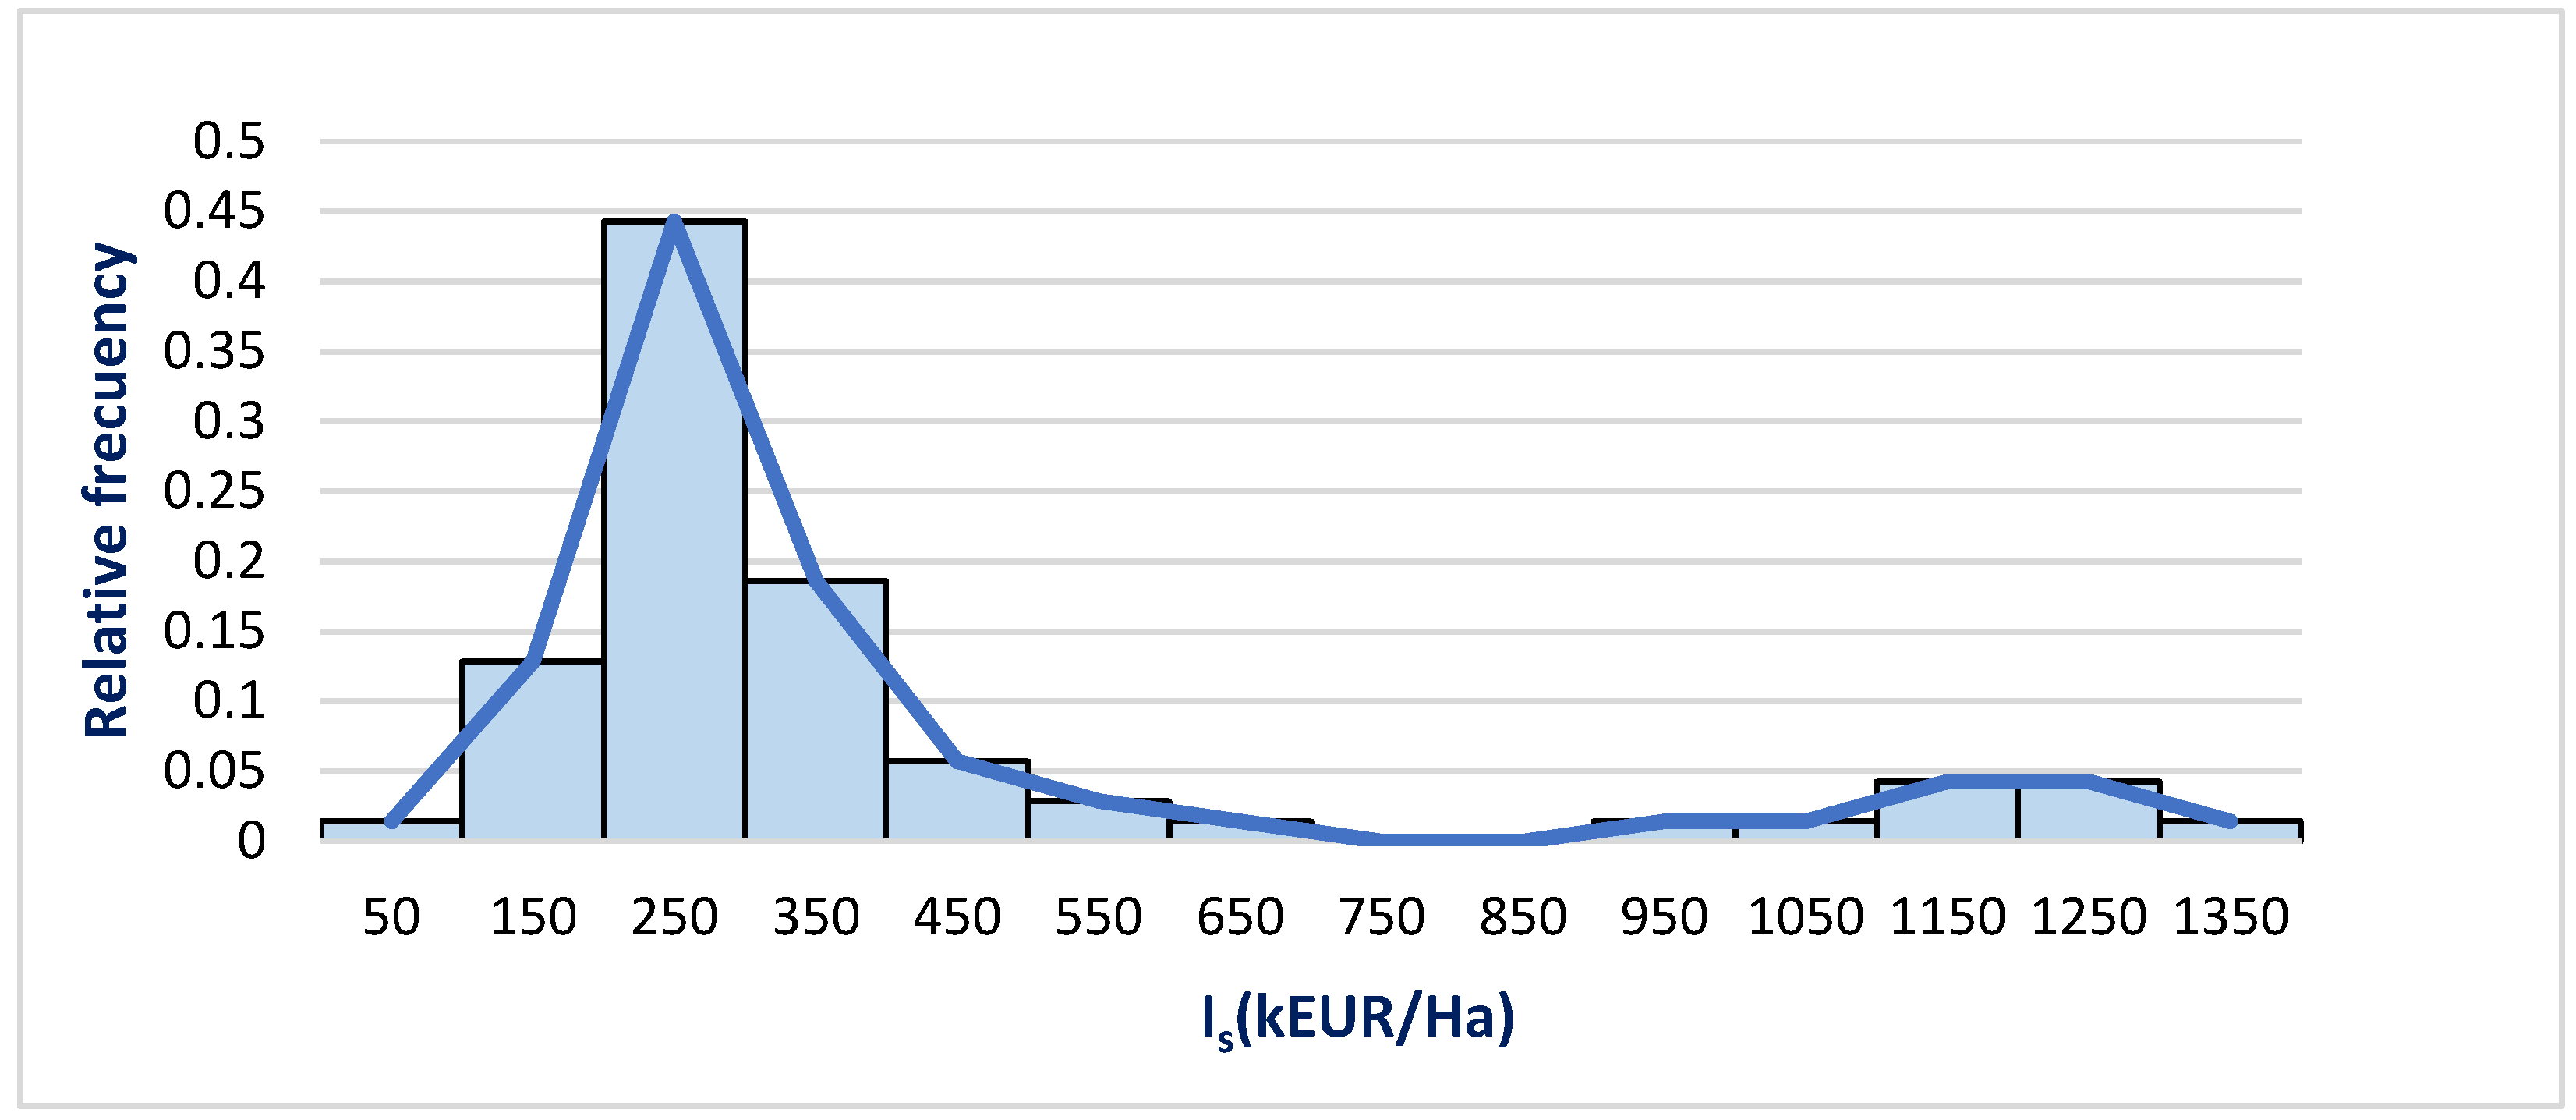
| kEUR/Ha | 1310.38 | 81.46 | 396.35 | 281.54 | 312.83 | 0.78 | |
| EUR/W | 1.26 | 0.35 | 0.64 | 0.59 | 0.19 | 0.30 | |
| EUR/Wp | 0.96 | 0.32 | 0.55 | 0.50 | 0.16 | 0.29 | |
| Wp | 665.00 | 340.00 | 526.85 | 525.00 | 78.57 | 0.14 | |
| Wp | 500.00 | 253.00 | 394.72 | 394.00 | 62.27 | 0.15 | |
| % | 22.30 | 18.30 | 20.76 | 20.85 | 0.62 | 0.03 | |
| . | kVA | 4600.00 | 110.00 | 1696.72 | 1637.00 | 1443.38 | 0.85 |
| . | Dimensionless | 462.00 | 11.00 | 151.34 | 133.00 | 124.86 | 0.82 |
| . | % | 70.32 | 20.54 | 45.82 | 45.94 | 9.37 | 0.20 |
| % | 41.15 | 0.99 | 11.35 | 9.29 | 6.55 | 0.57 | |
| . | % | 81.0.3 | 18.83 | 47.43 | 42.00 | 16.62 | 0.35 |
Publisher’s Note: MDPI stays neutral with regard to jurisdictional claims in published maps and institutional affiliations. |
© 2022 by the authors. Licensee MDPI, Basel, Switzerland. This article is an open access article distributed under the terms and conditions of the Creative Commons Attribution (CC BY) license (https://creativecommons.org/licenses/by/4.0/).
Share and Cite
Gómez-Uceda, F.J.; Varo-Martínez, M.; Ramírez-Faz, J.C.; López-Luque, R.; Fernández-Ahumada, L.M. Benchmarking Analysis of the Panorama of Grid-Connected PV Installations in Spain. Technologies 2022, 10, 131. https://doi.org/10.3390/technologies10060131
Gómez-Uceda FJ, Varo-Martínez M, Ramírez-Faz JC, López-Luque R, Fernández-Ahumada LM. Benchmarking Analysis of the Panorama of Grid-Connected PV Installations in Spain. Technologies. 2022; 10(6):131. https://doi.org/10.3390/technologies10060131
Chicago/Turabian StyleGómez-Uceda, F. J., M. Varo-Martínez, J. C. Ramírez-Faz, R. López-Luque, and L. M. Fernández-Ahumada. 2022. "Benchmarking Analysis of the Panorama of Grid-Connected PV Installations in Spain" Technologies 10, no. 6: 131. https://doi.org/10.3390/technologies10060131
APA StyleGómez-Uceda, F. J., Varo-Martínez, M., Ramírez-Faz, J. C., López-Luque, R., & Fernández-Ahumada, L. M. (2022). Benchmarking Analysis of the Panorama of Grid-Connected PV Installations in Spain. Technologies, 10(6), 131. https://doi.org/10.3390/technologies10060131