1. Introduction
The aim of digital technology consists of transforming analog information to digital information that can be interpreted by electronic devices. Thanks to this technology, thousands of books, songs, and images can be stored, shared, and consulted. However, digital technology also entails negative aspects that can affect the author’s interests regarding the exploitation of their rights and works since unauthorized uses of their work can occur. In addition to being economical and relatively simple, digital works retain their quality in the generation of subsequent copies, which is attractive to the final consumer [
1].
Nowadays, piracy is a problem that lurks in the digital world, affecting: (1) creators, including the authors and holders of their related rights, because their primary source of income is reduced; (2) workers from all industries due to the loss of their jobs; (3) industries, which are not able to commercialize as many original products and thus suffer decreased profits; and (4) the government, which receives fewer taxes, because piracy is carried out outside the law. One of the technological methods used for copyright protection is fingerprinting, which is intended to identify and collect information about works; this information can be used later to recognize pirates responsible for illegal copies [
2].
Currently, users share audiovisual material that is not always protected, making illegal traffic a common problem. However, there are two possible ways of preventing this: (1) a priori protection with watermarking policing, in which a digital watermark is embedded in the content, and (2) posterior forensics using fingerprinting that identifies an authorized user or purchaser of the material. In addition, fingerprinting suffers from fewer technical problems than watermarking since it does not require widespread key distribution [
3].
Over the years, a significant amount of studies have proposed watermarking and fingerprinting solutions to protect audiovisual material. For example, the authors in [
4] proposed a blind adaptive audio watermarking algorithm based on singular value decomposition (SVD) in the discrete wavelet transform domain; this scheme showed low error probability rates. The authors in [
5] developed a perceptual audio hashing algorithm based on the Zernike moment and maximum-likelihood watermark detection to enable content-oriented searches in a database. The algorithm obtained smaller samples than those in the conventional broadcast monitoring system based on a comparison of the whole sample set.
Several algorithms can be used to obtain an acoustic fingerprint; however, not all resist the compression and cropping attacks required by specific audio applications. Moreover, they are usually composed of elementary keys, also known as sub-fingerprints, based on small parts of the signal. Acoustic fingerprints are often composed of consecutive keys used to identify any part of a signal [
6].
The design and development of these security systems require highly complex operations, and they are usually implemented on non-specialized machines or general-purpose processors. This situation occurs when the SSM algorithm is used, and it conducts searches in large databases. Additionally, many computational resources are wasted because they may not be used or are used in other processes. Today, some lines of research focus on providing hardware architectures or new algorithms for improving performance results, depending on the system’s requirements, the application, or the user. For example, one user may need a system to display graphics quickly, whereas another may require the system to search efficiently in a database, or they may require low power consumption.
Audio fingerprinting algorithms are commonly resource-consuming tasks, and they are time-consuming when implemented in software running on non-specialized machines, which can be executing other tasks necessary for operating systems or other applications. For this reason, demanding operations such as the SSM algorithm or the requirements of an extensive database search require high computational resources. In this way, different hardware architectures are necessary due to the specialized needs of different systems and users. For example, a collusion-resistant fingerprinting system was implemented in [
7] and was found to be suitable for a massive online music distribution applications.The authors in [
8] proposed a security technique (MixLock) based on logic locking of the digital section of a mixed-signal circuit, which could be employed to mitigate reverse engineering and counterfeiting. They proposeda device identification protocol that leverages the frequency response of a speaker and a microphone from two wireless devices as an acoustic hardware fingerprint. A device identification protocol uses an acoustic hardware fingerprint extracted from the frequency response of a speaker and a microphone from two wireless devices, as proposed in [
9]. Furthermore, an audio fingerprint algorithm that balances the ideal amount of data embedded to enable a comparison, while keeping the fingerprints lightweight for manageable access, indexing, searches, and storage, was embedded on an ARM 7-LPC2148 device [
10]. In [
11], the design and testing of a music information retrieval algorithm was conducted based on fingerprinting techniques implemented in a low-cost, embedded, and reconfigurable platform. Different hardware can thus be implemented to satisfy different requirements, such as a fast graphics display system, an efficient database search, or low power consumption requirements.
In this study, a robust method based on the saliency maps of the audio signal spectrogram [
12] was implemented, proposing two hardware architectures on FPGA. After analyzing the window size, the use of hardware resources decreases, memory requirements are reduced, efficiency is increased, and power consumption is improved at the cost of a slight loss in performance. In addition, the search of the acoustic fingerprint in a database through correlation is presented. The architectures allow a significant parallelization of the computations, which results in a higher efficiency by 3.19 orders of magnitude.
The paper is organized as follows:
Section 2 presents the state of art in Fingerprinting,
Section 3 introduces two versions of the fingerprinting algorithm, while
Section 4 presents their hardware implementation.
Section 5 describes analysis and implementation results of the fingerprinting algorithms.
Section 6 presents a discussion of the proposed architectures and the main highlights of the analysis, whereas
Section 7 compares the obtained results with related works. Finally, conclusions and future work are discussed in
Section 8.
2. Fingerprinting and SSM
Some technological measures of protecting digital documents require an effective transmission and processing of the information contained in a protected work. In general, there are two types of technological protection measures in the digital domain: (1) those that manage the access, processing, and transmission of the work and (2) those that only protect its integrity and transmission. The first type involves extending the control of the digital use of files in an inter-operative manner. The second preserves the integrity and protects copyright, preventing any non-authorized modification, alteration, or distribution of the work.
Protection measures, such as anti-copying systems, encryption, and watermarking are not entirely secure. For example, digital watermarks have been proposed as an efficient solution to protect copyright and ownership of multimedia files (image, audio, or video), by making it possible to identify their source. However, digital watermarks are based on the code’s identification inserted directly into the content of the file, and it is possible to detect them only by using a specific algorithm and a key. On the other hand, acoustic fingerprints are used to identify audio, for search, navigation, monitoring, and other monetary purposes, such as music recovery and video identification. Acoustic fingerprints are extracted from audio, video, or images. However, they are not embedded in the file. Thus, the signal is not altered before its transmission.
The most popular audio transformations are resampling, compression, noise addition, recording, and temporal resynchronization [
13]. Audio compression reduces the size of an audio file, requiring smaller storage capacity. However, compressing an audio file many times results in a low fidelity of sound. Noise is all unwanted sound, and recording consists of D/A and A/D conversion or re-recording. Temporary desynchronization occurs when audio is delayed or advancing in time. Therefore, an audio fingerprint algorithm used to detect copies should be robust to these attacks.
An acoustic fingerprint is an identifier for audio files based on their content. With them, it is possible to identify a pattern or signature in audio files which can then be recognized from an audio database. In [
6], it is mentioned that a fingerprinting system usually consists of two components: (1) a mathematical process that calculates the fingerprint (i.e., fingerprint extraction) and (2) a search algorithm to scan a database of previously derived acoustic fingerprints in search of similarities (i.e., fingerprint search).
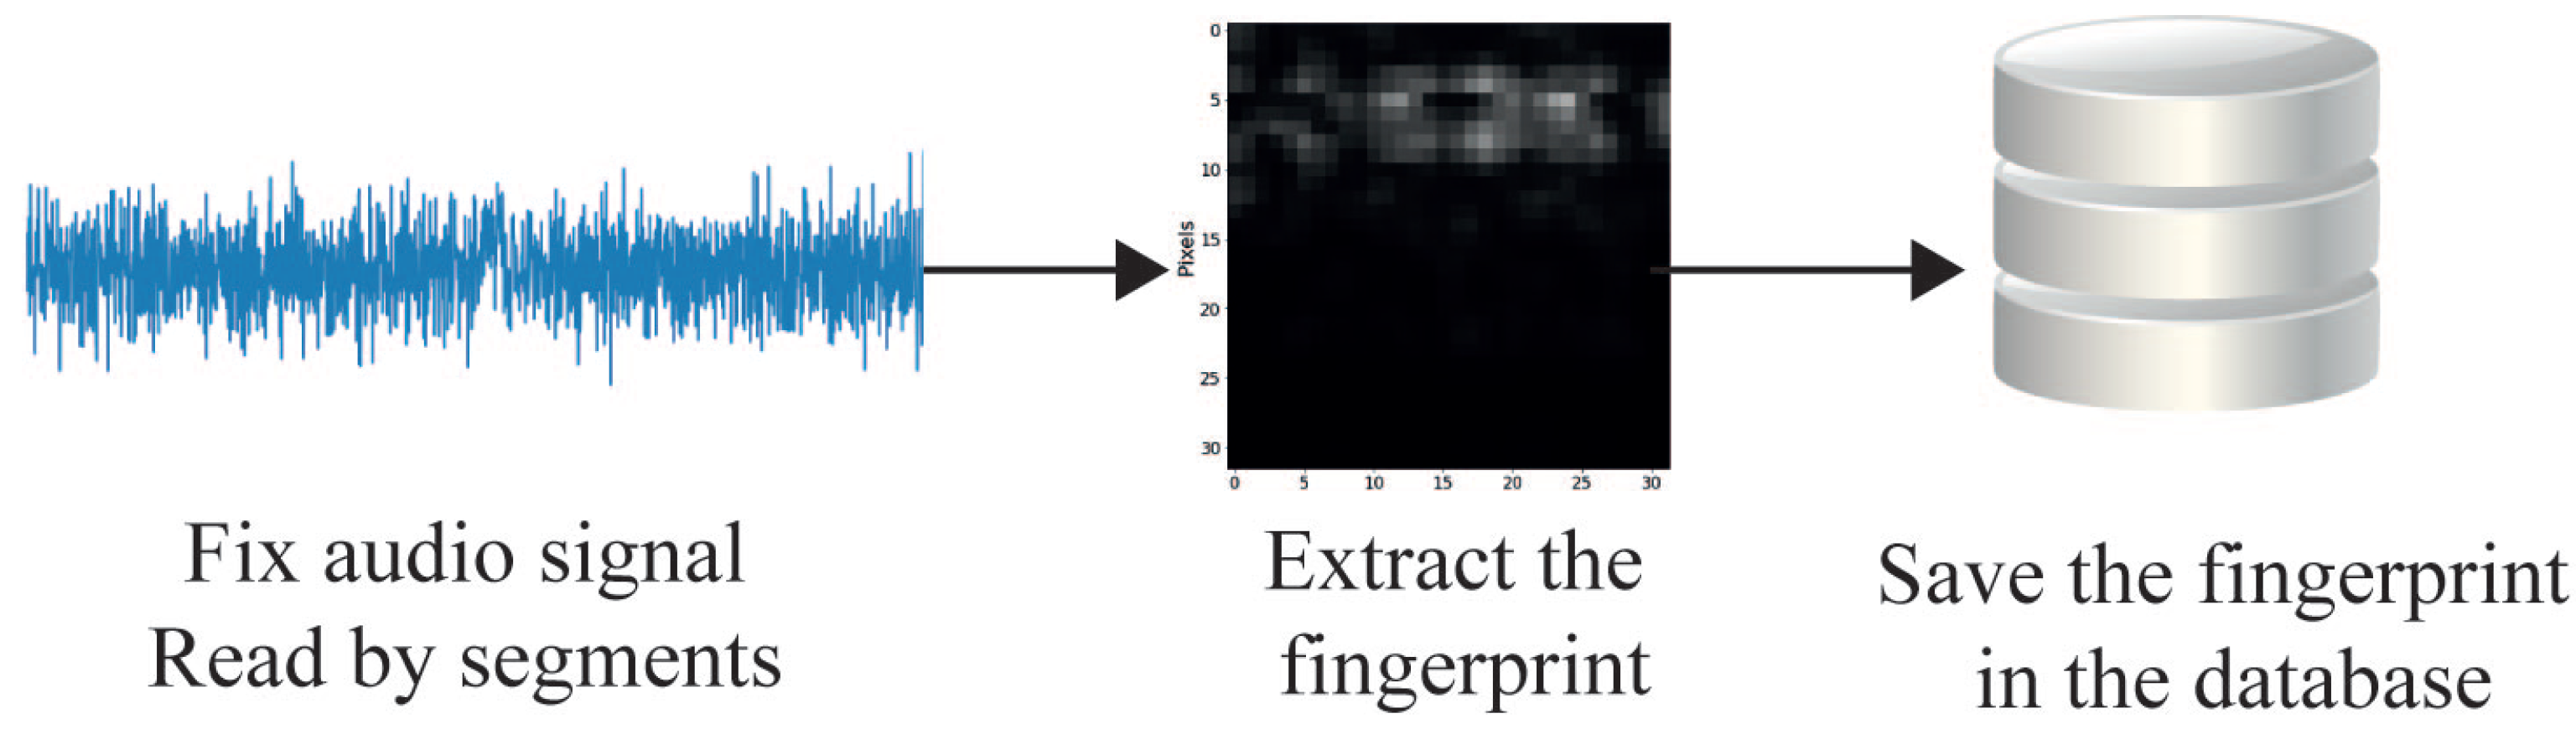
2.1. Fingerprint Extraction
Several extraction algorithms can obtain an acoustic fingerprint from an audio file, but not all of them resist compression and cropping. A few seconds of audio are needed to extract an acoustic fingerprint. A common technique is to divide the piece of audio into small segments and extract their characteristics. There are numerous strategies for this division process. The most common are the use of Fourier Coefficients, Cepstral Coefficients in Mel Frequencies (CCMF), Linear Predictive Coding, and Mean and Variance of characteristics. The next step is to map the extracted characteristics into a more compact representation, using Hidden Markov Models, Quantization, or other methods [
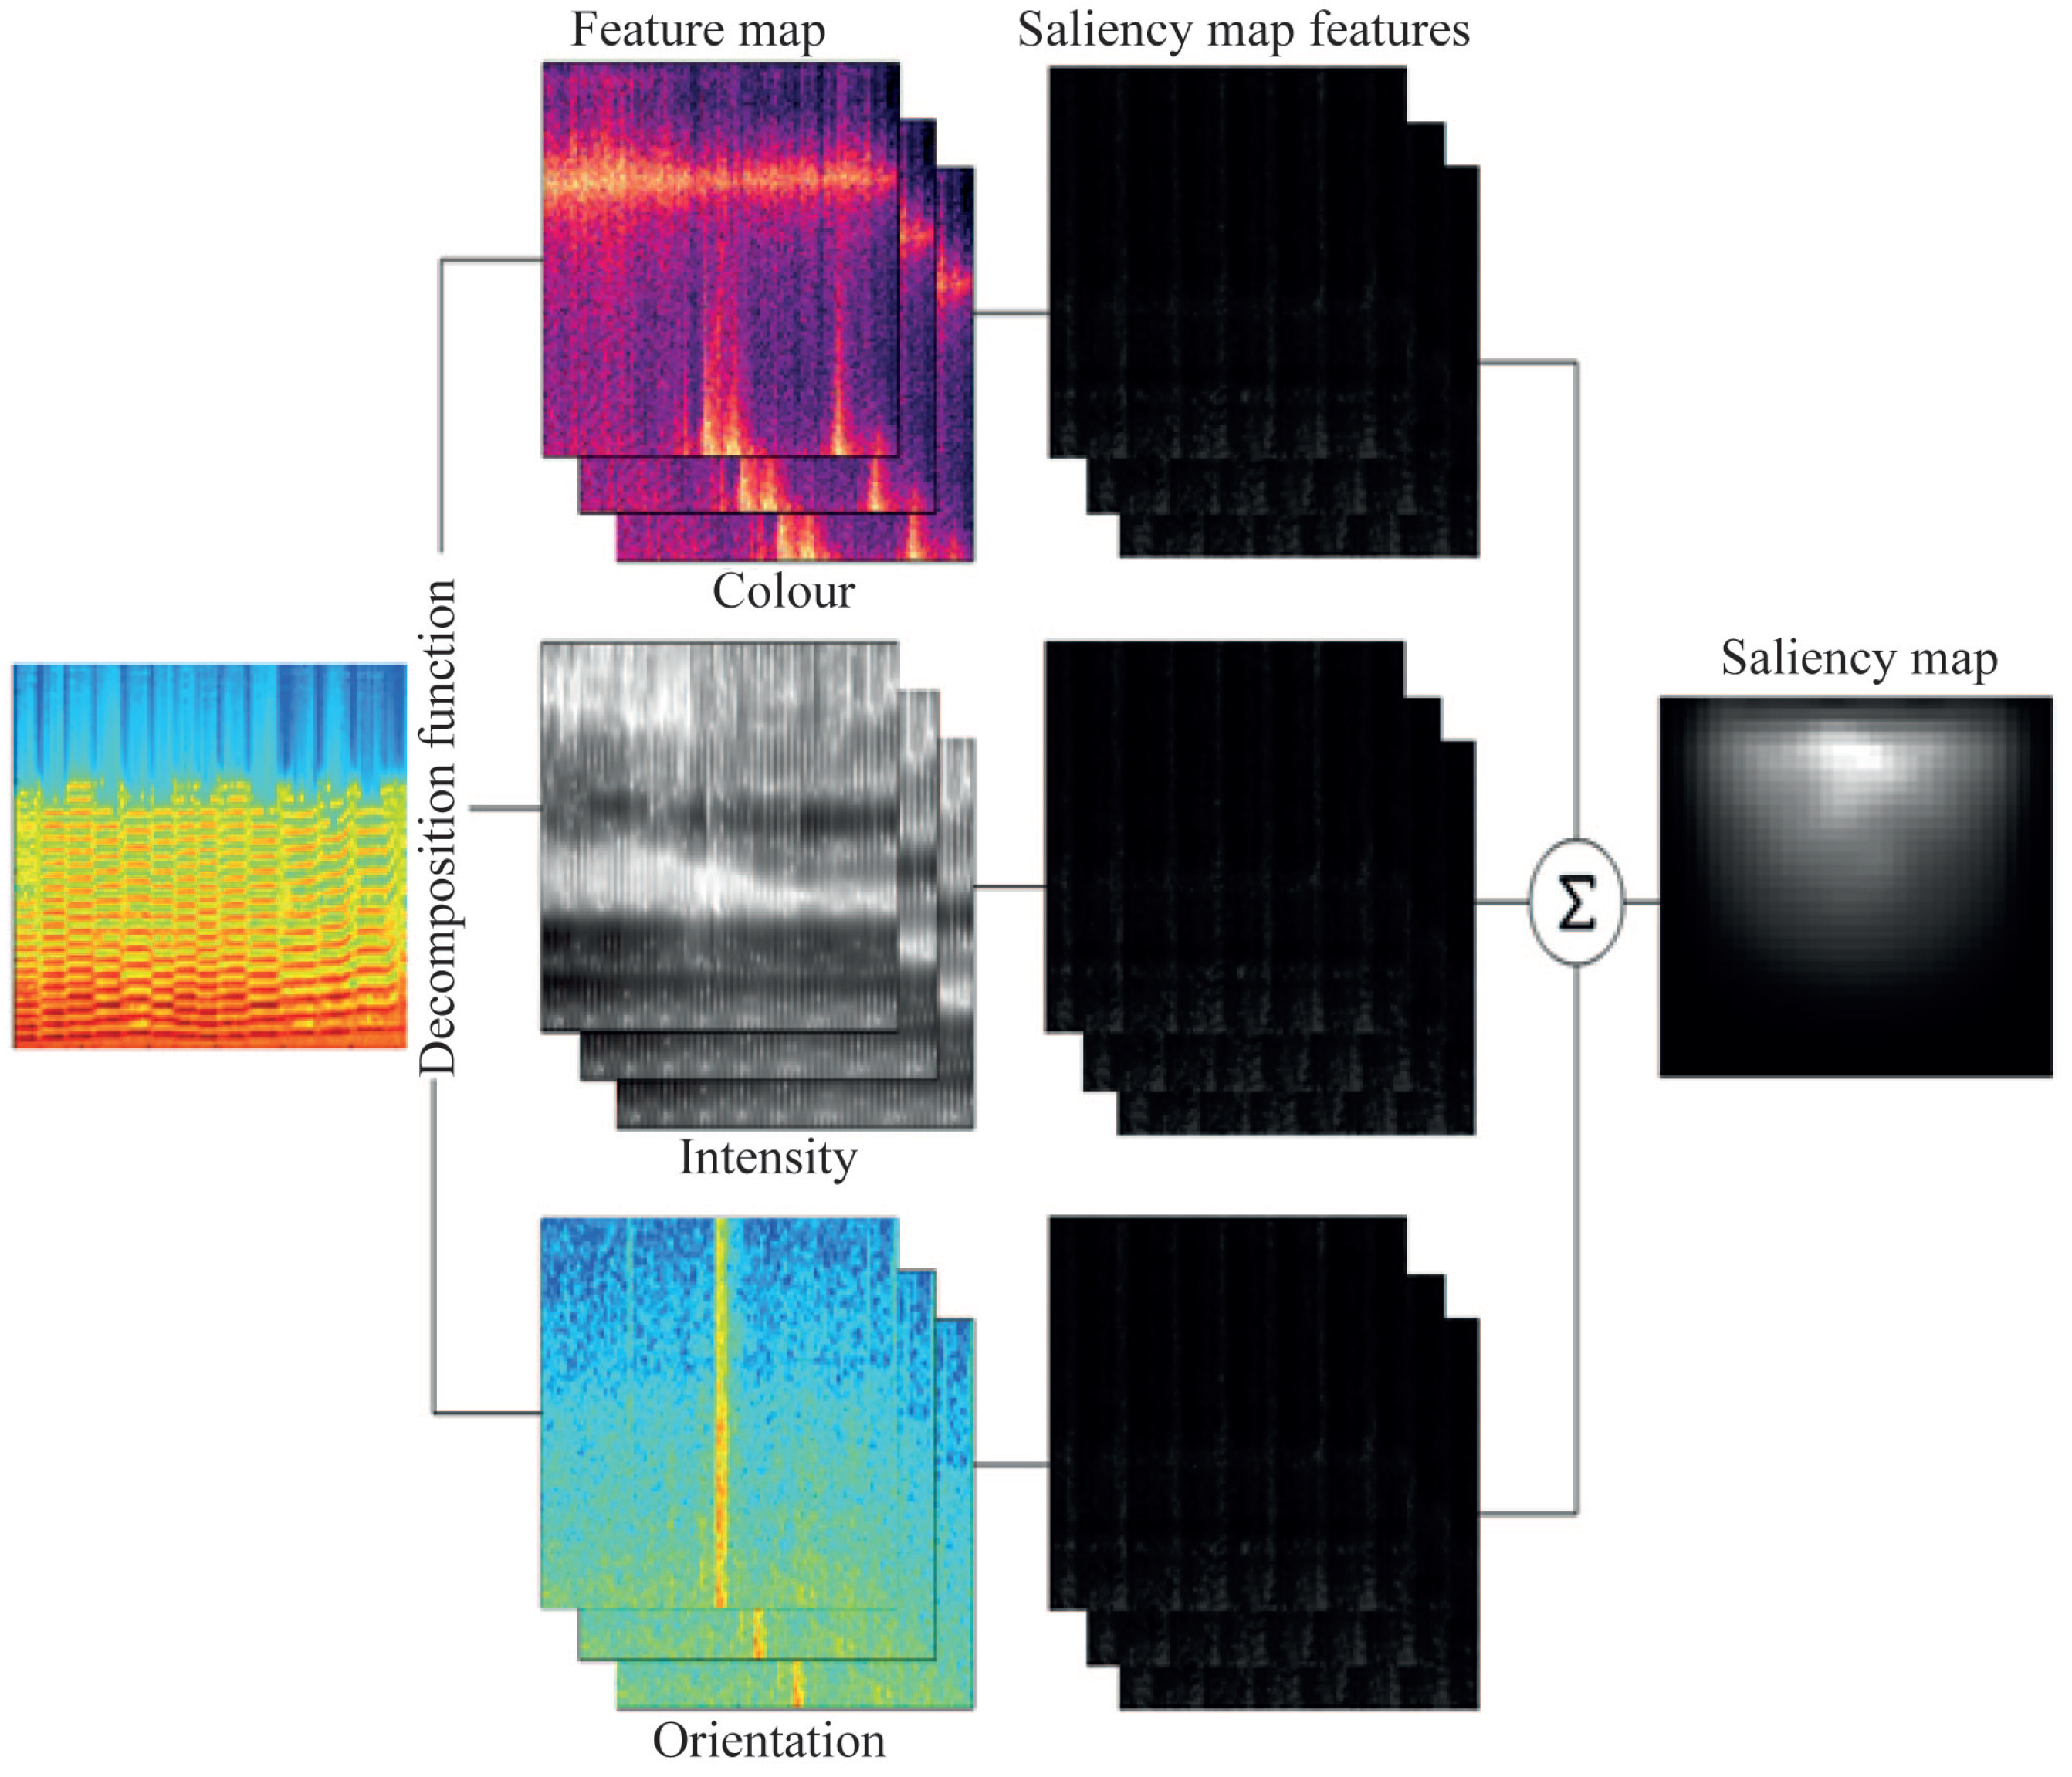
14]. In addition, fingerprints are usually composed of elementary keys (called sub-fingerprints) based on small parts of the signal. Often, the acoustic fingerprints are composed of consecutive keys used to identify any part of the signal. It is also possible to use the Spectrogram Saliency Maps (SSM) algorithm as a fingerprint extraction method, representing an audio signal through a spectrogram combined with a fingerprint extraction. The extraction of fingerprints is based on the saliency maps of the audio signal spectrogram.
Fingerprints are not exclusive to human fingers. They also exist in documents, but they must be extracted. For that extraction, there are many algorithms, such as Winnowing, Karp–Rabin, All-to-all matching, and Shazam.
In [
15], the Karp–Rabin algorithm for matching sub-strings is the first fingerprint version based on
k-grams. It consists of finding the matches of a particular string
s of length
k within a longer string. On the other hand, Winnowing [
16] presents an efficient local fingerprinting algorithm that selects the minimum value of a hash window. If there is more than one hash with the minimum value, the algorithm selects the rightmost occurrence. Then, all selected hashes are saved as the fingerprints of the document. The authors in [
17] propose that by using an unknown audio’s acoustic fingerprint, a query can be made in a fingerprint database (from an extensive library of songs) to identify the audio. This system requires a robust method of fingerprint extraction, and a very efficient search strategy capable of working with limited computer resources. A copy detection algorithm should have three properties: (1) blankness insensitivity, (2) noise suppression, and (3) independent position. For the search of traces, previous works describe some methods such as a hierarchical search, reduction in candidates, and a search based on the tree.
On the one hand, Ref. [
18] describes a system of acoustic fingerprints consisting of a generation algorithm and the searching algorithm to find the matches of the fingerprints in a database. In addition, the fingerprint extraction includes a front-end where audio is divided into frames, and a series of robust discriminating features are extracted in each frame. Subsequently, these features are transformed into a fingerprint by a modeling unit that compacts the representation of fingerprints. On the other hand, Ref. [
19] presents an audio detection system robust to various attacks, such as pitch and tempo change. In that work, a two-dimensional representation is proposed for audio signals called chroma time images. A pitch change in the audio signal appears as a circular shift along the chroma axis of that image, and a change in tempo in the audio signal appears as a scale change along the time axis of that image. In [
20], the authors consider chromatic characteristics and compare the performance of the systems based on them, with the use of the timbral characteristics in the same experimental frame. When making system classification based on the equal error rate, they conclude that the best audio segmentation uses detectors grouped by octaves and sub-bands for music and noise. For the voice, the timbral characteristics use the CCMF-SDC (Cepstral Coefficients in Mel Frequencies–Shifted Delta Coefficients).
In [
21], the Shazam algorithm is described, which is based on local acoustic fingerprints, and uses the peaks observed in the spectrogram of the audio signal as the points of local characteristics. This algorithm is resistant to noise and distortion, is efficient and scalable, and it is able to quickly identify a segment of music captured through the phone’s microphone from a base of more than one million songs. Furthermore, the algorithm uses a combinatorial method of time-frequency analysis for the audio constellation, producing unusual properties such as transparency, in which several mixed tracks can be identified.
2.2. Fingerprint Search
An essential point for the usability of a fingerprint system is how to make comparisons between unknown audio and, possibly, millions of fingerprints. In general, the methods depend on the representation of the fingerprint [
2].
In this regard, the search is an important operation since it allows recovering previously stored data. The search result is successful if the information is found, or unsuccessful if it is not found. The search can be applied to ordered or unordered elements. Additionally, Ref. [
22] describes that search methods can be classified as follows: (1)
Sequential. This method consists of reviewing the data structure element by element, until the data that are being looked for are reached. This method works for ordered or unordered data. (2)
Binary, where the method divides the total of the elements in two, comparing the searched element with the central one. This method only works if the data have been previously sorted. (3)
Hash. The key transformation method increases the search speed without requiring the elements to be previously ordered. This method allows access to the data by a key that directly indicates where the searched data are stored.
There are also searching systems based on the Index of Inverted File. For example, Ref. [
23] describes a system that uses a look-up table (LUT) of possible entries of sub-fingerprints, with pointers to fingerprints in the base of data. The applicability depends on the alphabet and the size of the sub-fingerprint. It may be feasible to generate a list containing all possible entries and corresponding pointers. The index uses code words extracted from binary sequences representing the audio. In addition, in [
17], an index of possible track pieces that point to positions in the songs is proposed. Since a piece of the candidate track is free of errors (exact match), a list of candidate songs can be efficiently obtained to exhaustively search in.
On the other hand, the filtering of unlikely candidates is proposed, where [
24] describes an effective way to reduce the search space using a simple similarity measure to quickly eliminate many candidates, ensuring that false rejections do not occur. During the comparison process, candidates with the worst score can be excluded.
There are methods based on a hierarchical search; for example, Ref. [
25] presents a hierarchical search using an abstract version of the problem to dynamically generate heuristic values. In addition, there is a regressive switchover, which reduces the number of expansions and, therefore, the execution time.
Finally, some methods use a tree-based search since, in essence, the search for a fingerprint is similar to the search for the nearest neighbor. Often, trees are used to locate the nearest neighbor. Authors in [
26] propose an algorithm in which, every 5 s, a binary fingerprint block (8192 bits) is considered as a point in the fingerprint space. The fingerprint block is divided into 1024 8-bit patterns. The value of each consecutive 8-bit pattern determines which of the 256 possible children descends. A path from the root node to a leaf defines a block of fingerprints. When a query fingerprint is consulted in the database, each 8-bit pattern is compared with the tree elements; the error between the query fingerprint and the best sheet is estimated at each tree level. As soon as the error is estimated, the best result is found, and the search stops.
3. Algorithm and Analysis
This section describes two key elements: (1) the audio fingerprinting algorithm, which has two different versions of the searching module, depending on their storage: the brute-force search and the optimized brute-force search; (2) the analysis necessary to reduce the window size, optimize the storage, and, consequently, the search process. The two versions of the algorithm are implemented on hardware in the next section.
3.1. Audio Fingerprinting Algorithm
The audio fingerprinting algorithm uses fingerprint extraction and the searching process in the database. The searching procedure has two versions depending on the storage. However, the algorithm simultaneously exposes the SSM algorithm as a fingerprint extraction method, and the correlation as a searching process. The first version is based on brute-force searching. The other is based on an optimized search, with a reduced window size, which results in an improvement in several performance characteristics.
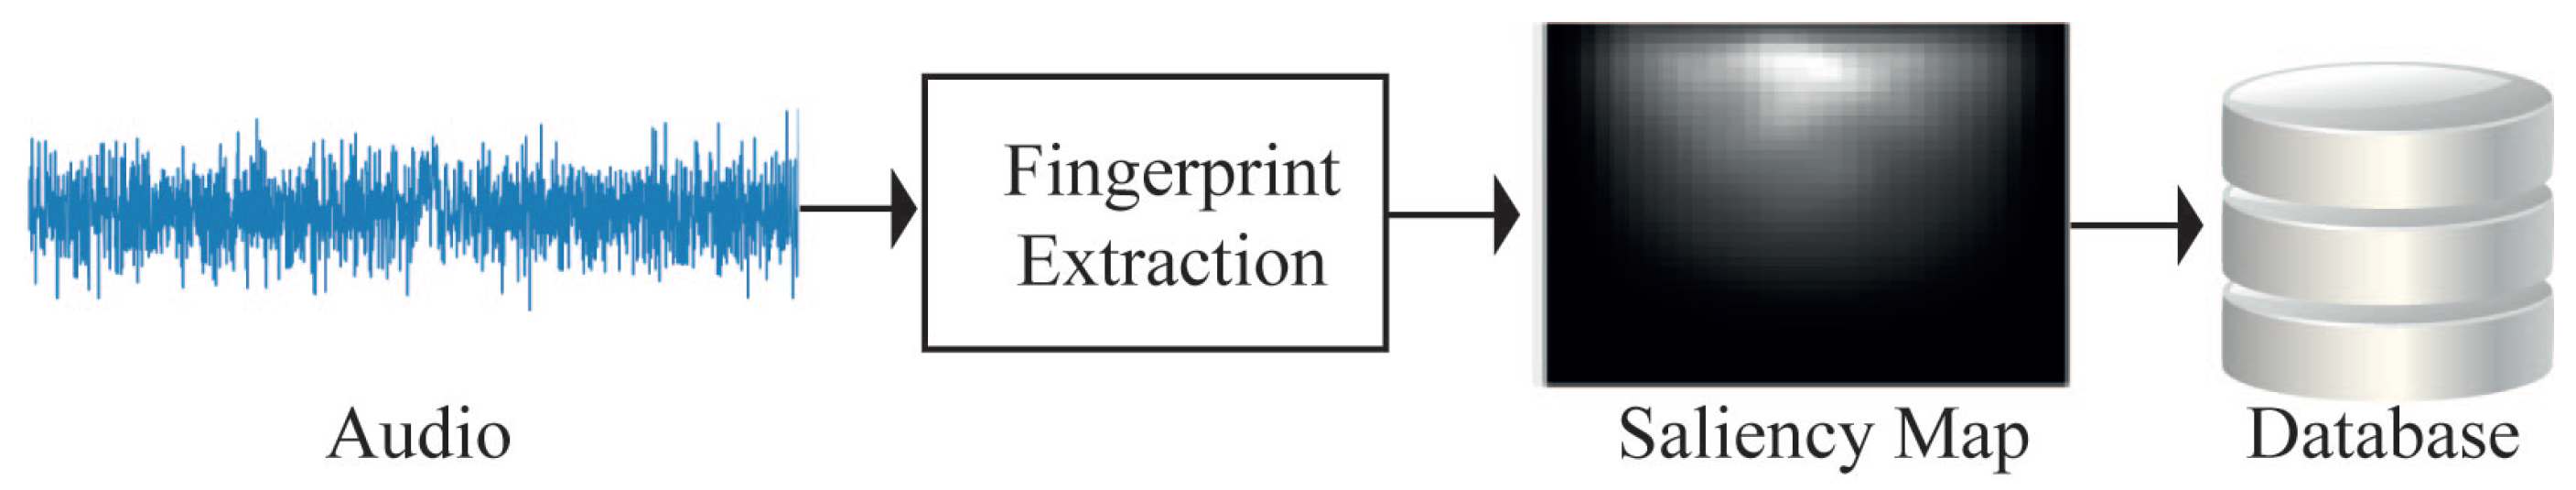
Figure 1 shows the general diagram of the algorithm proposed by [
12], where the audio signal is represented by a spectrogram, combined with a fingerprint extraction method based on the saliency maps of the audio signal’s spectrogram. On the other hand, the correlation function is used to search the acoustic fingerprint in the audio database.
3.1.1. Fingerprint Extraction
Fingerprint extraction is based on the SSM algorithm [
12] and consists of three fundamental steps:
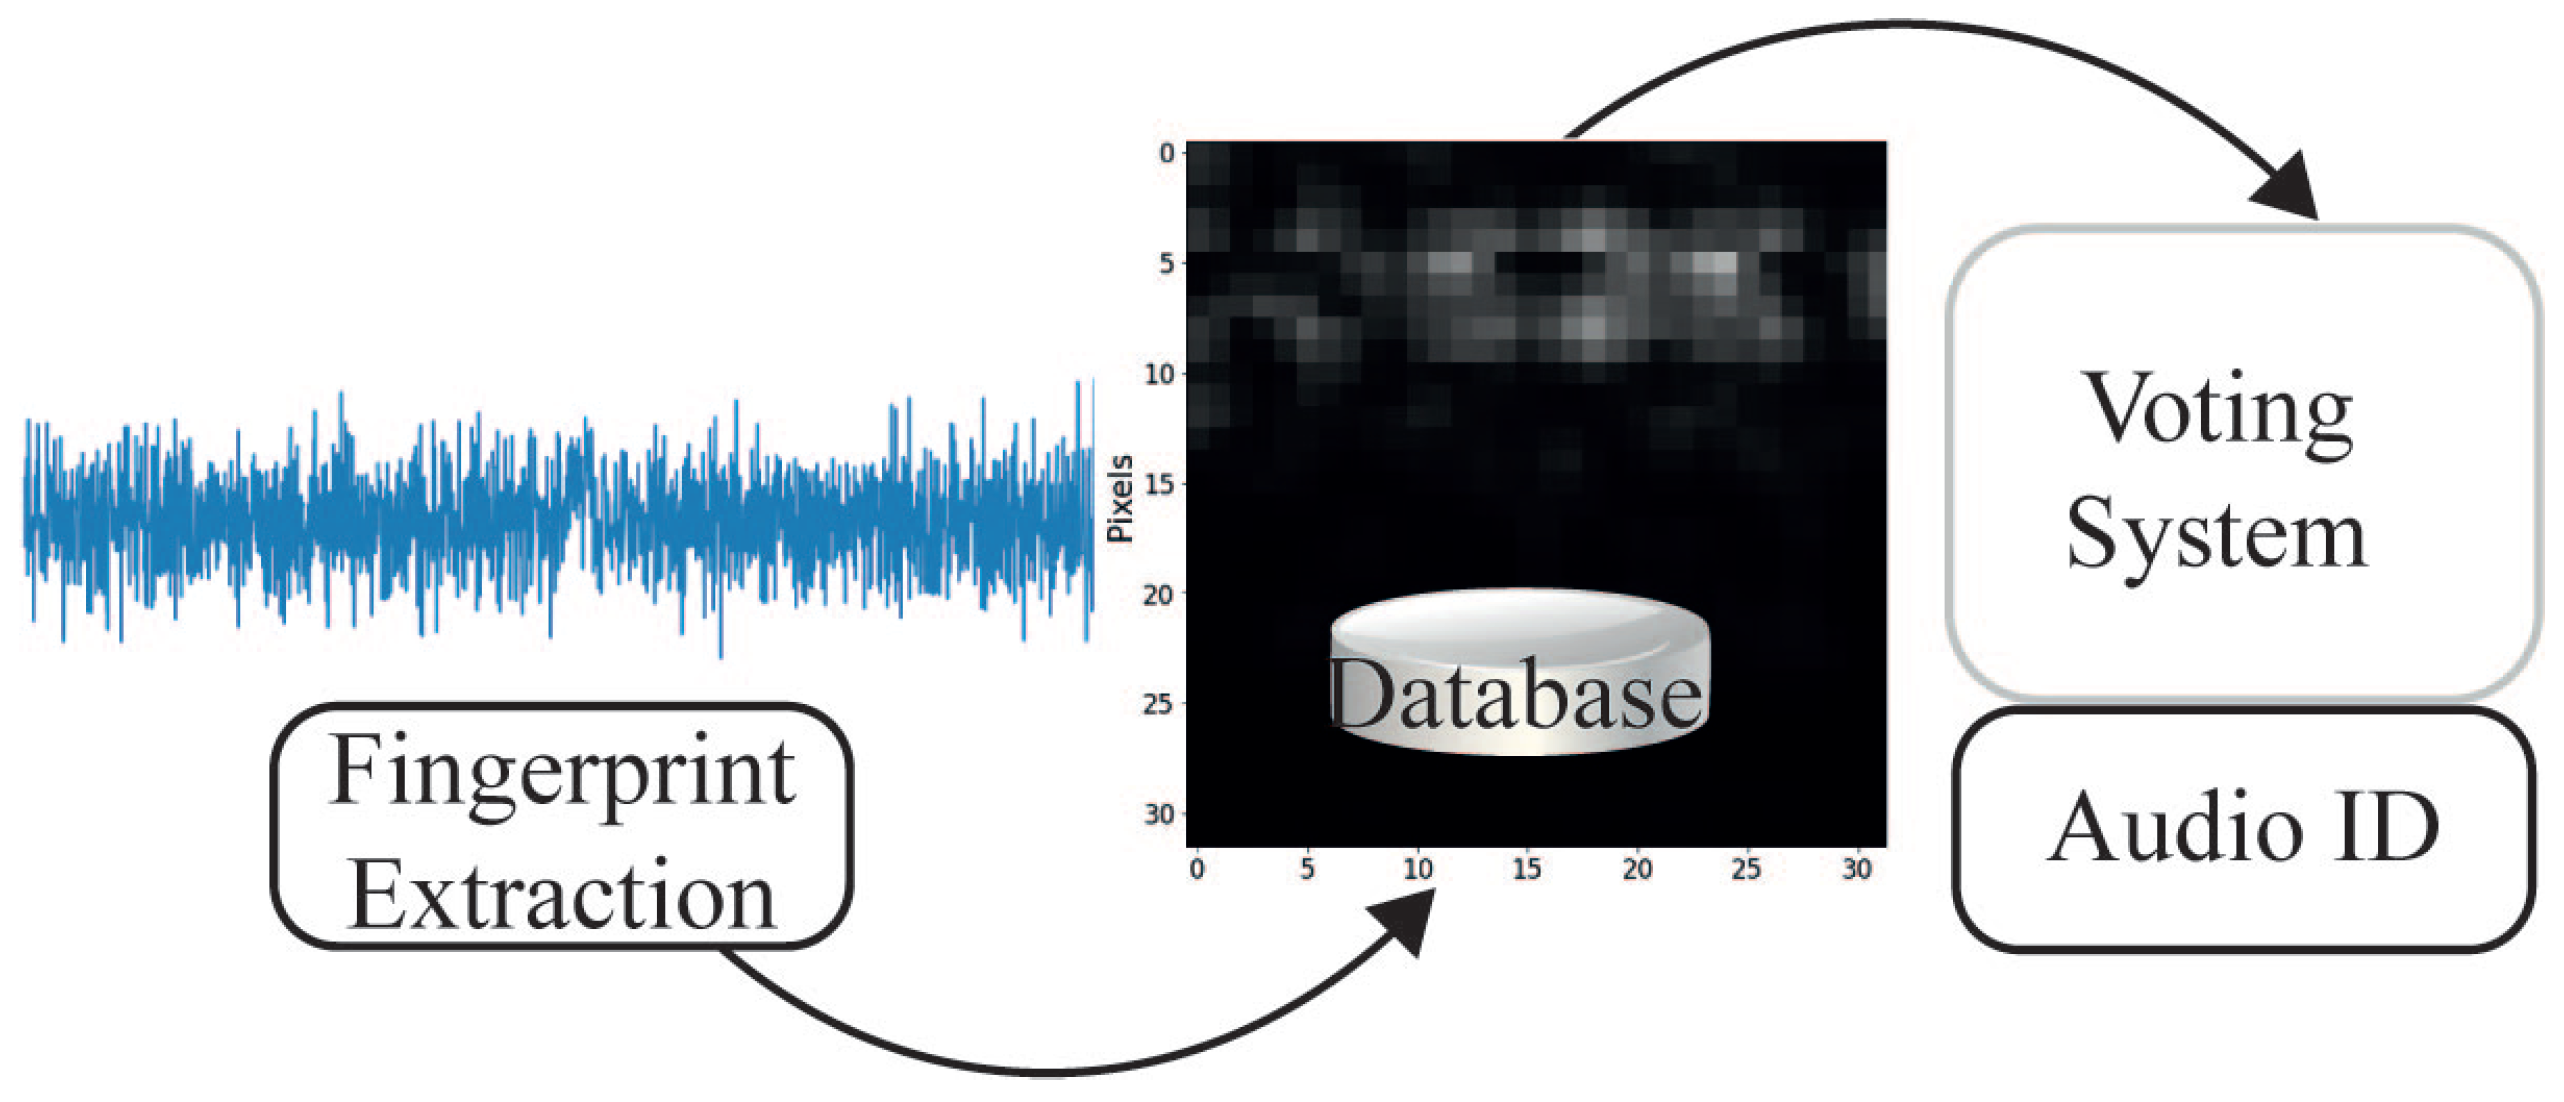
3.1.2. Search Process
The search process consists of two sub-processes: (1)
extracting the fingerprint and (2)
matching. The extraction has been described previously, but instead of performing it from the complete audio, it is performed from segments of the query audio. Later, a matching process based on correlation is applied to compare the query track and the tracks stored on the database. See
Figure 7.
The brute force search presented in [
12] consists of comparing between unknown audio and possibly millions of fingerprints using correlation. Algorithm 1 presents the pseudo-code for this process. Its main operation is the correlation function named
, which is described by Algorithm 2.
| Algorithm 1 Brute Force Search. |
Require: I binary edge image Input , Output , for each track do if C> then
return else end if end for
|
| Algorithm 2 Correlation Function . |
Require: I binary edge image Input , Output , for do end for for do end for if then end if for do end for return
|
3.2. Sample Size Analysis
The analysis focuses on identifying the correlation between the song and its sample, including the amount of data in each data set register. Each saliency map is of a 32 × 32 size, and each datum is 8 bits long. The data set is made up of 33 songs of 10 seconds each (tracks
,
, …,
), where each song is divided into three parts: (1) the first 5 s (segment
), (2) the last 5 s (segment
) and (3) from second 2.5 to second 7.5 (segment Tn 3). For each segment, the saliency map is obtained, so the data set has 99 records or saliency maps, 5 s each segment. The 32 × 32 salience map can be observed as an array with indices (1:32, 1:32), the first index for rows, and columns. More details about the algorithm design and parameters are found in [
12,
13].
The hypothesis used to perform this analysis is that not all data from the 32 × 32 matrix are necessary. Therefore, the number of operations in the correlation process can be reduced, benefiting the search process and the architecture’s performance.
Table 1 shows the correlation between saliency maps of different sizes and one of three segments of the saliency map stored in the dataset. For example,
refers to Track 1 (
) and segment 3 of Track 1 (
). On the other hand, the first column (16:32, 8:24) means that the saliency map sample is extracted from rows 16 to 32 and from columns 8 to 24 of the original to reduce the 32 × 32 original size map. In this way, the highest (cells in green) and lowest (cells in yellow) correlation indices are identified.
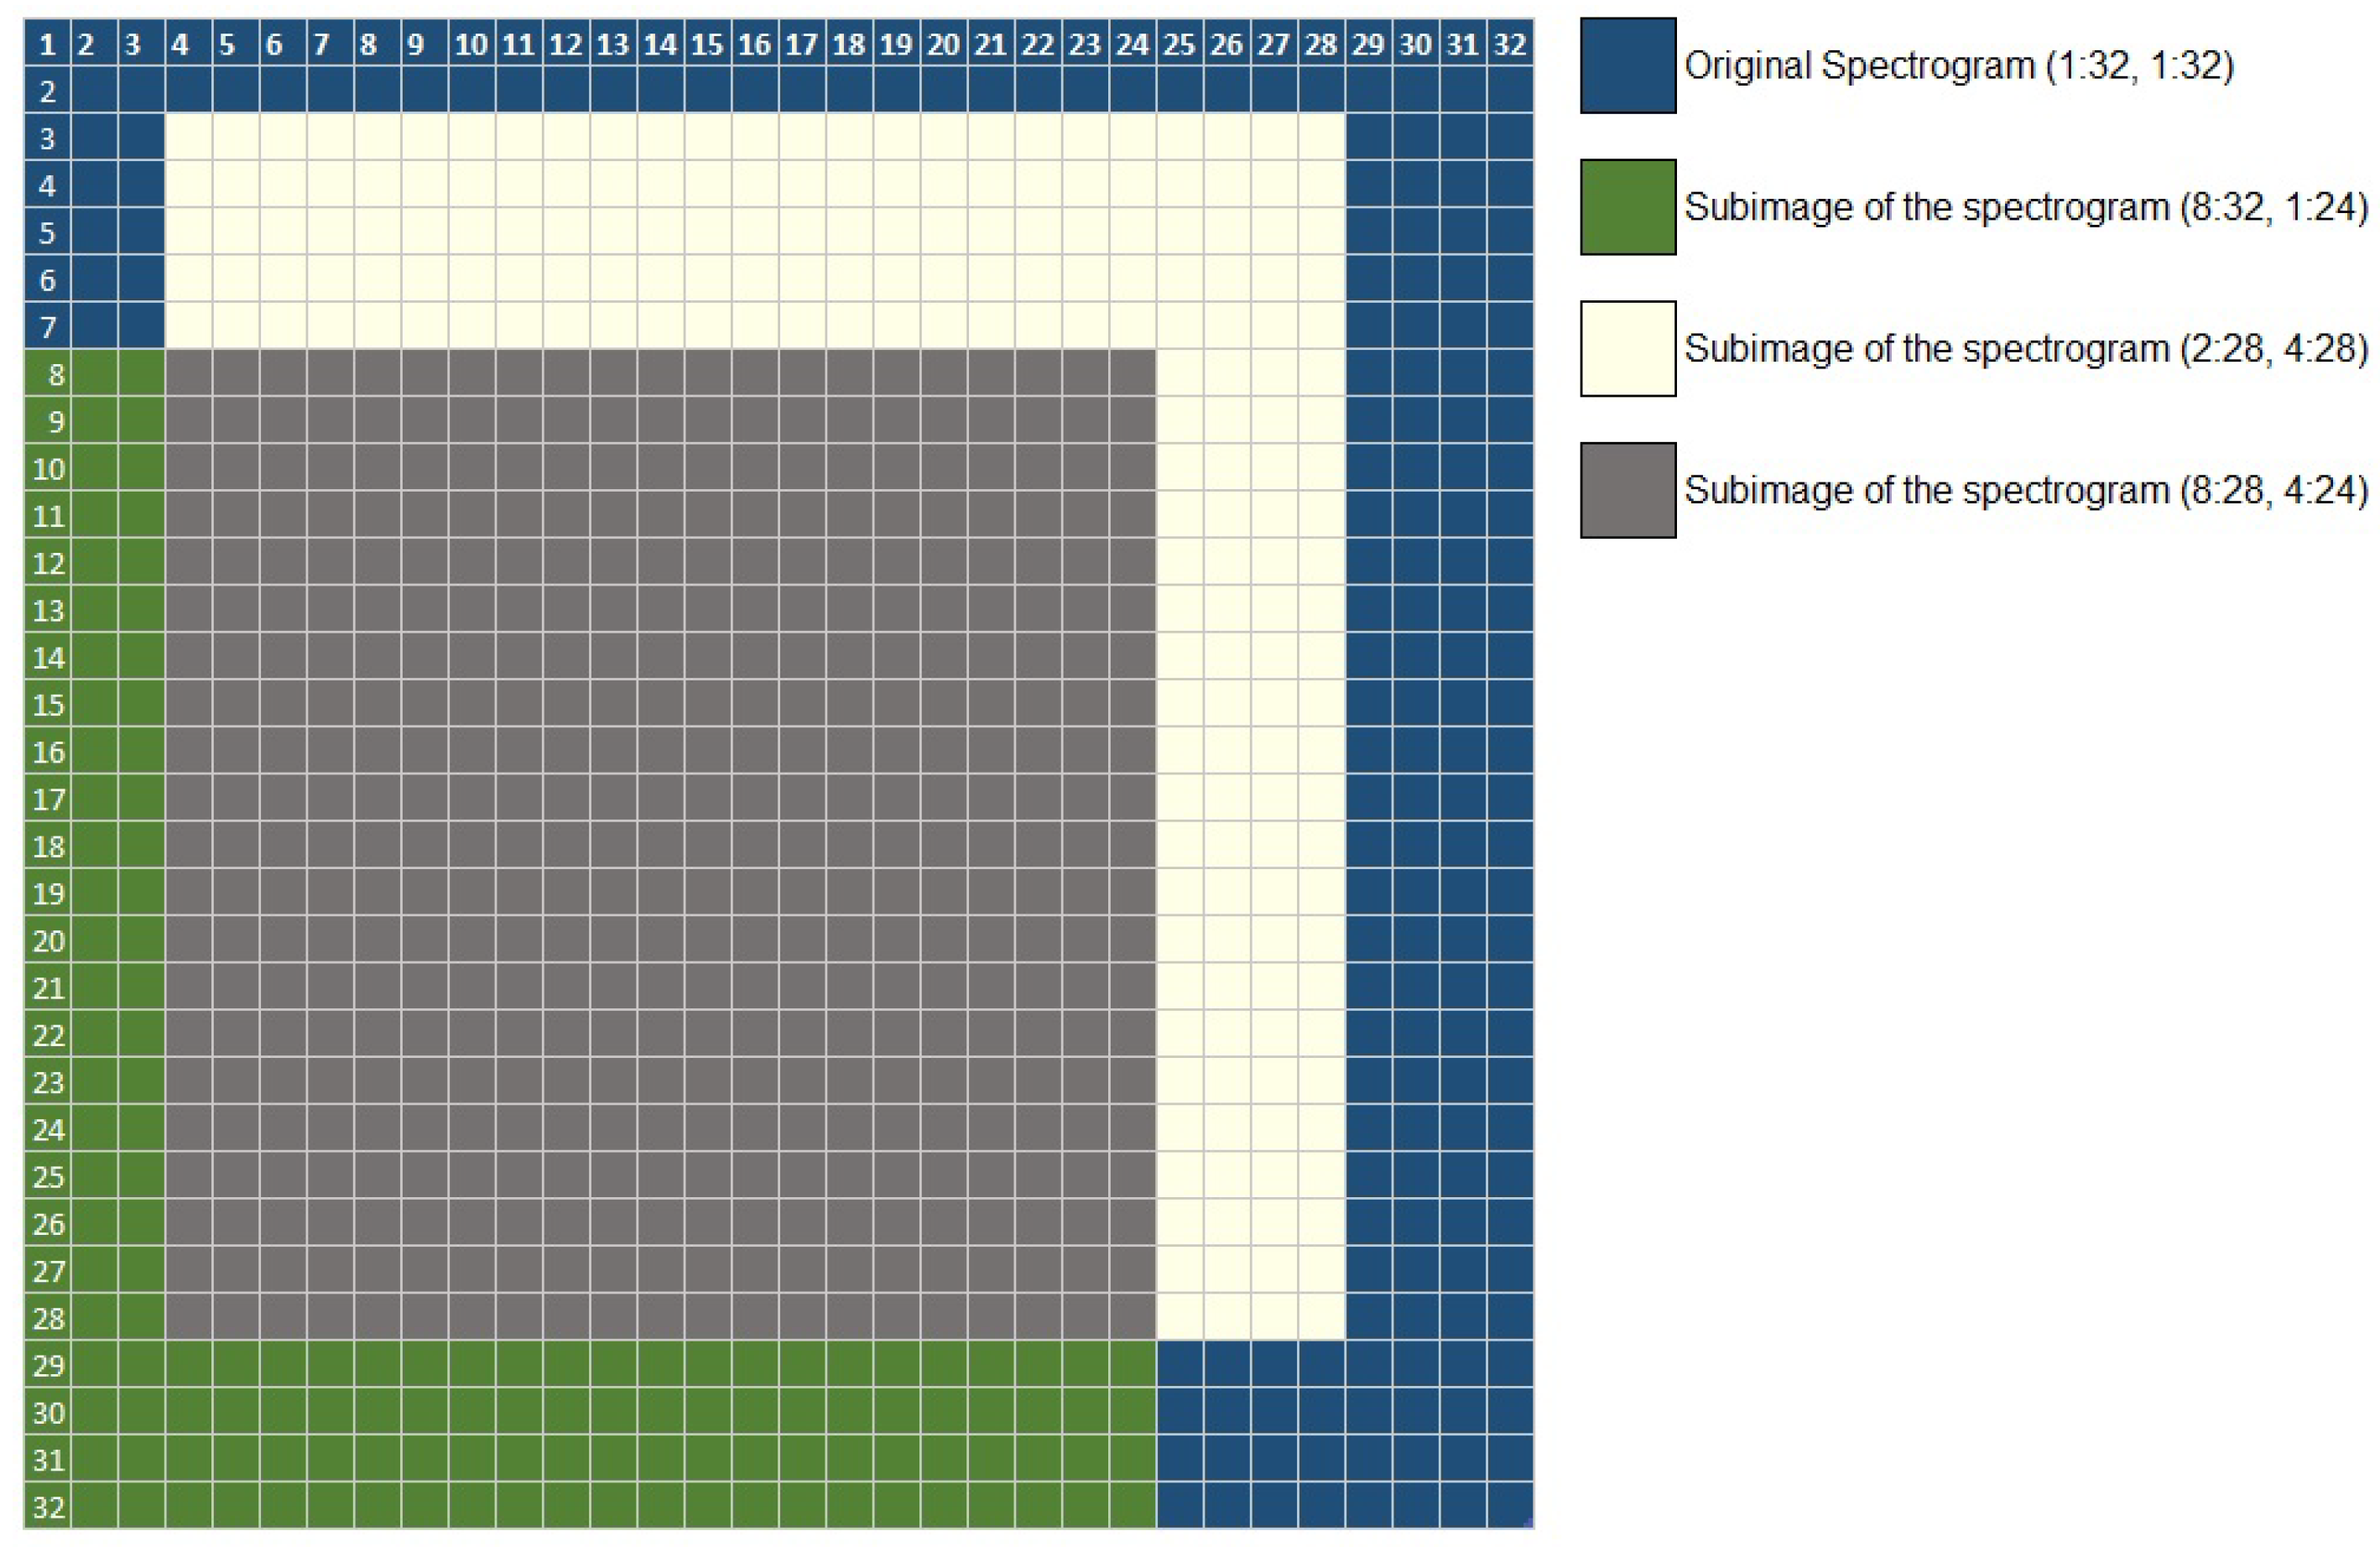
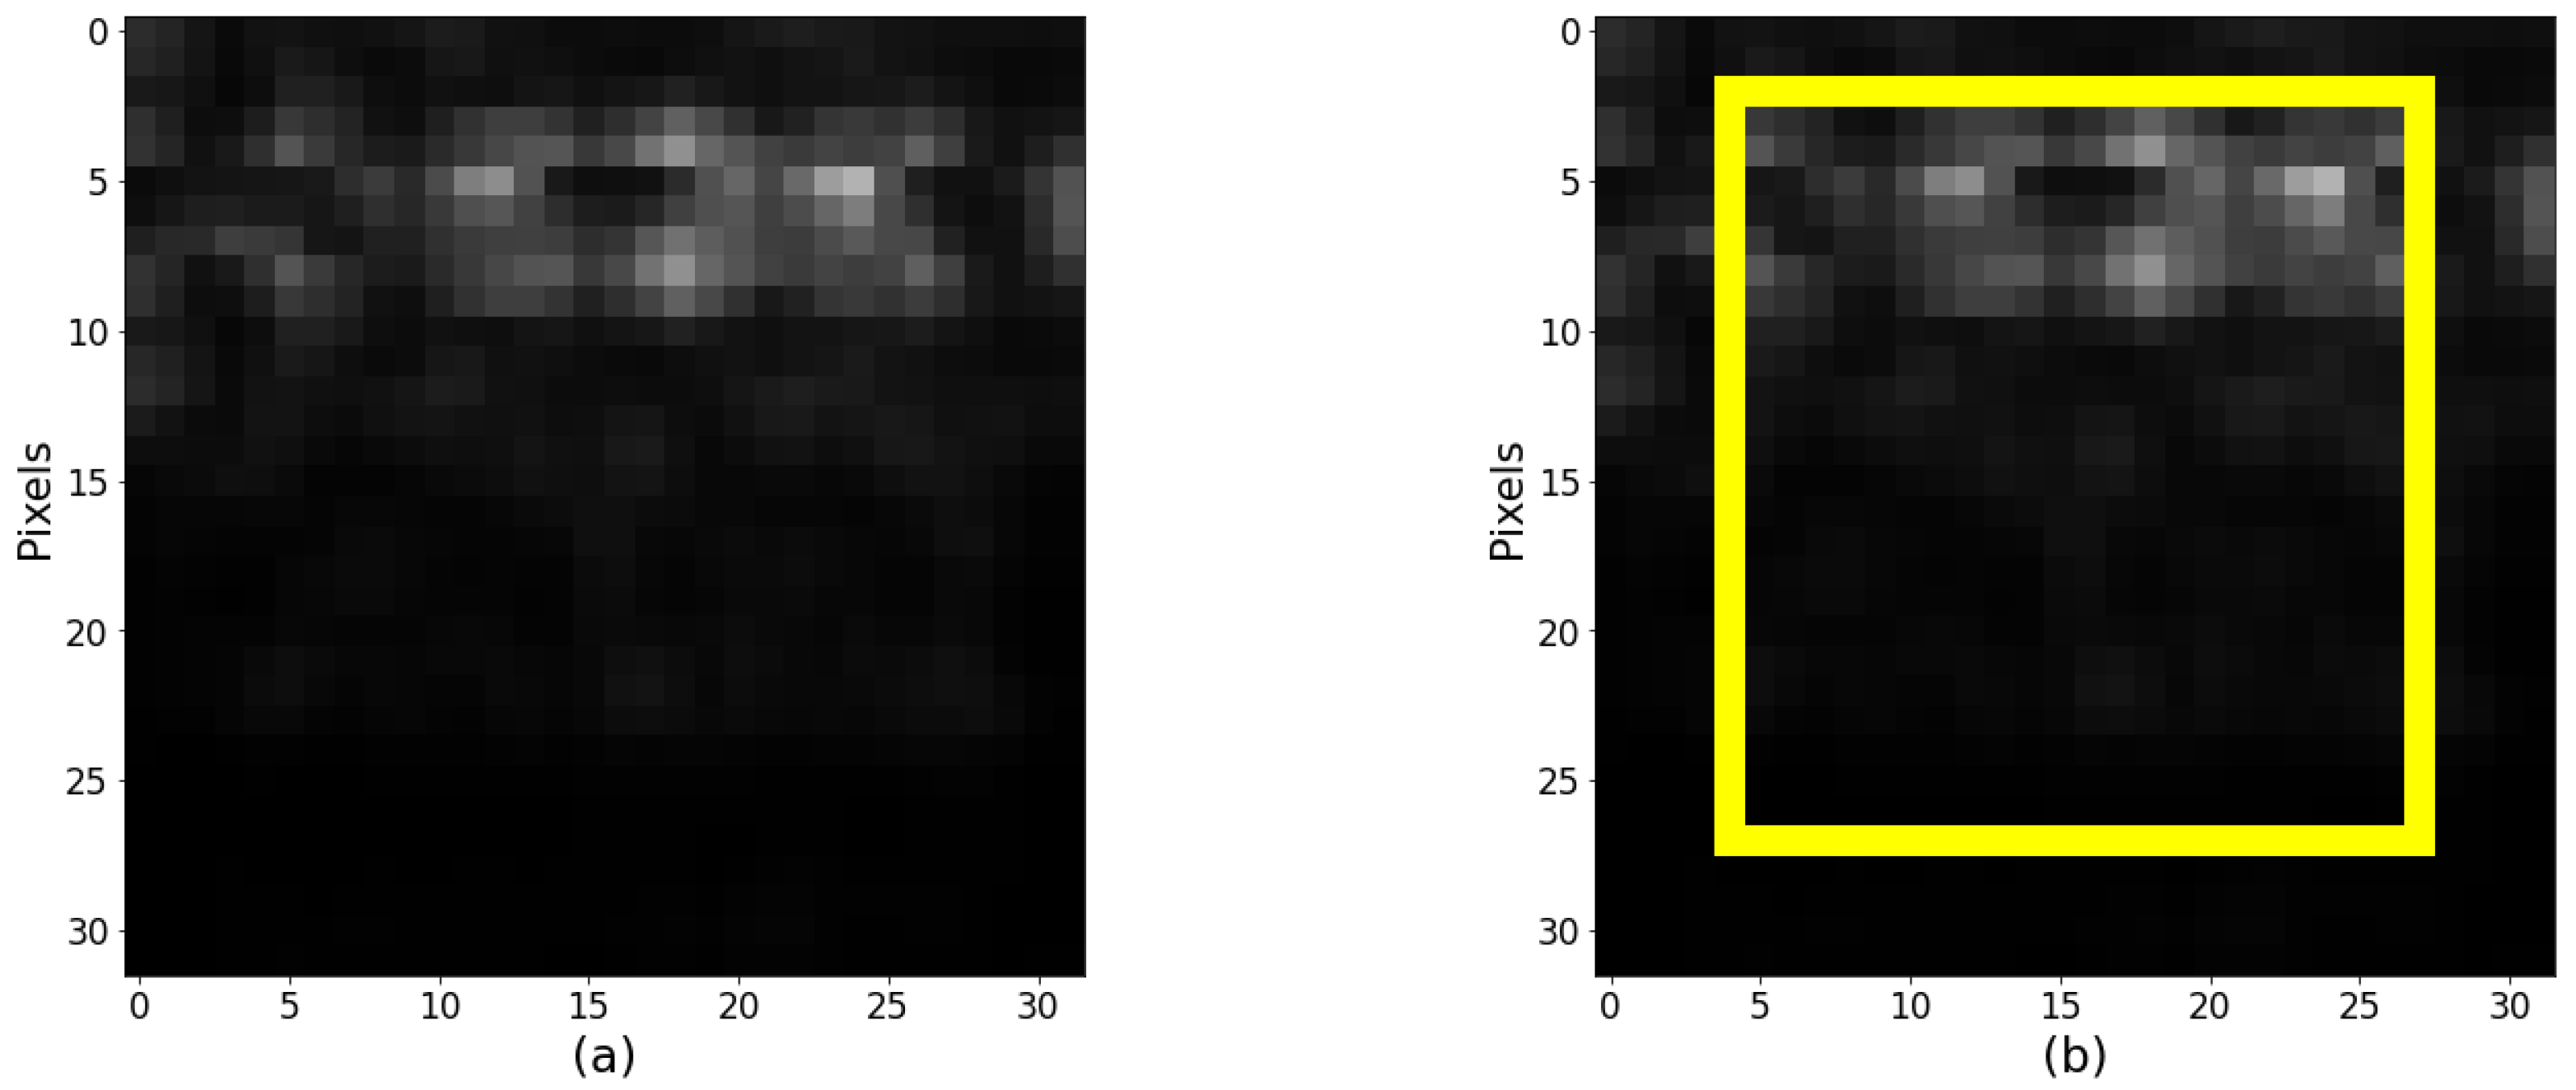
Figure 8 shows the regions where the three sample maps with the best success averages intersect. These are (8:32, 1:24) in green, (2:28, 4:28) in white, and (8:28, 4:24) in gray; all of them obtained from the complete map colored in the common region: (2:28,4:28).
After computing the average accuracy, it is determined that the slice of the main map (2:28, 4:28) obtains the same accuracy when comparing it with the complete map, 95.27% with the same data set, while other settings have lower results. For example,
Figure 9 shows the complete map (32 × 32) on the left, and the smallest map (27 × 25) on the right is framed in yellow. Therefore, the accuracy is not affected while significantly reducing the number of required calculations, both temporal and spatial, as demonstrated with the implementation in the next section.
A contribution of this work is demonstrating that most of the samples obtained from the SSM algorithm have relevant information in the center of the fingerprint, obtaining the same accuracy and reducing the searching time, with less computational complexity in software and hardware implementations.
4. Hardware Implementations
In this section, the design of hardware architectures for the search and the correlation modules is presented. The hardware designs of the architecture were implemented in the System Generator. It is essential to highlight that the two hardware proposals use brute-force search, although the second one utilizes an optimized process in the search based on its generation and storage.
4.1. Search by Brute Force
The implementation of the hardware architectures for the search consists of two deterministic finite automata. The first one is used to control the search and the second to perform the correlation. In addition, it uses a module that acts as a voting system under the condition of keeping the record of which saliency map has the highest correlation.
Figure 10 shows the complete architecture of the
Search System: the
Signal Builder that generates a signal, a block called
MCode that performs the function of automaton, then two
counters and two
ROMs, where memory
A0 symbolizes the audio or unknown saliency map and
B0 the database. Finally, there are two modules. The first one was named
Correlation Function, and the second one was named
Comparison.
This proposed hardware architecture can be used for map sizes presented on the analysis, 32 × 32 and 27 × 25, with 1024 and 675 elements, respectively.
4.1.1. Correlation Function
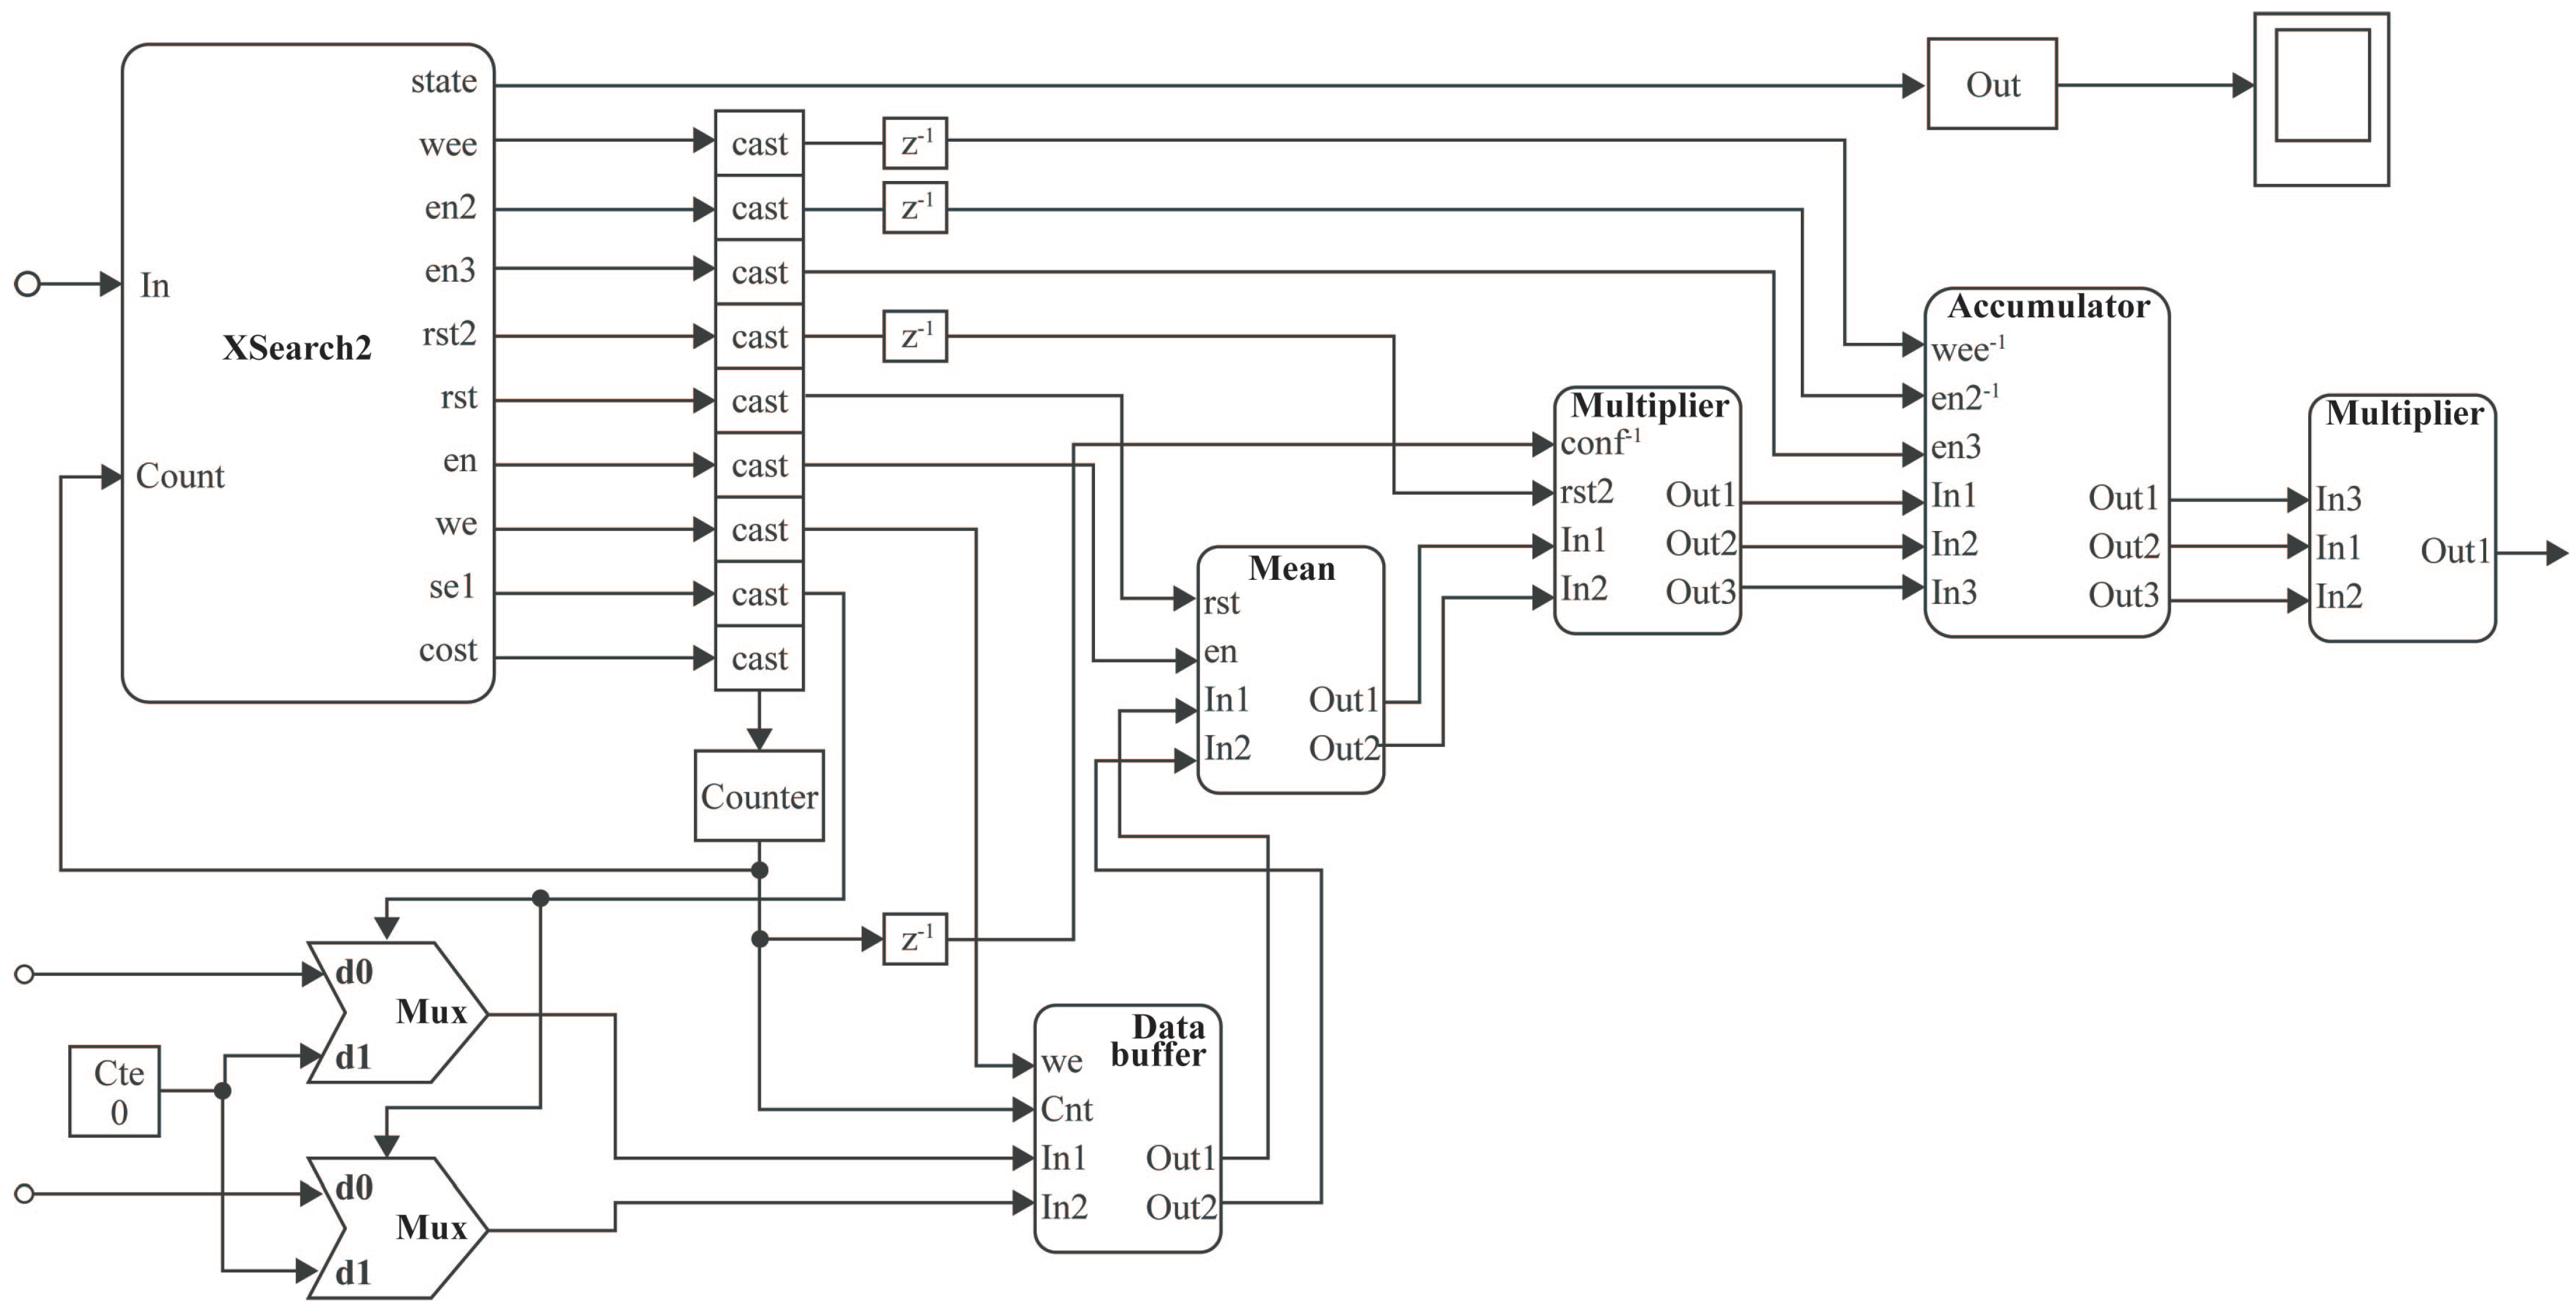
The
Correlation Function is one of the most critical modules; its output is essential for the system’s functionality. In this case, the correlation function is the search criteria; its hardware architecture design is presented in
Figure 11. The module of this function contains three inputs and one output. The first input corresponds to the start signal sent from the
MCode1 block, and the other two correspond to the used saliency maps. This function is composed of an automaton that coordinates and synchronizes the data and several subsystems (
Data Input, Mean, Multiplication, Accumulator, and
Correlator), and blocks with different functionalities, such as store, accumulate, or multiply data. Additionally, two multiplexers reset the RAM values used in the first subsystem called
Data Input, the output of which will be the saliency map.
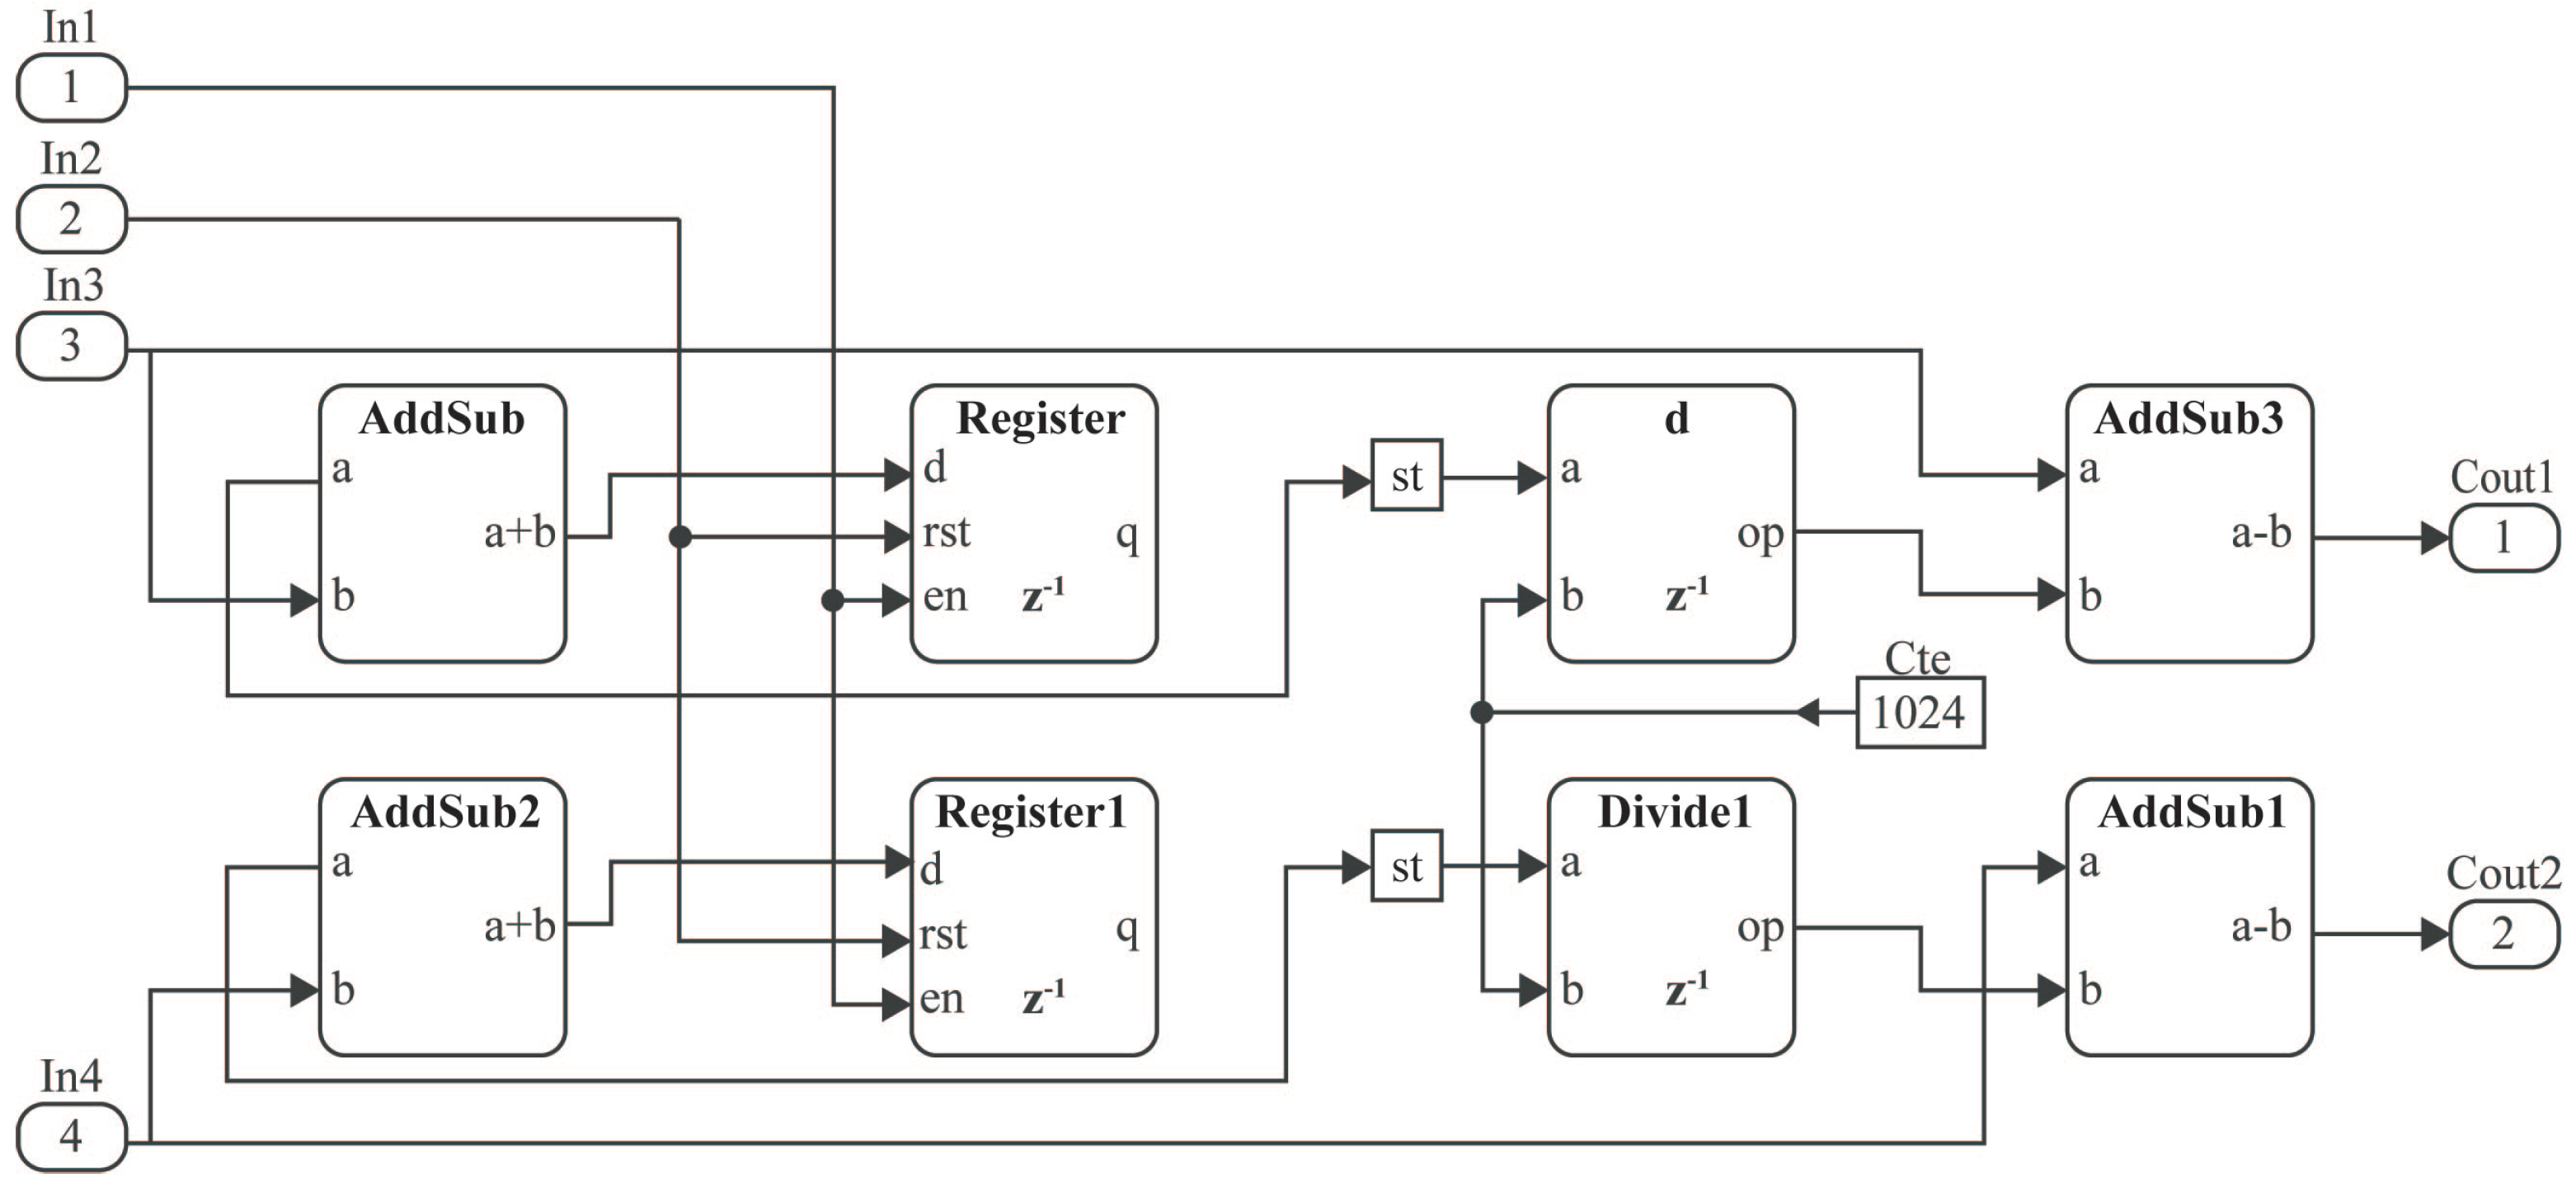
DataInput is a data buffer, which stores data inputs according to the counter controlled by the Finite State Machine (FSM) and outputs the saliency maps. Then, in the
Mean module, saliency maps are added and divided by their number of elements, obtaining the mean, subtracting them from each of the saliency map data (see
Figure 12). This result will be the subsystem output and the entrance to the
Multiplication subsystem, which performs the multiplication of the maps among themselves and with each other, having three outputs, that the
Accumulator subsystem will return. Finally, the
Correlation Function delivers one output datum that corresponds to the correlation value.
4.1.2. Comparison Module
The second important module in the
Search System is called
Comparison (see
Figure 11), which records the highest value that determines the corresponding audio on the database. The
Comparison module comprises a relational block that decides whether the input datum is higher than the one stored in the record. If that is the case, it sends a signal indicating in which register the new datum should be saved.
To obtain the correlation value requires comparing two saliency maps according to (a) the audio that we are trying to determine if we have it stored and (b) each audio of the data set so that only a correlation value is generated in a given time. In this way, it is only necessary to store the audio data where the correlation is the highest. There are two possibilities in the Comparison module while comparing the new correlation value with the stored one. First, if the new value is higher than the stored one, the index is updated with the latter. Second, if the new correlation value is smaller or equal to the stored one, then it is unnecessary to update the data, and the previous index is maintained.
Both proposed architectures are constructed from the modules previously described, where the analysis of the saliency map size demonstrates that there are improvements in the optimized hardware architecture while maintaining the accuracy, which will be explained in the next section.
4.2. Optimized Brute-Force Search
It is important to highlight that both proposed architectures use brute-force search, and the analysis enables reducing computational complexity through modifying the map size. In this way, the optimized brute-force search uses the same design as the brute-force search previously described. The variant occurs when processing the saliency maps of size 27 × 25, i.e., processing 675 elements, only 65% of the original map. For example,
Figure 9 shows two bars: the left one exemplifies the 1024 data contained in the 32 × 32 saliency map, representing 100% of the map, while the bar on the right represents only 65% of the data, delimited by the yellow box in the saliency map on the right.
The architecture is optimized in computational complexity since the analysis shows a similar performance when working with 27 × 25 maps than with 32 × 32 maps. Furthermore, this reduction in the map size decreases the number of floating-point operations, where 675 elements are now evaluated instead of 1024 elements. This improves the whole process because the algorithm must evaluate and analyze each fingerprint track within the database to find if it is registered. There is also an improvement concerning track storage, which is reflected when processing the entire set of tracks. More details of the advantages are found in the next section about the area, efficiency, and throughput.
5. Analysis and Results
In this section, the obtained results are presented, with a comparison between the brute-force and the optimized methods. The data obtained by each implemented module are reported separately, describing the number of required LUTs, FFs, and BRAMs, among other blocks. The designs are implemented using the Xilinx Vivado v2015.2 software in a xc7v2000tflg1925-1 FPGA. The operation of each design is observed, including the state of the state-machines, the percentage of correlation that exists between two maps, and which track has a higher correlation compared to the other tracks.
Table 2 shows the results of the hardware implementation for individual modules. It is observed that the
ROM module uses approximately 77% of the total LUTs in the entire system because it is the input of all data used by the system. On the other hand, the block that uses most of the FFs is the Accumulator, a sub-block of the
Correlation module, with 40% of the total FFs. In addition, the only segments that use RAM blocks are
Correlation_DataEntry and
Correlation_Multiplication, where all processed information is stored. Finally, the segment that consumes the most power is the
Correlation_DataInput, followed by the
Counters.
These results show that most of the resources are used for the storage of the track samples used to evaluate the system, see
Table 2. In the future, it is necessary to examine RAM memories or external memories, where the first ones occupied specialized resources and the second ones increased the critical path. In the reported case, excluding the use of the ROMs allows for evaluating the hardware resource requirements of the other modules.
Table 2 shows results of the implementation provided by the Vivado tool, but it is important to have metrics of the behavior of the complete architecture, which are described next. In order to compare the obtained results some equations are applied:
Table 3 shows a 4
x difference in terms of LUTs between the search by brute force and the optimized search. Furthermore, the BRAMs are reduced by 50% in the optimized search; the number DSP and FFs are maintained, the period increases by 48%, and the power decreases by 65%. New architectures for the optimized search must be designed, which could increase the performance of this compact architecture.
Additionally, a software implementation was carried out in Matlab (running on Intel Core i7-7500U at 2.7 GHz, two cores, 16 GB SDRAM, and Windows 10) using the same algorithm used in the hardware implementations of the brute-force and the optimized searches, using saliency maps of 32 × 32 and 25 × 27, respectively, and a database with 33 tracks. As a result, the brute-force search took approximately 11.53 ms, while the optimized search was 9 ms, as shown in
Table 4.
It can be observed that the hardware implementation is 3.85 times and 3.54 times faster than the software implementation for the brute-force and optimized search algorithms, respectively. This will change, however, when evaluating with hardware platforms of different specifications. Nevertheless, these results still represent valid reference values.
Until now, the designs, an optimization analysis, the implementations, and a comparison between the proposed architectures have been reviewed. Comparisons with related work are presented below.
6. Comparisons
In this section, a comparison with related works is presented in
Table 5. The comparison is not equivalent, because different algorithms, models, processes, and FPGA technologies were used, but it still provides essential elements of evaluation about hardware architectures. Due to the diversity of the used platforms, the analysis is based on the works implemented in FPGAs.
Table 5 shows that some hardware implementations for audio fingerprinting have been proposed already. For example, Ref. [
7] presents a fingerprinting system resistant to collision, based on a spread spectrum algorithm in the modulated complex lapped transform domain. In addition, authors in [
28] present the implementation of the windowing, FFT, filter banks, and square root functions as parts of the feature extraction. Next, three points are described for comparison.
First, in the included works, three iterative architectures and one pipeline architecture are presented. In general, a pipeline architecture allows multiple blocks to be processed simultaneously, which should increase performance while at the same time increasing power consumption and operating frequency. On the other hand, non-pipelined architecture work iteratively across tracks, using fewer hardware resources, but reducing the throughput.
Second, considering the brute force search, the architecture proposed in this work requires considerable hardware resources. The proposed architecture stores different fingerprints (it stores the database of the fingerprints). The proposed optimized brute force search reduces the required amount of hardware resources because fewer blocks are required for storage and processing. The resource reduction is approximately 75.66%, an additional advantage to that mentioned in
Section 4.2. According to
Table 2, the database requires 17,059 LUTs, and the rest of the hardware architecture requires 22,282 − 17,059 = 5223 LUTs, which is similar to the related works. Related works [
7,
28] report that they had to create specialized modules for their architectures and operations, which is the same situation in our case: several different specialized modules were designed for the architecture proposed in this article. Additionally, the DSP and FF amounts are similar but show the consumption of state-of-the-art hardware resources.
Third, the throughput seems to affect the proposed optimized search technique. However, in the optimized case, the data amount of the map has to be 25 × 27 32-bit, single-precision floating-point numbers, that is, 25 × 27 × 32 = 21,600 bits, while the brute force implementation requires 32 × 32 × 32 bits = 32,768 bits. Additionally, if the difference of 2.54 ms (optimized search) versus 2.99 ms (brute-force search) is considered, then the amount of bits processed per unit of time is reflected in a lower throughput in the optimized search. It is important to highlight that the optimized search processes a small amount of data and requires a short processing time, reducing it from 2.99 ms to 2.54 ms and reporting an improvement in the processing time of 15.05%, which is reflected in the output for the user. Then, the optimized architecture is faster than the brute-force search architecture. However, it processes less data (the key point of the proposal), leading to faster processing of large sets of tracks to determine if the track in evaluation has been found.
7. Discussion
The analysis, design, and implementation of the hardware architectures gave a set of results and discussion elements, which will be described below. Three types of results and contributions can be highlighted:
Proposals for both the non-optimized and optimized hardware architectures, in which specialized modules are designed to carry out the brute-force search and to correlate the saliency maps of the track sample with each saliency map of the stored map set. The correlation factor allows identifying, locating, and pointing to the index (address) with the highest correlation value (pointing to the ROM address) between the saliency maps of the query input with some saliency map in the set of maps in the ROMs.
An analysis focused on the sample size, where the saliency maps are reduced, requiring fewer pixels and decreasing the computational complexity. That is, fewer operations are performed in the correlation, only 65% of the pixels are stored, and fewer hardware resources are required. This was achieved without affecting the average accuracy of 95.27%. Therefore, the analysis leads to the design and implementation of an optimized hardware architecture that improves various parameters. However, future research is still necessary to reduce the critical path and, consequently, to improve performance and efficiency.
Finally, two comparative analyses were conducted. The first one focused on the optimized and non-optimized architectures, whose results are adequate according to their design, platform, and architecture. The second comparative analysis focused on examining architectures proposed in related works. Although different platforms, devices, and architectures were used in previous works, this comparison still enables reporting reference values. On the one hand, the first comparative analysis shows a reduction in hardware resources, such as LUTs, FFs, and RAMs. This is because fewer data in the database or set of saliency maps must be stored, requiring only 76.55% of the LUTs. On the other hand, the second analysis shows that there are various algorithms that can be implemented for audio fingerprinting, and that our proposed architecture has a competitive consumption of hardware resources according to the optimized version.
Two limitations of the proposed architectures are described next. The first limitation focuses on the critical path time, where the throughput and efficiency of the optimized hardware architecture are affected because they depend on the minimum period or critical path time (this determines maximum frequency). Related works show that it is necessary to explore other design techniques such as pipelining for improving throughput (efficiency will be consequently improved because it is related to the throughput). This technique generally reduces the critical path and increases the processing capacity, thus improving the throughput which is one of the metrics that must be increased in our optimized architecture. The second limitation is found in the growth of the dataset. Since the resources of the FPGA are limited, large size tracks cannot be stored in this device, so other alternatives such as embedded RAM memory and external RAM memories must be explored.
8. Conclusions
Three main contributions are presented in this paper. The first one is the hardware implementation of a fingerprint extraction algorithm, which has two searching versions depending on their storage: (1) the brute-force search and (2) the optimized brute-force search. This means that the searching module (generation and storing of the fingerprinting) is different for both versions. Second, this paper presents the analysis that allows reducing the window size and optimizing the storage and, consequently, the search module. Third, two comparative analyses for reference are described, using our hardware architectures and related works for evaluating different metrics and showing advantages (fewer hardware resources and operations to execute) and disadvantages (larger critical path and fewer throughput).
It is demonstrated that the results of a 32 ×32 map and a reduced map of 27 × 25 have similar accuracy, errors, and success rates. Furthermore, with the reduction in the saliency map, both the number of operations and the storage space are decreased. In the hardware implementation, ROM blocks are reduced to 50%, and the number of clock cycles decreases. In general, fewer resources are used, less power is consumed, and there is a decrease in processing times. Furthermore, the hardware implementation is approximately 3.85 times faster than the software implementation, where the software can hardly be improved. In contrast, there are still several techniques that can be used to improve the hardware implementation, such as increasing parallelization and improving the individual modules’ design, among others.
Future work will focus on using other hardware design techniques such as pipelining, which it is expected to improve the throughput, by reducing the critical path time. Pipelining accomplishes this time requirement, in addition to increasing the processing capacity.


 ,
, 


