How Does Artificial Intelligence Reshape Bank Profitability in China?—Evidence from a Multi-Period Difference-in-Differences Model


Abstract
1. Introduction
2. Theoretical Framework and Research Hypotheses
2.1. Effects of Artificial Intelligence on Bank Profitability
2.2. Mechanism Pathways
2.2.1. Cost Elasticity of Income
2.2.2. Deposit–Loan Turnover Adaptability
2.2.3. Multi-Business Capital Allocation Efficiency
2.2.4. Digital Investment Intensity
2.2.5. Customer Stickiness–Liability Cost Coupling
3. Research Design
3.1. Sample Selection and Data Sources
3.2. Variable Definitions
3.2.1. Dependent Variable
3.2.2. Core Explanatory Variable
3.2.3. Control Variables
3.2.4. Mechanism Variable
Cost Elasticity of Income
Deposit–Loan Turnover Adaptability
Multi-Business Capital Allocation Efficiency
3.2.5. Moderating Variables
Digital Investment Intensity
Customer Stickiness–Liability Cost Coupling
3.3. Model Specifications
3.3.1. Multi-Period Difference-in-Differences (DID) Model
3.3.2. Mediation Effect Models
3.3.3. Moderation Effect Models
4. Empirical Analysis
4.1. Descriptive Statistics
4.2. Baseline Regression Results
4.3. Mediation Effect Analysis
4.4. Moderation Effect Analysis
4.5. Robustness Tests
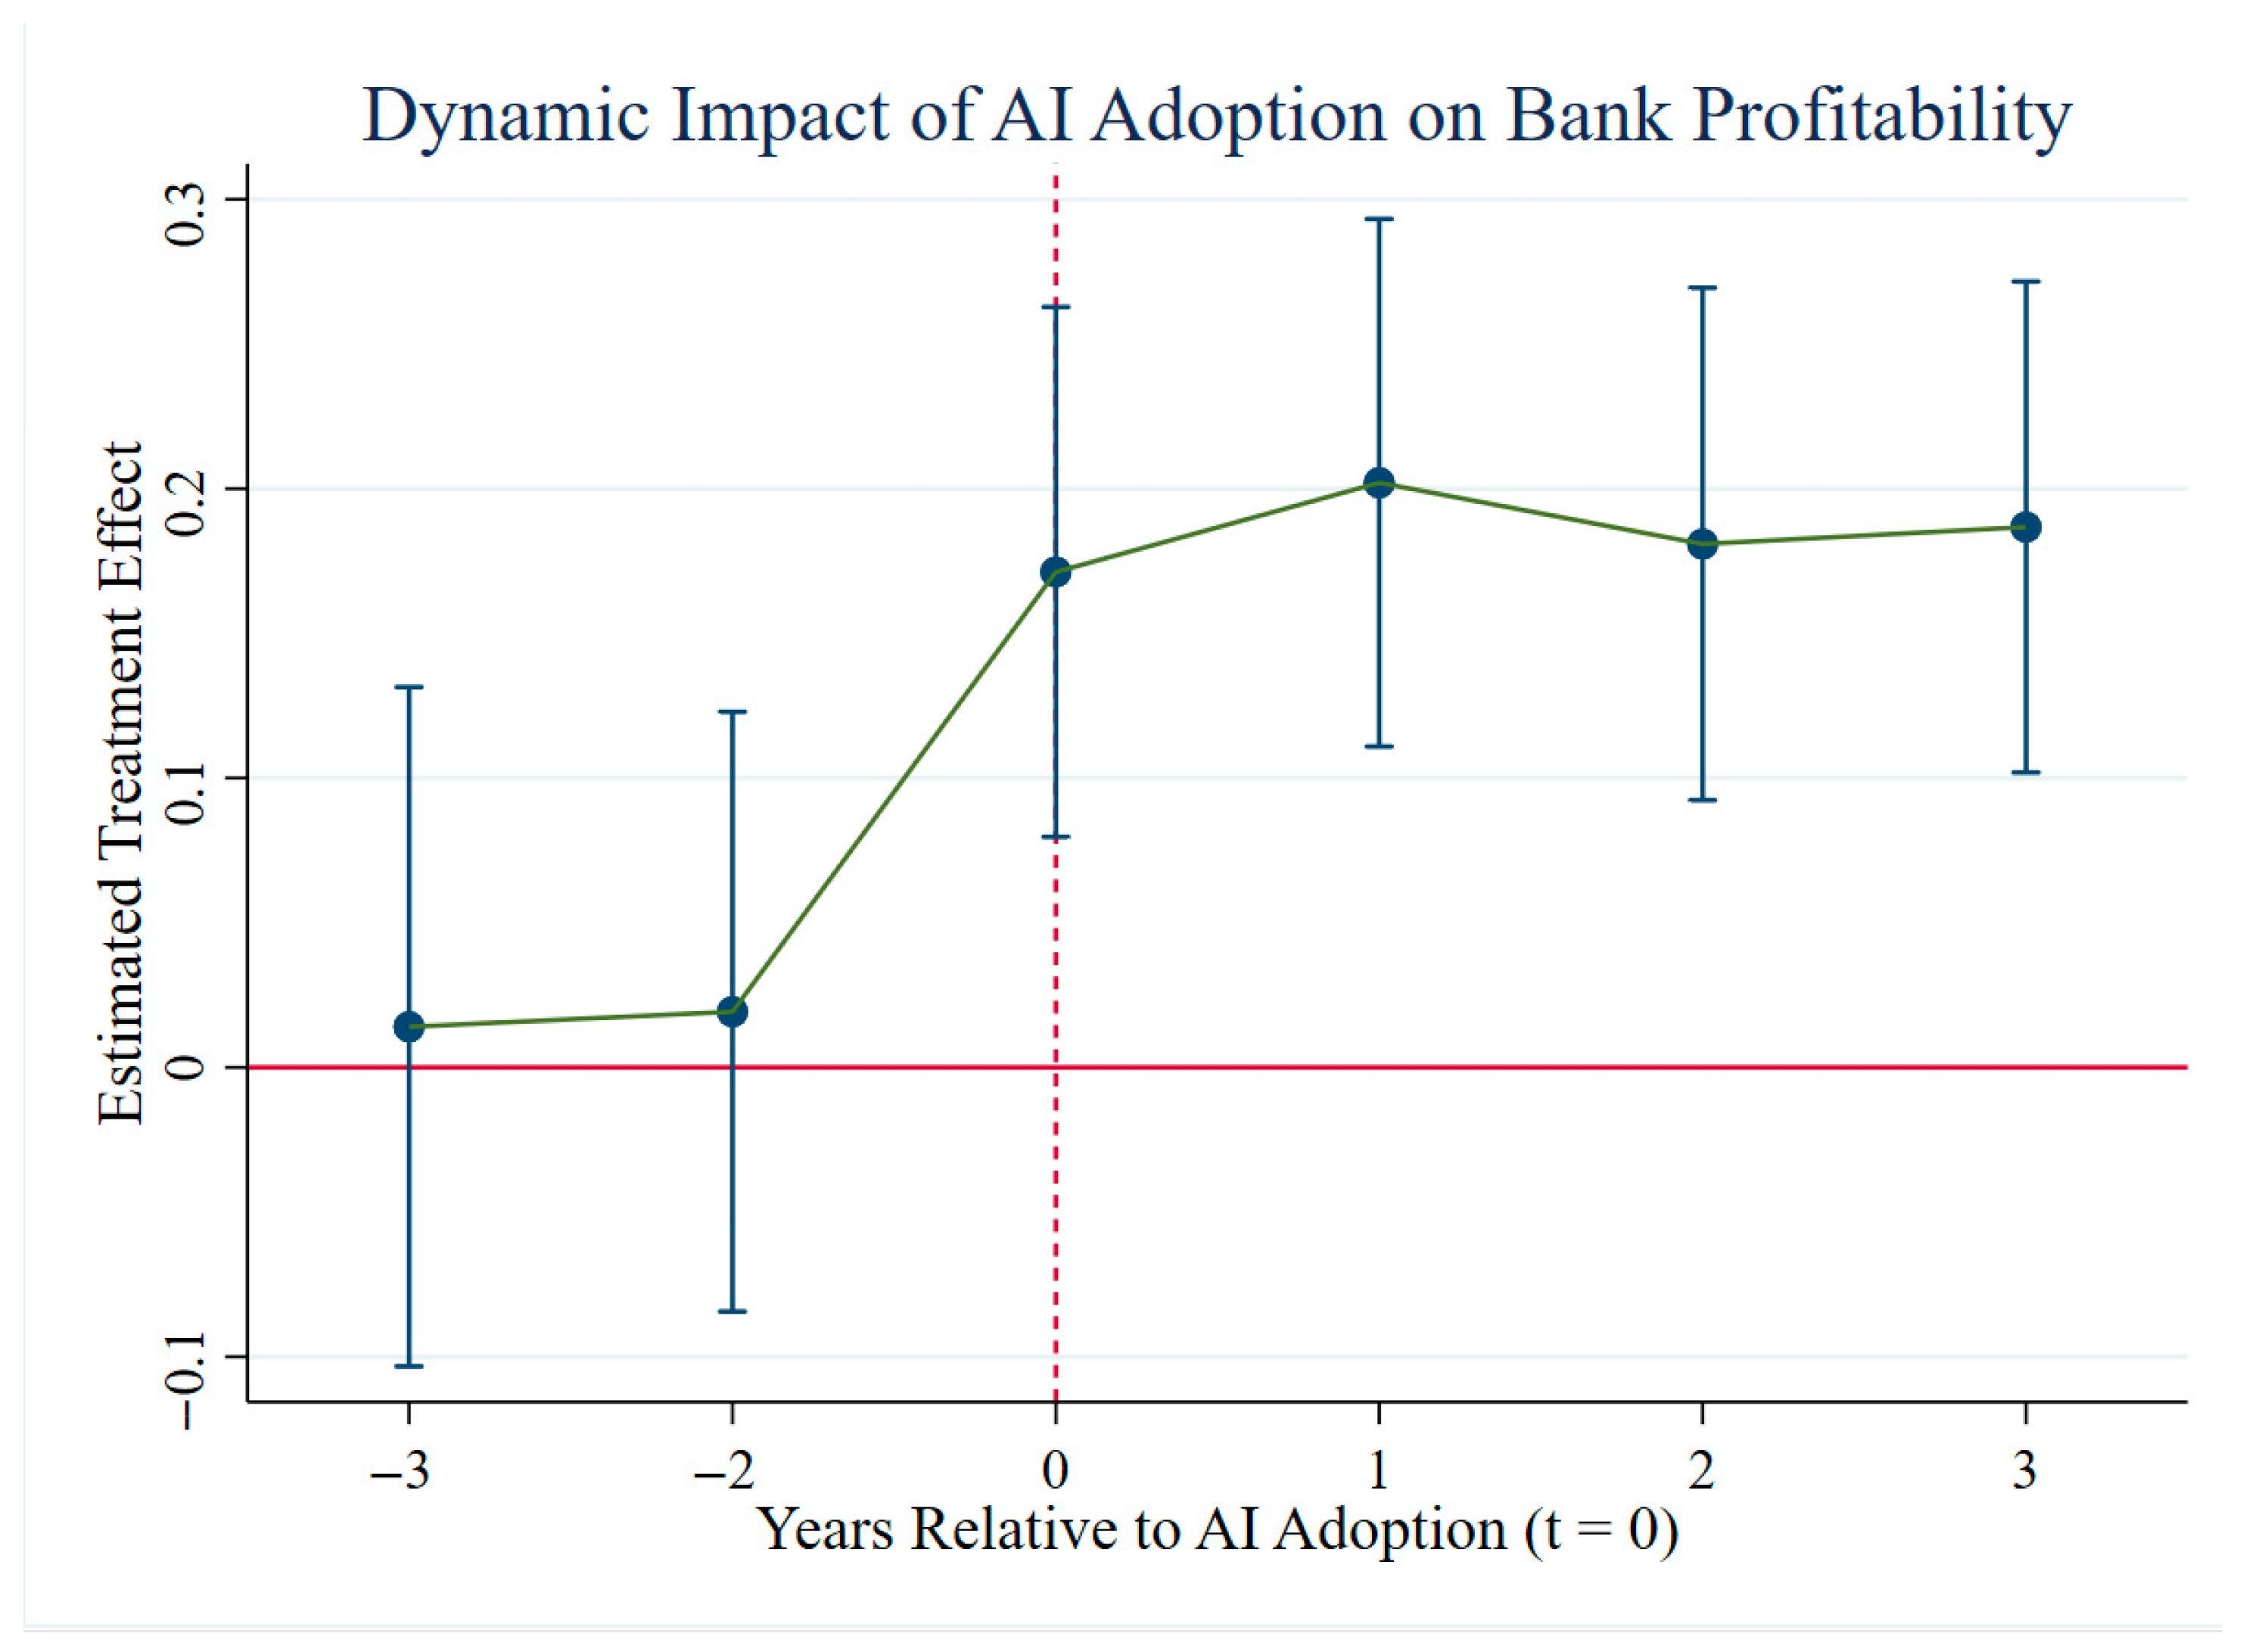
4.5.1. Parallel Trend Test
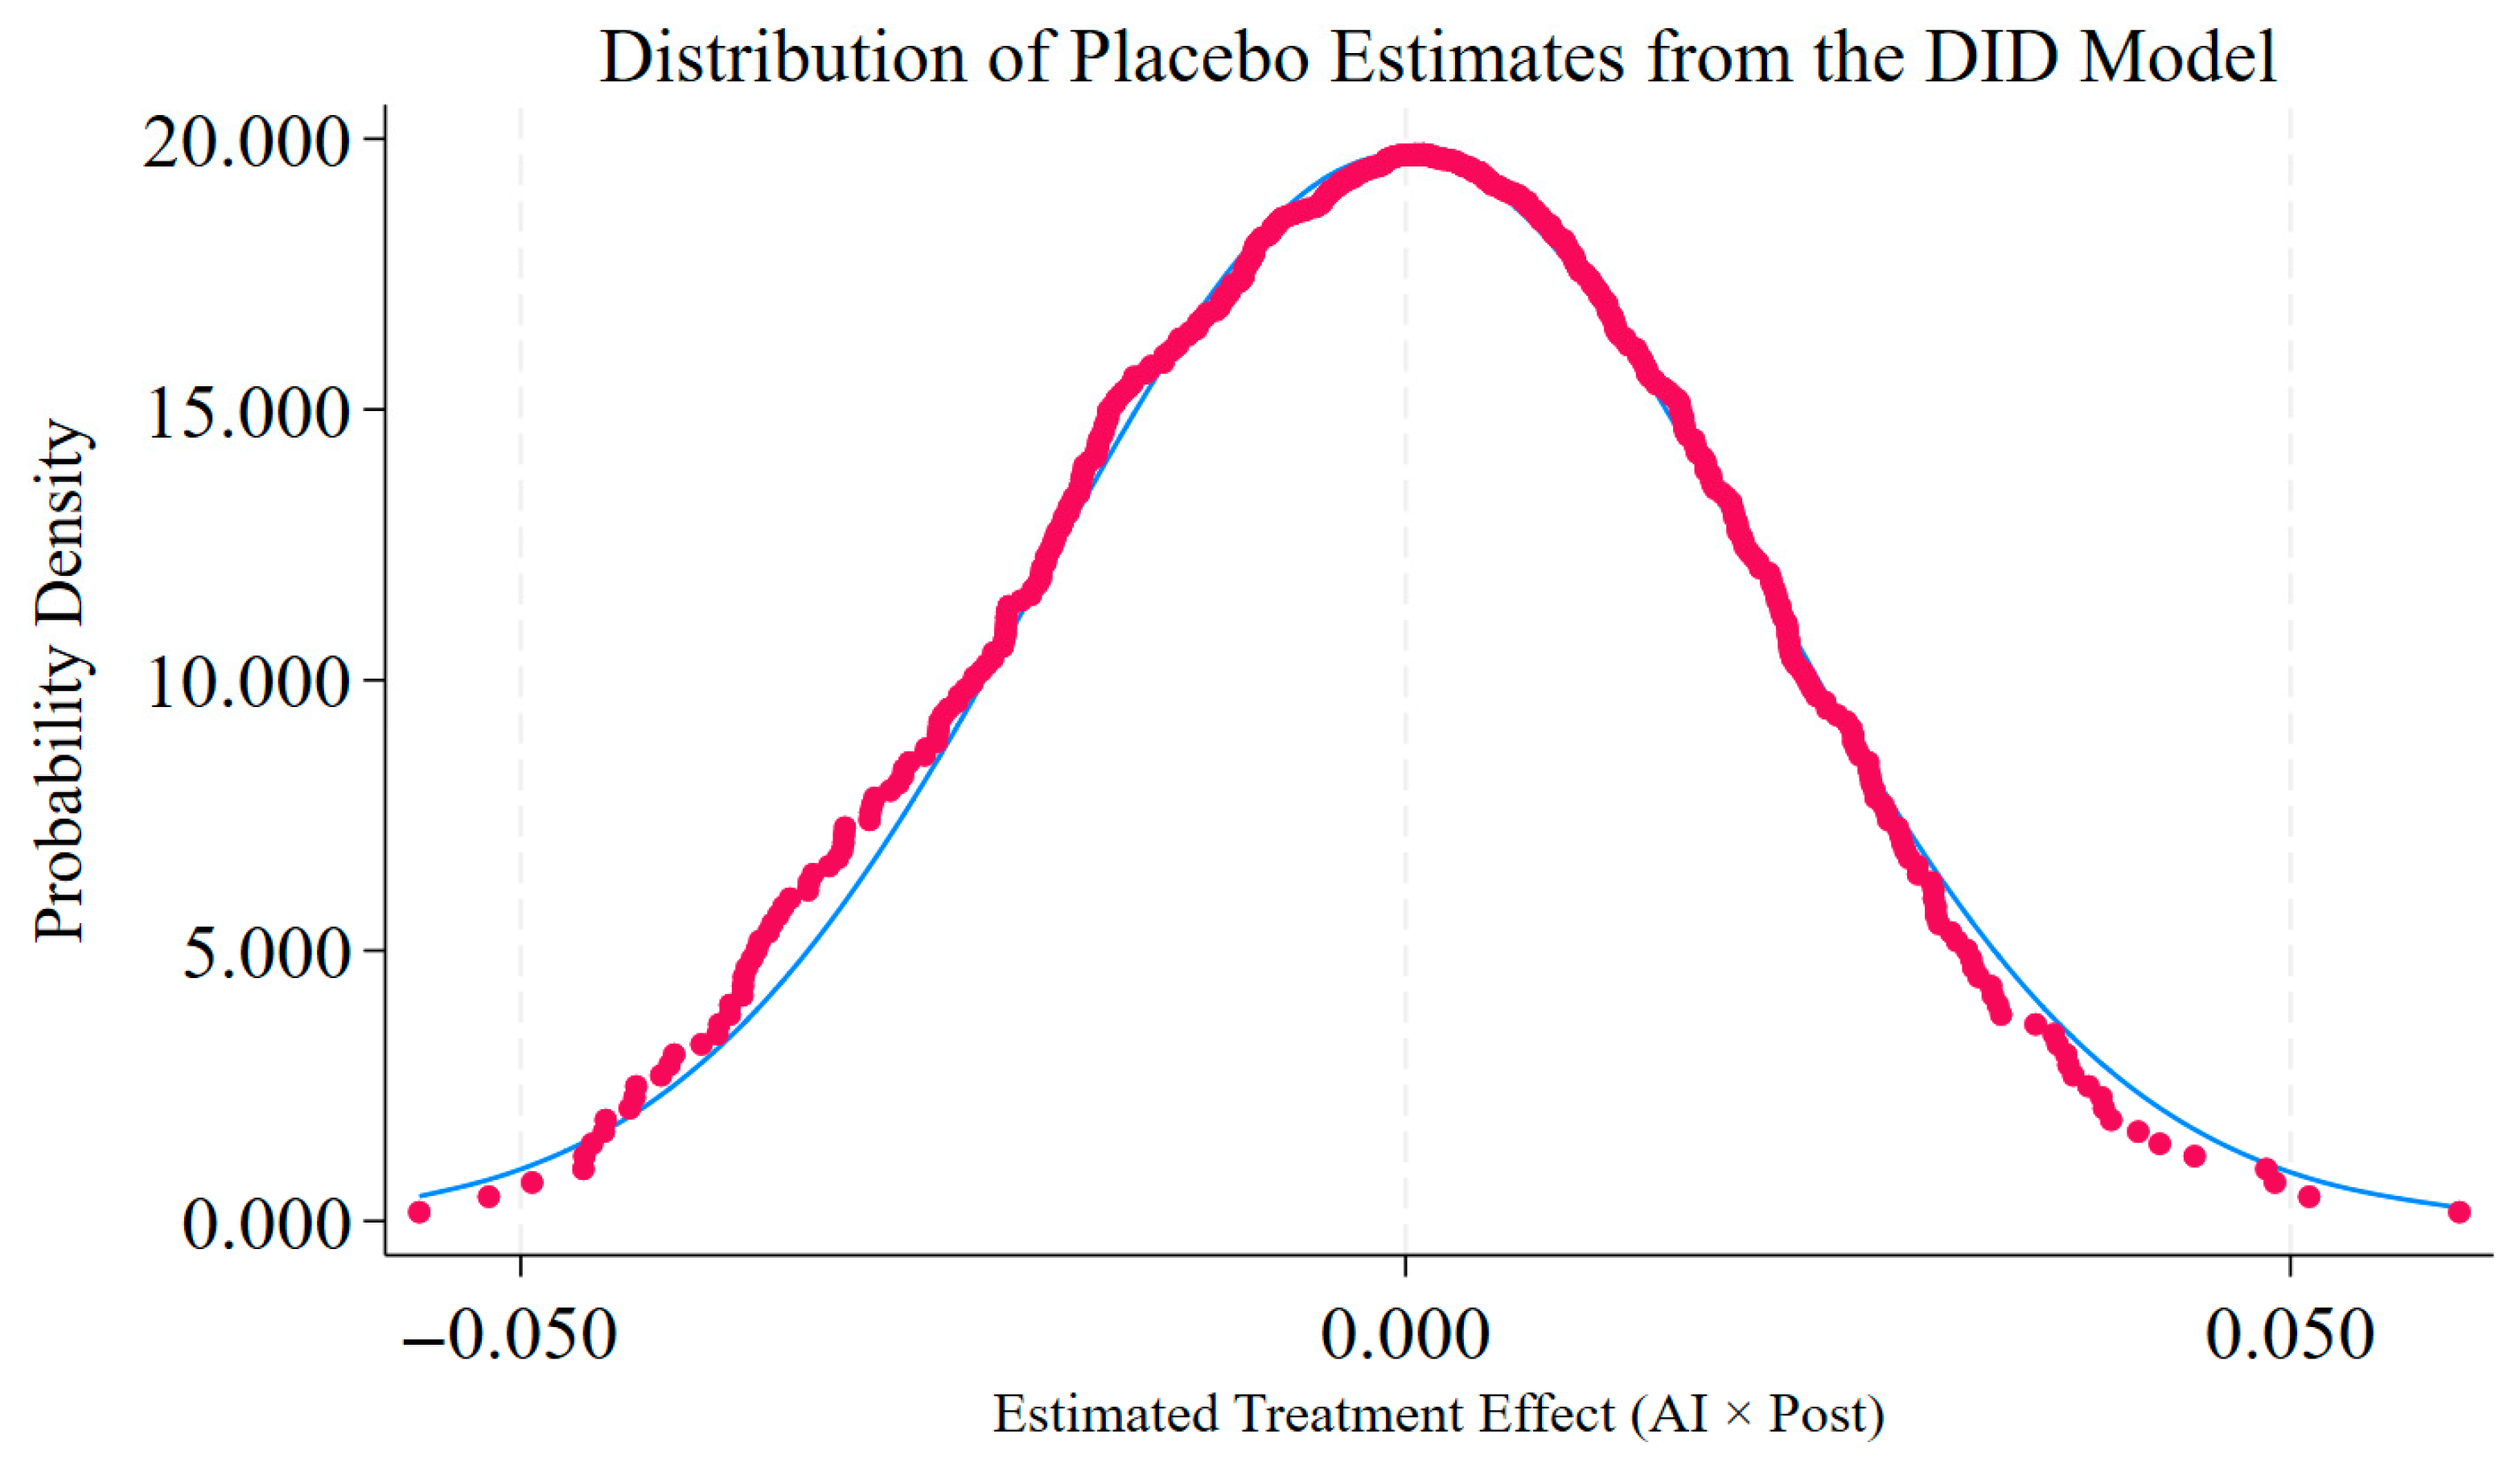
4.5.2. Placebo Test
4.5.3. Substitution of the Dependent Variable
4.5.4. Excluding Special Samples
4.5.5. Policy Lag Effect
4.6. Endogeneity Test
Propensity Score Matching—AI × Post (PSM–DID)
5. Further Discussion
5.1. Bank Ownership Structure
5.2. Bank Size
5.3. Policy Timing
6. Conclusions and Policy Implications
6.1. Research Conclusions and Comparative Discussion
6.2. Policy Implications
6.2.1. Implications for Financial Regulators—Governance Alignment and Risk Calibration
6.2.2. Implications for Bank Management—Strategic Integration and Capability Building
6.2.3. Implications for Technology Policymakers—Infrastructure and Innovation Ecosystems
6.3. Limitations and Future Research Directions
Author Contributions
Funding
Institutional Review Board Statement
Informed Consent Statement
Data Availability Statement
Conflicts of Interest
Abbreviations
| AI | Artificial Intelligence |
| DID | Difference-in-Differences |
| PSM | Propensity Score Matching |
| ROA | Return on Assets |
| ROE | Return on Equity |
| NIM | Net Interest Margin |
| GDP | Gross Domestic Product |
| M2 | Broad Money Supply (M2) |
| RPA | Robotic Process Automation |
| NLP | Natural Language Processing |
| LSTM | Long Short-Term Memory |
| ROI | Return on Investment |
| NPL | Non-Performing Loan |
| NAV | Net Asset Value |
| AI × Post | Interaction Term (AI adoption × Post-adoption period) |
Appendix A

| Artificial Intelligence | Computer Vision | Image Recognition |
| Knowledge Graph | Intelligent Education | Augmented Reality (AR) |
| Smart Governance | Feature Extraction | Business Intelligence |
| Intelligent Elderly Care | Support Vector Machine (SVM) | Knowledge Representation |
| Pattern Recognition | Internet of Things (IoT) | Human–Machine Dialogue |
| AI Product | Human–Computer Interaction | Data Mining |
| Smart Banking | Intelligent Customer Service | Virtual Reality (VR) |
| Autonomous Driving | Unmanned Driving | Smart Finance |
| Big Data Marketing | Long Short-Term Memory (LSTM) | AI Chip |
| Edge Computing | Cloud Computing | Deep Neural Network (DNN) |
| AI Processor | Deep Learning | Feature Recognition |
| Intelligent Insurance | Intelligent Retail | Intelligent Healthcare |
| Intelligent Transportation | Smart Home | Recurrent Neural Network (RNN) |
| Big Data Risk Control | Robotic Process Automation (RPA) | Wearable Products |
| Big Data Platform | Augmented Intelligence | Big Data Operation |
| Machine Translation | Neural Network | Speech Synthesis |
| Human–Machine Collaboration | Smart Agriculture | Smart Speaker |
| Convolutional Neural Network (CNN) | Question–Answering System | Reinforcement Learning |
| Big Data Analytics | Natural Language Processing (NLP) | Big Data Management |
| Intelligent Computing | Voice Interaction | Machine Learning |
| Biometric Identification | Speech Recognition | Intelligent Regulation |
| Intelligent Investment Advisory (Robo-Advisory) | Intelligent Voice | Voiceprint Recognition |
| Facial Recognition | Intelligent Agent | Big Data Processing |
| Distributed Computing | Intelligent Sensor | Intelligent Search |
References
- Abbas, F., Rubbaniy, G., Ali, S., & Khan, W. A. (2024). Income and balance sheet diversification effects on banks’ cost and profit efficiency: Evidence from the United States. Journal of Financial Research, 48(1), 267–293. [Google Scholar] [CrossRef] [Scilit]
- Acharya, V. V., & Mora, N. (2015). A crisis of banks as liquidity providers. Journal of Finance, 70, 1–43. [Google Scholar] [CrossRef] [Scilit]
- Agarwal, I., & Baron, M. (2024). Inflation and disintermediation. Journal of Financial Economics, 160, 103902. [Google Scholar] [CrossRef] [Scilit]
- Aghion, P., & Howitt, P. (1992). A model of growth through creative destruction. Econometrica, 60(2), 323–351. [Google Scholar] [CrossRef] [Scilit]
- Anginer, D., Demirgüç-Kunt, A., Huizinga, H., & Ma, K. (2018). Corporate governance of banks and financial stability. Journal of Financial Economics, 130(2), 327–346. [Google Scholar] [CrossRef] [Scilit]
- Ashrafzadeh, M., Sadrani, M., & Zolfani, S. H. (2025). Deep learning and machine learning models for portfolio optimization: Enhancing return prediction with stock clustering. Results in Engineering, 27, 106263. [Google Scholar] [CrossRef] [Scilit]
- Åstebro, T. (2004). Sunk costs and the depth and probability of technology adoption. Journal of Industrial Economics, 52, 381–399. [Google Scholar]
- Bai, J., Guo, J., Sun, B., Guo, Y., Chen, Y., & Xiao, X. (2023). Probability rough set and portfolio optimization integrated three-way prediction decisions approach to stock price. Applied Intelligence, 53(24), 29918–29942. [Google Scholar] [CrossRef] [Scilit]
- Ban, G. Y., & Keskin, N. B. (2021). Personalized dynamic pricing with machine learning: High-dimensional features and heterogeneous elasticity. Management Science, 67(9), 5549–5568. [Google Scholar] [CrossRef] [Scilit]
- DeAngelo, H., & Stulz, R. M. (2015). Liquid-claim production, risk management, and bank capital structure: Why high leverage is optimal for banks. Journal of Financial Economics, 116(2), 219–236. [Google Scholar] [CrossRef] [Scilit]
- Deng, Y., Liao, L., Yu, J., & Zhang, Y. (2022). Capital spillover, house prices, and consumer spending: Quasi-experimental evidence from house purchase restrictions. Review of Financial Studies, 35(6), 3060–3099. [Google Scholar] [CrossRef] [Scilit]
- Durongkadej, I., Hu, W., & Wang, H. E. (2024). How artificial intelligence incidents affect banks and financial services firms: A study of five firms. Finance Research Letters, 70, 106279. [Google Scholar] [CrossRef] [Scilit]
- Ekinci, Y., Uray, N., & Ülengin, F. (2014). A customer lifetime value model for the banking industry: A guide to marketing actions. European Journal of Marketing, 48(3–4), 761–784. [Google Scholar] [CrossRef] [Scilit]
- Fraisse, H., & Laporte, M. (2022). Return on investment on artificial intelligence: The case of bank capital requirement. Journal of Banking & Finance, 138, 106401. [Google Scholar] [CrossRef] [Scilit]
- Galan, M., Ottinger, G., & Karwat, D. M. A. (2025). Accelerating just energy transitions in practice: Policy implementation and innovation funding at the U.S. Department of Energy. Energy Research & Social Science, 127, 104319. [Google Scholar] [CrossRef] [Scilit]
- Gan, Z., Lei, C., & Lv, W. (2023). The impact of digital transformation on financial performance of retail enterprises: From the perspective of supply chain integration. Technology and Innovation Management, 44, 723–734. [Google Scholar] [CrossRef]
- Ghosh, P., Das, S., Roy, S., Bhattacharjee, A., Cortesi, A., & Sen, S. (2025). SentiTSMixer: A specific model for sales forecasting using sentiment analysis of customer data. IEEE Access, 13, 85882–85897. [Google Scholar] [CrossRef] [Scilit]
- Griliches, Z. (1957). Hybrid corn: An exploration in the economics of technological change. Econometrica, 25(4), 501–522. [Google Scholar] [CrossRef] [Scilit]
- Guo, P., & Zhang, C. (2023). The impact of bank FinTech on liquidity creation: Evidence from China. Research in International Business and Finance, 64, 101858. [Google Scholar] [CrossRef] [Scilit]
- Gyau, E. B., Appiah, M., Gyamfi, B. A., Achie, T., & Naeem, M. A. (2024). Transforming banking: Examining the role of AI technology innovation in boosting banks’ financial performance. International Review of Financial Analysis, 96(B), 103700. [Google Scholar] [CrossRef] [Scilit]
- Huang, R., Quan, L., Luo, H., Gao, Z., Lai, X., & Tang, S. (2024). Can FinTech promote enterprise cross-region investment? Evidence from China. International Review of Economics & Finance, 96(A), 103524. [Google Scholar] [CrossRef] [Scilit]
- Hughes, J. P., Iqtiani, J., & Moon, C.-G. (2022). Consumer lending efficiency: Commercial banks versus a FinTech lender. Financial Innovation, 8, 38. [Google Scholar] [CrossRef] [Scilit]
- Jiang, H., Zhang, X. L., Tang, S. F., Chen, C. L., & Frontiers of Economics in China. (2021). Monetary policy, liquidity, and bank risk-taking. Economic Research Journal (Jingji Yanjiu), 56(8), 56–73. [Google Scholar]
- Jiang, T. (2022). Mediation and moderation effects in causal inference empirical research. China Industrial Economics, (5), 100–120. [Google Scholar] [CrossRef]
- Kang, K., Mohd Ashhari, Z., Dato Hj Yahya, M. H., Soh, W. N., & Li, Y. (2024). Interest rate liberalization and the stability of the Chinese banking system. Finance Research Letters, 62, 105222. [Google Scholar] [CrossRef] [Scilit]
- Kokina, J., & Blanchette, S. (2019). Early evidence of digital labor in accounting: Innovation with robotic process automation. International Journal of Accounting Information Systems, 35, 100431. [Google Scholar] [CrossRef] [Scilit]
- Koroma, S., & Bein, M. (2024). The moderating effect of economic policy uncertainty on the relationship between working capital management and profitability. SAGE Open, 14(2), 21582440241242552. [Google Scholar] [CrossRef] [Scilit]
- Lepetit, L., Nys, E., Rous, P., & Tarazi, A. (2008). Bank income structure and risk: An empirical analysis of European banks. Journal of Banking & Finance, 32(8), 1452–1467. [Google Scholar] [CrossRef] [Scilit]
- Liu, H., Jafri, M. A. H., Xu, S., & Shahzad, M. F. (2025). The impact of artificial intelligence on consumers’ willingness to use CBDCs: Evidence from the Chinese banking sector. Humanities and Social Sciences Communications, 12, 834. [Google Scholar] [CrossRef] [Scilit]
- Loukil, S., & Jarboui, A. (2015). Lines of credit and relationship lending in small firm finance. International Journal of Behavioural Accounting and Finance, 5(3–4), 314–333. [Google Scholar] [CrossRef] [Scilit]
- Nyqvist, R., Peltokorpi, A., & Seppänen, O. (2024). Can ChatGPT exceed humans in construction project risk management? Engineering, Construction and Architectural Management, 31(13), 223–243. [Google Scholar] [CrossRef] [Scilit]
- Onana, S. P. (2024). Do programme budget mechanisms improve the efficiency of public spending? International Review of Administrative Sciences, 90(1), 185–202. [Google Scholar] [CrossRef] [Scilit]
- Pan, W. F., & Zhang, X. F. (2023). Corporate digitalization, management expense ratio, and investment efficiency. Technology Economics (Jishu Jingji), 42(9), 121–132. [Google Scholar]
- Roy, S. K., Dey, B. L., Brown, D. M., Abid, A., Apostolidis, C., Christofi, M., & Tarba, S. (2025). Business model innovation through AI adaptation: The role of strategic human resources management. British Journal of Management, 36(2), 546–559. [Google Scholar] [CrossRef] [Scilit]
- Sachan, S., Almaghrabi, F., Yang, J. B., & Xu, D. L. (2024). Human–AI collaboration to mitigate decision noise in financial underwriting. International Review of Financial Analysis, 93, 103149. [Google Scholar] [CrossRef] [Scilit]
- Santos, C. E. M., Correia Filho, P. T. d. J., Canciglieri Junior, O., & Schaefer, J. L. (2025). The role of integrated information management systems in the relationship between product lifecycle management and Industry 4.0 technologies and market performance. Sustainability, 17(12), 5260. [Google Scholar] [CrossRef] [Scilit]
- Sheth, J. N., Jain, V., Roy, G., & Chakraborty, A. (2022). AI-driven banking services: The next frontier for personalized experience in emerging markets. International Journal of Bank Marketing, 40(6), 1248–1271. [Google Scholar] [CrossRef] [Scilit]
- Shrestha, Y. R., Krishna, V., & von Krogh, G. (2021). Augmenting organizational decision-making with deep learning algorithms. Journal of Business Research, 123, 588–603. [Google Scholar] [CrossRef] [Scilit]
- Tang, S., Wu, X., & Zhu, J. (2020). Digital finance and enterprise technological innovation: Structural features, mechanism identification, and the effect of financial regulation. Management World (Guanli Shijie), 36(5), 52–66. [Google Scholar] [CrossRef]
- Tang, S. F., & Wu, W. Y. (2024). Digital transformation and commercial bank profitability: Empirical evidence from Chinese listed banks. Technology Economics (Jishu Jingji), 43(9), 72–84. [Google Scholar]
- Tian, X. J., & Ge, Y. H. (2023). FinTech and commercial bank performance. Technology Economics (Jishu Jingji), 42(6), 127–137. [Google Scholar]
- Wang, M., & Liu, X. (2013). The impact of income structure on bank profitability: Evidence from 14 listed banks in China. Nankai Business Review (Nankai Guanli Pinglun), 2, 143–149. [Google Scholar]
- Wen, W., & Liang, Y. (2025). Digital transformation and liquidity creation in commercial banks: Evidence from the Chinese banking industry. PLoS ONE, 20(2), e0318785. [Google Scholar] [CrossRef] [Scilit] [PubMed]
- Wu, F., Ding, Z. J., & Che, D. X. (2023). FinTech, marketization, and corporate digital transformation. Securities Market Herald (Zhengquan Shichang Daobao), 11, 15–31. [Google Scholar]
- Yao, J., Zhang, K., Guo, L., & Feng, X. (2024). How does artificial intelligence improve firm productivity? Evidence from labor skill structure adjustment. Management World, 40(2), 101–116. [Google Scholar] [CrossRef]
- Yu, R., Wu, L., Li, G., & Wang, Z. (2025). Can executives’ digital background develop the level of AI utilization in enterprises? PeerJ Computer Science, 11, e2848. [Google Scholar] [CrossRef] [Scilit]
- Zhang, J. (2022). An empirical study on the impact of FinTech on bank profitability. Statistical Decision (Tongji Yu Juece), 38(13), 179–183. [Google Scholar]


| Variable Type | Variable Name | Symbol | Definition |
|---|---|---|---|
| Dependent Variable | Bank Profitability | Profit | Measures a bank’s profitability, typically represented by ROA or ROE. |
| Independent Variable | Artificial Intelligence | AI × Post | An interaction term capturing the dynamic effect of AI technology adoption by banks. |
| Mediating Variables | Cost Elasticity of Income | CostElas | Calculated as (year-on-year growth rate of operating income/year-on-year change in cost-to-income ratio) × proportion of administrative expenses, reflecting the elasticity between costs and revenues. |
| Deposit–Loan Turnover Adaptability | LoanFit | Measured by (deposit–loan matching ratio × asset profitability efficiency)/year-on-year growth rate of M2, indicating the adaptability of deposit–loan fund flows. Asset Profitability efficiency, measured as net profit divided by total assets, indicates how efficiently a bank converts its assets into profits. | |
| Multi-Business Capital Allocation Efficiency | DivFit | Defined as (1 − total loans/total assets) × (total deposits/total liabilities), capturing cross-business capital allocation efficiency and funding stability. | |
| Moderating Variables | Digital Investment Intensity | DigInvInt | Represents the intensity of resource allocation in digital infrastructure, technology R&D, and platform development, measured by (administrative expenses/total assets). |
| Customer Stickiness–Liability Cost Coupling | StickCost | Reflects the interaction between customer loyalty and liability cost, measured as (fee and commission income/operating income) × (1 − cost-to-income ratio). | |
| Control Variables | Capital Adequacy Ratio | CapAdeqRatio | The ratio of bank capital to risk-weighted assets, indicating the bank’s ability to absorb risk. It includes Core Tier 1 capital—the highest-quality capital composed mainly of common equity and retained earnings—along with Tier 1 and total capital adequacy ratios. |
| Capital Strength | CapStr | Measured as (net assets/total assets), representing the bank’s capital structure strength. | |
| Asset Size | Size | Natural logarithm of total assets, used to indicate the overall scale of the bank. | |
| Net Interest Margin | NIM | The ratio of net interest income to average interest-earning assets, reflecting the profitability efficiency of interest-bearing assets. | |
| GDP Growth Rate | GDPG | The year-on-year growth rate of gross domestic product, reflecting macroeconomic performance. | |
| M2 Growth Rate | M2G | The year-on-year growth rate of broad money supply (M2), reflecting overall monetary liquidity conditions. | |
| Banking Sentiment Index | BankingSentIndex | A composite index reflecting the overall business conditions and growth expectations of the banking sector, constructed through weighted evaluation of profitability, asset quality, and business expansion indicators. |
| Variable | N | Mean | Std. Dev. | Min | Max |
|---|---|---|---|---|---|
| ROA | 986 | 0.696 | 0.326 | 0.094 | 1.599 |
| AI × Post | 986 | 0.671 | 0.470 | 0.000 | 1.000 |
| Capital Adequacy Ratio | 986 | 0.128 | 0.020 | 0.081 | 0.249 |
| Capital Strength | 986 | 0.067 | 0.013 | 0.024 | 0.121 |
| Asset Size (ln) | 986 | 10.549 | 1.231 | 6.843 | 12.889 |
| Net Interest Margin | 986 | 2.330 | 0.416 | 1.200 | 3.655 |
| GDP Growth Rate (China) | 986 | 0.073 | 0.035 | −0.069 | 0.187 |
| M2 Growth Rate | 986 | 0.133 | 0.051 | 0.080 | 0.293 |
| Banking Sentiment Index | 986 | 0.729 | 0.079 | 0.583 | 0.872 |
| Ownership Type | Bank Name | Number of Banks | Percentage of Total (%) |
|---|---|---|---|
| Central State-Owned Banks | Agricultural Bank of China (ABC) Bank of Communications (BoCom) Industrial and Commercial Bank of China (ICBC) China Construction Bank (CCB) Bank of China (BOC) | 5 | 29.4 |
| Joint-Stock Commercial Banks | Ping An Bank China CITIC Bank China Minsheng Bank China Everbright Bank Industrial Bank China Merchants Bank Huaxia Bank Shanghai Pudong Development Bank (SPDB) | 8 | 47.1 |
| City Commercial Banks | Bank of Beijing Bank of Nanjing Bank of Ningbo | 3 | 17.6 |
| Other (Policy-Oriented or Mixed Ownership) | 1 | 5.9 | |
| Total | 17 | 100.0 |
| Variable | (1) ROA | (2) ROA |
|---|---|---|
| AI × Post | 0.201 *** (4.35) | 0.253 *** (5.61) |
| Capital Adequacy Ratio | 3.880 *** (3.70) | |
| Capital Strength | −6.853 *** (−3.82) | |
| Asset Size | −0.345 *** (−5.21) | |
| Net Interest Margin | 0.156 *** (3.99) | |
| GDP Growth Rate (China) | 0.112 (0.25) | |
| M2 Growth Rate | 1.168 ** (2.21) | |
| Banking Sentiment Index | 1.595 *** (3.26) | |
| Constant | 0.561 *** (17.24) | 2.436 *** (2.73) |
| Bank Fixed Effects | Yes | Yes |
| Year Fixed Effects | Yes | Yes |
| N | 986 | 986 |
| R2 | 0.161 | 0.238 |
| Adj. R2 | 0.134 | 0.207 |
| F-statistic | 18.937 | 14.484 |
| Variable | (1) ROA | (2) Cost–Income Elasticity | (3) Deposit–Loan Turnover Adaptability | (4) Multi-Business Capital Allocation Efficiency |
|---|---|---|---|---|
| AI × Post | 0.253 *** (5.61) | 36.584 *** (3.89) | 0.007 *** (2.61) | 0.012 * (1.83) |
| Capital Adequacy Ratio | 3.880 *** (3.70) | −330.634 (−1.51) | 0.114 * (1.71) | −0.019 (−0.13) |
| Capital Strength | −6.853 *** (−3.82) | 390.945 (1.04) | −0.047 (−0.41) | −0.604 ** (−2.35) |
| Asset Size | −0.345 *** (−5.21) | 0.755 (0.05) | −0.018 *** (−4.30) | 0.039 *** (4.11) |
| Net Interest Margin | 0.156 *** (3.99) | 5.336 (0.66) | 0.005 ** (2.18) | 0.006 (0.99) |
| GDP Growth Rate (China) | 0.112 (0.25) | −52.734 (−0.56) | 0.099 *** (3.48) | −0.105 (−1.63) |
| M2 Growth Rate | 1.168 ** (2.21) | 54.215 (0.49) | −0.073 ** (−2.18) | −0.134 * (−1.77) |
| Banking Sentiment Index | 1.595 *** (3.26) | 128.113 (1.25) | 0.033 (1.07) | 0.079 (1.12) |
| Constant | 2.436 *** (2.73) | −130.872 (−0.70) | 0.181 *** (3.20) | −0.080 (−0.62) |
| Bank Fixed Effects | Yes | Yes | Yes | Yes |
| Year Fixed Effects | Yes | Yes | Yes | Yes |
| N | 986 | 986 | 986 | 986 |
| R2 | 0.238 | 0.078 | 0.411 | 0.564 |
| Adj. R2 | 0.207 | 0.041 | 0.387 | 0.546 |
| F-statistic | 14.484 | 2.663 | 13.917 | 7.083 |
| Variable | (1) ROA | (2) ROA | (3) ROA |
|---|---|---|---|
| AI × Post | 0.253 *** (5.61) | −0.019 (−0.55) | 0.143 (1.32) |
| Capital Adequacy Ratio | 3.880 *** (3.70) | 2.601 *** (4.19) | 3.627 *** (3.28) |
| Capital Strength | −6.853 *** (−3.82) | −3.206 *** (−3.00) | −4.778 ** (−2.40) |
| Asset Size | −0.345 *** (−5.21) | −0.178 *** (−4.51) | −0.227 *** (−2.85) |
| Net Interest Margin | 0.156 *** (3.99) | 0.058 ** (2.48) | 0.139 *** (3.35) |
| GDP Growth Rate (China) | 0.112 (0.25) | 0.235 (0.88) | −0.785 * (−1.69) |
| M2 Growth Rate | 1.168 ** (2.21) | 0.487 (1.56) | 1.107 ** (2.10) |
| Banking Sentiment Index | 1.595 *** (3.26) | 0.124 (0.42) | 2.831 *** (5.47) |
| Digital Investment Intensity | 62.511 *** (17.96) | ||
| AI × Post × DigInvInt | 47.343 *** (11.07) | ||
| Customer Stickiness–Liability Cost Coupling | −0.525 (−0.82) | ||
| AI × Post × StickCost | 1.188 * (1.68) | ||
| Constant | 2.436 *** (2.73) | 1.693 *** (3.21) | 0.323 (0.33) |
| Bank Fixed Effects | Yes | Yes | Yes |
| Year Fixed Effects | Yes | Yes | Yes |
| N | 986 | 986 | 865 |
| R2 | 0.238 | 0.735 | 0.307 |
| Adj. R2 | 0.207 | 0.723 | 0.273 |
| F-statistic | 14.484 | 210.120 | 13.968 |
| Variable | (1) ROE | (2) ROA | (3) F.ROA |
|---|---|---|---|
| AI × Post | 2.715 *** (3.41) | 0.249 *** (5.51) | 0.217 *** (4.76) |
| Capital Adequacy Ratio | 62.803 *** (3.39) | 4.531 *** (3.84) | −0.006 (−0.01) |
| Capital Strength | −297.484 *** (−9.40) | −8.349 *** (−4.23) | −2.219 (−1.20) |
| Asset Size | −5.253 *** (−4.50) | −0.460 *** (−6.04) | −0.154 ** (−2.25) |
| Net Interest Margin | 4.337 *** (6.31) | 0.146 *** (3.38) | 0.071 * (1.78) |
| GDP Growth Rate (China) | −18.161 ** (−2.29) | 6.294 *** (7.41) | 2.489 *** (5.46) |
| M2 Growth Rate | 21.934 ** (2.36) | 2.532 *** (4.65) | 0.813 (1.52) |
| Banking Prosperity Index | 64.081 *** (7.41) | −0.351 (−0.62) | −4.284 *** (−8.64) |
| Constant | 18.310 (1.16) | 4.414 *** (4.38) | 5.004 *** (5.44) |
| Bank Fixed Effects | No | No | No |
| Year Fixed Effects | No | No | No |
| N | 986 | 816 | 952 |
| R2 | 0.380 | 0.299 | 0.226 |
| Adj. R2 | 0.355 | 0.267 | 0.193 |
| F-statistic | 23.366 | 25.489 | 13.171 |
| Variable | (1) Nearest Neighbor | (2) Caliper Matching | (3) Radius Matching | (4) Kernel Matching |
|---|---|---|---|---|
| AI × Post | 0.264 * (1.98) | 0.253 ** (2.51) | 0.242 *** (3.76) | 0.201 *** (2.65) |
| Capital Adequacy Ratio | 9.679 * (1.80) | 12.084 *** (2.80) | 5.870 ** (2.48) | 6.085 ** (2.30) |
| Capital Strength | −20.541 ** (−2.08) | −27.169 *** (−3.51) | −24.233 *** (−4.89) | −25.372 *** (−4.47) |
| Asset Size | −1.709 *** (−2.72) | −1.755 *** (−4.23) | −1.159 *** (−5.26) | −1.207 *** (−4.57) |
| Net Interest Margin | 0.147 (0.65) | 0.176 (1.14) | 0.090 (1.11) | 0.216 ** (2.21) |
| GDP Growth Rate (China) | −5.434 (−0.68) | −1.848 (−0.32) | 6.626 ** (1.99) | 2.693 (0.73) |
| M2 Growth Rate | −4.668 (−0.91) | −3.673 (−1.04) | −0.183 (−0.09) | −1.260 (−0.55) |
| Banking Prosperity Index | 0.076 (0.04) | −1.070 (−0.73) | 0.453 (0.50) | 0.656 (0.64) |
| Constant | 18.601 ** (2.37) | 19.595 *** (3.78) | 12.228 *** (4.26) | 12.790 *** (3.74) |
| Bank Fixed Effects | Yes | Yes | Yes | Yes |
| Year Fixed Effects | Yes | Yes | Yes | Yes |
| N | 97 | 140 | 343 | 249 |
| R2 | 0.503 | 0.484 | 0.357 | 0.359 |
| Adj. R2 | 0.277 | 0.330 | 0.289 | 0.261 |
| F-statistic | 3.578 | 5.581 | 10.221 | 7.463 |
| Bank Type/Size/Policy Timing | Bank Ownership Type | Bank Size | Policy Shock Timing | ||||
|---|---|---|---|---|---|---|---|
| (1) | (2) | (3) | (4) | (5) | (6) | (7) | |
| Central State-Owned Enterprises | Local State-Owned Enterprises | Public Enterprises | Small and Medium-Sized Banks | Large Banks | Before 2013 | 2013 and After | |
| AI × Post | 0.275 *** (3.09) | 0.112 (1.64) | 0.303 *** (2.62) | 0.213 *** (3.75) | 0.505 *** (5.31) | 0.234 ** (2.15) | 0.208 *** (2.91) |
| Capital Adequacy Ratio | 0.267 (0.13) | 8.045 *** (5.00) | 6.786 ** (2.57) | 8.727 *** (6.12) | 4.706 ** (2.29) | 3.359 ** (2.39) | 6.637 *** (3.75) |
| Capital Strength | −10.737 *** (−2.87) | −20.296 *** (−6.25) | −13.032 *** (−3.00) | −14.909 *** (−5.96) | −14.390 *** (−3.65) | −8.479 *** (−3.31) | −10.186 *** (−3.50) |
| Asset Size | −1.484 *** (−8.16) | −1.158 *** (−6.47) | −0.470 *** (−3.39) | −0.739 *** (−6.30) | −2.931 *** (−10.43) | −0.382 *** (−4.32) | −0.547 *** (−4.41) |
| Net Interest Margin | 0.139 * (1.89) | 0.200 *** (2.76) | 0.125 ** (1.98) | 0.128 ** (2.11) | 0.028 (0.50) | 0.227 *** (3.59) | 0.094 * (1.79) |
| GDP Growth Rate (China) | 0.619 (0.91) | 0.538 (0.73) | −0.181 (−0.21) | −0.144 (−0.19) | 1.066 ** (2.03) | 0.223 (0.35) | 0.028 (0.04) |
| M2 Growth Rate | 0.873 (1.08) | 1.491 * (1.68) | 1.384 (1.36) | 1.622 ** (2.55) | 0.410 (0.45) | 1.360 * (1.83) | 0.948 (1.25) |
| Banking Prosperity Index | 0.164 (0.22) | 0.527 (0.64) | 2.296 ** (2.42) | 2.560 *** (3.69) | −1.417 ** (−2.18) | 1.327 * (1.93) | 1.736 ** (2.47) |
| Constant | 17.674 *** (7.34) | 11.036 *** (5.24) | 3.126 * (1.74) | 5.048 *** (3.54) | 35.322 *** (10.25) | 3.152 ** (2.55) | 4.322 *** (2.82) |
| Bank Fixed Effects | Yes | Yes | Yes | Yes | Yes | Yes | Yes |
| Year Fixed Effects | Yes | Yes | Yes | Yes | Yes | Yes | Yes |
| N | 406 | 290 | 290 | 493 | 493 | 522 | 464 |
| R2 | 0.341 | 0.343 | 0.250 | 0.306 | 0.384 | 0.263 | 0.239 |
| Adj. R2 | 0.292 | 0.279 | 0.176 | 0.254 | 0.340 | 0.218 | 0.188 |
| F-statistic | 11.456 | 10.632 | 4.819 | 15.100 | 16.150 | 7.067 | 7.719 |
Disclaimer/Publisher’s Note: The statements, opinions and data contained in all publications are solely those of the individual author(s) and contributor(s) and not of MDPI and/or the editor(s). MDPI and/or the editor(s) disclaim responsibility for any injury to people or property resulting from any ideas, methods, instructions or products referred to in the content. |
© 2026 by the authors. Licensee MDPI, Basel, Switzerland. This article is an open access article distributed under the terms and conditions of the Creative Commons Attribution (CC BY) license.
Share and Cite
Li, X.; Zhang, D.; Zeng, N.; Meng, D. How Does Artificial Intelligence Reshape Bank Profitability in China?—Evidence from a Multi-Period Difference-in-Differences Model. Int. J. Financ. Stud. 2026, 14, 39. https://doi.org/10.3390/ijfs14020039
Li X, Zhang D, Zeng N, Meng D. How Does Artificial Intelligence Reshape Bank Profitability in China?—Evidence from a Multi-Period Difference-in-Differences Model. International Journal of Financial Studies. 2026; 14(2):39. https://doi.org/10.3390/ijfs14020039
Chicago/Turabian StyleLi, Xiaoli, Dongsheng Zhang, Na Zeng, and Defeng Meng. 2026. "How Does Artificial Intelligence Reshape Bank Profitability in China?—Evidence from a Multi-Period Difference-in-Differences Model" International Journal of Financial Studies 14, no. 2: 39. https://doi.org/10.3390/ijfs14020039
APA StyleLi, X., Zhang, D., Zeng, N., & Meng, D. (2026). How Does Artificial Intelligence Reshape Bank Profitability in China?—Evidence from a Multi-Period Difference-in-Differences Model. International Journal of Financial Studies, 14(2), 39. https://doi.org/10.3390/ijfs14020039