1. Introduction
Institutional investors construct portfolios by aligning target alpha with investment principles and formulating strategic asset allocation based on capital market assumptions for each asset class. Modern portfolio theory, introduced by
Markowitz (
1952), emphasizes the importance of balancing expected returns with portfolio risk to achieve optimal portfolio construction. A key component of this process is the development of benchmarks that accurately reflect the characteristics of each asset class, ensuring effective strategic asset allocation. As
Bacon (
2023) notes, benchmarks serve as essential reference points for evaluating portfolio performance, enabling asset owners and investment managers to systematically assess the effectiveness of their strategies. Similarly,
Kuntz and August (
2023) underscores the critical role of benchmark selection in shaping portfolio construction and investment strategy. This study aims to develop a benchmark for an emerging and relatively understudied asset class—private debt.
While traditional asset classes have been extensively analyzed in the literature, alternative asset classes are gaining increased attention due to their growing role in portfolio diversification.
Huang and Zhong (
2013) demonstrate that commodities, REITs, and government bonds act as effective hedges against inflation, providing stability in uncertain market conditions. Likewise,
D. Cumming et al. (
2012) highlight the role of private equity in constructing defensive portfolios, arguing that strategic asset allocation can extend beyond the conventional Markowitz framework. The growing prominence of alternative assets is evident in their performance relative to traditional benchmarks. As shown in
Figure 1, private equity, infrastructure, and private debt have consistently outperformed the Morgan Stanley Capital International (MSCI) World Index, reinforcing their significance in modern asset allocation strategies
1.
The development of reliable benchmarks for private market investments, particularly private debt, has long posed challenges for academics and practitioners. Unlike public market instruments, private debt assets are characterized by limited transparency, irregular valuation intervals, and a lack of standardized reporting, making traditional benchmarking approaches less applicable (
Phalippou & Gottschalg, 2009). Early efforts to evaluate private market performance often relied on indices such as the Preqin or Cambridge Associates benchmarks, which aggregate historical fund-level data. These indices are widely used to monitor performance ex post and have played an important role in evaluating investment decisions by institutional investors. However, their utility in portfolio optimization and strategic asset allocation is limited by the fact that they suffer from reporting delays, which reduce their reliability for real-time investment decisions (
Cornel, 2017). For these reasons, researchers have increasingly turned to asset-based benchmarks that use synthetic proxies constructed from public market indices.
In recent years, institutional investors, including sovereign wealth funds and pension funds, have increasingly incorporated private debt into their portfolios, recognizing its potential for diversification and attractive risk-adjusted returns. However, the absence of standardized and widely accepted benchmarks for private debt remains a major obstacle. Without clear performance metrics, investors struggle to evaluate risk, compare returns across portfolios, and make informed allocation decisions. Addressing this gap is essential for improving the transparency, efficiency, and integration of private debt within institutional investment frameworks.
This study aims to develop a proxy benchmark for the private debt market, specifically targeting the Preqin private debt index (PPDI). It is a widely recognized benchmark that provides reliable and comprehensive insights into private debt performance. As a peer group index, it aggregates performance data from general partners (GPs) and limited partners (LPs), offering a representative measure of private debt fund returns. The two-stage peer group benchmarking method, as outlined by
Wilkens et al. (
2014), orthogonalizes benchmarks against exogenous factors, capturing broader commonalities in alternative investment fund returns compared to traditional methods. However, the PPDI’s reliance on quarterly reports from GPs introduces a one-quarter time lag, limiting its effectiveness for timely strategic asset allocation.
To address this limitation, this study incorporates asset-based indexes to develop a proxy benchmark for the PPDI. Asset-based indexes, produced by organizations such as Morningstar, Credit Suisse, iBoxx, and Bloomberg, are derived from publicly traded market indices and updated timely compared to peer group indexes. Their timely reporting method enables more responsive adjustments across asset classes, making them particularly useful for strategic decision-making in institutional investment portfolios. By leveraging asset-based indexes, this study constructs a proxy model that enhances the applicability of the PPDI for real-time strategic asset allocation.
Data for the PPDI were sourced from the Preqin database, while explanatory variables were obtained from Bloomberg. The dataset consists of quarterly observations spanning from 31 December 2004 to 31 March 2023. Using both simple and multivariate linear regression models, this study develops a refined proxy benchmark for the PPDI, addressing the need for a more timely and effective performance measurement tool in the private debt market.
Our simple regression analysis identifies the Cliffwater Direct Lending Index (CDLI) as the asset-based index with the highest explanatory power for the PPDI. A multivariate regression model further enhances alignment, outperforming commonly used existing benchmarks in the US institutional market. These findings suggest that the proposed multivariate model as a benchmark could enhance the strategic asset allocation process for private debt. Given the evolving nature of the private debt market, continuous monitoring and refinement of proxy benchmarks are essential to maintain their relevance as market conditions change.
Compared to previous literature, which has largely focused on developing proxy benchmarks for private equity, relatively little attention has been given to constructing such benchmarks for private debt. This study addresses that gap and offers practical implications for institutional investors. Our proposed proxy benchmark, constructed using asset-based indices, closely tracks the PPDI and provides a timely and representative overview of the private debt market without reporting delays.
The remainder of this paper is structured as follows:
Section 2 reviews the relevant literature on proxy benchmarks for alternative investments and institutional investors’ benchmarking approaches.
Section 3 provides an in-depth analysis of private debt indexes and the data used in this study.
Section 4 presents the empirical results, identifying the most relevant indexes among those analyzed. Finally,
Section 5 summarizes the key findings and discusses directions for future research.
2. Literature Review
2.1. Private Market Products as Alternative Asset Classes
Prior research has extensively examined the benefits of incorporating alternative investments into traditional portfolios of stocks and bonds. Empirical studies consistently demonstrate that adding alternative assets such as hedge funds, private equity, and Real Estate Investment Trusts (REITs) enhances portfolio performance. For example,
Huang and Zhong (
2013) show that commodities, REITs, and government bonds provide effective protection against inflation, while
D. Cumming et al. (
2012) highlight private equity’s role in constructing defensive portfolios. Their findings suggest that strategic asset allocation, which integrates alternative investments, may outperform the conventional Markowitz framework in certain market conditions.
Among alternative assets, private equity has been widely studied due to its strong performance persistence and unique return characteristics.
Kaplan and Schoar (
2005) attribute private equity’s performance persistence to the proprietary expertise of general partners (GPs), who actively manage portfolio companies to generate superior returns. Further research, including studies by
Glode and Green (
2008),
Hochberg et al. (
2014), and
Marquez et al. (
2010), explores the drivers of private equity outperformance and its implications for fund structures, while
Stucke (
2011) addresses survivorship bias in private equity indices.
Despite the extensive literature on private equity, research on private debt remains relatively limited.
Carey (
1998) was among the first to analyze private debt, emphasizing its importance in portfolio diversification and credit risk assessment. US and European institutional investors are managing USD 390bn in private debt assets under management, which are primarily direct lending funds (
Block et al., 2024).
The definition of private debt has evolved across studies, reflecting the diversity of instruments and lending structures involved.
Fang and Haque (
2024) describe private debt as debt-like instruments that are not publicly traded and are typically issued by non-bank entities such as private credit funds or business development companies. In a similar vein,
Fabozzi (
2022) characterizes private debt as loans that originate outside the traditional banking system, highlighting their role in financing where conventional intermediation is absent. The private debt asset class is broad in scope, encompassing corporate, real estate, structured, and infrastructure debt. According to
Haque et al. (
2024), private debt commonly refers to loans provided by non-bank lenders, often distinguished by larger loan sizes, junior capital tranches, longer maturities, and higher spreads compared to traditional bank loans. These instruments are seen as complementing bank credit lines while also serving as substitutes for higher-risk bank term loans in corporate borrowing.
While the previously discussed literature shows considerable conceptual overlap, this study defines private debt as an asset class composed of loans originated by non-bank lenders. This definition encompasses the full spectrum of tranches, including leveraged loans, mezzanine financing, and opportunistic loans, offering a comprehensive framework that best captures the structure and characteristics of private debt.
More recent studies have examined specific factors influencing private debt markets.
Giuzio et al. (
2018) utilize aggregated historical data on bank loan interest rates provided by the European Central Bank as a proxy to evaluate private debt performance in Europe. Employing multivariate lagged regression analysis, they decompose this proxy into various components influenced by loan interest rates, credit conditions, and market factors. Their findings reveal the existence of a “complexity premium” in private debt returns, observable as a significant unexplained residual in the model.
Balachandran et al. (
2019) investigate how pension deficiencies adversely impact firms engaged in private debt contracts, while
Francis et al. (
2020) analyze the role of management decisions in shaping contractual terms in private debt agreements.
Bavoso (
2020) further explores financial vulnerabilities in the collateralized loan obligation (CLO) sector, highlighting systemic risks associated with leveraged lending structures.
Several studies have attempted to develop broader insights into private debt market dynamics.
Everett and Paglia (
2012) discuss indices such as the Private Capital Access Index, which track capital demand and availability for private firms, thereby influencing investment decisions. A private credit return index constructed using loan data reveals consistent positive excess returns, which exhibit strong correlations with both volatility and credit risk (
D. J. Cumming et al., 2016). These findings underscore the inherent risk–return tradeoff in private debt investments and reinforce the need for more sophisticated risk-adjusted performance evaluation methodologies. While
Fabozzi (
2022) does not specifically address private debt indexes, his work provides insights into private corporate debt markets, discussing credit strategies, risk exposures, compensation structures, and management challenges faced by institutional investors.
The effectiveness of insolvency frameworks also plays a pivotal role in shaping private debt markets and influencing overall market stability.
Consolo et al. (
2018) find that jurisdictions with well-developed insolvency mechanisms experience faster deleveraging and lower non-performing loan (NPL) ratios, indicating that legal and regulatory structures significantly impact private debt market efficiency. However, private debt investments also present challenges related to financial reporting risks. Firms with outstanding debt may engage in classification shifting, manipulating financial statements, and misleading stakeholders (
Chung et al., 2021). These distortions highlight the need for rigorous due diligence by lenders and investors to safeguard financial integrity and ensure accurate credit risk assessments. Private debt can reduce government subsidies for state-owned firms by allowing defaults, thus minimizing socially costly financial support (
Picard & Rusli, 2018). This mechanism can enhance efficiency but also raises concerns about the implications for public welfare. Developing countries indicate that improvements in public debt management have positive spillover effects on private capital inflows and domestic financial deepening (
Pedersoli & Presbitero, 2023).
As discussed above, previous studies have primarily focused on defining the concepts and characteristics of the private debt market. In terms of benchmarking, most research has concentrated on the need for asset-based indices within the private equity context. In contrast, practical studies addressing proxy benchmarks specifically tailored for private debt remain limited. Building upon these prior studies, this study contributes to the literature by empirically analyzing the significance of various indices relevant to the private debt market, aiming to derive an optimized benchmark.
2.2. Benchmark Approaches for Private Debt Market
As allocations to alternative assets have grown, institutional investors have encountered mounting challenges in performance evaluation and strategic allocation, particularly in illiquid markets such as private debt. Unlike public equities or bonds, private debt lacks standardized pricing, continuous valuation, and high-frequency return data, making the selection of appropriate benchmarks more complex. Academic and practitioner literature increasingly underscores the need for more nuanced benchmarking approaches to capture both the market dynamics and structural characteristics of private debt (
Franzoni et al., 2012).
Three major categories of benchmarks are commonly employed in alternative asset contexts: peer group indexes, asset-based indexes, and absolute return benchmarks (
Dopfel, 2008). Peer group indices, such as those published by Preqin and Burgiss, aggregate fund-level performance across similar strategies. The peer group index approach shows a more rigorous return analysis than quartile ranking (
Tausch & Rieder, 2023). These are widely used for evaluating manager performance relative to peers and for understanding the distribution of fund returns within an asset class. However, because they are based on self-reported fund data, these indexes are subject to time lags, typically one quarter, and various reporting biases. Their utility for real-time allocation decisions or risk monitoring is thus limited (
Kaplan & Schoar, 2005). This time lag has become a central concern for institutional investors who seek to align benchmarks with broader, forward-looking asset allocation models.
In response, asset-based indexes have gained increasing attention. These indexes track the market performance of publicly traded securities that serve as proxies for the underlying asset class. For private debt, notable examples include the Morningstar LSTA US Leveraged Loan Index (MLUS), Bloomberg’s U.S. High Yield Indices, and the iBoxx Liquid Leveraged Loan Index (iBLL). While not composed of private loans, these indices offer more frequent and timely data that can aid in cross-asset comparison and portfolio risk management. The use of such indices as benchmarks for private credit funds has gained traction, as they offer a closer approximation of the risk–return profile of leveraged lending strategies. By aligning with the structural characteristics of many private debt funds, these benchmarks enhance the analytical accuracy of performance evaluation, particularly in relation to traditional credit instruments (
Munday et al., 2018). Yet, they fall short in reflecting the structure and illiquidity premium of direct lending markets. This misalignment arises because public instruments often differ from private ones in terms of borrower characteristics, documentation standards, and capital structures (
Friewald et al., 2014).
A related body of literature has examined benchmarking methodologies that assign index weights using financial metrics such as earnings, cash flow, or book value instead of market capitalization. These non-price-based approaches aim to reduce reliance on investor sentiment and enhance the representativeness of long-term value.
Arnott et al. (
2005) argue that weighting schemes grounded in accounting fundamentals provide a more stable and economically meaningful basis for index construction. While this methodology has been primarily developed in the context of public equity markets, its conceptual foundation is gaining relevance for benchmarking illiquid asset classes such as private debt, where observable prices are unavailable and valuation relies on modeled or internal assumptions.
The relevance of such approaches becomes more apparent in liability-driven investment contexts.
Magnússon and Ólafsson (
2017), in a study of the Icelandic pension system, show that portfolios aligned with liability profiles and fundamental indicators outperformed conventional risk–return optimized portfolios during market downturns. This underscores the broader point that benchmarks designed to reflect long-term institutional objectives, rather than short-term market movements, may offer superior alignment with the role private debt plays in a diversified portfolio—namely, income stability, downside protection, and duration matching.
Despite the appeal of asset-based or financially anchored indexes, their adoption in private markets remains limited by the complexity of capturing the true structure of bespoke lending deals. Moreover,
Dopfel (
2008) cautions that while accounting-based weighting may enhance long-term stability, it can introduce tracking error during periods of heightened volatility or sentiment-driven re-pricing. For this reason, any attempt to replace peer group benchmarks like the PPDI must be empirically validated to ensure they do not sacrifice representational accuracy for immediacy.
The evolving treatment of private debt in institutional portfolios has also catalyzed interest in improved benchmarking frameworks. Historically managed as a subset of private equity or real assets, private debt has now been recognized as a standalone asset class by several major pension funds. In 2021, the California Public Employees’ Retirement System (CalPERS) designated private debt as an independent category, adopting the MLUS plus 125 basis points as its benchmark. Other institutions, including the Nebraska Investment Council, the Sacramento County Employees’ Retirement System (SCERS), and the Arizona State Retirement System (ASRS), have adopted similar practices, typically applying a premium of 125 to 250 basis points over public loan indexes. These benchmark premiums are intended to reflect the illiquidity premium and underwriting risk associated with private loans while enabling alignment with fixed-income return expectations.
Nonetheless, the most widely used benchmark within the private debt domain remains the PPDI. With its broad coverage of corporate direct lending, infrastructure finance, real estate debt, and consumer credit, it serves as a comprehensive performance indicator. However, the reporting delay and backward-looking nature of the PPDI make it ill-suited for strategic asset allocation and real-time portfolio rebalancing. This disconnect has led to growing interest in constructing hybrid benchmarks that preserve the representational depth of peer group indexes while incorporating the responsiveness and replicability of asset-based alternatives.
Taken together, the literature indicates a clear tension between representativeness and timeliness in benchmark design for private debt. While peer group indexes offer comprehensive exposure data, they lack responsiveness. Asset-based indexes provide immediacy but may fail to capture the structural realities of the asset class. The current gap in benchmark tools calls for empirical work that evaluates how well these indexes track actual private debt performance, both in aggregate trends and in explaining fund-level variation. This study contributes to that effort by assessing the explanatory power of asset-based benchmarks relative to the PPDI, with the aim of identifying a more practical proxy for strategic investment applications.
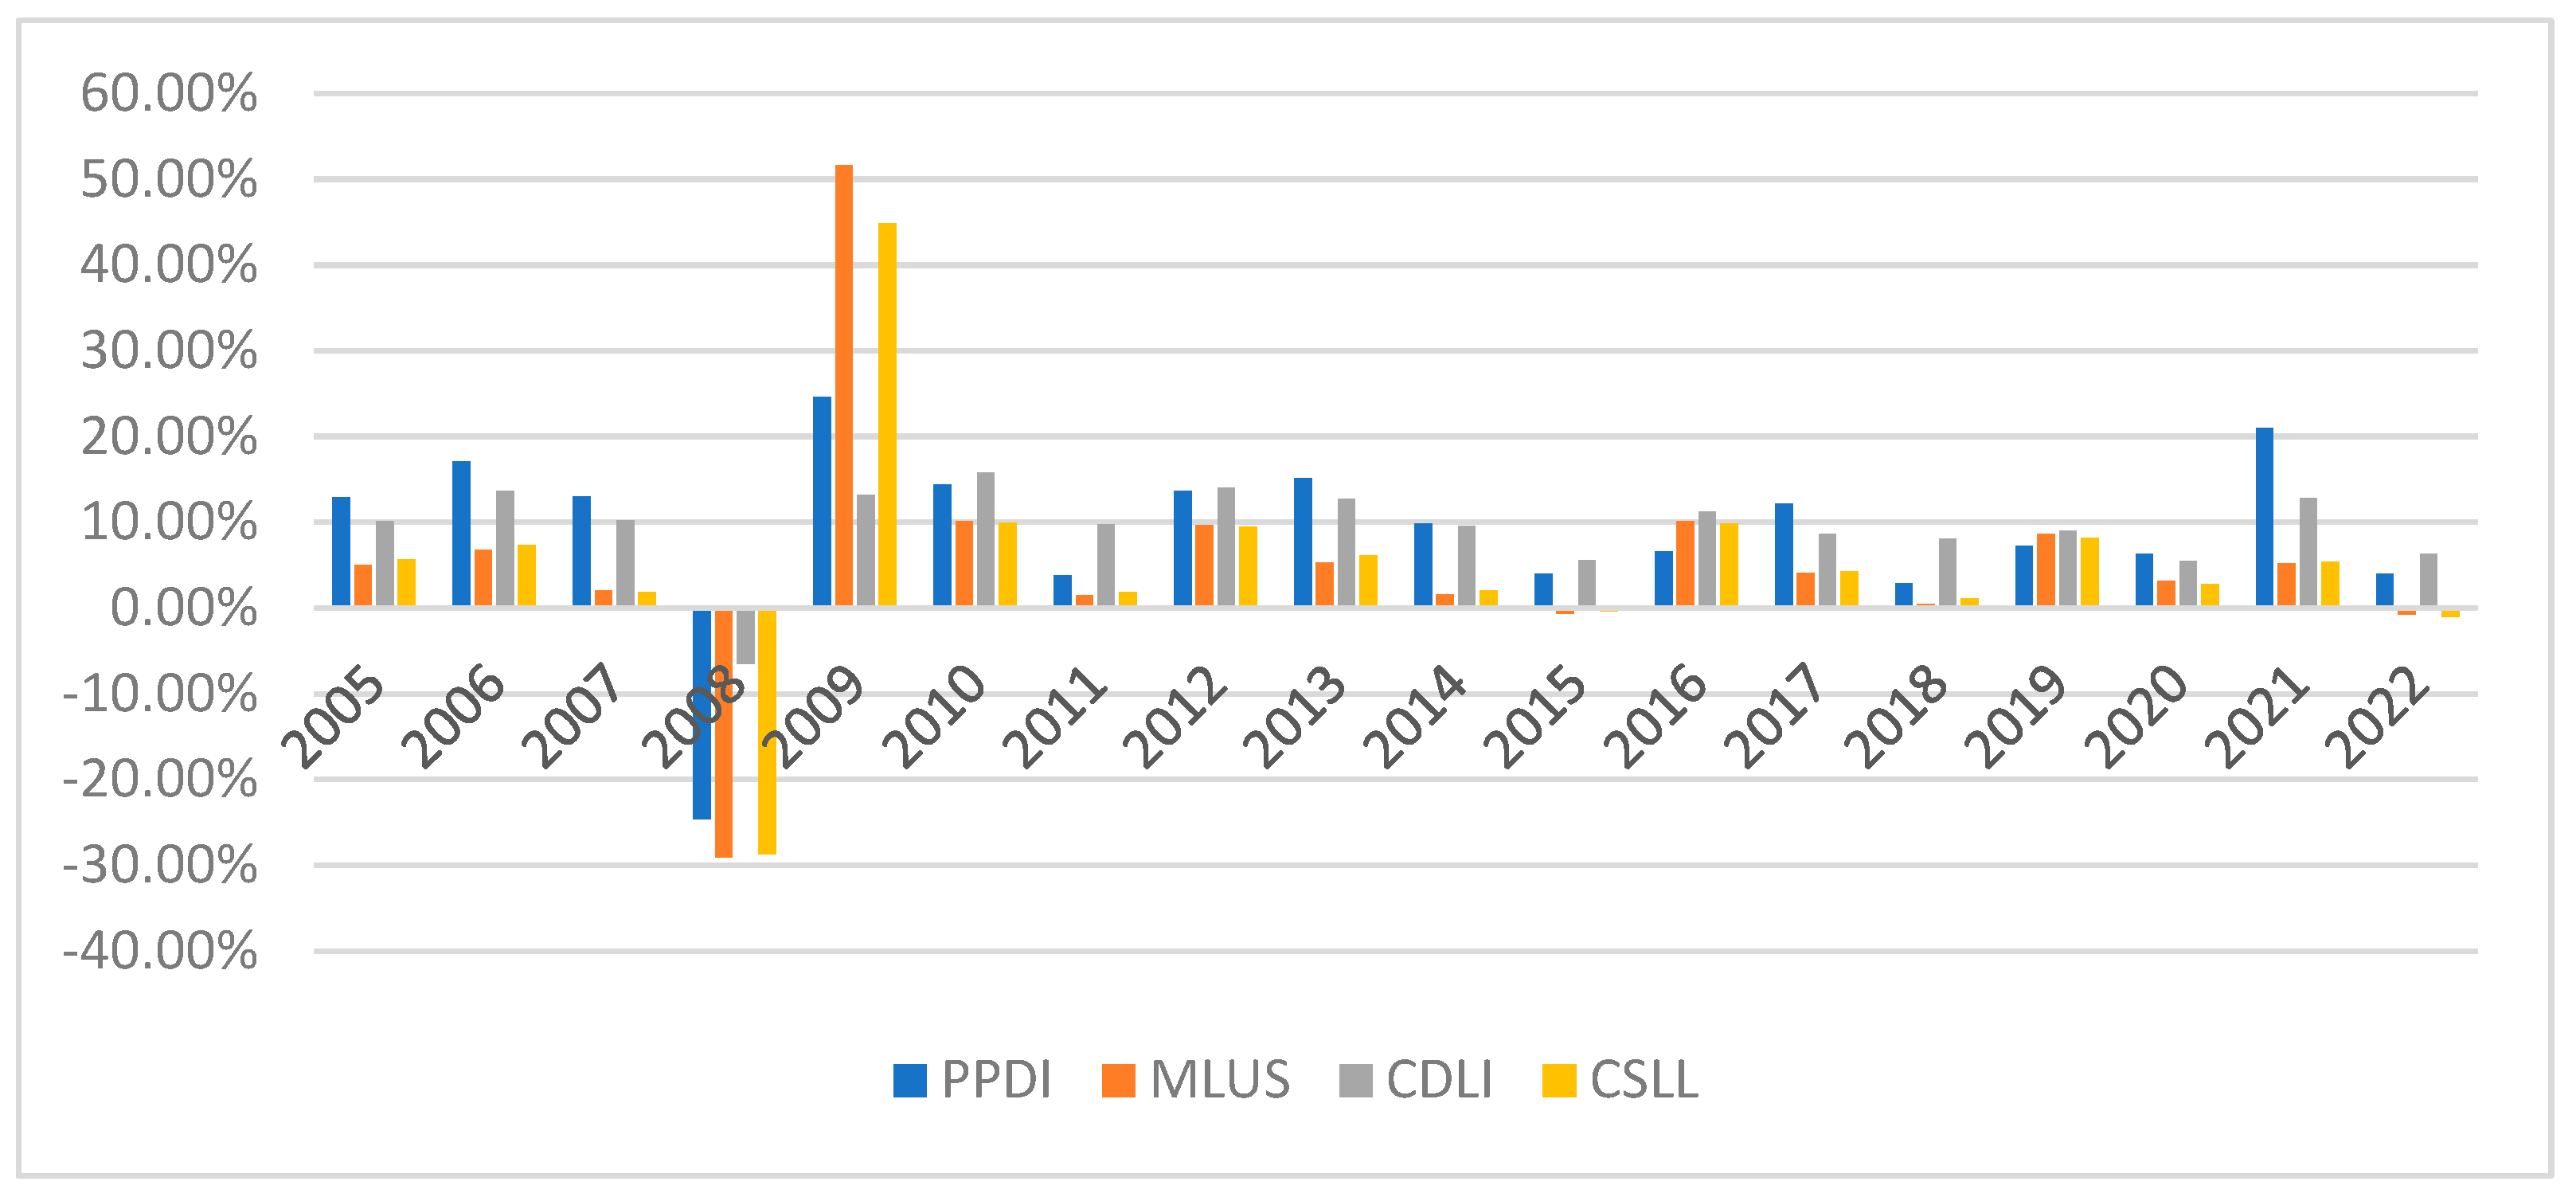
As a preliminary investigation, we conducted a comparative analysis of the PPDI and three used benchmarks that some institutional investors use as benchmark: the MLUS, the Credit Suisse Leveraged Loan index (CSLL), and the CDLI. The result is reported in
Figure 2. From December 2004 to December 2022, the average annualized return of the PPDI was 9.11%, exceeding that of the MLUS (7.77%) and CSLL (7.03%). To offset this gap, some institutions utilize a spread of about 125~250 bp on top of these indices. Over the same period, the CDLI was closely tracking the PPDI, which yielded 9.42% over the same period.
This suggests that the CDLI, by focusing on private direct lending transactions, better captures the return dynamics of the asset class. Notably, year-on-year comparisons of the time-weighted rate of returns (TWRR) reveal strong alignment between the PPDI and CDLI during key stress periods, including the global financial crisis in 2008–2009. As TWRR adjusts for external cash flows, it offers a purer measure of performance, and its consistency across these two indexes supports the view that the CDLI may be a more representative benchmark for private credit.
Despite these findings, average return comparisons alone do not fully address questions of benchmark suitability. Differences in volatility, skewness, drawdown risk, and liquidity exposure also warrant closer examination. As such, the identification of a more effective proxy benchmark for private debt should not rest solely on return similarity but also on the statistical explanatory power and responsiveness to market cycles. To this end, our study employs both univariate and multivariate regression analyses using quarterly data to evaluate the extent to which asset-based indexes explain the variation in PPDI performance.
4. Empirical Results
Table 2 presents the mean, standard deviation, minimum, and maximum of each variable used in our analysis. The statistics indicate that the R_PPDI and the R_CDLI share similar mean values, suggesting comparable average returns. In contrast, the R_MLG shows the lowest mean return among the indices. Regarding volatility, the R_BGHYC has the highest standard deviation, reflecting the greatest variability in performance. Conversely, the R_CDLI exhibits the lowest standard deviation, underscoring its relatively stable movement.
Table 3 provides Pearson correlation coefficients to assess the strength of the relationship between each index and the R_PPDI. Among the indices, the R_CDLI shows the strongest alignment with the R_PPDI, with a correlation coefficient of 0.733. In contrast, the R_MLG exhibits the weakest correlation, with a coefficient of 0.505, indicating limited similarity in performance trends.
Next, to evaluate the individual contribution of each public market index to the performance of private debt, a series of simple regression analyses was conducted using the R_PPDI as the dependent variable. In
Table 4, each model includes a single independent variable corresponding to one of the selected indices. The results reveal variation in both statistical significance and explanatory power across the regressions. Specifically, Panel A, with the independent variable R_CDLI, exhibited the strongest positive coefficient (1.444) and the highest explanatory power (R
2 = 0.536). Its residuals showed normality (Jarque–Bara statistics’
p-value = 0.105), no heteroscedasticity (Breusch–Pagan statistics’
p-value = 0.421), and no significant autocorrelation (Ljung–Box Q’s
p-value = 0.587), indicating a reliability of regression estimation. Most of the other models exhibit similarly consistent residual diagnostics.
Panel B, featuring R_CSLL, displayed moderate explanatory power (R2 = 0.301) with a meaningful positive impact (coefficient = 0.491). R_BGAHY and R_BGHYC, respectively, despite showing good to high explanatory power (R2 = 0.357 and R2 = 0.399), revealed significant residual autocorrelation (Ljung–Box Q’s p-values = 0.011 and 0.007, respectively). R_iBLL, R_MLG, and R_MLUS demonstrated significant positive coefficients (ranging from 0.375 to 0.418), although with relatively lower explanatory power (R2 between 0.234 and 0.262). Crucially, all three panels maintained sound model diagnostics, evidenced by Breusch–Pagan statistics, Jarque–Bara statistics, and Ljung–Box Q statistics.
In unreported results, we also analyzed normal probability plots (P-P plots) of residuals for each model, showing that the residuals closely aligned with the diagonal line, supporting the assumption of normality. Histogram plots of residuals display bell-shaped distributions, confirming the normality of errors. Together, these diagnostics indicate that the assumptions of normality of errors were adequately met for the analyzed indices.
Developing a benchmark using only one asset-based index has a limitation in terms of explanatory power. Using various indices might yield more significant explanatory models to mimic R_PPDI. To achieve this, a multiple regression analysis was performed to evaluate the combined significance of the indices. As reported in
Table 5, the multivariate regression model is statistically significant (F = 29.28,
p < 0.001) and demonstrates strong explanatory power, with an R-squared value of 70.3%. This result suggests that the combined use of multiple asset-based indices enhances the ability to track R_PPDI more accurately than any single index alone.
Nevertheless, the analysis identifies potential multicollinearity among the independent variables, as most indices have Variance Inflation Factor (VIF) values exceeding 10. An exception is R_CDLI, which has a VIF of 2.92, below the critical threshold. This finding underscores the robustness of R_CDLI as an independent predictor, free from the issues of multicollinearity observed in other indices.
The high VIF values in
Table 5 can be attributed to the strong pairwise correlation among several independent variables, as reported in
Table 3. Specifically, the Pearson correlation coefficients indicate near-perfect collinearity between certain pairs of indices: R_CSLL and R_iBLL (0.997), R_BGAHY and R_BGHYC (0.908), and R_MLG and R_MLUS (0.987). Such high correlations suggest significant redundancy of information among these variables, which can distort regression estimates and undermine the model’s stability.
To address multicollinearity among the independent variables, we adopted an iterative reduction approach whereby only one index from each highly correlated pair was retained. The selection criterion prioritized the index demonstrating the strongest statistical association with the dependent variable, R_PPDI. This process was repeated until the remaining variables exhibited no significant multicollinearity. The final specification includes three indices: R_CDLI, R_CSLL, and R_BGHYC, which emerged as the most representative predictors for the refined model. With this compressed set of independent variables, we conducted a revised regression analysis, as reported in
Table 6. The results indicate a slight reduction in explanatory power, with the R-squared decreasing to 60.1%. However, the refined model demonstrates improved statistical stability, as all independent variables have VIF values below 10, eliminating multicollinearity concerns. Additionally, residuals follow the basic assumptions of normality, no heteroscedasticity, and no autocorrelation. Despite these improvements, R_CSLL exhibits a
p-value of 0.258, exceeding the conventional significance threshold. This finding suggests that R_CSLL may not be a robust predictor in the revised model, and further data processing or model refinement may be necessary to address this issue.
We further conducted a multivariate regression analysis without the insignificant variable, R_CSLL. The final regression model, therefore, includes R_CDLI and R_BGHYC as independent variables. As reported in
Table 7, the final model demonstrates high explanatory power, with an R-squared value of 57.8%, indicating that the selected variables collectively explain a substantial portion of the variance in R_PPDI. Importantly, the two independent variables are statistically significant, with
p-values less than 0.05, confirming their strong predictive relationship with R_PPDI. In addition, the VIF values for all included variables remain below 2, effectively mitigating concerns about multicollinearity. Diagnostic tests on the residuals—including the Breusch–Pagan, Jarque–Bera, and Ljung–Box tests—support the validity of key regression assumptions. Furthermore, histograms and Q–Q plots of the residuals are provided in
Figure 3 for visual confirmation. Overall, these findings indicate that the final model achieves an optimal balance between explanatory power and statistical robustness, offering a reliable framework for benchmarking private debt market performance.
By systematically refining the model through the elimination of redundant or insignificant variables, this study ensures that the final benchmark is both statistically sound and practically applicable for institutional investors seeking reliable private debt performance metrics.
To construct a robust benchmark for tracking the R_PPDI, we initially examined seven asset-based indices as potential explanatory variables. Through a series of multivariate regression analyses, we systematically refined the model by removing redundant and statistically insignificant variables, ultimately identifying a combination of two key indices—R_CDLI and R_BGHYC, that provide the strongest explanatory power for the R_PPDI. The final regression equation is in Equation (1) as below:
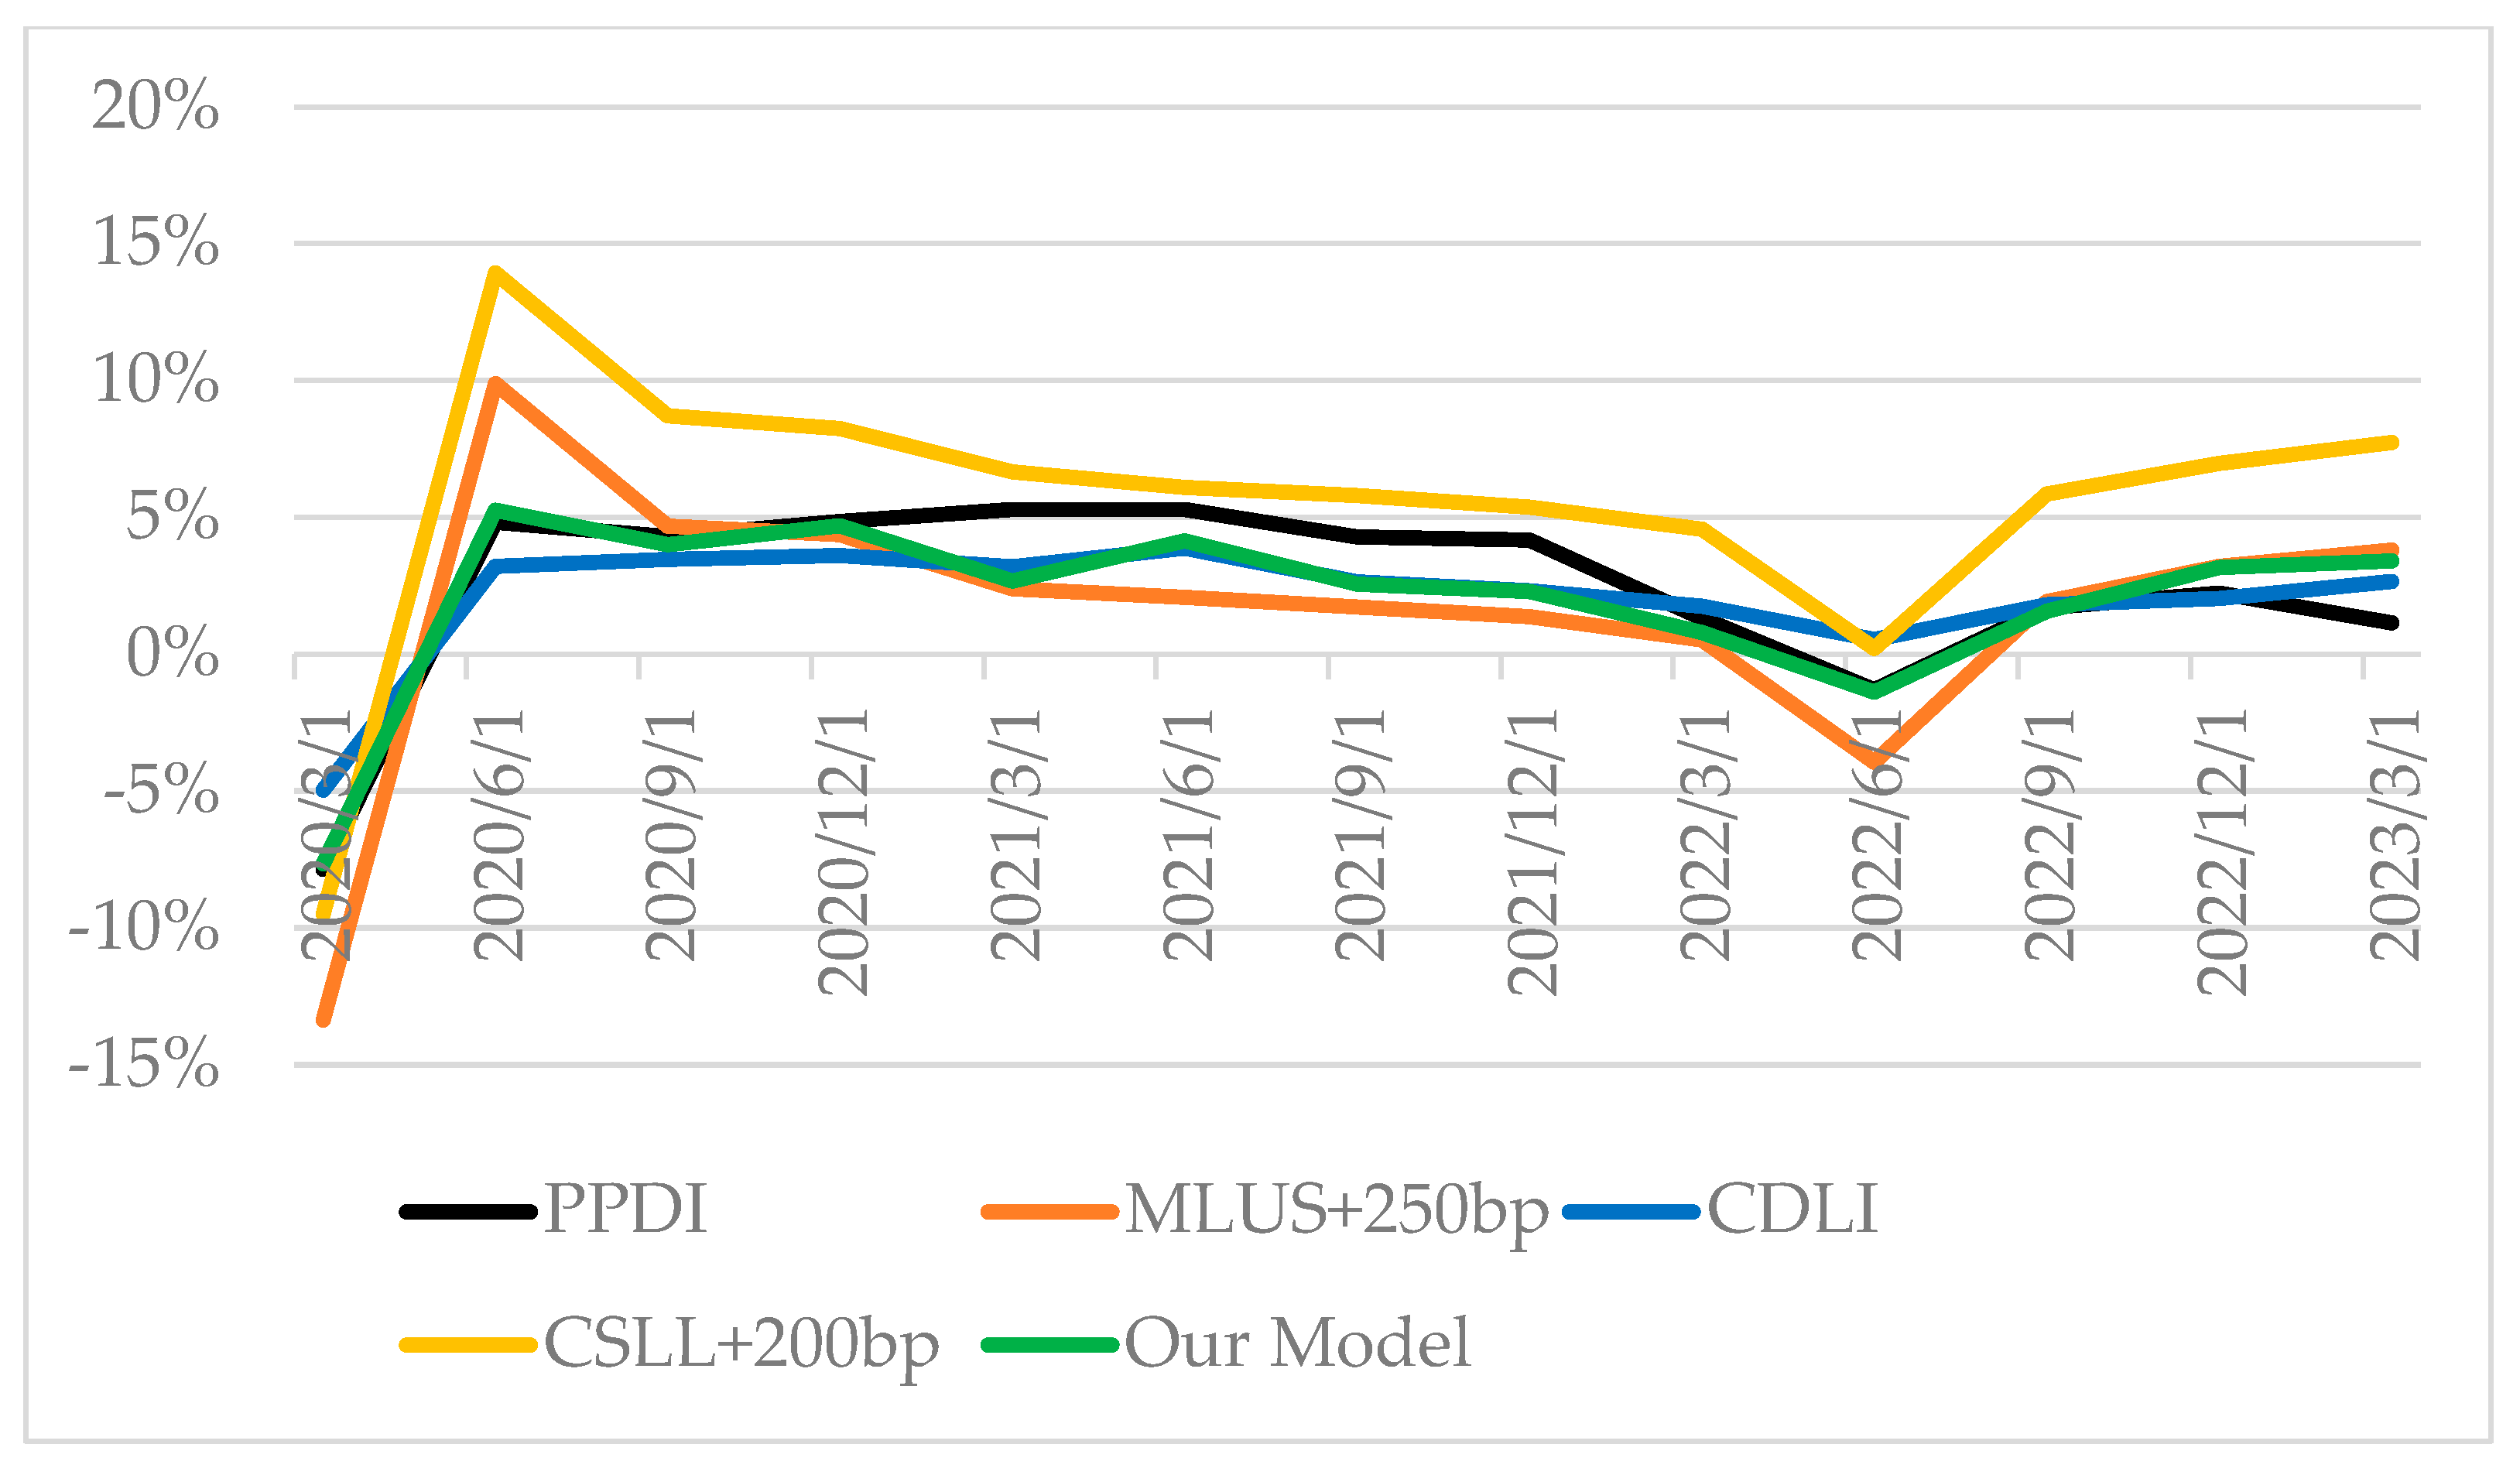
As a final step in validating our benchmark model, we compared its predictive performance against the benchmarks commonly employed by major institutional investors, using a prediction period from 2020 1Q to 2023 1Q. To ensure a realistic assessment of the model’s forecasting ability, we implemented a walkthrough estimation and prediction approach. This method involves estimating the regression model using data up to—but not including—the quarter being predicted and then applying the model to forecast the return of the PPDI for that specific quarter. For example, to predict the return of the PPDI for 2020 4Q, the model is estimated using data through 2020 3Q. The fitted model is then applied to the fourth-quarter input values to generate the prediction. This procedure is repeated for each quarter through 2023 1Q. By simulating how the model would have performed in real-time, this walkthrough approach provides a more rigorous test of its out-of-sample predictive accuracy and its practical viability as a proxy benchmark.
As reported in
Table 8, compared to existing industry benchmarks, the model developed through our regression analysis produces average returns that are closely aligned with those of the PPDI, while also maintaining a moderate level of volatility. The average absolute difference between the predicted returns from our model and the actual PPDI returns stands at 0.957%, which is lower than those observed for the commonly used industry benchmarks, indicating greater predictive precision. In addition, when comparing the standard deviations of the absolute differences, our benchmark model demonstrates good stability relative to the other industry benchmarks. The model also achieves the lowest root mean squared error (RMSE) among the benchmarks considered, further underscoring its accuracy in tracking private debt performance. Notably, the 95% confidence interval becomes narrower as the estimation period lengthens. By the final quarter of the prediction window (Q1 2023), the half-width of the 95% confidence interval shrinks to just 0.414%. This suggests that expanding the dataset further would likely enhance prediction accuracy and reduce uncertainty.
Figure 4 illustrates benchmark performance over time. As shown in the graph, our model performs particularly well during periods of heightened market volatility. Collectively, these results emphasize the practical value of our benchmark model. Its ability to deliver accurate and stable return estimates reinforces its potential as a robust benchmarking tool for institutional investors seeking exposure to the private debt market.
5. Conclusions
Identifying an appropriate proxy index for alternative assets, particularly those favored by institutional investors in strategic asset allocation, remains a complex challenge. This difficulty is compounded by the relatively recent emergence of private debt as a distinct asset class. Our findings highlight the CDLI as the most relevant proxy index for private debt. The CDLI offers a broad representation of the private credit market, incorporating middle-market secured loans, unitranche loans, and subordinated debt. Compared to other indices, the CDLI aligns more closely with the main components of the PPDI, which includes corporate private placements, real estate, infrastructure, and consumer private placements. However, the CDLI alone does not fully capture the complexity and diverse nature of private debt markets. We find that a more robust proxy model is achieved by combining the CDLI with the BGHYC with some weights, significantly improving explanatory power and enhancing its effectiveness as a benchmarking tool for strategic asset allocation.
By combining these two indices, this study seeks to advance the development of an optimized proxy benchmark capable of effectively representing private debt. Furthermore, we anticipate this research will serve as a useful tool for institutional investors seeking to manage private debt as a distinct asset class in their strategic asset allocation. To facilitate this process, active information sharing and collaboration among relevant institutional investors will be essential in establishing appropriate asset allocation policies and research directions.
The proposed composite approach requires continuous validation and refinement to effectively adapt to changing market dynamics. Because of the shortage of data records, it takes time to mature the data. Furthermore, by consistently analyzing indices over a longer time horizon, future research aims to develop an optimized and stabilized proxy benchmark, ultimately contributing to the growth and activation of private credit investments.


