Towards Medicines Reuse: A Narrative Review of the Different Therapeutic Classes and Dosage Forms of Medication Waste in Different Countries


Abstract
1. Introduction
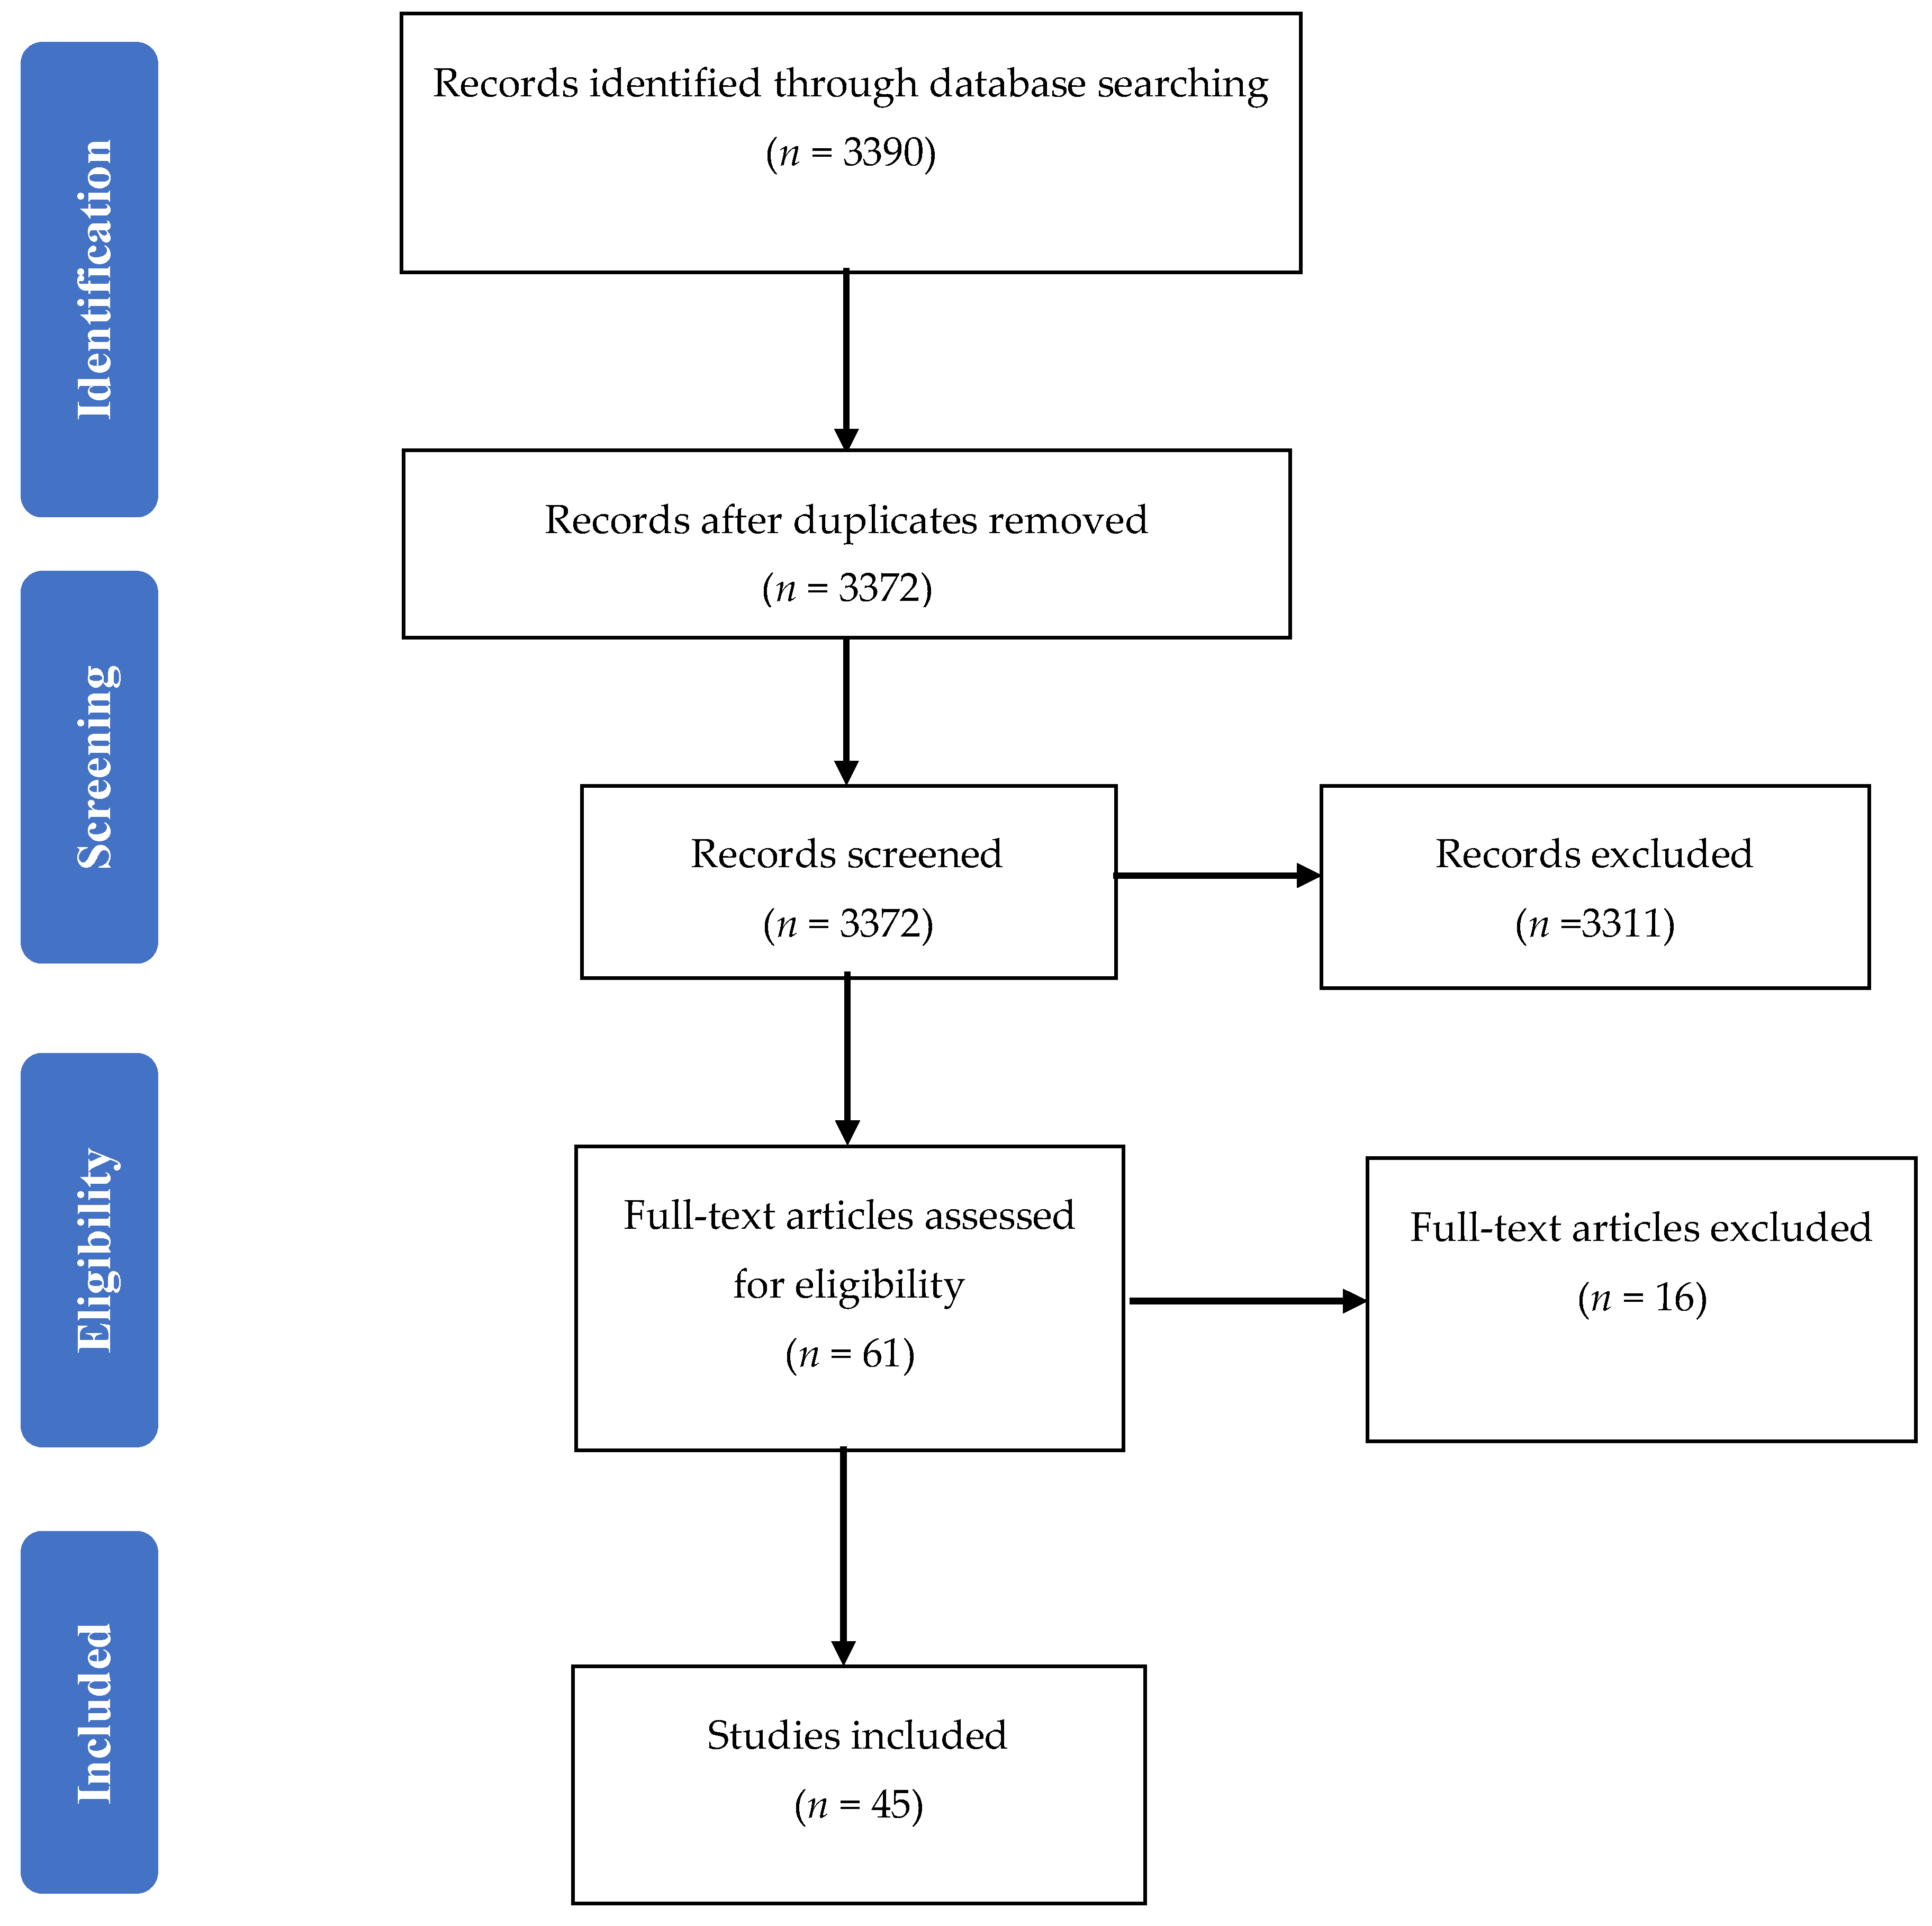
2. Materials and Methods
3. Results
3.1. Studies’ Samples
3.2. Demographics of the Participants
3.3. Dosage Forms of Returned Medication Waste
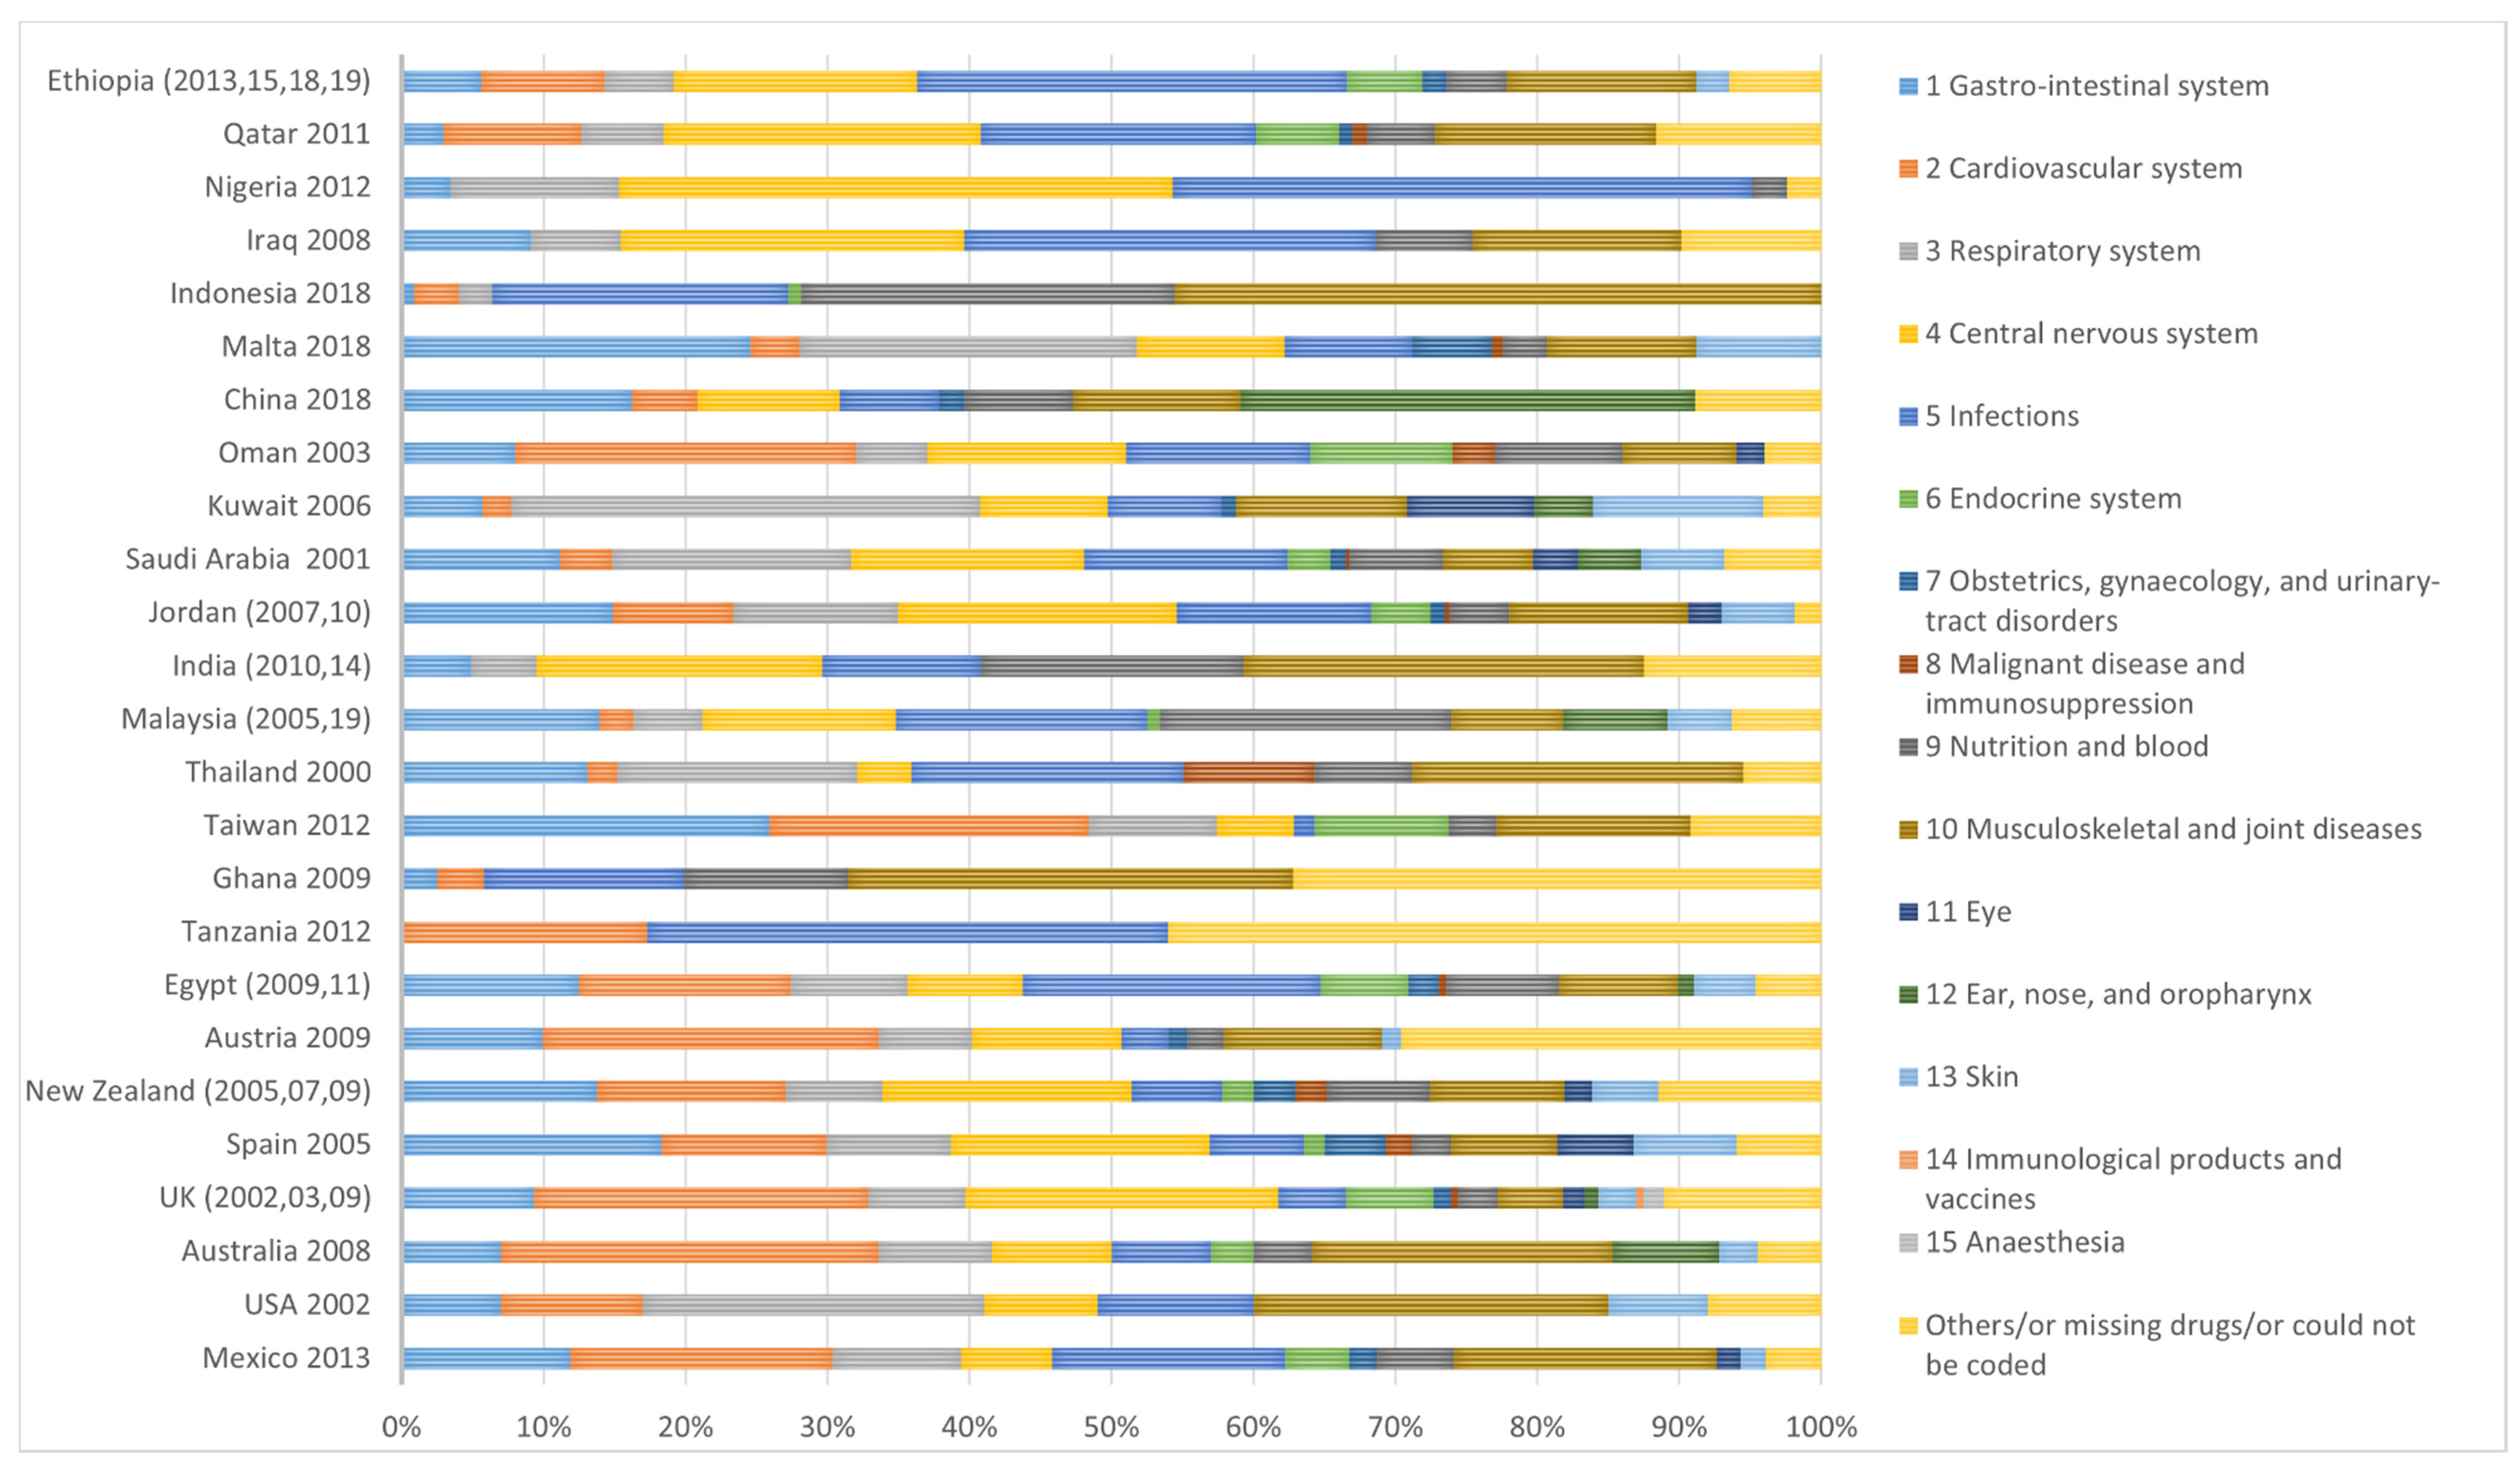
3.4. Therapeutic Category of the Returned Medication Waste
4. Discussion
5. Conclusions
Author Contributions
Funding
Acknowledgments
Conflicts of Interest
Appendix A

| Year of Study | Author(s) | Country/Settings | Research Instrument | Wasted Medicines Information (e.g., Take Back Campaigns vs. Survey) | Sample | Demographics |
|---|---|---|---|---|---|---|
| 2015 | Gracia-Vásquez et al. [61] | Mexico; nine cities of Monterrey | Unused/expired medications were collected from households in a special container placed in a visible and accessible location in 85 collection centres in community pharmacies located in nine cities in the Monterrey metropolitan area over 12 months from March 2012 to February 2013 | Take back program. | Random sample of 22,140 items, 30% of total drugs collected over 12 months), as 70% were unable to be classified. | Not studied. |
| 2008 | Braund et al. [21] | New Zealand | Over a five-week period medications were returned to two collection point pharmacies and questionnaires were completed by returners. | Take back program. In addition, a questionnaire was completed to determine the reasons that the medications were not used. | 163 returns, comprising of 1399 items, with only 126 returned questionnaires. | The majority of those returning medications fall within the age range of 61–80 years. |
| 2007 | Braund et al. [67] | New Zealand; Otago Pharmacies | Medications returned unsolicited to Otago pharmacies over a 9-month period, from 1 April to 31 December 2005. | Take back program. | A random sample (159 kg, 12%) of the 1294 kg of medications returned for destruction over a nine-month period from the Otago region were identified. | Not studied. |
| 2009 | Braund et al. [31] | New Zealand; Hutt Valley District Health Board | A Disposal of Unwanted Medication Properly (DUMP) campaign was conducted for 4 weeks in November 2007 in 31 community pharmacies. Questionnaires were completed by the returners. | Take back program. ‘Disposal of Unwanted Medication Properly (DUMP)’ campaign. | Of the total 1605 bags returned over 4 weeks for disposal, only 329 bags (20%), containing a total of 1253 items were fully analysed. Only 653 questionnaires were completed (41%). | The age distribution of the patients with unused medications was <20 (8%), 21–40 (13%), 41–60 (28%), 61–80 (40%) and >81 years (11%). |
| 2010 | Caroline et al. [29] | New Zealand; Nelson Bays region | A Disposal of Unwanted Medication Properly (DUMP) campaign was conducted for 5 weeks in November and December 2009 and for 3 weeks afterwards. Surveys were completed in 379 bags. | Take back program. ‘Disposal of Unwanted Medication Properly (DUMP)’ campaign. | Of the 6500 DUMP bags distributed across the Nelson Bays region, 1244 bags were returned (response rate 19%), with an average of 7 items per bag (number of items returned 8609). | Not studied. |
| 2009 | James et al. [65] | New Zealand: Taranaki region (around 37,000 households) | Unused medications returned for disposal to the 24 community Pharmacies in the Taranaki region (≈37,000 households) of New Zealand over 6 weeks. | Take back program. | 716 individuals returned 3777 items of unused medications. Of the 3777, information for the amount issued and returned was complete for 2704. The majority (51%) of returns contained 75–100% of the original dispensed amount of medication. | Not studied. |
| 2005 | Langley et al. [62] | United Kingdom; East Birmingham | Unused medications returned to 8 community pharmacies and 5 general practices (G.P.) surgeries over 4 weeks each (4 weeks during August 2001, 4 weeks during March 2002, respectively). | No return campaign was conducted and no attempt was made to encourage patients or carers into returning medicines. Medicines returned to 8 community pharmacies and 5 general practices (G.P.) surgeries over 4 weeks were assessed. | A total of 114 returns; 24 (21.1%) to G.P. surgeries and 90 (78.9%) to community pharmacies. The total returns comprised 340 items, of which 42 (12.4%) were returned to G.P.s and 298 (87.6%) to community pharmacies. | Older patients (60 years and over) returned 61.4% of items with 24.6% of returns coming from patients aged 30–59 years and 5.3% of returns originating from patients under 30. Ages were not recorded for 8.7% of returns. |
| 2007 | Mackridge et al. [63] | United Kingdom; Eastern Birmingham Primary Care Trust (P.C.T.) | Unused medications returned to pharmacies and G.P. surgeries were collected over 8 weeks in May and June 2003 in Eastern Birmingham Primary Care Trust (P.C.T.). Three-quarters of the P.C.T. sites participated, 51/60 (85%) pharmacies and 42/61 (70.5%) G.P. surgeries. | Unused medicines were returned and data were collected in Eastern Birmingham Primary Care Trust (PCT), a predominantly urban PCT with an ethnic minority population of 20%. | 934 return events were made from 910 patients (190 GP surgeries, 744 pharmacies), comprising 3765 items (431 GP surgeries, 3334 pharmacies) and totalling 4934 individual packs. | The mean age of 63.5 ± 0.78 years (10 months to 99 years) and there was no detectable correlation between the mean number of items returned per patient and their age. |
| 2008 | Bradley [64] | United Kingdom; Cumbria | A medicine waste audit in community pharmacies of Cumbria where each pharmacy asked to analyse 20 returns of unused medicines. Further qualitative data were collected by interviewing the patients and their representatives. | Unused medicine were returned to community pharmacies in Cumbria where each pharmacy was asked to analyse 20 returns of unused medicines. | A total 4563 items was received from 87 community pharmacies across Cumbria. | Not studied. |
| 2010 | Trueman et al. [6] | United Kingdom | Unused medications returned to 114 pharmacies (51 from London/urban, 32 from North-West/rural and urban, 24 from Yorkshire and Humber/rural and urban, 7 from West-Midlands/rural) from 5 primary care trusts. | Unused medicine were returned to 114 pharmacies in 5 primary care trusts. | In total, 8626 items were reported as returned with 7500 of the returned items identified and coded for analysis. | Not studied. |
| 2008 | Coma et al. [56] | Spain; Barcelona | Unused medications returned to random sample of 118 community pharmacies in Barcelona invited to participate, 38 (32%) agreed to participate. Data were collected from February to April 2005. Questionnaires were completed by the returners. | Unused medications were collected from 38 community pharmacies over a period of 7 consecutive working days (excluding Sundays). A questionnaire was designed to evaluate each returned medicine. | In total, 1176 packages were returned by 227 patients. The majority were medicines (96.6%), and the rest were medical supplies or devices (0.5%) or other products sold in the community pharmacy (2.9%; e.g., personal care, nutrition). Most medicines returned were drugs for human use (99.8%) and only 0.2% were for veterinary use. | 54.6% women, 64 ± 20 years old. |
| 2015 | Law et al. [46] | U.S.A.; Southern California | Cross-sectional, observational two phases study was conducted using a convenience sample in Southern California. In Phase I, a web-based survey was conducted at one health sciences institution; and in Phase II, a paper-based survey at drug take back events. | Web and paper-based survey. | Phase I: A total of 539 prescription medications were reported, with an average of 4 per household. Approximately 7% of the unused medications were expired, and 30% were brand name. Phase II: Of the 776 unused medications returned for disposal, 311 (40%) medications were brand name. Nearly two-thirds (66.2%) were expired, discontinued by the physician (25%), or became unused after the patient indicated feeling better (17.6%). | Phase I: Average household age was 36.4 years, but not described in Phase II which the drug take back program. |
| 2004 | Garey et al. [25] | U.S.A.; Houston, Texas | Unused medications returned to community pharmacy during “Medicine Cabinet Clean up Campaign” over 6 months between April and September 2002 (pilot study). | “Medicine Cabinet Clean up Campaign” | In total, 1315 medication containers were returned to the community pharmacy. 63% of returned medications were dispensed between 2000 and 2002, 31% from 1995 to 1999, and 6% before 1995. | Not studied. |
| 2015 | Maeng et al. [34] | U.S.A.; Regional health plan in Central Pennsylvania | Telephone survey conducted by a survey research centre. | Telephone survey. | Not studied. | Not studied. |
| 2014 | Vogler et al. [66] | Austria; Vienna | Unused medications collected from household garbage in all districts of Vienna between 12 October and 24 November 2009. | Unused medicines ending up in household garbage were analysed in all districts of Vienna. | In total, 152 packs were identified from manually investigated sample from household garbage in Vienna. | Not studied. |
| 2013 | Chien et al. [71] | Taiwan; Shuang-Ho university teaching hospital | Discarded drugs were collected from the Drug Discarding Bin at the Shuang-Ho Hospital over 4 weeks. | Discarded drugs from the Drug Discarding Bin at the Shuang-Ho Hospital in Taiwan were collected and analysed. A paper-based questionnaire was utilised to study the attitudes and perspectives of the out-patients and/or patients’ family members about discarding unused medications that were prescribed and covered by the National Health Insurance policy. | A total of 98 kg (51,972) discarded medications collected from the hospital Drug Discarding Bin. | Not studied. |
| 2013 | Abushanab et al. [48] | Jordan; Amman | Cross sectional survey using a pre-piloted questionnaire was used in the interview of 219 households in 9 areas of Amman to about the types of drugs stored at home conducted between November 2009 and April 2010. | Survey study. | From the 2393 drug products presented in surveyed households, 24.99% was considered as drug waste (drug wastage, calculated as the sum of drug products that had expired 10.91%, had no clear expiration date 1.84%, or which had never been used since dispensing 15.04%). | Age of the interviewee (years) 42.15 ± 14.67. |
| 2012 | Al-Azzam et al. [47] | Jordan; North of Jordan particularly Irbid | Validated questionnaire was administered to 435 households selected randomly from different areas in the north of Jordan (particularly in Irbid governorate) in the period from April 2007 and until August 2007. | Survey study. | Of the total of 2835 medication items found in the 435 selected houses, 65.3% were in use, and 34.7% were not in use. | Age of the interviewee (years) 36.4 (±11.9). |
| 2002 | Abou-Auda [27] | 5 regions in Saudi Arabia and other Gulf countries (Kuwait, U.A.E., Qatar, and Oman) | A questionnaire was administered to a total of 1641 households participated in the study (1554 in Saudi Arabia; 87 in other countries). | Survey study. | A total of 12,463 drug products were found in 1554 households in Saudi Arabia. Among the 87 households surveyed in the 4 other Gulf countries, 616 drug products were found. | Not studied. |
| 2011 | Kheir et al. [51] | Qatar | This was a cross-sectional, exploratory, descriptive study. Households included in the study were identified using a list of home telephone numbers was selected randomly from the telephone directory maintained by Qtel®, Qatar’s national telephone company. | Survey study. | Four hundred and thirty-two phone calls were made to invite respondents to take part in the study. Eighty-one household representatives initially expressed interest in being part of the research during the first call, of whom 49 participants (18% of the targeted sample size) answered all survey questions. | Not reported. |
| 2007 | Al-Siyabi et al. [60] | Oman; Sultan Qaboos University Hospital (SQUH) | Observational study of returned unused medicines to the pharmacy at SQUH between February and June 2003. | Returned medicines received by pharmacy staff were analysed in the study. | A total of 1171 items (medications) were returned to the pharmacy at SQUH; among these, 99 drugs were excluded. Medicines were included only if they had SQUH patients’ labels, and any items without SQUH patient’ labels were excluded from study. | Not studied. |
| 2004 | Wongpoowarak et al. [20] | Thailand; Songkhla | A cross-sectional survey of unused medicines of a random sample of 931 households in the Songkhla. Of the 931 households surveyed and interviewed by using a structured questionnaire, there were 453 (48.7%) where at least one person reported having unused medications. | Survey study. | A total of 1004 unused medication (items) were identified from 523 respondents who had unused medications in 453 households. Nine items could not be identified because their physical appearance did not match that of any known medication. Thus, 995 items were included. | Gender: Male: 224 (42.8%). Female: 299 (57.2%). Age: 0–9 years: 167 (31.9%). 10–19 years: 52 (10.0%). 20–29 years: 66 (12.6%). 30–39 years: 76 (14.5%). 40–49 years: 64 (12.2%). 50–59 years: 40 (7.7%). ≥60 years: 58 (11.1%). |
| 2013 | Sooksriwong et al. [50] | Thailand; 4 regions of Thailand: Bangkok, Chiang Mai, Khon Kaen, Mahasarakham and Songkla | Structured questionnaire developed to survey 357 households which were interviewed and during January and March 2011: 46% in Bangkok and 54% in upcountry. | Survey study. | 2208 drug items were found in 357 households. 952 items (43%) of these drug items were dispensed by public hospitals, 750 items (34%) were from drug stores, 163 items (8%) were from private hospitals and 210 items (10%) were from others. | Not studied. |
| 2011 | El-Hamamsy [26] | Egypt; Cairo | Pilot study where all drugs returned unused to 20 community pharmacies in Cairo over period of one month (April 2009). | All drugs returned unused to 20 community pharmacies located in Cairo, Egypt were documented during April 2009. A total of 316 patients completed a survey about medication disposal practices. | A total of 541 drugs were returned and collected over one month. | Not studied. |
| 2012 | Ibrahim et al. [49] | Egypt; Alexandria | A cross-sectional descriptive study where all drugs returned unused into randomly selected 60 pharmacies in Alexandria over a period of one month during March 2011. | Survey study. | A total of 657 drugs were returned from 600 patients to the 60 pharmacies over one month. | Males constituted the higher percentage of the participants 56.7%. Elderly having 60 years or above constituted the highest proportion of the sample (28.3%), while the lowest percentage (4.0%) was within the age group (10 to less than 20). |
| 2010 | Guirguis et al. [32] | Australia; St Vincent’s Hospital, Melbourne | Retrospective audit looked at all expired medications or those no longer needed were collected at St Vincent’s Hospital, Melbourne over 2 months (July and August 2008). | Retrospective audit looked at all the items collected over a period of 2 months: July and August 2008. | A total of 293 items were collected from 40 patients recruited over 2 months. | Older than 65 years of age. |
| 2014 | Kagashe et al. [57] | Tanzania; tertiary hospital in Dar ES-Salaam city | Cross-sectional study carried out at a tertiary hospital in Dar es Salaam city Tanzania where patient files were analysed for last admission treatment information for the year 2012. | Survey study. | About 56.3% of medicines prescribed were dispensed to patients. Out of the total 1418 dispensed drugs, 730 medicines were wasted. | The mean age of the study population was 44 years, with minimum age of 11 years and maximum of 88 years. Medicines wastage was reported from female more than in male (404 (55.7%) vs. 326 (47.1%), respectively). |
| 2007 | Abahussain et al. [33] | Kuwait; Kuwait city | Municipal collection program of unwanted medicines from households in Kuwait City. | Take back collection program. | Sample of 200 households in Kuwait received an educational letter and special plastic bags in which to place unwanted medicines to be collected by the municipality. A second convenience sample of an additional 14 households in Kuwait received the same educational letter together with a face-to-face interview and assistance in collecting unwanted medicines. | Not studied. |
| 2013 | Aditya [43] | India; dental hospital in North India | Descriptive cross-sectional survey of dental students based on a structured questionnaire format) was carried out in a teaching dental hospital in North India. | Survey study. | 244 students, with 8 students were excluded due to incomplete forms only 236 were included. | Age of participants from 20 to 40 years. |
| 2011 | Gupta et al. [42] | India; Greater Noida City | A simple randomised prospective survey study that was carried out for a period of six months in selected areas of Greater Noida City. Randomly selected 102 houses were visited to educate and assess the people about Home Medicine Cabinet. | Survey study. | A total of 392 people were surveyed in 92 houses with the exception of 10 houses. | Of the total 392 people surveyed: The male vs. female for those with age >12 years is 144 (36.73%) vs.133 (33.93%), respectively. The male vs. female for those with age <12 years is 69 (17.6%) vs. 46 (11.74%), respectively. |
| 2014 | Mirza and Ganguly [44] | Anand district of Gujarat, India | A cross-sectional study was conducted during 2012–2014. Data were collected from 800 houses, 400 each from urban and rural areas and then analysed for the details of medicines available in the house. | Survey study. | A total of 800 houses, 400 each from urban and rural areas, were included for the study, which was based on the prevalence of self-medication as per a previous study done in India. | The participants above the age of 18 years, capable of giving information of medicine use within the family (the heads of the households or their spouses or any adult capable of delivering required information) were interviewed for the study. The presence of any healthcare professional amongst the family members in a visited house was excluded in order to avoid biased answers. |
| 2009 | Ali et al. [24] | Malaysia; Universiti Sains | A prospective descriptive, cross-sectional survey was conducted from February to June 2005 in the Universiti Sains, Malaysia. | Survey study. | A total of 481 single female respondents were targeted for a questionnaire-based survey on randomly sampled students. A total of 1724 different types of medicines were found with an average number of 4 medicines found per student. | Respondent were only females ages varied from 19 to 54 years old. 89.2% (n = 429) of the students were categorised in the 19–24 years age category, while 8.7% (n = 42) were aged between 25 and 30 years old. The remaining 2.1% (n = 10) were aged between 31 and 54 years. |
| 2020 | Hassali and Shakeel [45] | Selangor, Malaysia | The quantitative, cross-sectional study was conducted by face-to-face interviews using a pre-validated structured survey form in Selangor, Malaysia from September to December 2019. | Survey study. | Among the approached 600 individuals, 426 showed their willingness to participate in the study. Hence, the response rate of the present study was 71%. | A large proportion of the respondents (269; 63.1%) were females. Most of the respondents were Malay (378; 88.7%), followed by Chinese (32; 7.5%). The study population included students, private and public sector employees, and housewives, who were over 18 years of age. More than half of the respondents were bachelor’s degree holders (220; 51.6%). |
| 2014 | Aboagye et al. [59] | Ghana | The study was conducted over selected areas in Ghana with a questionnaires were randomly issued out from 13 to 20 December 2009. | Survey study. | Out of the 200 questionnaires sent out, 180 were retrieved and analysed. | The majority of the respondents 62.8% (113/180) were between the ages of 21 and 40 years, and the minority 5.6% (10/180) were above 61years. A total of 99 (55%) of the respondents were males corresponding to 81 (45%) females. |
| 2019 | Huang et al. [52] | China, six provinces in North, Central, and Southern regions of China | A cross-sectional survey of 625 households survey was carried out between March and April 2018 in China. | Survey study. | We randomly sampled 1000 households from the communities according to community population information registration forms. At the end of the period, after removal of incomplete responses, a total of 625 completed and usable questionnaires were received, equating to a response rate of 62.5% (625/1000). | The majority of respondents, 61.9% (387/625) in the households visited were females. A high proportion 60.6% (379/625) of the respondents were employees from different companies. In terms of age groups, 78.4% (490/625) of respondents were less than 30 years old, and 12.0% (75/625) of the respondents were aged between 31 and 45. |
| 2019 | Vella and West [58] | Malta, Maltese village | The study was conducted from 1 April to 31 December 2018 within a community pharmacy in a small Maltese village with 3500 inhabitants. | Survey study. | A total of 411 medications were collected, amounting to a total cost of approximately €2600. | Not reported. |
| 2020 | Insani et al. [54] | Bandung, Indonesia | A descriptive cross-sectional study was conducted in Bandung, Indonesia, from November 2017–January 2018. | Survey study. | A total of 497 respondents completed the questionnaire. | A total of 497 respondents completed the questionnaire of which many were female (n = 366, 73.6%) and aged between 18 and 30 years (n = 424, 85.3%). More than half of them completed secondary education (n = 326, 65.6%) and about one-third (n = 167, 33.6%) were university graduates. A large proportion of respondents were students/university students (n = 342, 69.0%). |
| 2010 | Jassim [53] | Basrah, Iraq | This is a descriptive study involving a questionnaire survey to determine the extent of drug storage and self-medication in 300 household units Basrah, Iraq between 2007 and 2008. | Survey study. | A total of 300 household units in Basrah, Iraq included in this study. A survey was conducted in 300 households in Basrah, southern Iraq to determine the availability, source, and storage conditions of medicinal drugs and the prevalence of self-medication with antimicrobials. | Not reported. |
| 2012 | Auta et al. [55] | Nigeria | A cross-sectional survey of a random sample of 240 undergraduate pharmacy students of the University of Jos, Jos, Nigeria, was carried out. | Survey study. | A total of 240 students were chosen randomly with at least 50 from each professional level/year to participate in the study. A pre-tested, self-administered questionnaire was distributed among participants after explaining the purpose of the study and obtaining oral informed consent. | A total of 188 of the 240 (representing 78.3%) questionnaires administered were completely filled and returned by respondents. The respondents consisted of 55.3% males and 44.7% females with the majority of the respondents between the ages of 21 and 25 years. |
| 2015 | Wondimu et al. (41) | Tigray Region, Northern Ethiopia | A community-based cross-sectional study was conducted in April 2013 in Tigray Region, Ethiopia. | Survey study. | A total of 1034 participants were enrolled in the study. A multi-stage sampling method was employed to select households. | Overall, 1000 (97%) households responded to the interview, among them 504 urban and 496 were rural. The median family size of the households was 5; just above half (52%) of the households had at least five family members. Only 7% of the surveyed households had a health professional as a family member. |
| 2017 | Teni et al. [36] | Gondar town, northwestern Ethiopia | A cross-sectional household survey was conducted from 5 April to 6 May 2015. In the study, 809 households were surveyed from four sub-cities selected through multi-stage sampling with 771 included in the final analysis. | Survey study. | In the study, 809 households were surveyed from four sub-cities selected through multi-stage sampling with 771 included in the final analysis. | Of the participants of the study that represented their respective households, upwards of three quarters (76.3%) and two-fifths (40.9%) were female and those in the age group of 18 to 29 years, respectively. Nearly three-fourths (73.3%) followed Orthodox Christianity, and almost all (90.3) were Amhara in their ethnic identity. |
| 2019 | Ebrahim et al. [37] | Awi zone, Amhara regional state, Ethiopia | A facility-based cross-sectional study design supplemented by a qualitative approach was conducted from 23 April to 22 May 2018. | Survey study. | A total of 4 health facilities were included in the study. During the 1 month of the study period, 56 types of medications were found unused at the health facilities. | Three of the heads were male and one was a female. All of them were BSc nurses with a work experience of a minimum of 4.6 and a maximum of 8 years. All the pharmacy heads were male and degree holders with a minimum experience of 4 years and maximum experience of 8 years. A total of 3 store women and 1 store man were interviewed. All the store men/women were diploma holders with a work experience of a minimum of 4 years and a maximum of 8 years. |
| 2020 | Gudeta and Assefa [39] | Jimma city, Ethiopia | A facility-based descriptive cross-sectional study was conducted among private practitioners in retail outlets of Jimma city from 20 November to 19 December 2018. | Survey study. | All drug shops, 35 (62.5%) and pharmacies, 21 (37.5%) in Jimma city, were visited, 3 of which were used for pre-testing. A total of 106 questionnaires were distributed to practitioners in 53 retail outlets, of which 87 returned the completed questionnaires, making a response rate of 82.1%. | The majority of the practitioners, 44 (50.6%) were within the age range of 25 to 31 years. More than half, 56 (64.4%) of them were males. Regarding their profession, the majority of them were pharmacy professionals, 73 (83.9%). |
| 2020 | Kahsay et al. [40] | Adigrat city, Ethiopia | A cross-sectional study was conducted using semistructured questionnaires, which focussed on knowledge, attitudes, and disposal practices for unused and expired medications were used to collect data from respondents. | Survey study. | The study was conducted among 359 respondents from the residents of Adigrat city, Ethiopia. All of the 359 returned questionnaires were valid for data entry and analysis. | All the approached 359 individuals agreed to participate in the study. Of the 359 respondents, 207 (57.7%) were males. The majority (137; 38.2%) of the respondents were 32 years old and above. Concerning their educational level, one hundred and twelve (31.2%) respondents completed secondary education, 178 (49.6%) had a college/university degree and above, and 31 (8.6%) were illiterate. |
| 2020 | Yimenu et al. [38] | Awi zone, Amhara regional state, Northwestern Ethiopia | A community-based cross-sectional study was conducted through interviews with representatives of households. | Survey study. | A total of 23 kebeles (the smallest an administrative unit in Ethiopia) (2 urban and 21 rural kebeles) from four woredas were selected using a multi-stage sampling technique. A total of 507 households were included in the study. | The majority of the study participants, 368 (72.6%), were female. The mean age of the study participants was 40 years, and the majority were between the ages of 30 and 65 (67.9%) |
| Year of Study | Author(s) | Settings/Country | Therapeutic Category of the Unused, Wasted Medicine | Dosage Form | Study Limitation |
|---|---|---|---|---|---|
| 2015 | Gracia-Vásquez et al. [61] | Mexico; nine cities of Monterrey | The most commonly returned medications were of nonsteroidal anti-inflammatory followed by cardiovascular drugs. Nonsteroidal anti-inflammatory drugs: 16.11%. Cardiovascular drugs: 14.21% (Anti-hypertensive 55%). Gastrointestinal drugs 11.43%. Antibacterial drugs: 10.05%. Respiratory system drugs: 8.75%. Neurological drugs: 6.13% (anti-depressant: 34%). Dietary supplement: 5.23%. Anti-diabetic drugs: 4.34%. Miscellaneous drugs: 3.79%. Hypolipemic drugs: 3.67%. Anti-parasitic drugs: 2.48%. Hormonal drugs: 1.89%. Anti-micotic drugs: 1.84%. Steroidal anti-inflammatory drugs: 1.72%. Dermatological drugs: 1.71%. Ophthalmic drugs: 1.64%. Anti-viral drugs: 1.53%. | The majority of unused/expired medications collected (73%) was in solid dosage form (tablets, capsules, granules, powders, and lozenges). 20% were liquid pharmaceutical forms (syrups, injections, eye drops, suspensions, emulsions, and lotions). 6% were semisolid (ointments, creams, gel, paste, and suppositories). 1% were other forms, such as metered dose inhalers, sprays, patches, strips, and chewing gums. | Unable to describe respondent demographic information. |
| 2008 | Braund et al. [21] | New Zealand | The most commonly returned medications were of the nervous system drugs, followed by alimentary tract and metabolism. Nervous system drugs: 17%. Alimentary tract and metabolism system drugs: 14%. Cardiovascular system drugs: 12%. Respiratory system and allergies: 11%. Musculoskeletal system drugs: 11%. Infections—agents for systemic use: 9%. Blood and blood-forming organs: 8%. Oncology agents and immunosuppressants: 6%. Genitourinary system: 5%. Dermatologicals: 3%. Sensory organs: 2%. Hormone preparations—systemic: 2%. | Only oral dosage form reported. | Small number of returned unused medication. |
| 2007 | Braund et al. [67] | New Zealand; Otago Pharmacies | The returned medications were not classified by therapeutic group, but by generic name. The most commonly returned tablet was paracetamol (9% of all tablets returned). The most commonly returned capsule was omeprazole 20 mg (8% of capsules); additionally, omeprazole 40 mg accounted for a further 5% of all capsules. | There were 65,907 tablets returned and 7599 capsules returned. Others include injections, inhalers, eye drops, creams, gels, ointment, test strips, liquids, and suppositories. | Unable to describe respondent demographic information. Unable to report unused medicines as therapeutic group. |
| 2009 | Braund et al. [31] | New Zealand; Hutt Valley District Health Board | The predominant therapeutic group was drugs affecting the nervous system, but individually, diclofenac sodium and ibuprofen were the most returned medications, respectively. Nervous system drugs: 19%. Alimentary tract and metabolism: 13%. Cardiovascular system: 12%. Musculoskeletal system: 11%. Respiratory system and allergies, and miscellaneous: 8%. Blood and blood-forming organs: 7%, Dermatological and anti-infective: 7%. Genitourinary: 3%, Hormones: 3%. | Oral solid forms (tablets and capsules) were counted. Liquid medications were quantified by the amount left in the original container, semisolid preparations were estimated as a proportion of original container. Inhalers were recorded as either full, half-full, or empty. Anything almost empty was excluded from the analysis. | The chosen sample of the total returned unused medicine was around 20%, which maybe not representative of the whole sample. |
| 2010 | Caroline et al. [29] | New Zealand; Nelson Bays region | The most common returned (top 20) by quantities (individual unit) were (n = 435,397): Salazopyrin: 94,271 tablets. Paracetamol: 23,251 tablets. Lactulose: 11,324 mL. Aspirin: 10,047 tablets. Simvastatin: 7380 tablets. Diclofenac: 7014 (mixed preparation). Prednisolone: 7004 tablets. Metoprolol: 6627 tablets. Warfarin: 6590 tablets. Furosemide: 6117 tablets. Lemnis fatty cream: 6095g. Cilazapril: 5687 tablets. (Paracetamol and codeine) preparation: 5003 tablets. Ibuprofen: 4873 tablets. Codeine: 4794 tablets. Laxsol: 4267 tablets. Morphine: 4107 (mixed preparations). Emulsifying ointment: 4030 g. Quinapril: 3890 tablets. | Oral solid forms (tablets and capsules) with tablets as the most common returned dosage form. Oral liquid forms. Cream and ointment. | Unable to describe respondent demographic information. |
| 2009 | James et al. [65] | New Zealand: Taranaki region (around 37,000 households) | The predominant therapeutic group was drugs affecting the nervous system, but individually, paracetamol (acetaminophen) was the most returned medication respectively. Nervous system drugs (n = 658, 24.3%). Cardiovascular system (n = 559, 20.7%). Alimentary tract and metabolism (n = 529, 19.6%). Blood and blood-forming organs (n = 283, 10.5%). Respiratory system and allergies (n = 190, 7.1%). | Not studied. | Unable to describe respondent demographic information. In addition, due the different policies for collection and disposal of medicines, the majority of unused medicines were disposed into landfills and water system, which may mean that the returned amount may be underestimate of the extent of unused medicines. |
| 2005 | Langley et al. [62] | United Kingdom; East Birmingham | The predominant therapeutic group was drugs affecting cardiovascular system. Cardiovascular system drugs: 28.5%. Central nervous system drugs: 18.8%. Respiratory system drugs: 14.7%. Gastrointestinal drugs: 10.6%. Endocrine system drugs: 5.6%. Musculoskeletal and joint disease drugs: 5%. Anti-infective Drugs: 4.7%. Eye Drugs: 3.5%. Nutrition and blood drugs: 2.1%. Skin drugs: 1.8%. Obstetrics, gynaecology, and urinary tract disorders: 1.5%. Nutrition and blood and unknown: 1.2%. Malignant disease and immunosuppression: 0.9%. | Tablet or capsule, oral liquid, cream or ointment, and inhalers. | Sample size and the number of returns are small, which makes it difficult to extrapolate the result to the whole United Kingdom. |
| 2007 | Mackridge et al. [63] | United Kingdom; Eastern Birmingham Primary Care Trust (P.C.T.) | The predominant therapeutic groups were drugs affecting cardiovascular system and drugs acting on the central nervous system, respectively. The most commonly returned drugs were aspirin (102 items), co-codamol (98 items), salbutamol (96 items), furosemide (90 items), and glyceryl trinitrate (78 items). Drugs affecting cardiovascular system (1003 items, 26.6%). Drugs acting on the central nervous system (884 items, 23.5%). Drugs affecting respiratory system (358 items, 9.5%) and gastrointestinal system (358 items, 9.5%). Drugs affecting endocrine system (257 items, 6.8%). Drugs treating musculoskeletal and joint diseases (235 items, 6.2%). Anti-infective drugs (165 items, 4.4%). Drugs for skin (124 items, 3.3%). Drugs for nutrition and blood (116 items, 3.1%). Drugs for eye (65 items, 1.7%). Obstetrics, gynaecology, and urinary tract disorders (59 items, 1.6%). Drugs for ear, nose, and oropharynx (58 items, 1.5%) and others (58 items, 1.5%). Drugs for malignant disease and immunosuppression 20 items, 0.5%). Drugs for anaesthesia (5 items, 0.1%). | Tablet or capsule, oral liquid, cream or ointment, and inhalers. | The author reported that this study did not attempt to estimate the quantities of unused medicines at patient’s home; as a result, it is more likely that the unused medicines from primary care was underestimated. |
| 2008 | Bradley [64] | United Kingdom; Cumbria | The greatest value of returned of medicines was from cardiovascular and central nervous system categories (BNF), total number of returns (n = 4562): Cardiovascular (n = 1232). Central nervous system (n = 1149). Gastrointestinal system (n = 468) Endocrine (n = 334). Respiratory (n = 307). Anti-infective (n = 250). Musculoskeletal and joint (n = 228). Nutrition and blood (n = 141). Skin (n = 134). Others (n = 319) | Not studied. | It is an audit report with a result from Cumbria/northwest of England, which may not representative of the whole United Kingdom and may underestimate the extent of unused medicines. |
| 2010 | Trueman et al. [6] | United Kingdom | Coding was based on guidance provided by the Royal Pharmaceutical Society of Great Britain/BNF. The most common retuned medication was for the cardiovascular and central nervous system. Cardiovascular system drugs (1950 items, 22.6%). Central nervous system drugs (1907 items, 22.11%). Gastrointestinal system drugs (828 items, 9.6%). Respiratory system drugs (528 items, 6.12%). Endocrine system drugs (518 items, 6.01%). Endocrine system drugs (518 items, 6.01%). Anti-infective drugs (444 items, 5.15%). Musculoskeletal, joint disease drugs (364 items, 4.22%). Nutrition and blood drugs (249 items, 2.89%). Skin drugs (192 items, 2.23%). Eye drugs (129 items, 1.5%). Ear, nose, oropharynx drugs (68 items, 0.79%). Malignant disease and immunosuppression drugs (53 items, 0.61%). Wound management drugs (34 items, 0.39%). Borderline substances (25 items, 0.29%). Drugs for Anaesthesia (9 items, 0.10%). | Not studied. | Unable to describe respondent demographic information. |
| 2008 | Coma et al. [56] | Spain; Barcelona | The predominant therapeutic groups were drugs affecting the alimentary tract and metabolism, nervous system, and cardiovascular system, respectively. All drugs were categorised according to Anatomical Therapeutic Chemical (A.T.C.) system/code of the World Health Organisation (WHO). Alimentary tract and metabolism drugs (215 items, 18.3%). Nervous system drugs (214 items, 18.2%). Cardiovascular drugs (137 items, 11.6%). Respiratory system drugs (103 items, 8.8%). Musculoskeletal system drugs (88 items, 7.5%). Dermatological drugs (85 items, 7.2%). Anti-infective drugs (77 items, 6.5%). Missing drugs (could not be coded according to the A.T.C. system), (66 items, 5.6%). Sensory organs drugs (63 items, 5.4%). Drugs affecting genitourinary system and sex hormones (50 items, 4.3%). Drugs affecting blood and blood-forming organs (32 items, 2.7%). Antineoplastic and immune-modulating drugs (22 items 1.9%). Systemic hormonal preparations excluding sex hormones and insulins, (17 items, 1.4%). Various drugs (5 items, 0.4%). Anti-parasitic products, insecticides, and repellents (2 items, 0.2%). | Not studied. | Unable to describe the respondent demographic information clearly. |
| 2015 | Law et al. [46] | U.S.A.; Southern California | Approximately 2 of 3 prescription medications were reported unused. In Phase I, pain medications (23.3%) and antibiotics (18%) were most commonly reported as unused. In Phase II, 17% of medications for chronic conditions (hypertension, diabetes, cholesterol, heart disease) and 8.3% for mental health problems (antidepressants/antipsychotic/anti-convulsant) were commonly reported as unused. 7% painkillers and 4% electrolytes and dietary supplements. | Tablets, pills, capsules, and liquid preparations. | Use of a web-based survey may limit the accessibility of this study to people without computer and Internet access at home, which may to some extent underestimate the extent of unused medicines. Unable to describe respondent demographic information. |
| 2004 | Garey et al. [25] | U.S.A.; Houston, Texas | The predominant therapeutic group was nonsteroidal anti-inflammatory drugs/pain. Nonsteroidal anti-inflammatory drugs/pain 25%. Drugs for cough/cold/allergy 15%. Anti-infective drugs 11%. Cardiovascular drugs 10%. Respiratory drugs 9%. Neurological drugs 8%. Dermatological 7% and gastrointestinal 7%. | Oral medications (capsules or tablets) were most commonly returned (64%), followed by liquid (12%), creams (11%), inhalers (7%), or miscellaneous (6%; e.g., eye glasses, hearing aid batteries, medical equipment). Approximately 17,000 oral pills were collected during the study period. | Unable to describe respondent demographic information. |
| 2016 | Maeng et al. [34] | U.S.A.; Regional health plan in Central Pennsylvania | The predominant therapeutic group was pain medication (15%), hypertension (14%), antibiotics (11%), and psychiatric disorders (9%). | Not studied. | Unable to describe respondent demographic information. |
| 2014 | Vogler et al. [66] | Austria; Vienna | The predominant therapeutic group was cardiovascular drugs. Cardiovascular drugs (36 packs, 23.7%). Musculoskeletal system drugs (17 packs, 11.2%). Nervous system drugs (16 packs, 10.5%) Alimentary tract and metabolism 15 packs, 9.9%). Anti-infective drugs for systemic use (5 packs, 3.3%). Drugs for blood and blood-forming organs (4 packs, 2.6%). Genitourinary system drugs and sex hormone (2 packs, 1.3%) and Dermatological drugs (2 packs, 1.3%). Other A.T.C. code or not attributable (45 packs, 29.6%). | Oral medications were the most commonly founded 86.8% (usually solid oral), followed by dermal 6.7%, parental 4%, nasal 0.7%, pulmonary 0.7%, eye 0.7%, and dental 0.7%. | Unable to describe respondent demographic information. |
| 2013 | Chien et al. [71] | Taiwan; Shuang-Ho university teaching hospital | Among the discarded medications, gastrointestinal drugs were at the top of the list of all discarded medications. The analysis of discarded and unused drugs revealed that Strocain (oxethazaine, polymigel) was on top of the list, followed by Glucobay (acarbose), Mopride (mosapride), and Loditon (metformin). Gastrointestinal drugs: 25.93%. Cardiovascular drugs: 22.49%. Anti-inflammatory drugs: 12.15%. Anti-diabetic drugs: 9.49%. Cold medicines: 6.83%. Psychiatric drugs: 5.44%. Respiratory drugs: 2.16%. Rheumatological drugs: 1.52%. Antimicrobial drugs: 1.42%. Others: 9.19%. Health foods: 3.38%. | Tablets, bottles, and tubes. | Unable to describe respondent demographic information. |
| 2013 | Abushanab et al. [48] | Jordan; Amman | Alimentary tract and metabolism drugs were the most commonly found in household (both used and unused). Stored drug products were classified by A.T.C. code of WHO. Alimentary tract and metabolism: 519 (20.7%). Nervous system: 370 (17.3%). Musculoskeletal system: 313 (12.9%). Respiratory system: 291 (12%). Cardiovascular system: 256 (10.9%). Anti-infective for systemic use: 252 (10.6%). Dermatological: 149 (5.4%). Blood and blood-forming organs: 109 (4.6%). Genitourinary system and sex hormones: 31 (1.1%). Systemic hormonal preparations, excl. sex hormones and insulin: 18 (1.1%). Anti-parasitic products, insecticides and repellents: 13 (0.7%). Anti-neoplastic and immune-modulating agents 8 (0.3%), sensory organs 63 (2.5%). | Not studied. | Studied the medication stored at home the estimated the unused wasted medicine as the sum of drug products that had expired, had no clear expiration date, or which had never been used since dispensing. So not directly investigate the unused wasted medicine. |
| 2012 | Al-Azzam et al. [47] | Jordan; North of Jordan particularly Irbid | Central nervous system drugs were found to be the most common, followed by anti-infective agents. The most common individual medications found were amoxicillin, paracetamol, metronidazole, antihistamines, hypoglycaemic medications, and adult cold medications. Central nervous system drugs (713 items, 25.2%). Anti-infective agents (493 items, 17.4%). Musculoskeletal agents (381 items, 13.4%) Respiratory system agents (348 items, 12.3%) Gastrointestinal agents (301 items, 10.6%) Cardiovascular agents (216 items, 7.6%) Endocrine system agents (200 items, 7.0%) Nutrition agents (127 items, 4.5%). Eye, ear, nose and skin agents (56 items, 2.0%). | Tablets (1794 items, 63.3%) Capsules (332 items, 11.7%) Syrups (250 items, 8.8%) Suspensions (201, 7.1%) Suppositories (117 items, 4.1%) Creams/ointments/gels (43 items, 1.5%) All forms of injections (53 items, 1.9%) Drops/nasal or oral puff (45 items, 1.6%). | A sample was selected from northern Jordan, which may not representative of the whole of Jordan. |
| 2002 | Abou-Auda [27] | 5 regions in Saudi Arabia and other Gulf countries (Kuwait, U.A.E., Qatar, and Oman) | Medications were also categorised according to their pharmacologic or therapeutic class using the classification of drugs adopted in the Saudi National Formulary (SNF). Respiratory system drugs Saudi Arabia: 2095 (16.8%), other gulf countries: 94 (15.3%). Central nervous system drugs Saudi Arabia: 2050 (16.4%), other gulf countries: 84 (13.6%). Antibiotics Saudi Arabia: 1779 (14.3%), other gulf countries: 111 (18.0%). Gastrointestinal drugs Saudi Arabia: 1382 (11.1%), other gulf countries: 60 (9.7%). Miscellaneous Saudi Arabia: 847 (6.8%), other gulf countries: 57 (9.3%). Nutrition and blood drugs Saudi Arabia: 823 (6.6%), other gulf countries: 24 (3.9%). Musculoskeletal/joints drugs Saudi Arabia: 790 (6.3%), other gulf countries: 52 (8.4%). Skin drugs Saudi Arabia: 735 (5.9%), other gulf countries: 33 (5.4%). Ear, nose, and throat drugs Saudi Arabia: 553 (4.4%), other gulf countries: 26 (4.2%). Cardiovascular drugs Saudi Arabia: 465 (3.7%), other gulf countries: 60 (9.7%). Eye drugs Saudi Arabia: 398 (3.2%), other gulf countries: 25 (4.1%). Endocrine drugs Saudi Arabia: 375 (3.0%), other gulf countries: 16 (2.6%). Obstetric/gynaecologic and/or urinary drugs Saudi Arabia: 140 (1.1%), other gulf countries: 12 (1.9%). Cytotoxic drugs Saudi Arabia: 31 (0.2%), other gulf countries: 0 (0.0%). Total drugs Saudi Arabia: 12,463 (100%), other gulf countries: 616 (100%). The mean medication wastage was estimated to be 25.8% Saudi Arabia and 41.3% other gulf countries. | Not studied. | Unable to describe respondent demographic information. |
| 2011 | Kheir et al. [51] | Qatar | The majority of the drugs stored (n = 58; 21%) in the participating homes were analgesics. Nonsteroidal anti-inflammatory drugs were the second most commonly stored drugs, representing 16% of all the drugs. | Not reported. | There was potential for selection and social desirability bias as a result of the strategy of using the telephone to conduct an interview. In addition, interviews were conducted during working hours, which could run the risk of excluding highly educated young subjects. Due to the small sample size, the results of this exploratory study should be considered with caution. |
| 2007 | Al-Siyabi et al. [60] | Oman; Sultan Qaboos University Hospital (SQUH) | Cardiovascular drugs were the most common pharmacological group of returned drugs. The drugs were classified according to the classification index of the British National Formulary. Cardiovascular drugs: 24%. Central nervous system drugs: 14%. Anti-infective drugs: 13%. Endocrine drugs: 10%. Nutrition: 9%. Gastrointestinal drugs: 8%, and Musculoskeletal system drugs: 8%. Respiratory system drugs: 5%. Immunosuppressant drugs: 3%. Eye/Ear drugs: 2%. | Not studied. | Unable to describe respondent demographic information. As it included only medicines with SQUH labels, others were missed, and this may underestimate the extent of unused medicines. |
| 2004 | Wongpoowarak et al. [20] | Thailand; Songkhla | Musculoskeletal system drugs were the most common pharmacological group of returned drugs. The medications were pharmacologically classified using MIMS Thailand, which is a standard reference source. Musculoskeletal system drugs (229 items, 23.3%). Anti-infective drugs (189 items, 19.2%). Respiratory system drugs (166 items, 16.9%). Gastrointestinal system drugs (129 items, 13.1%). Allergy and immune system drugs (91 items, 9.2%). Vitamins and minerals (68 items, 6.9%). Others (54 items, 5.5%). Central nervous system (37 items, 3.8%). Cardiovascular (21 items, 2.1%). | Oral dosage forms compromised 95.6% (951 items). Oral tablets or capsules (636 items, 63.9%). Oral liquids (311 items, 31.3%). Eye drops (23 items, 2.3%). Topical liquids (14 items, 1.4%). Creams (5 items, 0.5%). Oral powders (4 items, 0.4%). Inhalers (2 items, 0.2%). | This study was a snapshot study, as the studied population was one of 14 provinces in southern Thailand. |
| 2013 | Sooksriwong et al. [50] | Thailand; 4 regions of Thailand: Bangkok, Chiang Mai, Khon Kaen, Mahasarakham and Songkla | A total of 2208 drug items found in household surveys were classified into 5 groups of the mostly found drugs. These were 343 non-opioid analgesics and antipyretic drugs, 188 antacids, anti-reflux agents and anti-ulcer, 180 nonsteroidal anti-inflammatory drugs (NSAIDs), 127 antihistamine and anti-allergic and 119 anti-diabetic drugs. Top 5 of the most found rarely or unused drugs, classified as leftover medicines, were NSAIDs (49 items), penicillin (38 items), G.I.T. regulators, and antiflatulents (36 items). Of the total of 2208 drug items found in household, 82 items (3.7%) and 45 items (2.0%) of drugs were already expired and deteriorated, respectively. | Not studied. | Unable to describe respondent demographic information. |
| 2011 | El-Hamamsy A [26] | Egypt; Cairo | The returned medications were classified according to the British National Formulary (BNF). Antibiotics were the most common pharmacological group of returned medications. Antibiotics (109 items, 20.15%). Gastrointestinal system drugs (88 items, 16.27%). Cardiovascular system drugs (58 items, 10.72%). Respiratory system drugs (44 items, 8.13%). Nervous system drugs (39 items, 7.20%). Analgesics and anti-inflammatory (38 items, 7.02%). Dermatological drugs (35 items, 6.47%). Blood and blood-forming organs (29 items, 5.36%). Systemic hormonal preparations, sex hormones, and insulin’s (27 items, 4.99%). Anti-parasitic products, insecticides, and repellents (25 items, 4.62%). Genitourinary system (20 items, 3.69%). Antineoplastic and immune-modulating agents (3 items, 0.55%). Various others (26 items, 4.80%). | Not studied. | Unable to describe respondent demographic information. |
| 2012 | Ibrahim et al. [49] | Egypt; Alexandria | Cardiovascular system drugs were the most common pharmacological group of returned medications. The returned medications were classified according to the British National Formulary (BNF). Cardiovascular system (127 items, 19.4%). Anti-infective (126 items, 19.2%). Gastrointestinal system (66 items, 10.9%). Nutrition and blood (69 items, 10.6%). Nonsteroidal anti-inflammatory (64 items, 9.8%). Nervous system (61 items, 9.3%). Respiratory system (58 items, 8.9%). Endocrine System (49 items, 7.5%). Skin care (19 items, 2.9%). Ear, nose, throat (7 items, 1.1%) and genitourinary system (7 items, 1.1%). Musculoskeletal system (2 items, 0.3%). | Not studied. | This study did not estimate the quantities of unused medicines in patient’s home. As result, it is likely that it may underestimate the extent of unused medicines in the community. |
| 2010 | Guirguis et al. [32] | Australia; St Vincent’s Hospital, Melbourne | Cardiovascular system drugs were the most common pharmacological group of returned medications. The smallest group was that of topicals, e.g., creams and ointments. Cardiovascular system drugs (78 items, 26.6%). Analgesics/anti-inflammatories (62 items, 21.2%). Neuropsychiatry drugs (8.5%). Respiratory system drugs (8%). Eye/Ear/Nose drugs (7.5%). Gastrointestinal drugs (7%), and Antimicrobials (7%). Herbals and vitamins (12 items, 4.1%). Diabetes drugs (3%). Topicals, e.g., creams and ointments (8 items, 2.7%). Miscellaneous (4.5%). | They report that they collect topicals cream, ointment along with other dosage forms (that was not defined). | Sample size and the number of returns are small, which make it difficult to extrapolate the result to the whole of Australia. |
| 2014 | Kagashe et al. [57] | Tanzania; tertiary hospital in Dar es Salaam city | Medicines wasted in this study were categorised into three major groups, anti-infective, cardiovascular medications, and others. Anti-infective drugs: 18.9%. Cardiovascular drugs: 8.9%. Other drugs: 23.7%. | Oral solids drugs were the most common wasted dosage form 40.6% followed by injections 9.2%, with very few topicals preparations. | Since only hospital-prescribed medicines was included, others may be missed, which may underestimate the extent of unused medicines. |
| 2007 | Abahussain et al. [33] | Kuwait; Kuwait city | No medicines were collected from the 200 households participating in the municipal collection program The second intervention yielded 123 medicines from 14 homes; the most common class of unwanted medicines were drugs for respiratory system. Unwanted medications were classified according to the ATC WHO classification. A third of all unwanted medicines were for the respiratory system (38% of these were cough and cold preparations, 25% nasal preparations). 12% of the medicines were for the musculoskeletal system (53% oral NSAIDs) or were dermatologicals (33% topical antibiotics). | There were 141 items (including duplicates). 508 tablets/capsules, 25 oral liquids, 20 tubes, 21 dropper bottles, and various other dosage forms. | Sample size and the number of returns are small, which make it difficult to extrapolate the result to the whole of Kuwait. Unable to describe respondent demographic information. |
| 2013 | Aditya [43] | India; dental hospital in North India | Qualitative analysis of expired medications at home revealed antipyretics (54%), analgesics (64%), followed by antihistamines (35%) to be hoarded in home pharmacies/medicine chests. Other drugs were antibiotics (26%), antacids (23%), topical drugs (39%) and supplements (vitamins) (41%). Excessive buying of over-the counter (O.T.C.) drugs (53%); self-discontinuation (17%), and expiration of drugs (24%) resulted in possession of unused/leftover medications at home. | Not studied. | Small sample size from a specific region in India, which make it difficult to generalise and extrapolate the results to the whole of India. |
| 2011 | Gupta et al. [42] | India; Greater Noida City | Most of the expired drugs are in the category of analgesics and NSAIDs (23.93%) followed by nutritional supplements (22.56%), antibiotics (14.94%), expectorants and mucolytics (6.77%), bronchodilators (5.31%), and antacids (6.53%). | Oral tablets were the most common; other dosage forms include syrups, capsules, suspensions, powders, eye drops, gels, churna, cream, and ear wax softener. | Defined medicine wastes as only expired medicines, which may underestimate the extent of unused wasted medicines. |
| 2014 | Mirza and Ganguly [44] | Anand district of Gujarat, India | Among the prescribed medicines, the majority of medicines were from cardiovascular disease (19.88%) and from without prescription medicines, nonsteroidal anti-inflammatory drugs (NSAIDs) were the major group available at houses (35.13%). | Not reported. | Since the interviewers were fully aware of the purpose of the project, some information regarding medicines was not shared, which might have led to a skewed result. |
| 2009 | Ali et al. [24] | Malaysia; Universiti Sains | The total number of medicines found unused was 1724 drug products with vitamins and minerals as the most common class of unused drugs. Vitamins and minerals: 427 (24.8%). Gastrointestinal drugs: 298 (17.3%). Analgesic and antipyretics: 293 (17.0%). Antibiotics: 174 (10.0%). Ear, nose, and throat drugs: 159 (9.2%). Respiratory drugs: 106 (6.3%). Dermatological products: 97 (5.6%). Anti-rheumatic and anti-inflammatory: 69 (4.0%). Others (C.N.S. drugs, endocrine and metabolic drugs, cardiovascular drugs, genitourinary drugs, and others): 101 (5.8%). | 68.5% (n = 1181) of the medications were in the form of tablets and pills while capsules constituted 14.6% (n = 252) of the overall amount. 5% (n = 87) syrups and suspensions while 4.9% (n = 84) were creams and ointments. Less than 1.0% (n = 5) consisted of inhalers, with 0.2% (n = 4) suppositories of the overall total. | Sampling of only female students made it impossible to generalise the results to the whole student population in the campus. |
| 2020 | Hassali and Shakeel [45] | Selangor, Malaysia | The major classes of medications that were purchased included antibiotics (207; 48.5%) followed by painkillers/nonsteroidal anti-inflammatory drugs (NSAIDs) (101; 23.7%). In addition, anti-hypertensive 51 (11.9%), anti-diabetic 20 (4.6%), OTC antihistamines 34 (7.9%), and multi-vitamins and other supplements 13 (3.0%). | Not studied. | The sample size of the study was small to depict a clear picture of the entire Selangor population; hence, the findings of the current study are not generalisable to all of Malaysia. |
| 2014 | Aboagye et al. [59] | Ghana | Leftover medicines: Paracetamol tablets 27 Amoxicillin capsules 12 Aspirin tablets 4 Metronidazole tablets 5 F-PAC (Paracetamol/Aspirin/Caffeine) 3 Vitamin B complex tablets 7 Multi-vitamins tablets 7 Diclofenac tablets 3 Magnesium trisilicate tablets 3 Ibuprofen tablets 5 Others/Unidentified 45 Do not remember 1. | Not studied. | Sample size and the number of returns are small which make it difficult to extrapolate the result to the whole of Ghana. Leftover medicines were described as individual medicine, not as a group. |
| 2019 | Huang et al. [52] | Six provinces in North, Central, and Southern regions of China | Cold medication (86.1%) was the most common category of medicines kept in households. Specifically, the following were the major classes of medicines found in the households: gastrointestinal medicines (27.0%), pain medications (22.9%), vitamins (20.6%), antibiotics (19.0%), external painkillers (16.5%), and external anti-inflammatory antidotes (15.4%). | Not studied. | Not reported. |
| 2019 | Vella and West [58] | Maltese village, Malta | The most common class of disposed medications was that pertaining to the alimentary tract (24.6%), closely followed by medicines belonging to the respiratory group (23.8%). 10.5% of the unused disposed medications were from the musculoskeletal group, which includes medications such as nonsteroidal anti-inflammatory drugs (NSAIDs), and supplements, such as glucosamine. The medications with the lowest return rate were anti-neoplastic and immunomodulating agents (0.7%), followed by anti-parasitic medications (0.2%). | Solid dosage forms were counted manually, liquid dosage forms were measured using a calibrated measuring cylinder, dermatological preparations were measured using kitchen weighing scales, and inhalers that had a counter were recorded as per value available on the counter. Unused inhalers without a counter, eye drops, ear drops, nasal drops, and nasal and oral sprays were not quantified as effective entries, as their quantities could not be safely determined. | This study excluded some dosage forms whilst quantifying and costing waste, such as eye drops, inhalers, and nasal sprays. Therefore, the actual cost of waste presented in this study is an underestimate. |
| 2020 | Insani et al. [54] | Bandung, Indonesia | NSAIDs were the most common medicines left unused (n = 372) followed by vitamins and nutritional supplements (n = 215) and antibiotics (n = 171). | Not reported. | This study was conducted in one region in Bandung (small sample size); thus, its generalisation for the Indonesian population is limited. In addition, the predictors associated with disposal practice were not identified. |
| 2010 | Jassim [53] | Basrah, Iraq | Overall, 4279 items of drugs were analysed. Antibiotics were the leading household stored drugs (26.43%), followed by antipyretic/analgesics (19.58%), and NSAIDs (nonsteroidal anti-inflammatory drugs) (11.45%). These drugs constituted (57%) of the total drugs stored. | Not reported. | This study was conducted in 300 households in Basrah, southern Iraq (i.e., one region in Iraq). Small sample size. |
| 2012 | Auta et al. [55] | Nigeria | Common classes of medicines reported as leftover medicines were analgesics (36.4%), antibiotics (33.1%), and antihistamines (11.9%). | Respondents reported having about 318 medicines items (representing 2.56 items per student’s room) in all, with the tablets (62.3%) being the most common dosage form. Followed by capsules (16.4%), lotions/creams (11.6%), and syrups/suspensions (6.3%). | This study was based on the self-reported presence of medicines in respondents’ residence. Therefore, it is possible that the medicines were under-reported or some names of unidentified medicines were wrongly reported. In addition, the sample size was small. |
| 2015 | Wondimu et al. [41] | Tigray Region, Northern Ethiopia | The most common classes of drugs found in the households were analgesics (29%) and antibiotics (25%). Generally, more than half (62%) of the medications were used for ongoing treatment. | Most (70%) of the medicines were available in the form of tablets, followed by capsules (13.2%), oral liquid (9.9%), semisolids (2.8%), injections (1.8%), and other dosage forms (2.2%). | One of the study limitations was the cross-sectional design employed, which might be affected by temporal relationship establishment with some variables and could not provide much more substantial evidence of causality, unlike a longitudinal design. |
| 2017 | Teni et al. [36] | Gondar town, northwestern Ethiopia | Anti-infectives for systemic use (23.9%), medicines for alimentary tract and metabolism (19.2%) and those for the cardiovascular system (17.7%) ranked top. | Of the total 553 medicines stored, more than three quarters (80.8%) were of solid dosage forms. Liquid dosage forms were (16.6%) and semisolids were (2.5%). | The study did not include the rural parts of Gondar Town. The small sample size makes the findings not representative of the pattern of household medicine storage practice in those areas. |
| 2019 | Ebrahim et al. [37] | Awi zone, Amhara regional state, Ethiopia | Anti-infective medications were found to be the most frequently unused medications 63 (36.4%) followed by antipain medications 37 (21.4%) and cardiovascular medications 19 (11%). | Not reported. | Health centres and private health facilities were not included in the study, and thus, the results may have been slightly different if those facilities were included. |
| 2020 | Gudeta and Assefa [39] | Jimma city, Ethiopia | Antibiotics, 31 (35.6%), and anti-hypertensive, 21 (24.1%) constituted the highest proportion of the waste. | Not reported. | The sample size was small. In addition, the current study was conducted among private practitioners. Thus, prospective researchers may consider both private and public professionals for their comparative study. |
| 2020 | Kahsay et al. [40] | Adigrat city, Ethiopia | The common types of medicines kept in households were analgesics (41.5%) and antibiotics (36.7%). In addition, antipain and antibiotic (4.8%), anti-diabetic (5.3%), and anti-hypertensive (8%) medicines were other types of unused medications found in homes. | Not reported. | The small sample size and the cross-sectional nature of the study design prevent us from drawing causal inferences about the relationship between the chosen covariates and outcome variables over a period. |
| 2020 | Yimenu et al. [38] | Awi zone, Amhara regional state, northwestern Ethiopia | Anti-infective medicines were found to be the most common unused medicines, 53 (58.9%), followed by antipain medicines, 16 (17.8%). | Not reported. | The small sample size and not including the health centres and private health facilities were limitations to this study. Thus, the results may be slightly different if those facilities were included. |
References
- Pharmaceutical Waste Reduction in the NHS. 2015. Available online: https://www.england.nhs.uk/wp-content/uploads/2015/06/pharmaceutical-waste-reduction.pdf (accessed on 30 November 2020).
- Definition and characterization of health-care waste. In Safe Management of Wastes from Health-Care Activities, 2nd ed.; WHO: Geneva, Switzerland, 2014.
- Opar, A. Rising drug costs prompt new uses for old pills. Nat. Med. 2006, 12, 1333. [Google Scholar] [CrossRef] [PubMed]
- Toh, M.R.; Chew, L. Turning waste medicines to cost savings: A pilot study on the feasibility of medication recycling as a solution to drug wastage. Palliat. Med. 2016, 31, 35–41. [Google Scholar] [CrossRef] [PubMed]
- Bekker, C.L.; Gardarsdottir, H.; Egberts, T.C.; Molenaar, H.A.; Bouvy, M.L.; Bemt, B.V.D.; Hövels, A.M. What does it cost to redispense unused medications in the pharmacy? A micro-costing study. BMC Health Serv. Res. 2019, 19, 243. [Google Scholar] [CrossRef] [PubMed]
- Trueman, P.; Lowson, K.; Blighe, A.; Meszaros, A. Evaluation of the Scale, Causes and Costs of Waste Medicines Evaluation of the Scale, Causes and Costs of Waste Medicines. Available online: https://discovery.ucl.ac.uk/id/eprint/1350234/ (accessed on 30 November 2020).
- Kümmerer, K. The presence of pharmaceuticals in the environment due to human use—Present knowledge and future challenges. J. Environ. Manag. 2009, 90, 2354–2366. Available online: https://pubmed.ncbi.nlm.nih.gov/19261375/ (accessed on 14 November 2020). [CrossRef] [PubMed]
- Bound, J.P.; Voulvoulis, N. Household Disposal of Pharmaceuticals as a Pathway for Aquatic Contamination in the United Kingdom. Environ. Health Perspect. 2005, 113, 1705–1711. [Google Scholar] [CrossRef]
- Radhakrishna, L.; Nagarajan, P.; Vijayanandhan, S.S.; Ponniah, T. Knowledge, attitude and practice (kap) towards disposal of medicines: A qualitative study among health care professionals in south India. World J. Pharm. Res. 2014, 3, 1955–1963. [Google Scholar]
- Schwartz, T.; Kohnen, W.; Jansen, B.; Obst, U. Detection of antibiotic-resistant bacteria and their resistance genes in wastewater, surface water, and drinking water biofilms. FEMS Microbiol. Ecol. 2006, 43, 325–335. [Google Scholar] [CrossRef]
- Länge, R.; Hutchinson, T.H.; Croudace, C.P.; Siegmund, F.; Schweinfurth, H.; Hampe, P.; Panter, G.H.; Sumpter, J.P. Effects of the synthetic estrogen 17α-ethinylestradiol on the life-cycle of the fathead minnow (Pimephales promelas). Environ. Toxicol. Chem. 2001, 20, 1216–1227. [Google Scholar] [CrossRef]
- Wu, P.E.; Juurlink, D.N. Unused prescription drugs should not be treated like leftovers. CMAJ 2014, 186, 815–816. [Google Scholar] [CrossRef]
- Medicines Non-Use in Primary Care—Aston Research Explorer. Available online: https://research.aston.ac.uk/en/studentTheses/medicines-non-use-in-primary-care (accessed on 15 November 2020).
- West, L.M.; Diack, L.; Cordina, M.; Stewart, D. A systematic review of the literature on ‘medication wastage’: An exploration of causative factors and effect of interventions. Int. J. Clin. Pharm. 2014, 36, 873–881. [Google Scholar] [CrossRef]
- Waste Management Plan for England. 2013. Available online: www.gov.uk/defra (accessed on 15 November 2020).
- McRae, D.; Allman, M.; James, D. The redistribution of medicines: Could it become a reality? Int. J. Pharm. Pr. 2016, 24, 411–418. [Google Scholar] [CrossRef] [PubMed]
- Bekker, C.L.; Gardarsdóttir, H.; Egberts, T.C.; Bouvy, M.L.; Bemt, B.J.F.V.D. Redispensing of medicines unused by patients: A qualitative study among stakeholders. Int. J. Clin. Pharm. 2017, 39, 196–204. [Google Scholar] [CrossRef] [PubMed]
- Alhamad, H.; Patel, N.; Donyai, P. How do people conceptualise the reuse of medicines? An interview study. Int. J. Pharm. Pr. 2018, 26, 232–241. [Google Scholar] [CrossRef] [PubMed]
- Bekker, C.L.; Bemt, B.V.D.; Egberts, T.C.; Bouvy, M.; Gardarsdottir, H. Willingness of patients to use unused medication returned to the pharmacy by another patient: A cross-sectional survey. BMJ Open 2019, 9, e024767. [Google Scholar] [CrossRef] [PubMed]
- Wongpoowarak, P.; Wanakamanee, U.; Panpongtham, K.; Trisdikoon, P.; Wongpoowarak, W.; Ngorsuraches, S. Unused medications at home—Reasons and costs. Int. J. Pharm. Pr. 2004, 12, 141–148. [Google Scholar] [CrossRef]
- Braund, R.; Chuah, F.; Gilbert, R.; Gn, G.; Soh, A.; Tan, L.Y.; Yuen, Y.-C. Identification of the reasons for medication returns. NZFP 2008, 35, 248–252. [Google Scholar]
- Makki, M.; Hassali, M.A.; Awaisu, A.; Hashmi, F.K. The Prevalence of Unused Medications in Homes. Pharmacy 2019, 7, 61. [Google Scholar] [CrossRef] [PubMed]
- Bekker, C.L.; Bemt, B.J.F.V.D.; Egberts, A.C.G.; Bouvy, M.L.; Gardarsdottir, H. Patient and medication factors associated with preventable medication waste and possibilities for redispensing. Int. J. Clin. Pharm. 2018, 40, 704–711. [Google Scholar] [CrossRef] [PubMed]
- Ali, S.; Ibrahim, M. Extent of Medication Wastage and Cost among Female Students in a University Setting. Mahidol Univ. J. Pharm. Sci. 2009, 36, 34–43. [Google Scholar]
- Garey, K.W.; Johle, M.L.; Behrman, K.; Neuhauser, M.M. Economic Consequences of Unused Medications in Houston, Texas. Ann. Pharmacother. 2004, 38, 1165–1168. [Google Scholar] [CrossRef] [PubMed]
- El-Hamamsy, M.; Manal El-Hamamsy, A. Unused medications: How cost and how disposal of in Cairo, Egypt. Int. J. Pharm. Stud. Res. 2011, 2, 21–27. [Google Scholar]
- Abou-Auda, H.S. An economic assessment of the extent of medication use and wastage among families in Saudi Arabia and Arabian Gulf countries. Clin. Ther. 2003, 25, 1276–1292. [Google Scholar] [CrossRef]
- Jafarzadeh, A.; Mahboub-Ahari, A.; Naja, M.; Youse, M. Medicine Storage, Wastage and Associated Determinants among Urban Households: A Systematic Review of Household Surveys. Available online: https://doi.org/10.21203/rs.3.rs-71586/v1 (accessed on 18 November 2020).
- DUMP—Bewell.org.nz—Nelson Bays Primary Health. Available online: https://www.yumpu.com/en/document/view/18584754/dump-bewellorgnz-nelson-bays-primary-health (accessed on 15 November 2020).
- Tong, A.Y.C.; Peake, B.M.; Braund, R. Disposal practices for unused medications around the world. Environ. Int. 2011, 37, 292–298. [Google Scholar] [CrossRef] [PubMed]
- Braund, R.; Peake, B.M.; Shieffelbien, L. Disposal practices for unused medications in New Zealand. Environ. Int. 2009, 35, 952–955. [Google Scholar] [CrossRef]
- Guirguis, K. Medications collected for disposal by outreach pharmacists in Australia. Pharm. World Sci. 2009, 32, 52–58. [Google Scholar] [CrossRef]
- Abahussain, E.A.; Ball, D.E.; Matowe, W.C. Practice and Opinion towards Disposal of Unused Medication in Kuwait. Med. Princ. Pr. 2006, 15, 352–357. [Google Scholar] [CrossRef]
- Maeng, D.D.; Snyder, R.C.; Medico, C.J.; Mold, W.M.; Maneval, J.E. Unused medications and disposal patterns at home: Findings from a Medicare patient survey and claims data. J. Am. Pharm. Assoc. 2016, 56, 41–46.e6. [Google Scholar] [CrossRef]
- Moher, D.; Liberati, A.; Tetzlaff, J.; Altman, D.G. Preferred reporting items for systematic reviews and meta-analyses: The PRISMA statement. PLoS Med. 2009, 6, e1000097. [Google Scholar] [CrossRef]
- Teni, F.S.; Surur, A.S.; Asrie, A.B.; Wondimsigegn, D.; Gelayee, D.A.; Shewamene, Z.; Legesse, B.; Birru, E.M. A household survey of medicine storage practices in Gondar town, northwestern Ethiopia. BMC Public Heal. 2017, 17, 238. [Google Scholar] [CrossRef]
- Ebrahim, A.J.; Teni, F.S.; Yimenu, D.K. Unused and Expired Medications: Are They a Threat? A Facility-Based Cross-Sectional Study. J. Prim. Care Community Health 2019, 10. [Google Scholar] [CrossRef]
- Yimenu, D.K.; Teni, F.S.; Ebrahim, A.J. Prevalence and Predictors of Storage of Unused Medicines among Households in Northwestern Ethiopia. J. Environ. Public Health 2020, 2020, 8703208-10. [Google Scholar] [CrossRef] [PubMed]
- Gudeta, T.; Assefa, D. Assessment of Pharmaceuticals Waste Practices Among Private Drug Retail Outlets in Ethiopia. J. Prim. Care Community Health 2020, 11. [Google Scholar] [CrossRef] [PubMed]
- Kahsay, H.; Ahmedin, M.; Kebede, B.; Gebrezihar, K.; Araaya, H.; Tesfay, D. Assessment of Knowledge, Attitude, and Disposal Practice of Unused and Expired Pharmaceuticals in Community of Adigrat City, Northern Ethiopia. J. Environ. Public Health 2020, 2020, 1–11. [Google Scholar] [CrossRef] [PubMed]
- Wondimu, A.; Molla, F.; Demeke, B.; Eticha, T.; Assen, A.; Abrha, S.; Melkam, W. Household storage of medicines and associated factors in Tigray Region, Northern Ethiopia. PLoS ONE 2015, 10, e0135650. [Google Scholar] [CrossRef]
- Gupta, J.; Alam, N.; Bhardwaj, A.; Amin, F.; Alam, M.N. Prospective survey study on assessment and education of home medicine cabinet in general population of community. IJPSR 2011, 2, 1237–1243. [Google Scholar]
- Aditya, S. Safe medication disposal: Need to sensitize undergraduate students. Int. J. Pharm. Life Sci. 2013, 4, 2476–2480. [Google Scholar]
- Mirza, N.; Ganguly, B. Utilization of Medicines Available at Home by General Population of Rural and Urban Set Up of Western India. J. Clin. Diagn. Res. 2016, 10, FC05–FC09. [Google Scholar] [CrossRef]
- Hassali, M.A.; Shakeel, S. Unused and Expired Medications Disposal Practices among the General Public in Selangor, Malaysia. Pharmacy 2020, 8, 196. [Google Scholar] [CrossRef]
- Law, A.V.; Sakharkar, P.; Zargarzadeh, A.; Tai, B.W.B.; Hess, K.; Hata, M.; Mireles, R.; Ha, C.; Park, T.J. Taking stock of medication wastage: Unused medications in US households. Res. Soc. Adm. Pharm. 2015, 11, 571–578. [Google Scholar] [CrossRef]
- Al-Azzam, S.I.; Al-Husein, B.A.; Alzoubi, F.; Masadeh, M.M.B. Self-Medication with Antibiotics in Jordanian Population. Int. J. Occup. Med. Environ. Health 2007, 20, 373–380. [Google Scholar] [CrossRef]
- Abushanab, A.S.; Sweileh, W.M.; Wazaify, M. Storage and wastage of drug products in J ordanian households: A cross-sectional survey. Int. J. Pharm. Pract. 2013, 21, 185–191. [Google Scholar] [CrossRef] [PubMed]
- Ibrahim, S.; Mamdouh, H.; El-Haddad, I.Z. Analysis of medications returned to community pharmacies in Alexandria, Egypt. Life Sci. J. 2012, 9, 746–751. [Google Scholar]
- Sooksriwong, C.; Jarupas, C.; Chinawong, D.; Supakul, S.; Ploylermsang, C.; Sornlumlertwanich, K.; Janto, S. Values of leftover drugs in households: Preliminary study in 5 major Thai cities. J. Asian Assoc. Sch. Pharm. 2013, 2, 235–242. [Google Scholar]
- Kheir, N.M.; El Hajj, M.; Kaissi, R.; Wilbur, K.; Yousif, A. An exploratory study on medications in Qatar homes. Drug Health Patient Saf. 2011, 3, 99–106. [Google Scholar] [CrossRef] [PubMed]
- Huang, Y.; Wang, L.; Zhong, C.; Huang, S. Factors influencing the attention to home storage of medicines in China. BMC Public Health 2019, 19, 1–10. [Google Scholar] [CrossRef] [PubMed]
- Jassim, A.-M. In-home Drug Storage and Self-medication with Antimicrobial Drugs in Basrah, Iraq. Oman Med. J. 2010, 25, 79–87. [Google Scholar] [CrossRef] [PubMed]
- Insani, W.N.; Qonita, N.A.; Jannah, S.S.; Nuraliyah, N.M.; Supadmi, W.; Gatera, V.A.; Alfian, S.D.; Abdulah, R. Improper disposal practice of unused and expired pharmaceutical products in Indonesian households. Heliyon 2020, 6, e04551. [Google Scholar] [CrossRef]
- Auta, A.; Banwat, S.B.; Sariem, C.N.; Shalkur, D.; Nasara, B.; Atuluku, M.O. Medicines in pharmacy students’ residence and self-medication practices. J. Young Pharm. 2012, 4, 119–123. [Google Scholar] [CrossRef]
- Coma, A.; Modamio, P.; Lastra, C.F.; Bouvy, M.L.; Mariño, E.L. Returned medicines in community pharmacies of Barcelona, Spain. Pharm. World Sci. 2007, 30, 272–277. [Google Scholar] [CrossRef]
- Kagashe, G.A.; Makenya, F.B.; Buma, D. Medicines Wastage at a Tertiary Hospital in Dar Es Salaam Tanzania. J. Appl. Pharm. Sci. 2014, 4, 98–102. [Google Scholar]
- Vella, V.; West, L.M. Analysis of Disposed Unused Medications at a Village Community Pharmacy. Pharmacy 2019, 7, 45. [Google Scholar] [CrossRef] [PubMed]
- Aboagye, V.S.; Kyei, K.A. Disposal of Leftover Drugs in Ghana. Pharm. Res. 2014, 4, 84–91. [Google Scholar]
- Al-Siyabi, K.; Al-Riyami, K. Value and Types of Medicines Returned by Patients to Sultan Qaboos University Hospital Pharmacy, Oman. Sultan Qaboos Univ. Med. J. [SQUMJ] 2007, 7, 109–115. [Google Scholar] [PubMed]
- Gracia-Vásquez, S.L.; Ramírez-Lara, E.; Camacho-Mora, I.A.; Cantú-Cárdenas, L.G.; Gracia-Vásquez, Y.A.; Esquivel-Ferriño, P.C.; Ramírez-Cabrera, M.A.; Gonzalez-Barranco, P. An analysis of unused and expired medications in Mexican households. Int. J. Clin. Pharm. 2015, 37, 121–126. [Google Scholar] [CrossRef]
- Langley, C.; Marriott, J.; Mackridge, A.; Daniszewski, R. An analysis of returned medicines in primary care. Pharm World Sci. 2005, 27, 296–299. [Google Scholar] [CrossRef]
- Mackridge, A.J.; Marriott, J.F. Returned medicines: Waste or a wasted opportunity? J. Public. Health 2007, 29, 258–262. [Google Scholar] [CrossRef]
- Bradley, M. Waste Medication: Community Pharmacy Audit Report 2008/09; NHS Cumbria: Cumbria, UK, 2009. [Google Scholar]
- James, T.H.; Helms, M.L.; Braund, R. Analysis of Medications Returned to Community Pharmacies. Ann. Pharmacother. 2009, 43, 1631–1635. [Google Scholar] [CrossRef]
- Vogler, S.; Leopold, C.; Zuidberg, C.; Habl, C. Medicines discarded in household garbage: Analysis of a pharmaceutical waste sample in Vienna. J. Pharm. Policy Pr. 2014, 7, 6. [Google Scholar] [CrossRef]
- Braund, R.; Yuen, Y.C.; Jung, J. Identification and quantification of medication returned to Otago pharmacies. NZFP 2007, 34, 258–262. [Google Scholar]
- Alhamad, H.; Donyai, P. Intentions to “Reuse” Medication in the Future Modelled and Measured Using the Theory of Planned Behavior. Pharmacy 2020, 8, 213. [Google Scholar] [CrossRef]
- Hui, T.K.; Donyai, P.; McCrindle, R.; Sherratt, R.S. Enabling Medicine Reuse Using a Digital Time Temperature Humidity Sensor in an Internet of Pharmaceutical Things Concept. Sensors 2020, 20, 3080. [Google Scholar] [CrossRef] [PubMed]
- Hui, T.K.L.; Mohammed, B.; Donyai, P.; McCrindle, R.; Sherratt, R.S. Enhancing Pharmaceutical Packaging through a Technology Ecosystem to Facilitate the Reuse of Medicines and Reduce Medicinal Waste. Pharmacy 2020, 8, 58. [Google Scholar] [CrossRef] [PubMed]
- Chien, H.-Y.; Ko, J.-J.; Chen, Y.-C.; Weng, S.-H.; Yang, W.-C.; Chang, Y.-C.; Liu, H.-P. Study of Medication Waste in Taiwan. J. Exp. Clin. Med. 2013, 5, 69–72. [Google Scholar] [CrossRef]


Publisher’s Note: MDPI stays neutral with regard to jurisdictional claims in published maps and institutional affiliations. |
© 2020 by the authors. Licensee MDPI, Basel, Switzerland. This article is an open access article distributed under the terms and conditions of the Creative Commons Attribution (CC BY) license (http://creativecommons.org/licenses/by/4.0/).
Share and Cite
Alhamad, H.; Patel, N.; Donyai, P. Towards Medicines Reuse: A Narrative Review of the Different Therapeutic Classes and Dosage Forms of Medication Waste in Different Countries. Pharmacy 2020, 8, 230. https://doi.org/10.3390/pharmacy8040230
Alhamad H, Patel N, Donyai P. Towards Medicines Reuse: A Narrative Review of the Different Therapeutic Classes and Dosage Forms of Medication Waste in Different Countries. Pharmacy. 2020; 8(4):230. https://doi.org/10.3390/pharmacy8040230
Chicago/Turabian StyleAlhamad, Hamza, Nilesh Patel, and Parastou Donyai. 2020. "Towards Medicines Reuse: A Narrative Review of the Different Therapeutic Classes and Dosage Forms of Medication Waste in Different Countries" Pharmacy 8, no. 4: 230. https://doi.org/10.3390/pharmacy8040230
APA StyleAlhamad, H., Patel, N., & Donyai, P. (2020). Towards Medicines Reuse: A Narrative Review of the Different Therapeutic Classes and Dosage Forms of Medication Waste in Different Countries. Pharmacy, 8(4), 230. https://doi.org/10.3390/pharmacy8040230