Article

Enhancing Language Learners’ Comprehensibility through Automated Analysis of Pause Positions and Syllable Prominence

1
Laboratory of Linguistics and Didactics of Foreign and Mother Tongues (LIDILEM), University Grenoble Alpes, 38000 Grenoble, France
2
Spoken Language Processing Laboratory (SLPL), Doshisha University, Kyoto 610-0394, Japan
3
Univ. Grenoble Alpes, CNRS, Grenoble INP (Institute of Engineering Univ. Grenoble Alpes), LIG, 38000 Grenoble, France
*
Author to whom correspondence should be addressed.
Languages 2024, 9(3), 78; https://doi.org/10.3390/languages9030078
Submission received: 21 August 2023 / Revised: 3 January 2024 / Accepted: 24 January 2024 / Published: 28 February 2024
(This article belongs to the Special Issue Speech Analysis and Tools in L2 Pronunciation Acquisition)

Abstract

:
This research paper addresses the challenge of providing effective feedback on spontaneous speech produced by second language (L2) English learners. As the position of pauses and lexical stress is often considered a determinative factor for easy comprehension by listeners, an automated pipeline is introduced to analyze the position of pauses in speech, the lexical stress patterns of polysyllabic content words, and the degree of prosodic contrast between stressed and unstressed syllables, on the basis of F0, intensity, and duration measures. The pipeline is applied to 11 h of spontaneous speech from 176 French students with B1 and B2 proficiency levels. It appeared that B1 students make more pauses within phrases and less pauses between clauses than B2 speakers, with a large diversity among speakers at both proficiency levels. Overall, lexical stress is correctly placed in only 35.4% of instances, with B2 students achieving a significantly higher score (36%) than B1 students (29.6%). However, great variation among speakers is also observed, ranging from 0% to 68% in stress position accuracy. Stress typically falls on the last syllable regardless of the prosodic expectations, with the strong influence of syllable duration. Only proficient speakers show substantial F0 and intensity contrasts.

1. Introduction

Effective communication in a foreign language requires the ability to speak and be easily understood in real-life situations. However, students often have limited opportunities for speaking practice and feedback within the classroom, primarily due to time constraints and insufficient teacher training (Derwing and Munro 2015). Integrating automated tools to assist language learners can address this challenge by providing enhanced practice and feedback, reducing their sole reliance on teachers as the reference both inside and outside the classroom. While numerous tools exist for practicing pronunciation, especially for English learners, most of them focused on the segmental evaluation of read speech, using predetermined texts and limited scope (Coulange 2023). Several high-stake language assessment companies have developed tools for scoring spontaneous speech pronunciation, such as SpeechRater and Pearson Versant Speaking Test, which excel at predicting the proficiency levels. However, these tools are not designed to offer feedback and only provide abstract information that is challenging to convert into pedagogical feedback, as they primarily depend on surface speech features like the articulation rate, length of utterance, or pause frequency (Evanini and Zechner 2019). In a training context, learners require insights into their specific pronunciation phenomena that make their speech more difficult to understand, i.e., phenomena that hinder their comprehensibility, to help them prioritize areas for improvement.
Assessing comprehensibility requires involving listeners and is challenging to achieve outside real communication situations, as the effort required by the listener to understand depends on their familiarity with the speaker’s pronunciation, selective attention, motivation to listen, and the communication situation (Lickley 2015; Munro and Derwing 2015). Nevertheless, certain speech phenomena might weight more than others in speech comprehension and could be automatically measured. This would offer learners valuable assistance in enhancing their comprehensibility, focusing on potentially problematic parts, while allowing some non-disturbing variations.
Among these phenomena, speech rhythm plays a major role in structuring speech and helping the listeners in processing it. Speech rhythm is often characterized by perceiving successive patterns of weak and strong elements (Gibbon and Gut 2001), but its definition can be broadened to encompass the succession of pauses that punctuate the speech flow. In English, hesitation marker positions, as well as lexical stress realization, have often been highlighted as key features impacting comprehensibility (Adams 1979; Cutler 2015; Field 2005; Isaacs et al. 2018; Tortel 2021).
This paper presents initial findings from an ongoing Ph.D. research endeavor that aims to quantify the contribution of pause positions and syllable acoustical prominence to the comprehensibility of second language (L2) speech. The authors developed an automated pipeline to transcribe and identify pause positions and syllable prominence in non-native spontaneous speech. This pipeline was applied to 176 French learners of English with B1 and B2 proficiency levels in order to investigate how pausing and stress patterns evolve from B1 to B2, as fluency and stress accuracy are mentioned as the key elements of the latter level (Council of Europe 2020). The next step of this research will involve presenting the recordings of speakers, with low or high fluency or stress accuracy, to native listeners, to explore the relationship between perceived effort to understand and pause and stress patterns.
Pause position analysis included conducting a constituency analysis on the transcribed text in order to identify whether pauses were occurring between clauses, phrases, or within phrases. Learners’ tendencies to pause in specific lexical contexts were also investigated. Speaker profiles were established by co-clustering speakers on the basis of their pausing patterns in the most frequent syntactic contexts. The analysis of lexical stress involved examining fundamental frequency (F0), intensity, and duration measures for each syllable of the polysyllabic content words in the corpus. Both the prominent syllable position and the degree of acoustic contrast between stressed and adjacent syllables were explored.
The rest of the paper is organized as follows. Section 2 aims to provide a definition of pauses and lexical stress, elucidate their significance as fundamental components of speech, and explore how language learners may inadvertently misuse them. Details about the corpus will be given in Section 3. Section 4 outlines the methodology relative to the pause position analysis and stress analysis. The results of the pause position analysis and lexical analysis will be presented in Section 5. Section 6 will be dedicated to the discussion of these results and the limitations of the current pipeline.

2. Related Work

Pauses are commonly described as the interruptions of phonation (Grosman et al. 2018). The duration at which such an interruption is considered a pause varies significantly across studies, typically ranging from 100 to 400 ms (Tavakoli 2010; Trouvain 2004). Campione and Véronis (2002) warn, however, that the conclusions may vary significantly depending on the threshold we set, as we may omit potentially meaningful pauses. Based on their analysis of 6000 silent pauses in 4.5 h of multilingual reading and 1 h of spontaneous French, they observed that pauses were divided into three duration groups: brief (<200 ms), medium (200–1000 ms), and long (>1000 ms). Pauses can be silent or filled, when they contain hesitation words, lengthening, or repetitions. (Duez 1982). In addition, pauses can be categorized on the basis of their functions, such as respiratory, hesitation, grammatical, or stylistic (Grosman et al. 2018). As we investigate the relationship between pausing and comprehensibility in the current study, we will rather consider pauses as a structuring or non-structuring phenomenon (Candéa 2000). Structuring pauses play a crucial role in segmenting and organizing discourse. They assist listeners in processing information and convey the speaker’s effective control and understanding of the discourse. In contrast, non-structuring pauses may arise anywhere in speech, primarily serving the purpose of self-correction or identifying the appropriate subsequent word. When occurring at unexpected positions, these pauses can contribute to an increased cognitive load for the listener.
The relationship between pause position and syntax has been studied for several decades and seems to be significant. Tauberer (2008) uses part-of-speech (POS) information and syntactic structures to predict the intra-utterance pauses in the spontaneous English speech of native speakers from the Switchboard corpus. He observed that most pauses tended to appear near conjunctions, fillers, or before pronouns or subjects. In contrast, pauses were unlikely to occur after subjects, between verbs and prepositional phrases, or between prepositions and noun phrases. Cao and Chen (2019) analyzed the speech of “successful speakers”, i.e., speakers that are supposedly easy to understand, including both native and non-native English speakers delivering political speeches or short TED talk-style speeches. They found that, apart from emphasizing particular words, pauses primarily occurred between clauses, often around subordinate conjunctions such as “which”, “that”, and “when” with no discernible difference between native and non-native speakers.
Pauses therefore play an important role in structuring the speech flow when they are used at appropriate junctures. Analyzing their positions within speech is important to determine whether their distribution reflects a higher level of proficiency in the L2 language.
In addition to pauses, word stress also plays an important role in speech segmentation. Lexical stress characterizes languages, like English, German, or Spanish, where the stress position within words may differ, unlike fixed stress languages like Finnish, Polish, or French, where it consistently falls on the first, penultimate, or last syllable, respectively, (Cutler and Jesse 2021).
In English, lexical stress manifests as modifications in both prosodic and segmental aspects of the vowel. Stressed syllables are typically longer, louder, higher in pitch, and feature greater F0 movement, featuring full vowel quality, compared with unstressed syllables (Cutler 2015). Furthermore, stressing a syllable affects the surrounding unstressed syllables, leading to shortened, centralized, and relaxed vowels (Tortel 2021).
The primary role of lexical stress is word segmentation and lexical disambiguation. Content words generally bear stress, whereas function words are typically reduced (Tortel 2021). Lexical stress also plays a crucial role in derivational morphology, as it frequently changes with word category (“PERson” vs. “perSONify”) and helps distinguish words within the same category (“PHOtograph” vs. “phoTOgrapher”).
In second language contexts, speakers are often influenced by the prosodic rules of their native language. For example, French exhibits a fixed stress on final syllables and consistent vowel quality in plain vowels (Dupoux et al. 1997). Consequently, French speakers of English frequently transfer stress to the word endings and often do not reduce unstressed syllables (Tortel and Hirst 2010). French stress is mainly produced by vowel lengthening, while intensity and intonation play a much less significant role (Astesano 2001). Additionally, because stress in French does not serve a disambiguation role as it does in English, French learners of English are often unaware of stress patterns and may find it challenging to recognize their own final lengthening and word stress in general. Dupoux et al. (1997) coined the term “stress deafness” to describe this limited ability to perceive and be conscious of stress, noting that speakers from languages with fixed stress encounter more difficulties compared with those from lexical stress languages. Moreover, intentionally modifying the rhythm can be psychologically demanding, given their deep-rooted nature from childhood and close association with one’s personality and culture (Calbris and Montredon 1975). Consequently, misplaced word stress and non-reduced unstressed syllables can significantly impede word recognition for listeners (Cutler 2015). Tortel (2021) emphasizes that French learners of English should prioritize improving their lexical stress position, contrast between stressed and reduced syllables, avoiding lengthening of unstressed final syllables, and reduce function words.
Numerous studies have investigated automated lexical stress classification since the early 2000s. Most systems utilize F0, intensity, and duration measures along with various machine learning algorithms to predict the stress patterns of words (Chen and Wang 2010; Chen and Jang 2012; Deshmukh and Verma 2009; Johnson and Kang 2015; Li et al. 2018; Tepperman and Narayanan 2005). A number of systems also incorporate segmental information, like cepstral coefficients (Ferrer et al. 2015; Li et al. 2007). However, these tools require substantial training with annotated data and necessitate the large input vectors of values for each syllable, rendering their outcomes challenging to interpret. Additionally, none of these systems measure the degree of contrast between stressed and unstressed syllables.

3. Data

Our dataset comprises the L2 English speech of 176 French learners, recorded during the oral interaction speaking task of the CLES1, a national, government-certified test of language proficiency in France. This task involved a 10-minute role play where two or three candidates engaged in an argumentative discussion on a controversial topic, such as e-cigarettes, security cameras, or the use of technology in the classroom. Each participant underwent evaluation by two professional raters, who assessed them across various dimensions and assigned a final speaking proficiency level of either B1 or B2, in accordance with the CEFR (Council of Europe 2020). The speaking proficiency distribution among the students was 66% (117 speakers) at level B2 and 34% (59 speakers) at level B1. The gender distribution was evenly divided, with 53% female and 47% male participants. All 176 students indicated French as one of their native languages. We did not consider the potential impact of other L1 or L2s in this study.

4. Methodology

The automated processing pipeline2 involved several steps: neural speaker diarization using Pyannote (Bredin and Laurent 2021), speech recognition and forced alignment using WhisperX (Bain et al. 2023), morphosyntactic analysis using SpaCy (Honnibal et al. 2020), and constituency analysis using the Berkeley Neural Parser (Kitaev et al. 2019). The recordings were segmented into mono-speaker continuous speech segments using Pyannote’s voice activity detection, with a silence threshold set at 1 s. Segments lasting 8 s or less were excluded to eliminate short utterances. This led to a corpus of 11 h of continuous speech. The average duration of speech per speaker was 3′44″ (min 0′32″, max 6′51″, SD 1′20″). The transcribed text was automatically annotated with POS tags and aligned to the corresponding audio signal. All words were aligned to the signal with empty intervals separating them, tagged as “<p:>”, and which contain everything that is not considered a word by WhisperX (such as silences, laughter, or hums).

4.1. Methodology Relative to the Pause Position Analysis

The pause patterns analysis involved investigating the locations of pauses according to grammatical constituents and word categories. We analyzed all inter-word <p:> intervals from the corpus, looking at the ending and starting constituents at their position, as well as the immediate POS context. Pauses were considered as any <p:> intervals lasting from 180 ms up to 2 s. We did not analyze the intervals shorter than 180 ms (68.3% of all <p:> intervals) as the impact of brief pauses should be limited and not be as relevant as longer pauses in L2 acquisition context. However, we will consider to adapt this threshold dynamically to the speech rate in future studies. As for segments longer than 2 s (1.5%), most of them resulted from inaccurate word alignment, which is why we decided to exclude them all. <p:> intervals can either be silent or filled with phoneme lengthening, hesitation, laughter, or potential wrong alignments, which explains why some segments exceed 1 s in duration, even though we set a threshold of 1 s for Pyannote’s voice activity detection. We did not differentiate silent and filled pauses in this study.
Our approach involves conducting a comparative analysis of pause distribution within the syntactic structure of each utterance for both B1 and B2 proficiency groups. Additionally, we examine pausing patterns in the most frequent lexical contexts in terms of occurrences in this corpus. We posit that B1 students are more likely to exhibit pauses in unexpected contexts, specifically within phrases, as opposed to at clause junctures where pauses are typically anticipated. In terms of lexical patterns, we anticipate a higher number of pause occurrences between word categories that typically do not expect pauses, such as between prepositions and determiners, determiners and nouns, or pronouns and verbs.

4.2. Methodology Relative to the Stress Analysis

The analysis of lexical stress involved comparing word-level prosodic shapes with their expected stress pattern from the dictionary, and quantifying the contrast between stressed and unstressed syllables. Each syllable was represented by three speaker-normalized measures: F0 and intensity at the syllable nucleus position, and syllable duration estimated from the midpoints of neighboring syllable nuclei and/or word boundaries. Syllable nuclei were extracted using the Praat script presented in de Jong et al. (2021), which detects syllable nuclei on the basis of intensity peaks. A bandpass filter at 300–3300 Hz was applied beforehand to minimize the effect of non-voice-related events. For each transcribed word, the expected number(s) of syllables were extracted from the CMU pronouncing dictionary3 and compared with the number of syllables detected within the word boundaries. Only content words (nouns, verbs, adjectives, and adverbs) with the correct number of detected syllables were included in the analysis (henceforth target words). This method enables one to filter words with poor alignment precision, or syllable detection. With the current settings, only 41% of the polysyllabic plain words were included in the analysis (refer to the Section 6 for possible improvements). No manual correction has been performed at any point, since we wanted the pipeline to work fully by itself.
To compute the speaker-normalized value for each prosodic feature, the absolute F0, intensity, and duration values for each speaker were ranked within the dataset. Absolute prosodic values were replaced by their corresponding speaker percentile value, thus providing a relative measure of prominence within the context of the speaker’s own performance. In each dimension, the observed stressed syllable corresponds to the highest centile value, while other values were categorized as unstressed syllables.
Acoustic stress was inferred to be the most prominent syllable within the word for each dimension, and these three dimensions were merged with equal weight to obtain a single global representation easier to handle and interpret. The stress position was analyzed through a binary representation of syllables with “O” representing the stressed syllable and “o” representing the other syllables in the word. For example, the prosodic shape of “student” was expected to be “Oo”, with the stress on the first syllable while the last one is reduced; “potential” was expected to be shaped as “oOo”, with the stress on the middle syllable. Notably, we did not differentiate between secondary stress, unstressed, and reduced syllables, which were all considered as unstressed syllables in this study.
In Figure 1, an example output is presented with POS tags and text on tiers 1 and 2, syllable nuclei on tier 3, expected prosodic shape from the CMU dictionary on tier 4, and the observed global prosodic shape on tier 5, which is a merge of F0, intensity, and duration values from tier 6. Note that only a binary stress representation is shown here, but there is a centile value behind each “o/O” symbol. In this example, only two syllables are detected within the boundaries of the word “exactly”, which expects three syllables according to the CMU dictionary; thus, this word is excluded from the analysis. The last syllable in both target words “cosmetic” and “products” appears to be prominent, although stress is expected on the second and first syllable, respectively.
One of the authors manually evaluated 100 target words out of random files. The results indicated a correct word recognition rate of 92%, accuracy of 95% in their temporal alignment, and satisfactory syllable nuclei detection and alignment for 87% of the words. While evaluating whether prosodic shapes aligned with actual stress perception, an 80% precision rate was achieved. However, simple acoustical measures do not cover the various factors involved in human perception, such as expectation and L1 influence (Cooper et al. 2002), making it difficult to compare.
We anticipate that lexical stress will predominantly occur on the last syllable, regardless of the expected prosodic shape of words. This stress is likely to be primarily influenced by lengthening, with minimal impact from F0 and intensity, as French stress is mainly realized by vowel lengthening. Additionally, we expect B2 proficiency speakers to demonstrate more accurate stress positions and a greater acoustic contrast between stressed and unstressed syllables compared with B1 speakers.

5. Results

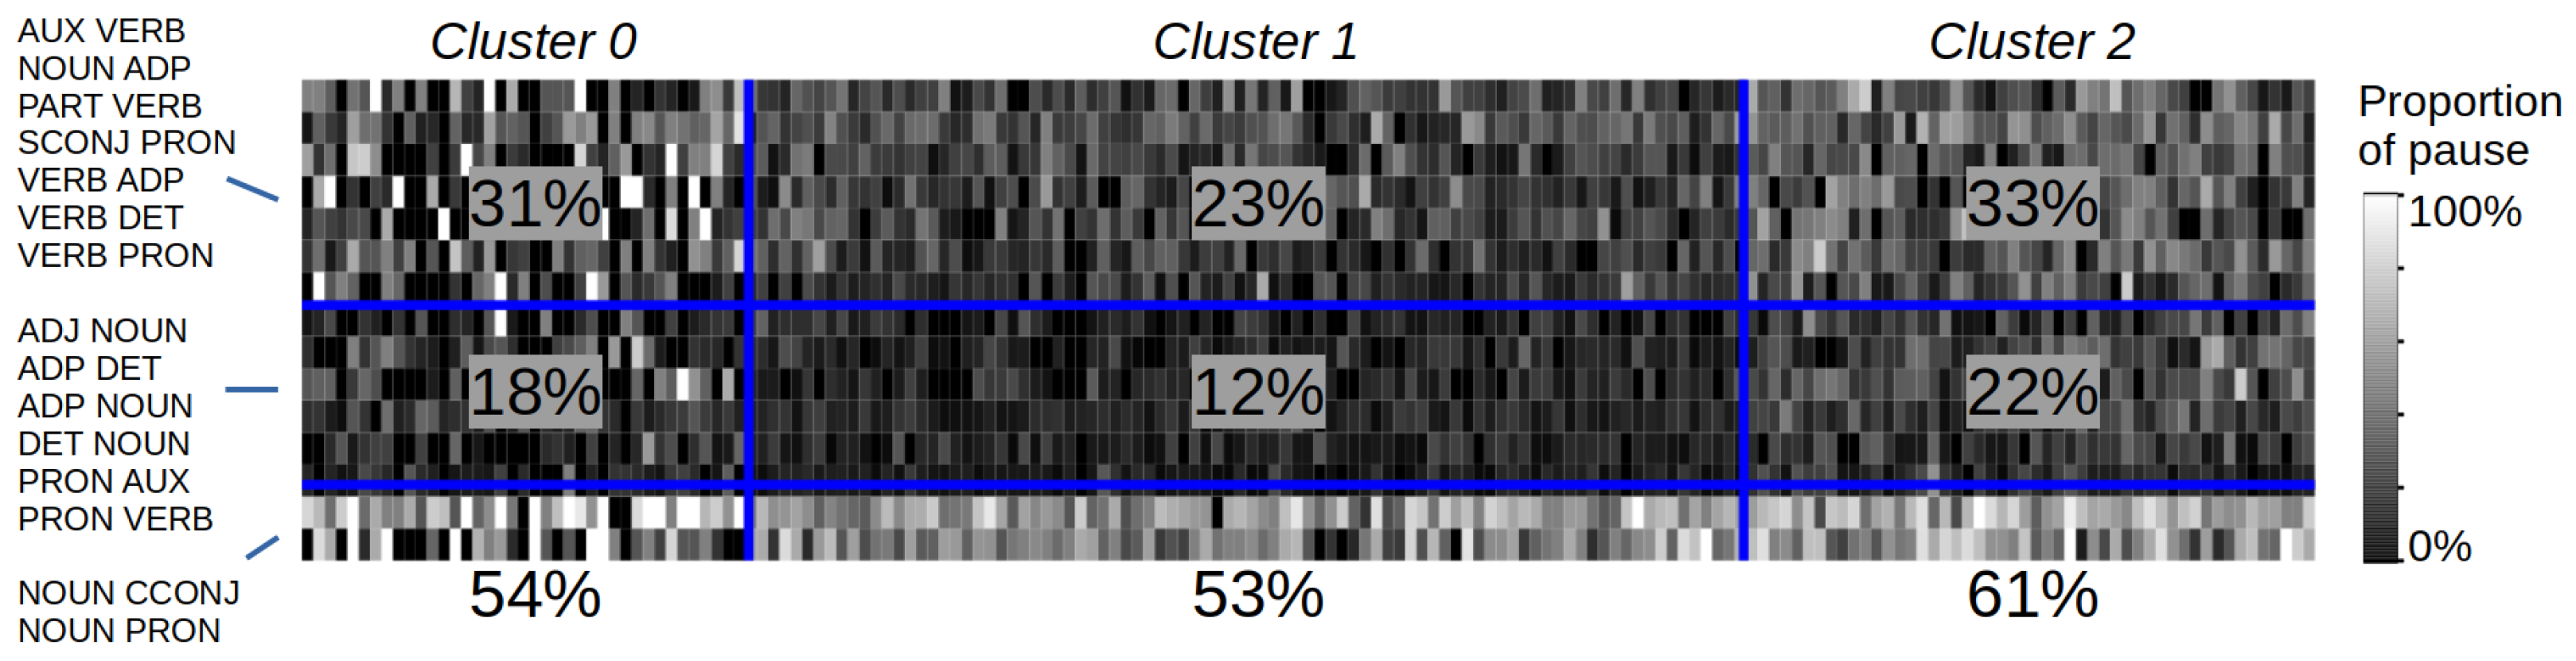
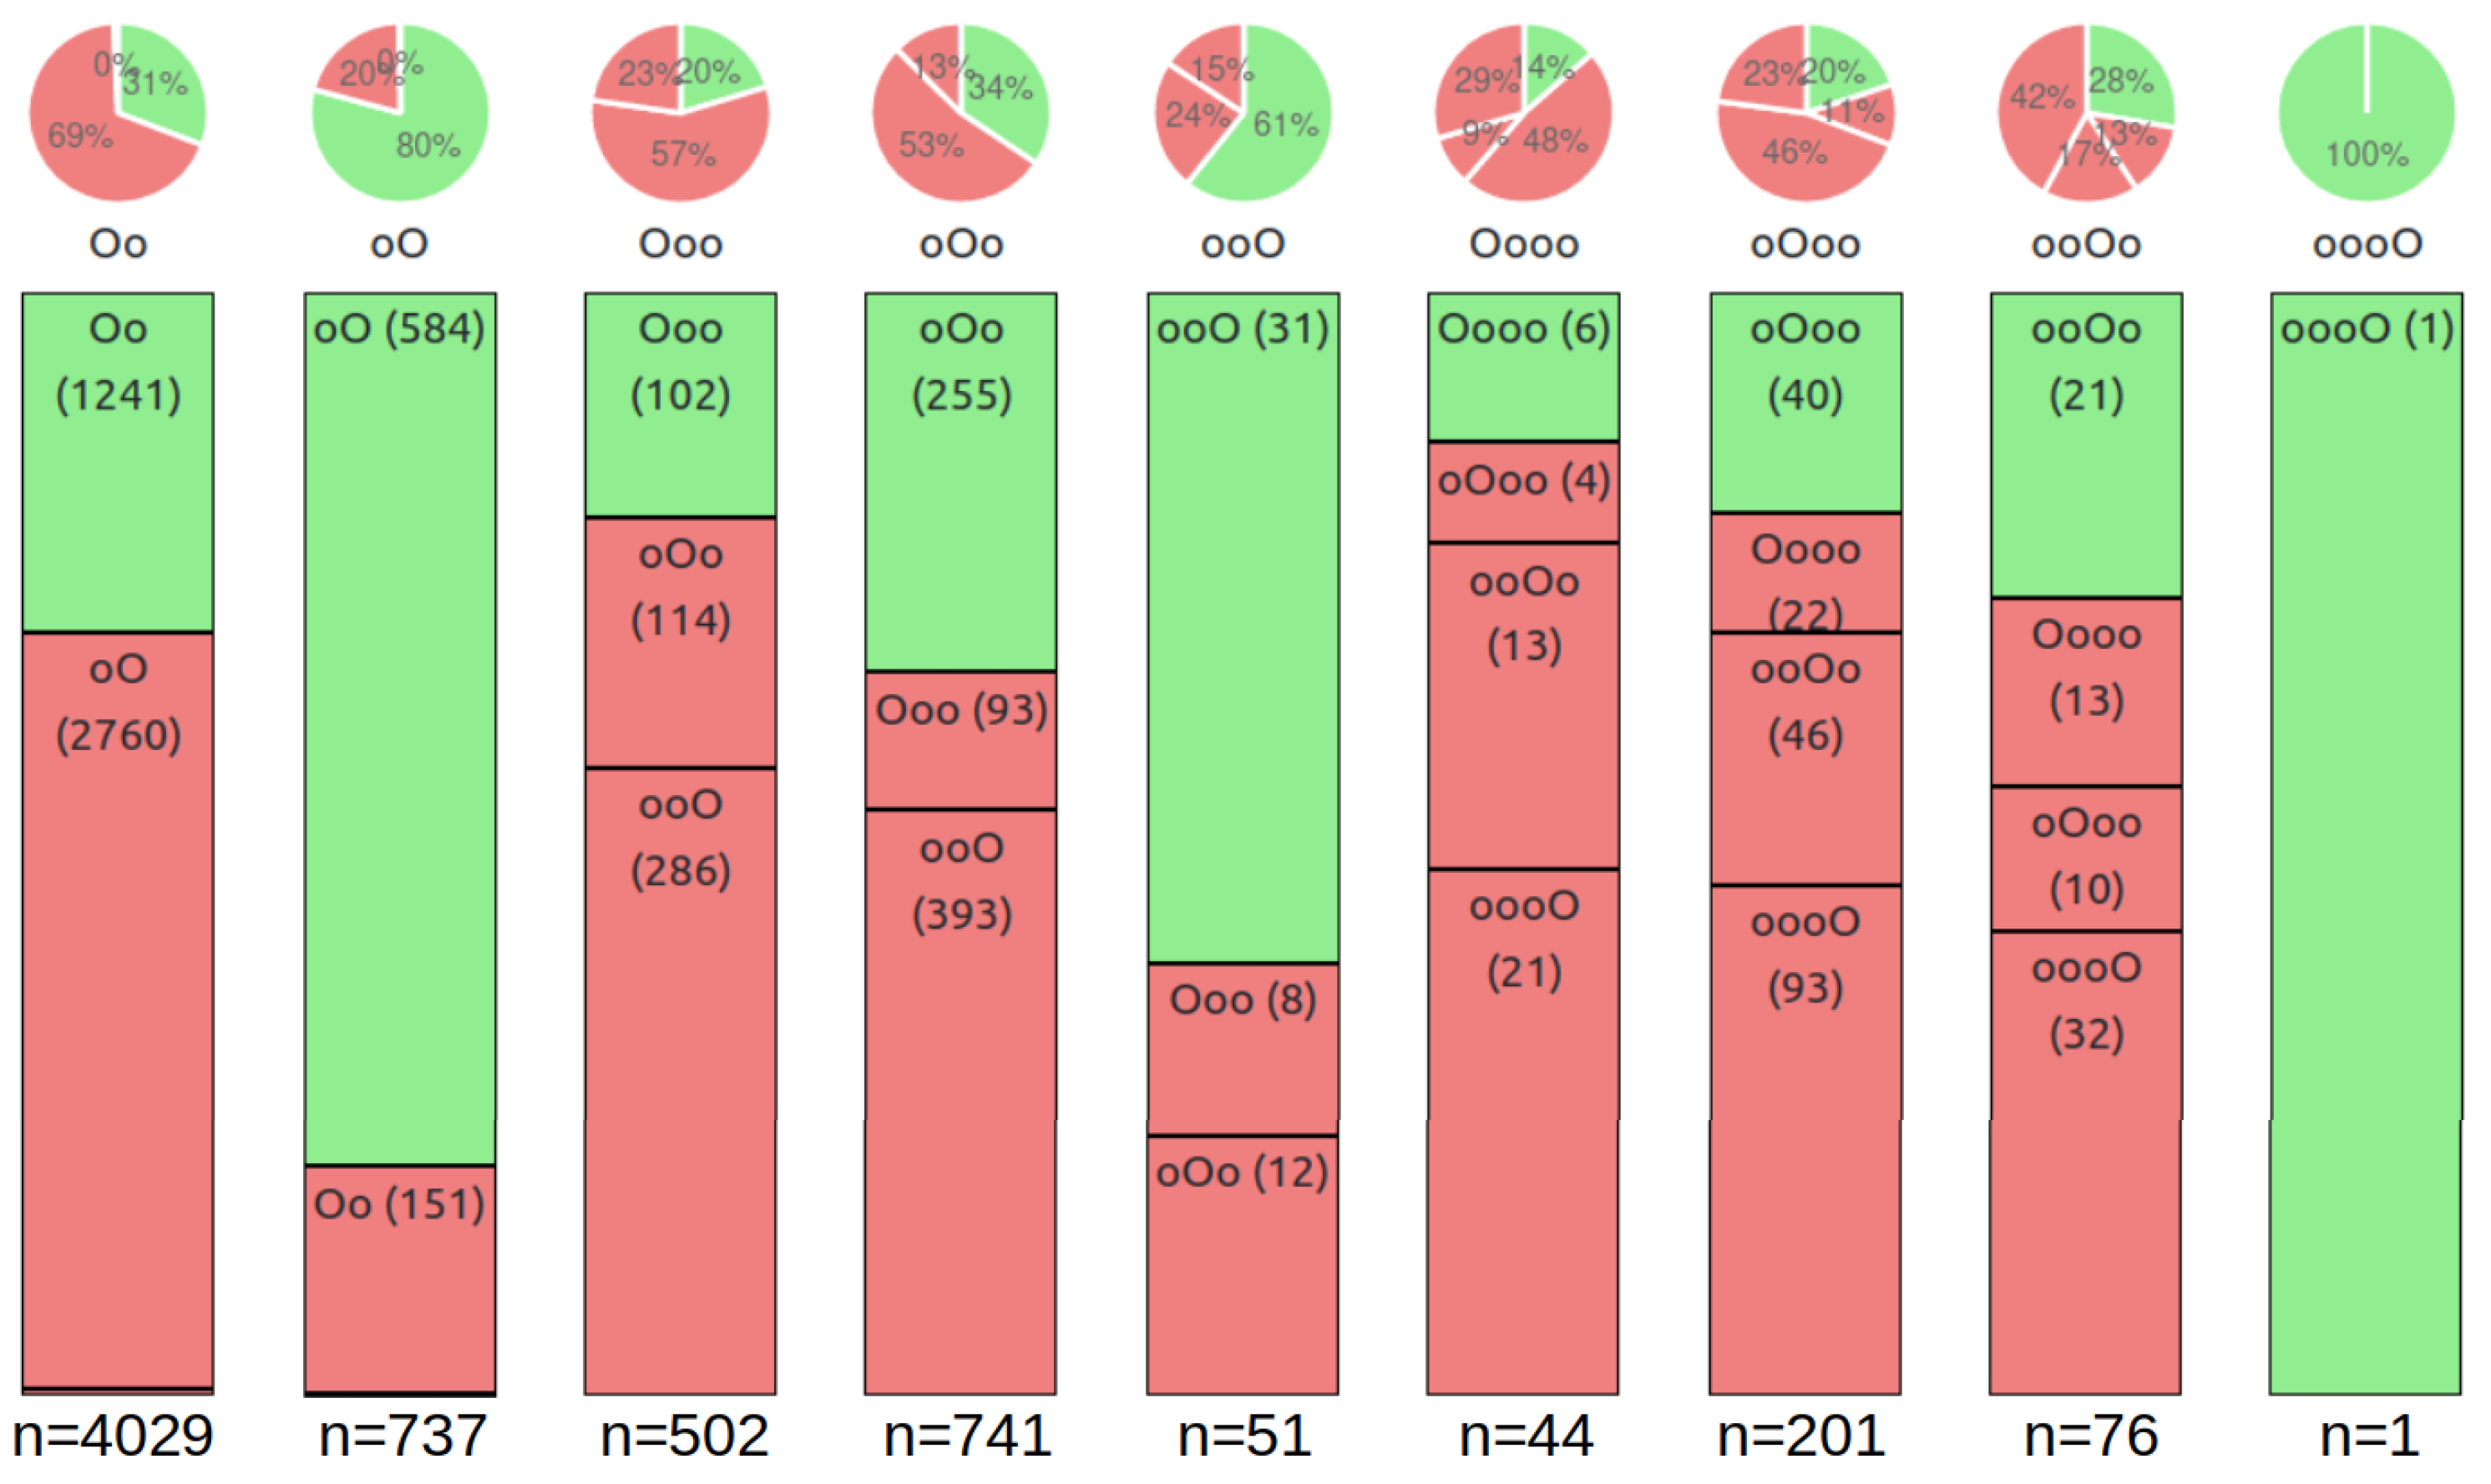
5.1. Pause Position Analysis

This section analyzes the 21,942 <p:> segments considered as pauses, out of the 72,594 <p:> segments present in the corpus. After briefly comparing the frequency and mean duration of pauses among B1 and B2 proficiency groups, we will explore their distribution within the syntactic tree and word categories.
The duration of speech per speaker is similar for both the B1 and B2 student groups, as indicated by the non-parametric rank test (Wilcoxon–Mann–Whitney) that reveals no significant difference. However, the token rate of B2 students is faster (median at 110 tokens/min) compared with B1 students (97 tokens/min), with a significant difference at p < 0.0001 . Surprisingly, B2 students exhibit more pauses (median at 34.3 pauses/min/speaker) compared with B1 students (30.7), with a significant difference at p < 0.01 . However, the mean duration of their pauses is shorter (592 ms) compared with B1 students (615 ms) at a significance level of p < 0.01 . The ratio between the total pause duration and the speech duration for each speaker is similar between the two groups (median at 33% for both, with no significant difference). In summary, B2 students produce more frequent yet shorter pauses compared with B1 students, maintaining the same proportion of silence.
To further analyze the structural aspects, the number of pauses between clauses and within phrases was examined. As might be expected, B2 students make on average more pauses between clauses (47 pauses) compared with B1 students (42), demonstrating a significant difference at p < 0.05 . Nonetheless, they display the same quantity of pauses within phrases (14 and 15 pauses, respectively). Figure 2 shows that, with an equal number of tokens, students can have a significantly varied number of intra-phrase pauses (such as 10 or 36 pauses for two B2 students at 500 tokens). However, the variation for inter-clause pauses is much narrower.
When comparing the number of pauses per 100 tokens to mitigate the effect of speech quantity, B2 speakers make significantly less pauses within phrases than B1 speakers (4.2% for B1 and 3.4% for B2 at p < 0.005 ), but there are as many of them at clause boundaries (10.9% for B1 and 10.6% for B2, exhibiting no significant difference). Figure 3 shows that there is no observable correlation between the proportion of pauses between clauses and within phrases for both groups.
Furthermore, the pausing patterns at the lexical level between B1 and B2 were analyzed. We now focus on the immediate syntactic context of pauses within the top 15 most frequent consecutive POS pairs noted in the corpus. The proportion of occurrences with a pause was calculated for each pair within both the B1 and B2 subcorpora. This analysis enabled a comparison of pausing tendencies between B1 and B2 students within each context. As shown in Figure 4, despite a subtle difference, the results show that B2 students generally make fewer pauses than B1 students within these 15 contexts, with the largest gaps observed between nouns and pronouns (−4 points), nouns and coordination conjunctions (−3.5 points), and subordinate conjunctions (SCONJ) and pronouns (−3.4 points). Notably, these contexts are likely to be clause boundaries, which contradicts the hypothesis that B2 students make more pauses between clauses to enhance speech structure. However, B2 students noticeably make more pauses than B1 students in two contexts: between nouns and prepositions (ADP, +4.2 points) and between verbs and determinants (DET, +2.7 points), which likely indicate phrase boundaries.
The unsupervised co-clustering method (Singh Bhatia et al. 2017) was applied to students and their pausing patterns within the 15 analyzed contexts. As a result, three distinct student clusters were identified, as depicted in Figure 5. These clusters exhibit two predominant profiles that are primarily differentiated by the overall frequency of pauses (clusters 1 and 2). Additionally, there is an additional cluster (cluster 0, on the left) consisting of students with extreme values, likely due to insufficient observations in certain contexts, leading to a less homogeneous group of speakers. Cluster 2 demonstrated a higher frequency of pauses across all 15 contexts, and encompassed 53% of B2 students and 42% of B1 students. In contrast, cluster 1 included 28% of B2 students and 29% of B1 students, and cluster 0 consisted of 19% of B2 students and 29% of B1 students.
The disparity in pause frequency between clusters 1 and 2 within each context was significantly larger than the differences observed between the B1 and B2 proficiency levels. However, while cluster 2 has almost half the number of students compared to cluster 1, the distributions of pause frequencies per context showed wider ranges of values (cf. Figure 6).
When plotting the proportions of inter-clausal and intra-phrasal pauses for each speaker from clusters 1 and 2 (cf. Figure 7), it is evident that there is no significant correlation between both types of pauses among students from cluster 1. However, there is one among those of cluster 2, in which students who make more inter-clausal pauses tend to make fewer intra-phrasal ones ( R = 0.3 , p < 0.05 ).

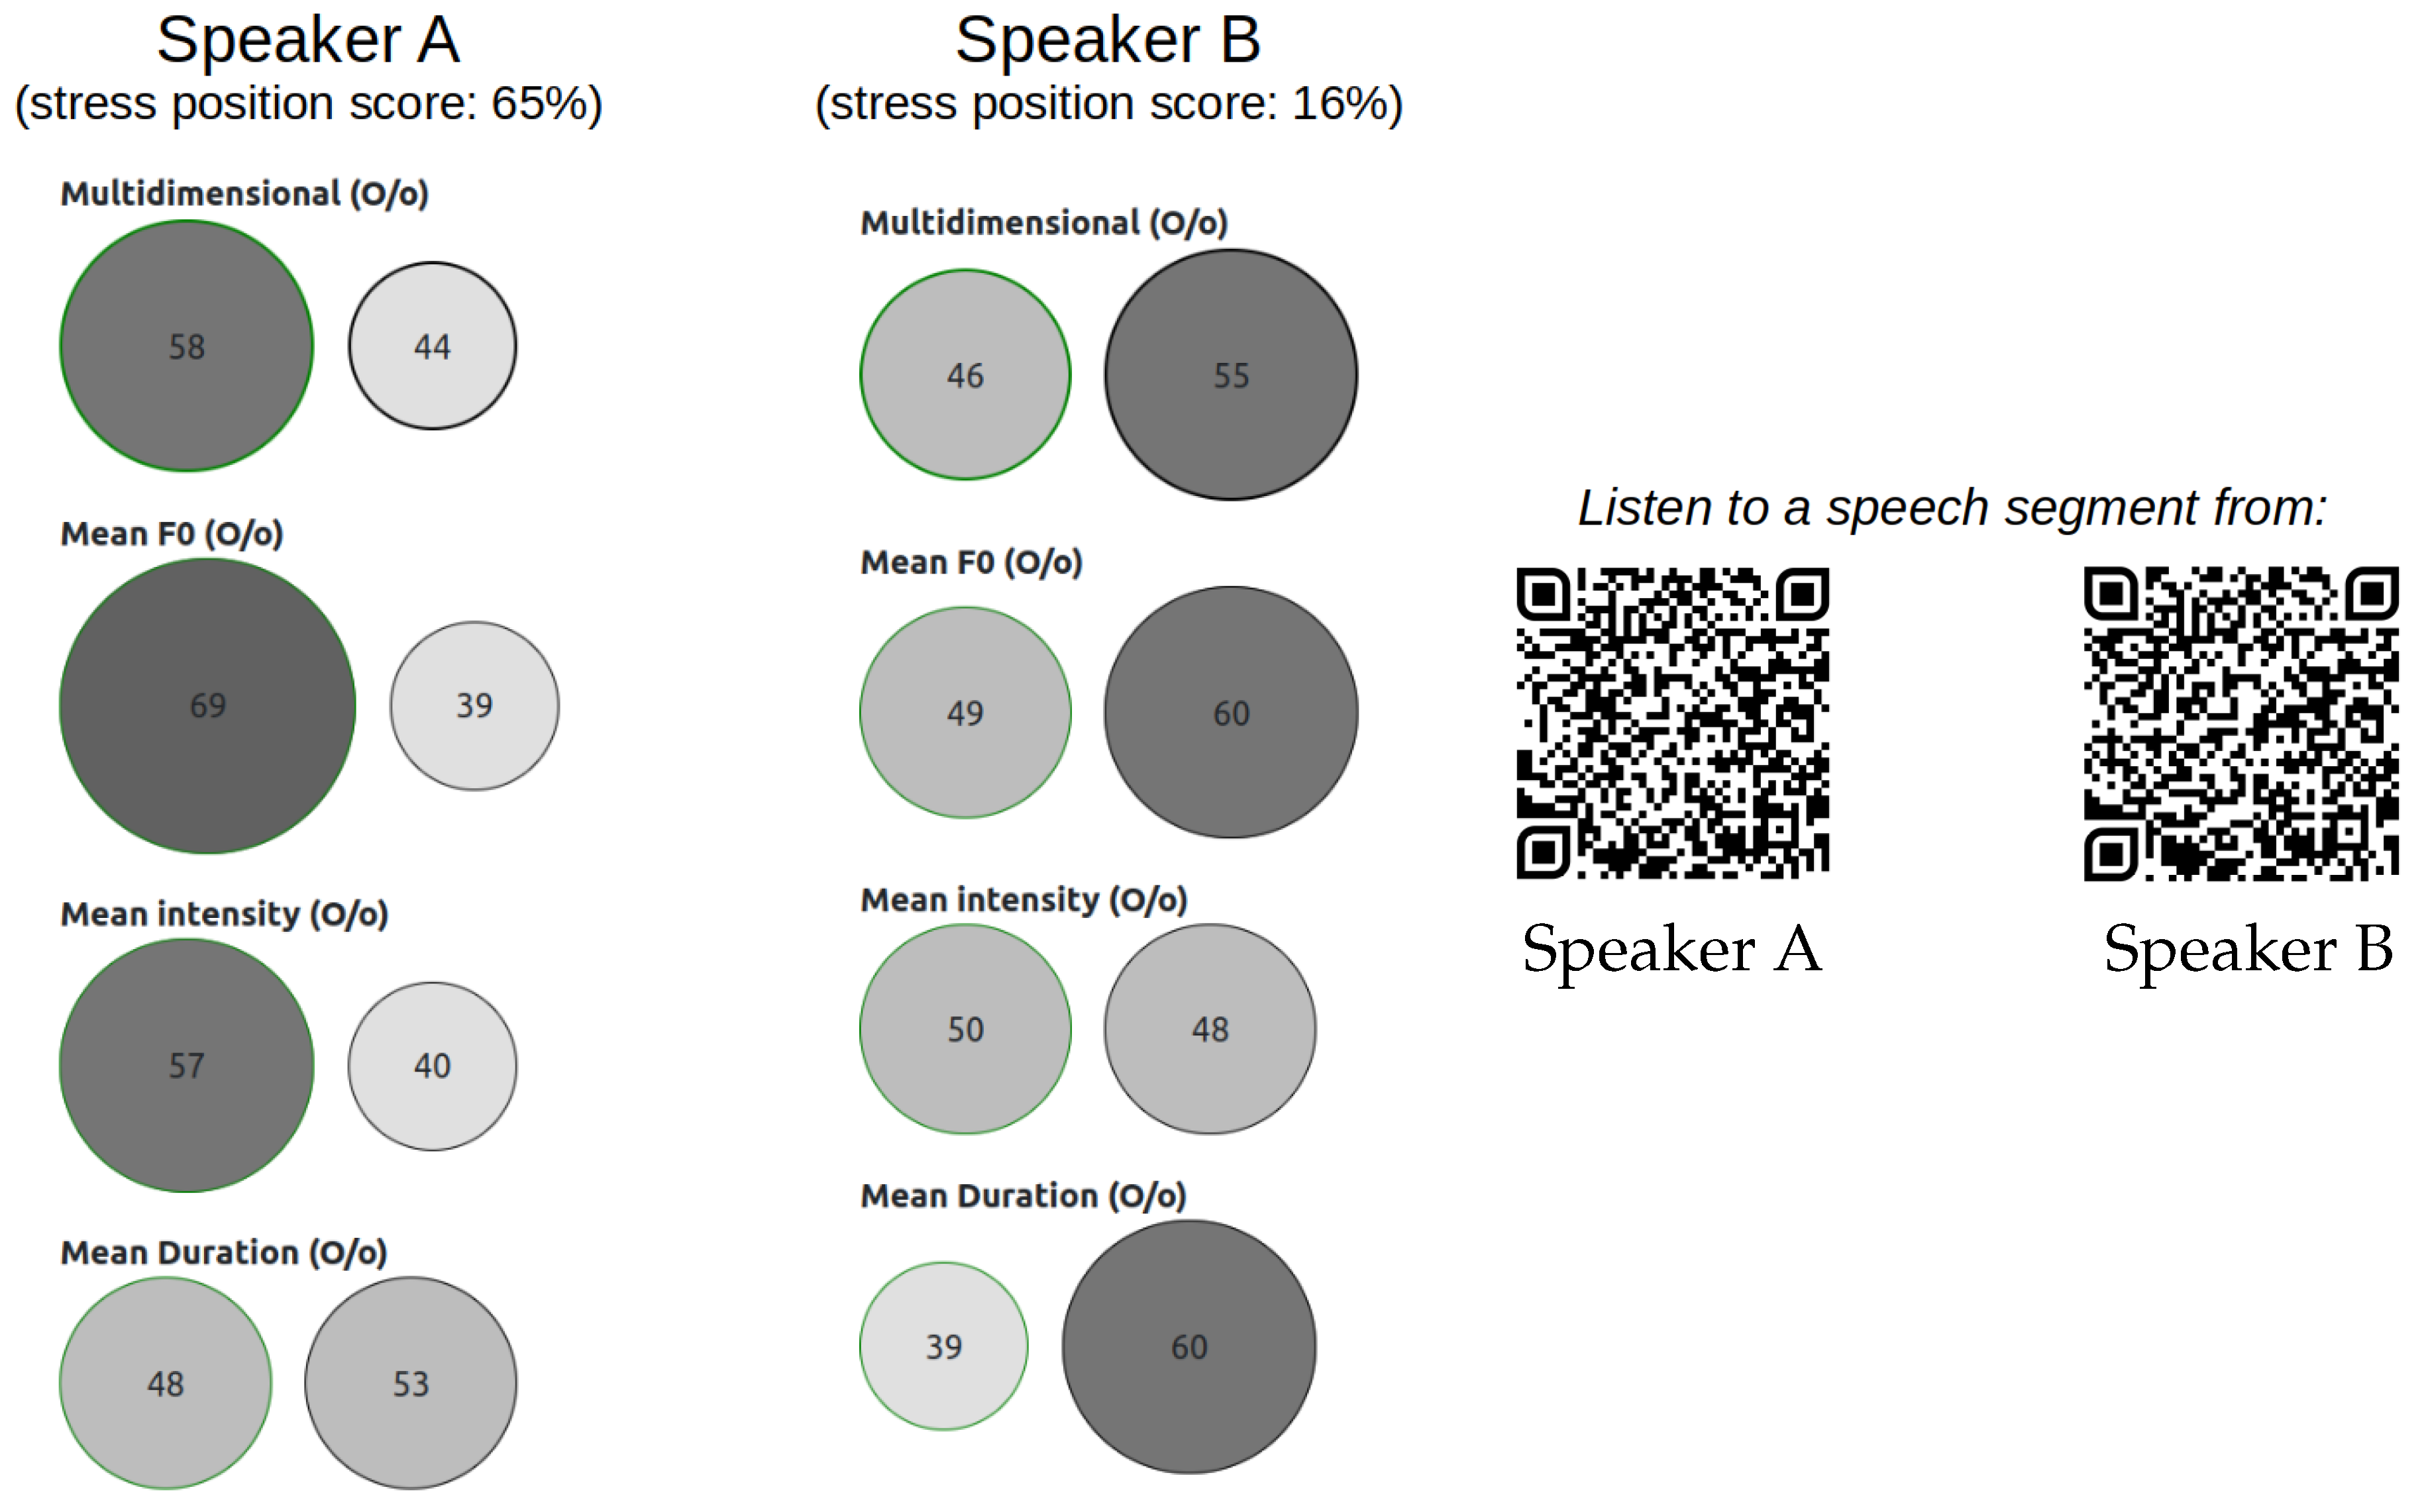
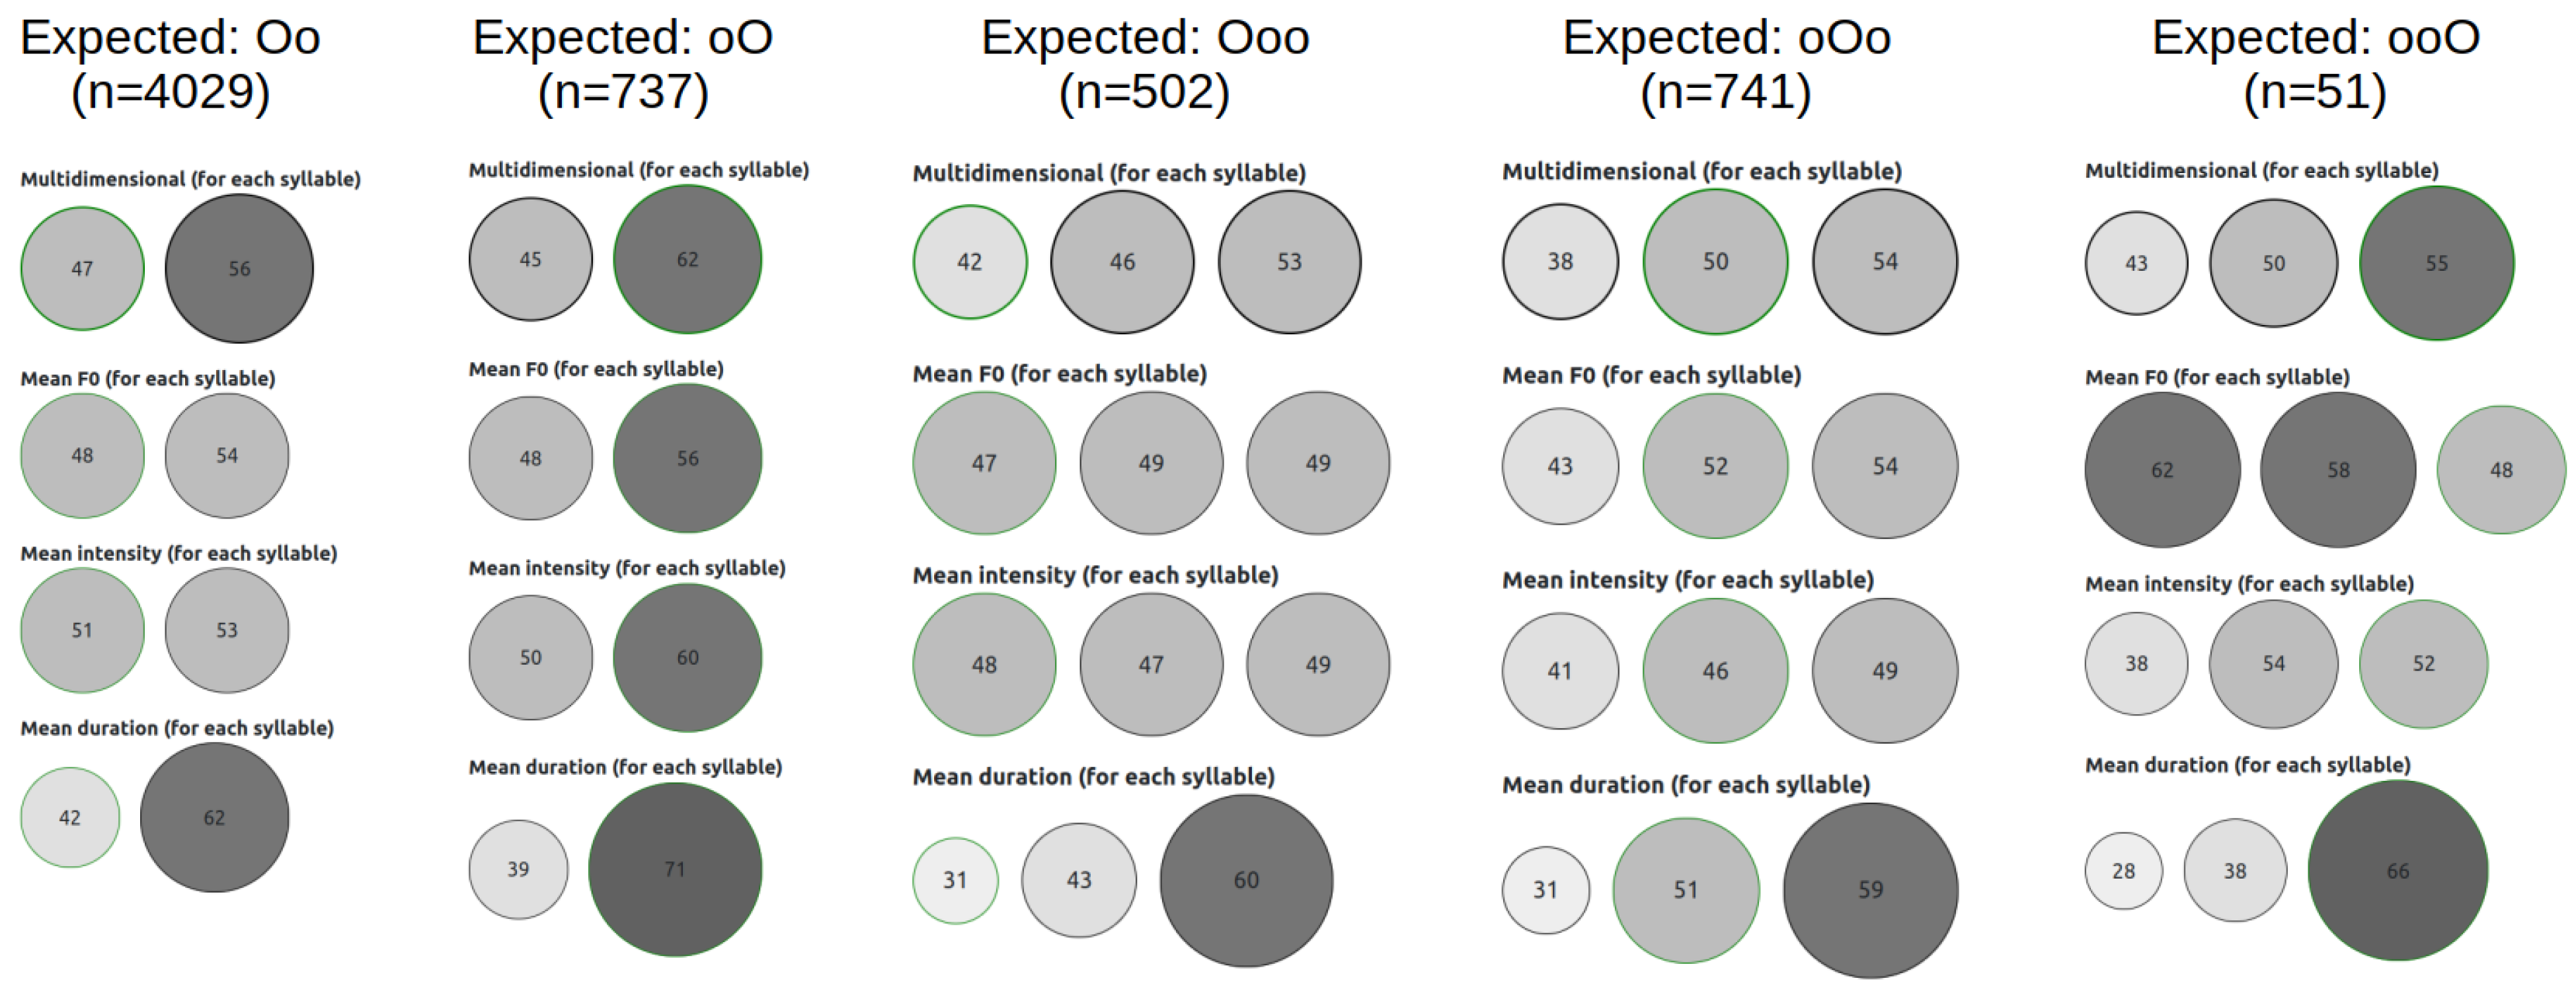
5.2. Lexical Stress Analysis

This section investigates the position and quality of the prominent syllables among the 6350 target words in the corpus. Among these words, the nouns constitute 57%, verbs 18%, adverbs 13%, and adjectives 12%. The majority of these words consist of two syllables (74%), while 20% are composed of three syllables, 5% of four syllables, and 1% of five syllables. B2 proficiency learners, due to their higher speech rate, demonstrate a significantly higher number of target words compared with B1 learners (median at 47 words at the B2 level and 32 at the B1 level, with a significant difference at p < 0.001). However, the difference in the proportion of the target words given the number of content words per speaker is not statistically significant (25% for B2 and 24% for B1). As a result, the word recognition rate does not vary significantly between the two groups.
The initial inquiry explored the proportion of words pronounced with the expected stress position, revealing that only 35.4% of the corpus exhibited an alignment between the expected and observed word shapes. When examining this rate for each speaker individually, it ranged from 0% to 68.4% with a median value of 33.3%.
The second investigation aimed to determine whether B2 learners achieve a higher stress position score compared with B1 learners. While both groups’ distributions are widely dispersed and significantly overlap, on average, B2 learners significantly outperform B1 group, with expected stress position rates of 36% compared with 29.6%, and a significant difference at p < 0.0001. Figure 8 shows a projection of each speaker on the basis of their stress position score and number of target words. Only two B1 speakers surpassed 50%, while 26 B2 speakers (representing 22% of the B2 group) achieved this level.
The percentage of words with incorrect stress position increases proportionally with the number of syllables: 62% for two-syllable words, 70% for three-syllable words, 79% for four-syllable words, and 81% for five-syllable words. In Figure 9, the production of each expected word shape by all speakers can be observed. Notably, 85% of two-syllable words are expected to have stress on the first syllable; however, only 31% of these occurrences carry stress on the first syllable, while 69% receive stress on the last syllable. Conversely, the majority of expected oO-shape words (79%) are correctly stressed. A similar pattern emerges for three- and four-syllable words, where most words are effectively stressed on the last syllable, despite this being relatively rare in English, as stress is predominantly expected on the second or first syllable.
Comparing the production of each expected shape by B1 and B2 speakers did not reveal significant differences between the two groups. Along with the proficiency level, the correct stress position increases by 12 points for expected oOo-shape, 7 points for expected Oo-shape, and 6 points for expected Ooo-shape words. Interestingly, there is a slight five-point decrease in correct stress position for expected oO-shape words, which could be attributed to hyper-correction.
Note that, overall, 14 out of the 20 most frequent target words with correct stress position in the corpus also appear among the top 20 most frequently misplaced stress words (such as “maybe”, “students”, “computer”, or “people”). Frequent words, in most cases, continue to be incorrectly stressed.
Figure 10 shows the average contrast between stressed and unstressed syllables in words produced by two B2 proficiency level speakers. Speaker A correctly stressed 65% of her words, while speaker B achieved only 16% accuracy in stress placement. The number inside each circle refers to the speaker-normalized centile value of prominence (the higher, the more prominent). For speaker A, the expected stressed syllables were on average 30 points higher in F0 compared with the adjacent syllables, along with a 17-point higher amplitude, while the duration remained almost unchanged (−4 points). This resulted in a mean acoustic contrast of a 14-point increase for the expected stressed syllable. In contrast, speaker B demonstrated a negative contrast due to the tendency to emphasize the wrong syllable (often the last one). The expected stressed syllable was on average 21-point shorter and 11-point lower in F0, with no noticeable change in intensity (+3 points). This pattern was also observed with other speakers scoring high or low in the stress position. The former group accentuated words primarily by increasing the F0, then intensity, with no significant change in duration, while the latter group consistently increased the duration of unstressed syllables, along with an F0 increase and no noticeable change in intensity.
As shown in Figure 11, for all speakers, regardless of their stress position score, the prominent syllable is mainly characterized by a longer duration (increase of +20% and +32% for expected Oo and oO shapes, and +23%, +18%, and +33% relative to the mean duration of unstressed syllables for expected Ooo, oOo, and ooO shapes). The changes in F0 and intensity are less pronounced, with increases of +6% and +8% in F0, and +2% and +10% in intensity for expected Oo and oO shapes, respectively, and +1%, +6%, and −12% in F0, and +2%, +5%, and +6% in intensity relative to the mean of unstressed syllables for expected Ooo, oOo, and ooO shapes, respectively.
The difference in the mean acoustic contrast between expected stressed and unstressed syllables among the B1 and B2 proficiency groups is statistically significant (median at −7 for B1 and −3 for B2 speakers, with p < 0.0001), and strongly correlated with the proportion of words with the expected stress position for both proficiency groups ( R = 0.82 , p < 0.0001 , cf. Figure 12).

6. Discussion

We analyzed the pausing patterns and lexical stress, along with the degree of prosodic contrast between stressed and unstressed syllables, in the spontaneous English speech of 176 French students at the B1 and B2 speaking proficiency levels. As expected, B2 students exhibited a significantly lower proportion of pauses within phrases (which are more likely to impede the speech), while showing a higher absolute number of pauses between clauses (which are more likely to help structuring it). The absence of a significant difference in the proportion of inter-clause pauses might be attributed to the more complex syntax in B2 speech, leading to an increased number of clause boundaries (significant difference at p < 0.001 for both proportion and absolute number of clause boundaries). Interestingly, the frequency of pauses within phrases varied considerably among speakers, irrespective of their proficiency level. Additionally, both B1 and B2 students demonstrated a similar distribution of pauses across the 15 most frequent parts-of-speech contexts, with slightly fewer pauses observed for B2 students, even in contexts where pauses are expected to have a positive structuring effect.
We used unsupervised clustering to group students on the basis of their pause frequency in each context. This clustering approach revealed clusters comprising a mix of B1 and B2 students, primarily distinguished by the overall frequency of pauses. Specifically, students in cluster 2 exhibited substantially more pauses than those in cluster 1, demonstrating a negative correlation between inter-clause and intra-phrase pauses. This correlation was not evident among students in cluster 1, nor when considering all students collectively or when comparing B1 and B2 groups. In future work, we plan to investigate pause patterns in a more qualitative way, analyzing intra-speaker variation.
Regarding lexical stress, our analysis showed that only 35.4% of the 6350 polysyllabic plain words in the corpus had stress placed on the expected syllable. There was a significant range of variation among speakers, spanning from 0% to 68.4% of stress position accuracy. Notably, B2 students achieved a significantly higher score (36%) compared with B1 students (29.6%). As expected, we observed a consistent pattern of stress predominantly falling on the last syllable of words, irrespective of the expected prosodic shape and syllable count. Furthermore, stress placement was significantly influenced by syllable duration, with substantial variation in F0 and intensity principally among speakers demonstrating a high stress position accuracy.
One main limitation of our current work is that we amalgamated the three prosodic dimensions into a single global “observed shape” without weighting them, potentially overlooking their varying contributions to prominence. Considering previous theories, like Bolinger’s Pitch theory of accent Bolinger (1958), which assigns a predominant role to F0 patterns in determining stress position, it may be prudent to assign more weight to F0 than the other dimensions. Nevertheless, duration also emerges as a significant feature, given its characteristic variation among syllables in stress-timed languages like English (Grabe and Low 2002). When considering F0 alone to determine stress position, approximately 42% of words had expected stress placement (36% for B1 speakers, 44% for B2 speakers). Alternatively, using intensity alone increased this percentage to 45% (39% for B1, 48% for B2). However, relying solely on duration resulted in a decrease to 30% (for both B1 and B2 speakers).
Another limitation concerns the extraction of prosodic features. Our current approach involves recording F0 at syllable nuclei positions, but we did not consider its variation within the vowel. Because stressed syllables typically show a wide pitch movement, it would be beneficial to explore additional measures such as the minimum, maximum, mean, and direction of F0 variation within the vowel segment. Moreover, to enhance the accuracy, it would be more appropriate to consider only the vowel duration rather than the entire syllable. Consonant presence, especially the lengthening of final fricatives, could affect the syllable duration.
Regarding the precision of automated annotations, although 95 manually evaluated words out of 100 were correctly aligned to the signal, it seems that WhisperX word alignment tends to trim the edges of words, resulting in shortened initial and final syllables. To improve the precision of the stress detection system, we implemented in a new release of the pipeline, namely the Montreal Forced Aligner (McAuliffe et al. 2017), whose word boundaries more accurately encompass initial and final consonants. Moreover, its phoneme-level alignment enables the extraction of prosodic features within the vowel segments, along with syllable nuclei detection to guarantee better results. At the current stage, however, this new pipeline is less appropriated to spontaneous speech because of the Montreal aligner sensitivity to disfluencies.
The reader might also wonder how the pipeline would perform with native speakers of English. In a parallel and ongoing study (Sugahara et al. 2024, submitted), we applied a new version of the pipeline implementing the Montreal Forced Aligner to 17 native speakers of English reading a set of sentences. Among the 541 target words, the stress position accuracy was 79%, with a very clear contrast on the three prosodic dimensions (mean difference between stressed and unstressed syllables): 26 points for F0, 33 for intensity, and 25 for duration. As a comparison, the same pipeline was applied to a reading task with 144 French-L1 English major first-year university students from the PIC corpus (Frost 2023). Among the 3838 target words, the stress position accuracy was 57%, with a less significant mean prosodic contrast (two points for F0, nine for intensity, and five for duration). Further analysis will be conducted on both datasets and published soon, and a similar study will be carried out on spontaneous speech from native speakers as well.

7. Conclusions

This paper introduced an automated pipeline to analyze pause positions, lexical stress placement, and stress contrast in spontaneous English speech, presenting a comprehensive comparison of results obtained from French B1 and B2 proficiency speakers. The pipeline showed potential for enhancing the stress placement estimation accuracy. Moreover, it successfully measures the pause quantities between clauses and within phrases, along with the proportion of polysyllabic plain words with expected stress position. It also evaluates the degree of prosodic contrast between stressed and unstressed syllables across three prosodic dimensions: F0, intensity, and duration.
The focus on pause positions and stress parameters stems from their theoretical impact on the listener’s ease of comprehending the speaker. Our next research step involves investigating the actual relationship between perceived effort to understand and the presence/absence of pauses at specific positions, the expected/unexpected placement of lexical stress, and the high/low prosodic contrast between the stressed and unstressed syllables. To accomplish this, we plan to recruit approximately 50 native English listeners and ask them to indicate instances when they perceive a particular effort in understanding the speaker while listening to selected recordings. These recordings will be selected on the basis of the number of inter-clause and intra-phrase pauses, as well as level of stress accuracy, and the pipeline will facilitate a precise examination of the co-occurrence of targeted phenomena and perceived effort signals. Our test protocol is inspired by de Kok (2013) and shares similarities with the approach used by Nagle et al. (2019), although in our case, it will involve unidirectional and non-cumulative judgment.
If a noticeable correlation is observed between comprehensibility and pause and lexical stress patterns, the processing pipeline will be modified to enable individual learners to record themselves through a web application and receive immediate feedback pointing out which pauses were unexpected and potentially disturbing, where to put structuring pauses that could help the listener to process the speech, and which words were inadequately stressed.

Author Contributions

Conceptualization, S.C., M.M. and S.R.; methodology, S.C.; software, S.C.; validation, S.R. and T.K.; formal analysis, S.C.; investigation, S.C.; resources, S.C. and M.M.; data curation, S.C.; writing—original draft preparation, S.C.; writing—review and editing, S.R. and T.K.; visualization, S.C.; supervision, M.M.; project administration, S.C.; funding acquisition, M.M. and T.K. All authors have read and agreed to the published version of the manuscript.

Funding

This work was supported by JSPS KAKENHI n°23H00648. The authors thank the IDEX for funding S.C. mobility grant.

Institutional Review Board Statement

This study has been conducted in accordance with ethical standards and guidelines established by the CLES’s Ethics Committee. The committee granted formal approval for this research project on 24 March 2022. All aspects of the study, including data collection, analysis, and reporting, have been conducted in adherence to the ethical principles outlined in the approved protocol.

Informed Consent Statement

Informed consent was obtained from all subjects involved in this study.

Data Availability Statement

The complete processing pipeline is open source and freely available here: https://gricad-gitlab.univ-grenoble-alpes.fr/lidilem/plspp (accessed on 1 February 2024). Most of the recorded audio data and metadata are publicly available, please contact [email protected].

Acknowledgments

AI language models, including ChatGPT by OpenAI and DeepL, was used for refining and enhancing the manuscript’s written English.

Conflicts of Interest

The authors declare no conflicts of interest. The funders had no role in the design of the study; in the collection, analyses, or interpretation of data; in the writing of the manuscript; or in the decision to publish the results.

Notes

1
See https://www.certification-cles.fr/english/ (accessed on 1 February 2024).
2
The complete processing pipeline is open source and freely available here: https://gricad-gitlab.univ-grenoble-alpes.fr/lidilem/plspp (accessed on 1 February 2024).
3
This dictionary is available at http://www.speech.cs.cmu.edu/cgi-bin/cmudict (accessed on 1 February 2024).

References

  1. Adams, Corinne. 1979. English Speech Rhythm and the Foreign Learner. Berlin and Boston: De Gruyter Mouton. [Google Scholar] [CrossRef]
  2. Astesano, Corine. 2001. Rythme et Accentuation en Français: Invariance et Variabilité Stylistique. Collection Langue & Parole. Paris: L’Harmattan. [Google Scholar]
  3. Bain, Max, Jaesung Huh, Tengda Han, and Andrew Zisserman. 2023. Whisperx: Time-accurate speech transcription of long-form audio. arXiv arXiv:2303.00747. [Google Scholar]
  4. Bolinger, Dwight L. 1958. A theory of pitch accent in english. WORD 14: 109–49. [Google Scholar] [CrossRef]
  5. Bredin, Hervé, and Antoine Laurent. 2021. End-to-end speaker segmentation for overlap-aware resegmentation. arXiv arXiv:2104.04045. [Google Scholar]
  6. Calbris, Geneviève, and Jacques Montredon. 1975. Approche Rythmique, Intonative et Expressive du Français Langue Étrangère: Sketches-Exercices-Illustrations-Photos-Cartes d’Expression: Les Exercices ont Éné Expérimentés au Centre de Linguistique Appliquée de Besançon. Paris: CLES International. [Google Scholar]
  7. Campione, Estelle, and Jean Véronis. 2002. A large-scale multilingual study of silent pause duration. Paper presented at Speech Prosody 2002, Aix-En-Provence, France, April 11–13; pp. 199–202. [Google Scholar]
  8. Candéa, Maria. 2000. Contribution à l’étude des pauses silencieuses et des phénomènes dits «d’hésitation» en français oral spontané: Étude sur un corpus de textes en classe de français. Ph.D. thesis, Université de la Sorbonne nouvelle-Paris III, Paris, France. [Google Scholar]
  9. Cao, Yating, and Hua Chen. 2019. World englishes and prosody: Evidence from the successful public speakers. Paper presented at 2019 Asia-Pacific Signal and Information Processing Association Annual Summit and Conference (APSIPA ASC), Lanzhou, China, November 18–21; pp. 2048–52. [Google Scholar]
  10. Chen, Jin-Yu, and Lan Wang. 2010. Automatic lexical stress detection for chinese learners’ of english. Paper presented at 2010 7th International Symposium on Chinese Spoken Language Processing, Tainan, Taiwan, November 29–December 3; pp. 407–11. [Google Scholar]
  11. Chen, Liang-Yu, and Jyh-Shing Jang. 2012. Stress detection of english words for a capt system using word-length dependent gmm-based bayesian classifiers. Interdisciplinary Information Sciences 18: 65–70. [Google Scholar] [CrossRef]
  12. Cooper, Nicole, Anne Cutler, and Roger Wales. 2002. Constraints of lexical stress on lexical access in english: Evidence from native and non-native listeners. Language Speech 45: 207–28. [Google Scholar] [CrossRef]
  13. Coulange, Sylvain. 2023. Computer-aided pronunciation training in 2022: When pedagogy struggles to catch up. In Proceedings of the 7th International Conference on English Pronunciation: Issues and Practices. Edited by Alice Henderson and Anastazija Kirkova-Naskova. Grenoble: Université Grenoble-Alpes, pp. 11–22. [Google Scholar] [CrossRef]
  14. Council of Europe. 2020. Common European Framework of Reference for Languages. Strasbourg: Council of Europe. [Google Scholar]
  15. Cutler, Anne. 2015. Lexical stress in english pronunciation. In The Handbook of English Pronunciation. Hoboken: John Wiley & Sons, Inc., pp. 106–24. [Google Scholar]
  16. Cutler, Anne, and Alexandra Jesse. 2021. Word Stress in Speech Perception. Hoboken: John Wiley & Sons, Ltd., chp. 9. pp. 239–65. [Google Scholar] [CrossRef]
  17. de Jong, Nivja H., Jos Pacilly, and Willemijn Heeren. 2021. Praat scripts to measure speed fluency and breakdown fluency in speech automatically. Assessment in Education: Principles, Policy & Practice 28: 456–76. [Google Scholar] [CrossRef]
  18. de Kok, Iwan Adrianus. 2013. Listening Heads. Ph.D. thesis, University of Twente, Enschede, The Netherlands. [Google Scholar] [CrossRef]
  19. Derwing, Tracey M., and Murray J. Munro. 2015. Pronunciation Fundamentals: Evidence-Based Perspectives for L2 Teaching and Research. Amsterdam: John Benjamins. [Google Scholar]
  20. Deshmukh, Om, and Ashish Verma. 2009. Nucleus-level clustering for word-independent syllable stress classification. Speech Communication 51: 1224–33. [Google Scholar] [CrossRef]
  21. Duez, Danielle. 1982. Silent and non-silent pauses in three speech styles. Language and Speech 25: 11–28. [Google Scholar] [CrossRef]
  22. Dupoux, Emmanuel, Christophe Pallier, Nuria Sebastian, and Jacques Mehler. 1997. A destressing “deafness” in french? Journal of Memory and Language 36: 406–21. [Google Scholar] [CrossRef]
  23. Evanini, Keelan, and Klaus Zechner. 2019. Overview of automated speech scoring. In Automated Speaking Assessment. Innovations in Language Learning and Assessment at ETS. London: Routledge, pp. 3–20. [Google Scholar] [CrossRef]
  24. Ferrer, Luciana, Harry Bratt, Colleen Richey, Horacio Franco, Victor Abrash, and Kristin Precoda. 2015. Classification of lexical stress using spectral and prosodic features for computer-assisted language learning systems. Speech Communication 69: 31–45. [Google Scholar] [CrossRef]
  25. Field, John. 2005. Intelligibility and the listener: The role of lexical stress. TESOL Quarterly 39: 399–423. [Google Scholar] [CrossRef]
  26. Frost, Dan. 2023. Prosodie, Intelligibilité, Communication (PIC). ORTOLANG (Open Resources and TOols for LANGuage). Available online: www.ortolang.fr (accessed on 1 February 2024).
  27. Gibbon, Dafydd, and Ulrike Gut. 2001. Measuring speech rhythm. Paper presented at 7th European Conference on Speech Communication and Technology (Eurospeech 2001), Aalborg, Denmark, September 3–7; pp. 95–98. [Google Scholar] [CrossRef]
  28. Grabe, Esther, and Ee Ling Low. 2002. Durational variability in speech and the rhythm class hypothesis. Papers in Laboratory Phonology 7: 515–46. [Google Scholar]
  29. Grosman, Iulia, Anne Catherine Simon, and Liesbeth Degand. 2018. Variation de la durée des pauses silencieuses: Impact de la syntaxe, du style de parole et des disfluences. Langages 211: 13–40. [Google Scholar] [CrossRef]
  30. Honnibal, Matthew, Ines Montani, Sofie Van Landeghem, and Adriane Boyd. 2020. Spacy: Industrial-Strength Natural Language Processing in Python. Available online: https://zenodo.org/records/10009823 (accessed on 1 August 2023). [CrossRef]
  31. Isaacs, Talia, Pavel Trofimovich, and Jennifer Ann Foote. 2018. Developing a user-oriented second language comprehensibility scale for english-medium universities. Language Testing 35: 193–216. [Google Scholar] [CrossRef]
  32. Johnson, David O., and Okim Kang. 2015. Automatic prominent syllable detection with machine learning classifiers. International Journal of Speech Technology 18: 583–92. [Google Scholar] [CrossRef]
  33. Kitaev, Nikita, Steven Cao, and Dan Klein. 2019. Multilingual constituency parsing with self-attention and pre-training. In ACL. Florence: Association for Computational Linguistics, pp. 3499–505. [Google Scholar]
  34. Li, Chaolei, Jia Liu, and Shanhong Xia. 2007. English sentence stress detection system based on HMM framework. Applied Mathematics and Computation 185: 759–68. [Google Scholar] [CrossRef]
  35. Li, Kun, Shaoguang Mao, Xu Li, Zhiyong Wu, and Helen Meng. 2018. Automatic lexical stress and pitch accent detection for L2 English speech using multi-distribution deep neural networks. Speech Communication 96: 28–36. [Google Scholar] [CrossRef]
  36. Lickley, Robin. 2015. Fluency and Disfluency. Chichester: Wiley Online Library, pp. 445–69. [Google Scholar] [CrossRef]
  37. McAuliffe, Michael, Michaela Socolof, Sarah Mihuc, Michael Wagner, and Morgan Sonderegger. 2017. Montreal Forced Aligner: Trainable Text-Speech Alignment Using Kaldi. Paper presented at Interspeech 2017, Stockholm, Sweden, August 20–24; pp. 498–502. [Google Scholar] [CrossRef]
  38. Munro, Murray J., and Tracey M. Derwing. 2015. Intelligibility in Research and Practice. Hoboken: John Wiley & Sons, Ltd., chp. 21. pp. 375–96. [Google Scholar] [CrossRef]
  39. Nagle, Charles, Pavel Trofimovich, and Annie Bergeron. 2019. Toward a dynamic view of second language comprehensibility. Studies in Second Language Acquisition 41: 647–72. [Google Scholar] [CrossRef]
  40. Singh Bhatia, Parmeet, Serge Iovleff, and Gérard Govaert. 2017. blockcluster: An R package for model-based co-clustering. Journal of Statistical Software 76: 1–24. [Google Scholar]
  41. Sugahara, Mariko, Sylvain Coulange, and Tsuneo Kato. 2024. English lexical stress in awareness and production: Native and non-native speakers. Paper presented at 19th LabPhon Conference, Seoul, Republic of Korea, June 27–29. [Google Scholar]
  42. Tauberer, Joshua. 2008. Predicting intrasentential pauses: Is syntactic structure useful? Paper presented at Speech Prosody 2008, Campinas, Brazil, May 6–9; pp. 405–8. [Google Scholar]
  43. Tavakoli, Parvaneh. 2010. Pausing patterns: Differences between L2 learners and native speakers. ELT Journal 65: 71–79. [Google Scholar] [CrossRef]
  44. Tepperman, Joseph, and Shrikanth Narayanan. 2005. Automatic syllable stress detection using prosodic features for pronunciation evaluation of language learners. Paper presented at Proceedings. (ICASSP ’05). IEEE International Conference on Acoustics, Speech, and Signal Processing, Philadelphia, PA, USA, March 23; vol. 1, pp. 937–40. [Google Scholar]
  45. Tortel, Anne. 2021. Le rythme en anglais oral: Considérations théoriques et illustrations sur corpus. Recherche et Pratiques Pédagogiques en Langues 40. [Google Scholar] [CrossRef]
  46. Tortel, Anne, and Daniel Hirst. 2010. Rhythm metrics and the production of English L1/L2. Paper presented at Speech Prosody 2010-Fifth International Conference, Chicago, IL, USA, May 11–14. paper 959. [Google Scholar]
  47. Trouvain, Jürgen. 2004. Tempo Variation in Speech Production: Implications for Speech Synthesis. Ph.D. thesis, Saarland University, Saarbrücken, Germany. [Google Scholar]
Figure 1. Example of output from our pipeline showing POS tags (1), transcribed text (2), syllable nuclei (3), expected prosodic shape (4), observed prosodic shape (5) merged from F0, intensity and duration shapes (6). The blue line represents pitch, the green one represents intensity.
Languages 09 00078 g001
Figure 2. Absolute number of inter-clause (left) and intra-phrase (right) pauses per speaker.
Languages 09 00078 g002
Figure 3. Proportion of inter-clause and intra-phrase boundaries with a pause per speaker.
Languages 09 00078 g003
Figure 4. Proportion of POS pairs containing a pause for B1 (yellow) and B2 (black) speakers.
Languages 09 00078 g004
Figure 5. Clustering output of pausing patterns in top 15 POS contexts, speakers in columns, POS pairs in rows, with the mean value of each block. Darker areas mean fewer pauses.
Languages 09 00078 g005
Figure 6. Distributions for each block of the clustering shown in Figure 5. In columns from left to right: student clusters 0, 1, and 2.
Languages 09 00078 g006
Figure 7. Proportion of inter-clause and intra-phrase pauses per speaker from clusters 1 (red) and 2 (blue), and correlation for cluster 1 is not significant, whilst that for cluster 2 is R = 0.3 , p < 0.05 .
Languages 09 00078 g007
Figure 8. Proportion of target words with expected stress position per speaker.
Languages 09 00078 g008
Figure 9. For each expected shape in the columns, the number of words for each observed shape is shown.
Languages 09 00078 g009
Figure 10. Mean centile value of prominence for expected stressed (first circle) and reduced (second circle) syllables in each dimension for speaker A and speaker B. Listen to Speaker A and Speaker B.
Languages 09 00078 g010
Figure 11. Mean centile value of prominence for each syllable of two- and three-syllable words for all speakers together. Regardless of the expected prosodic shape, the last syllable appears to be prominent because of a longer duration.
Languages 09 00078 g011
Figure 12. Mean acoustic difference between expected stressed and reduced syllables per speaker.
Languages 09 00078 g012
Disclaimer/Publisher’s Note: The statements, opinions and data contained in all publications are solely those of the individual author(s) and contributor(s) and not of MDPI and/or the editor(s). MDPI and/or the editor(s) disclaim responsibility for any injury to people or property resulting from any ideas, methods, instructions or products referred to in the content.

