1. Introduction
It is well known that prosody (stress, intonation, speech rate, prosodic phrasing, among other phenomena) receives less attention than segmental pronunciation in the classroom when teaching L2 Spanish, although it appears in the official curricula of the Instituto Cervantes (
Instituto Cervantes 2006) and the
Common European Framework of Reference for Languages (CEFR) (
European Council 2020). Consequently, assessment of prosody is not usually a specific goal in the evaluation of oral expression skills of the students, and, if it appears, is only an evaluation item in tests and examinations whose main aim is the evaluation of the oral competencies of students, as in the examinations to obtain the
Diplomas de Español como Lengua Extranjera (DELE).
1 However, evaluation tasks specifically oriented to the detection of those aspects of prosody that an L2 Spanish learner should work to improve his/her oral communication (what we will call here diagnostic evaluation of prosody) are very difficult to find. This kind of evaluation is also very important for self-learning, in which the learning process must include tasks that make learners conscious of the prosodic elements which need to be improved to enhance their oral skills.
Diagnostic evaluation of Spanish prosody has been attempted in some fields close to L2 Spanish learning, such as Psychology or Speech Therapy. For example, some tests for the diagnostic evaluation of Spanish intonation have been developed (
Martínez-Castilla and Peppé 2008;
Cuetos et al. 2012;
Zac 2016), whose purpose is to establish to what extent the evaluated person is able to express or perceive a given communicative function, such as the production of questions or the expression of emotions, through intonation. Also, some tests oriented to the assessment of reading skills in children include reading tasks (using isolated words or short sentences) to evaluate reading fluency (
Defior Citoler et al. 2006). However, similar diagnostic tests, which consider, for example, the different learning levels defined in the CEFR, are not available for L2 Spanish.
Another important issue which makes diagnostic evaluation of prosody difficult, at least in Spanish, is the lack of a clear definition of what is considered ‘correct’ or ‘incorrect’ when assessing prosody. Correctness in language is not a well-defined concept in which several topics are mixed, such as grammaticality, common uses, diatopic variation, adequacy to the communicative situation, communicative success or even individual characteristics. In the case of prosody, evaluation is even harder due to, for example, the lack of a clear definition of some concepts related to prosody (intonation, fluency or rhythm, among others) or the lack of literature defining what is correct or incorrect in prosody: academic reference books, such as the
Diccionario panhispánico de dudas (
RAE and ASALE 2005), the
Nueva gramática de la lengua española (
RAE and ASALE 2009–2011) or the
Libro de estilo de la lengua española (
RAE 2018), provide scarce information about what is considered a ‘correct’ or ‘adequate’ intonation, the rules to define the correct use of pauses, or the ‘correct’ speech rate to read a text or to speak in public. This lack of definition can be observed in the few protocols and rubrics which are available to assess prosody; they usually take into account only a few sets of prosodic parameters to evaluate (pauses, speech rate), and the evaluation criteria are often vague and difficult to apply. Some proposals, again coming from fields different to language learning, try to offer more precise and exhaustive criteria (
González-Trujillo et al. 2014, for example), but they leave the final decision of the assessment to the evaluator’s perception, which is in general, subjective and may be influenced by many factors. This makes prosody evaluation even harder. Much work is still needed then to define assessment methods that are objective and clear enough to be applied by teachers with no deep expertise in phonetics.
In this situation, computer-based evaluation of prosody arises as a promising alternative to human assessment procedures. The main advantage of automatic procedures is that they should be more objective, as they are based on an acoustic analysis of the speech signal. Automatic evaluation of prosody is currently an active research line in the field of speech technologies, with some promising results in some areas, such as fluency evaluation (
van Santen et al. 2009;
Coutinho et al. 2016, for example). Research is ongoing to develop automatic methods of evaluation of prosody for Spanish (
Arias et al. 2010;
Cardeñoso-Payo et al. 2014), but the obtained results have not yet allowed adequate systems to be offered for public use.
Considering this situation, the ProA (Prosody Assessment) project was designed to develop tests, rubrics, metrics and tools for diagnostic prosody assessment in Spanish and to integrate all these resources into a web tool for the online assessment of Spanish prosody, which could include some automatic evaluation methods. The current version of the tool allows prosody evaluation tasks to be carried out in an easier and faster way, partially automating some usual procedures, such as test recording or scoring, and it is expected to improve in the future by incorporating some automatic evaluation modules. However, the tool can also be used for research purposes to collect, on-site or remotely, productions of non-native speakers of Spanish and human evaluations. The goal of this paper is to describe the main characteristics and functionalities of this tool and illustrate its use for research within the ProA project with a pilot study on the correlation between human assessments and prosodic acoustic features of Spanish L2 learners, in which the assessments of human evaluators were collected using this tool.
2. The ProA Tool
2.1. Overview
The ProA tool is a web app which allows the creation, realisation and scoring of prosody evaluation tests. It has been developed to implement, in digital format, the battery of tests for diagnostic prosody evaluation designed during the ProA project (
Garrido et al. 2022), but it can also be used to create and complete new tests out of the ProA set. The app is similar to other existing CAPT tools for prosody assessment and training, such as Web Pitcher (
Niebuhr 2021), but for the moment, it includes only assessment functionalities with no specific tasks for training. However, the ProA tool offers a larger set of evaluation tasks, which are oriented to the assessment of prosody in a wide range of communicative uses, a fact which makes them suitable to evaluate the prosodic skills of L2 Spanish learners but also in other fields in which a diagnostic evaluation of prosody could be necessary, such as Speech Therapy (for the evaluation of basic communicative uses of prosody, such as the production of declarative or interrogative sentences) or Secondary School teaching (to evaluate, for example, the prosodic skills of a student when reading a text aloud in public).
The app is the result of a collaboration between the research team of the ProA project, coordinated by the first author of this paper, and Daktylios Dynamics (Barcelona, Spain), a software development company whose CEO is the second author. It is currently hosted on the server of the Phonetics Laboratory of the National Distance Education University (UNED), and it is accessible online for registered users at the UNED Virtual Phonetics Laboratory site.
2 It was initially developed as a prototype of a generic evaluation tool, but it was very useful during the pandemic as a research tool for the remote collection of speech material and evaluations.
Three different profiles of users are defined in the app that determine three different ways of using it: as a speaker (an evaluation subject), as an evaluator (who scores a previously completed test) and as an administrator. Users with the ‘speaker’ role are allowed to perform two actions: completing the assigned tests or checking the results of the evaluation(s) already completed and assessed by one or several evaluators. Users with the ‘evaluator’ role can assess already completed tests. Finally, people with an ‘administrator’ profile can create and edit contents (tests or evaluation rubrics), assign tests for completion and assign evaluations to evaluators.
2.2. Evaluation Tests
One of the goals of the ProA app was to host the battery of evaluation tests developed during the ProA project: a set of seventeen different tests for the diagnostic evaluation of prosody in different communicative situations and with different levels of linguistic complexity. This battery of tests has been designed to assess to what extent the prosody of the evaluated person is able to express different meanings or is adequate in a specific communicative situation.
Table 1 presents the full list of implemented tests and corresponding difficulty levels, which were established considering the placement of the evaluated communicative function in the CEFR curricula.
The tasks that speakers must complete in these tests can be different depending on their purpose and level: tests included in levels 1 and 2 imply mostly isolated word/sentence reading or sentence reading in a simulated situation and are rather short (usually 12/15 items); level 3 tests, however, include more complex tasks, such as text reading, unplanned production in a simulated situation or unplanned production having an image as a base material. Two different versions for each test have been developed to allow, for example, longitudinal screening of the same speaker without having to use the same evaluation items.
Tests were implemented in the app using the test development functionalities included in it, which allow administrators to add instructions, examples and items to a test. These functionalities would allow anyone with an administrator role to create other tests different from those already implemented in the app.
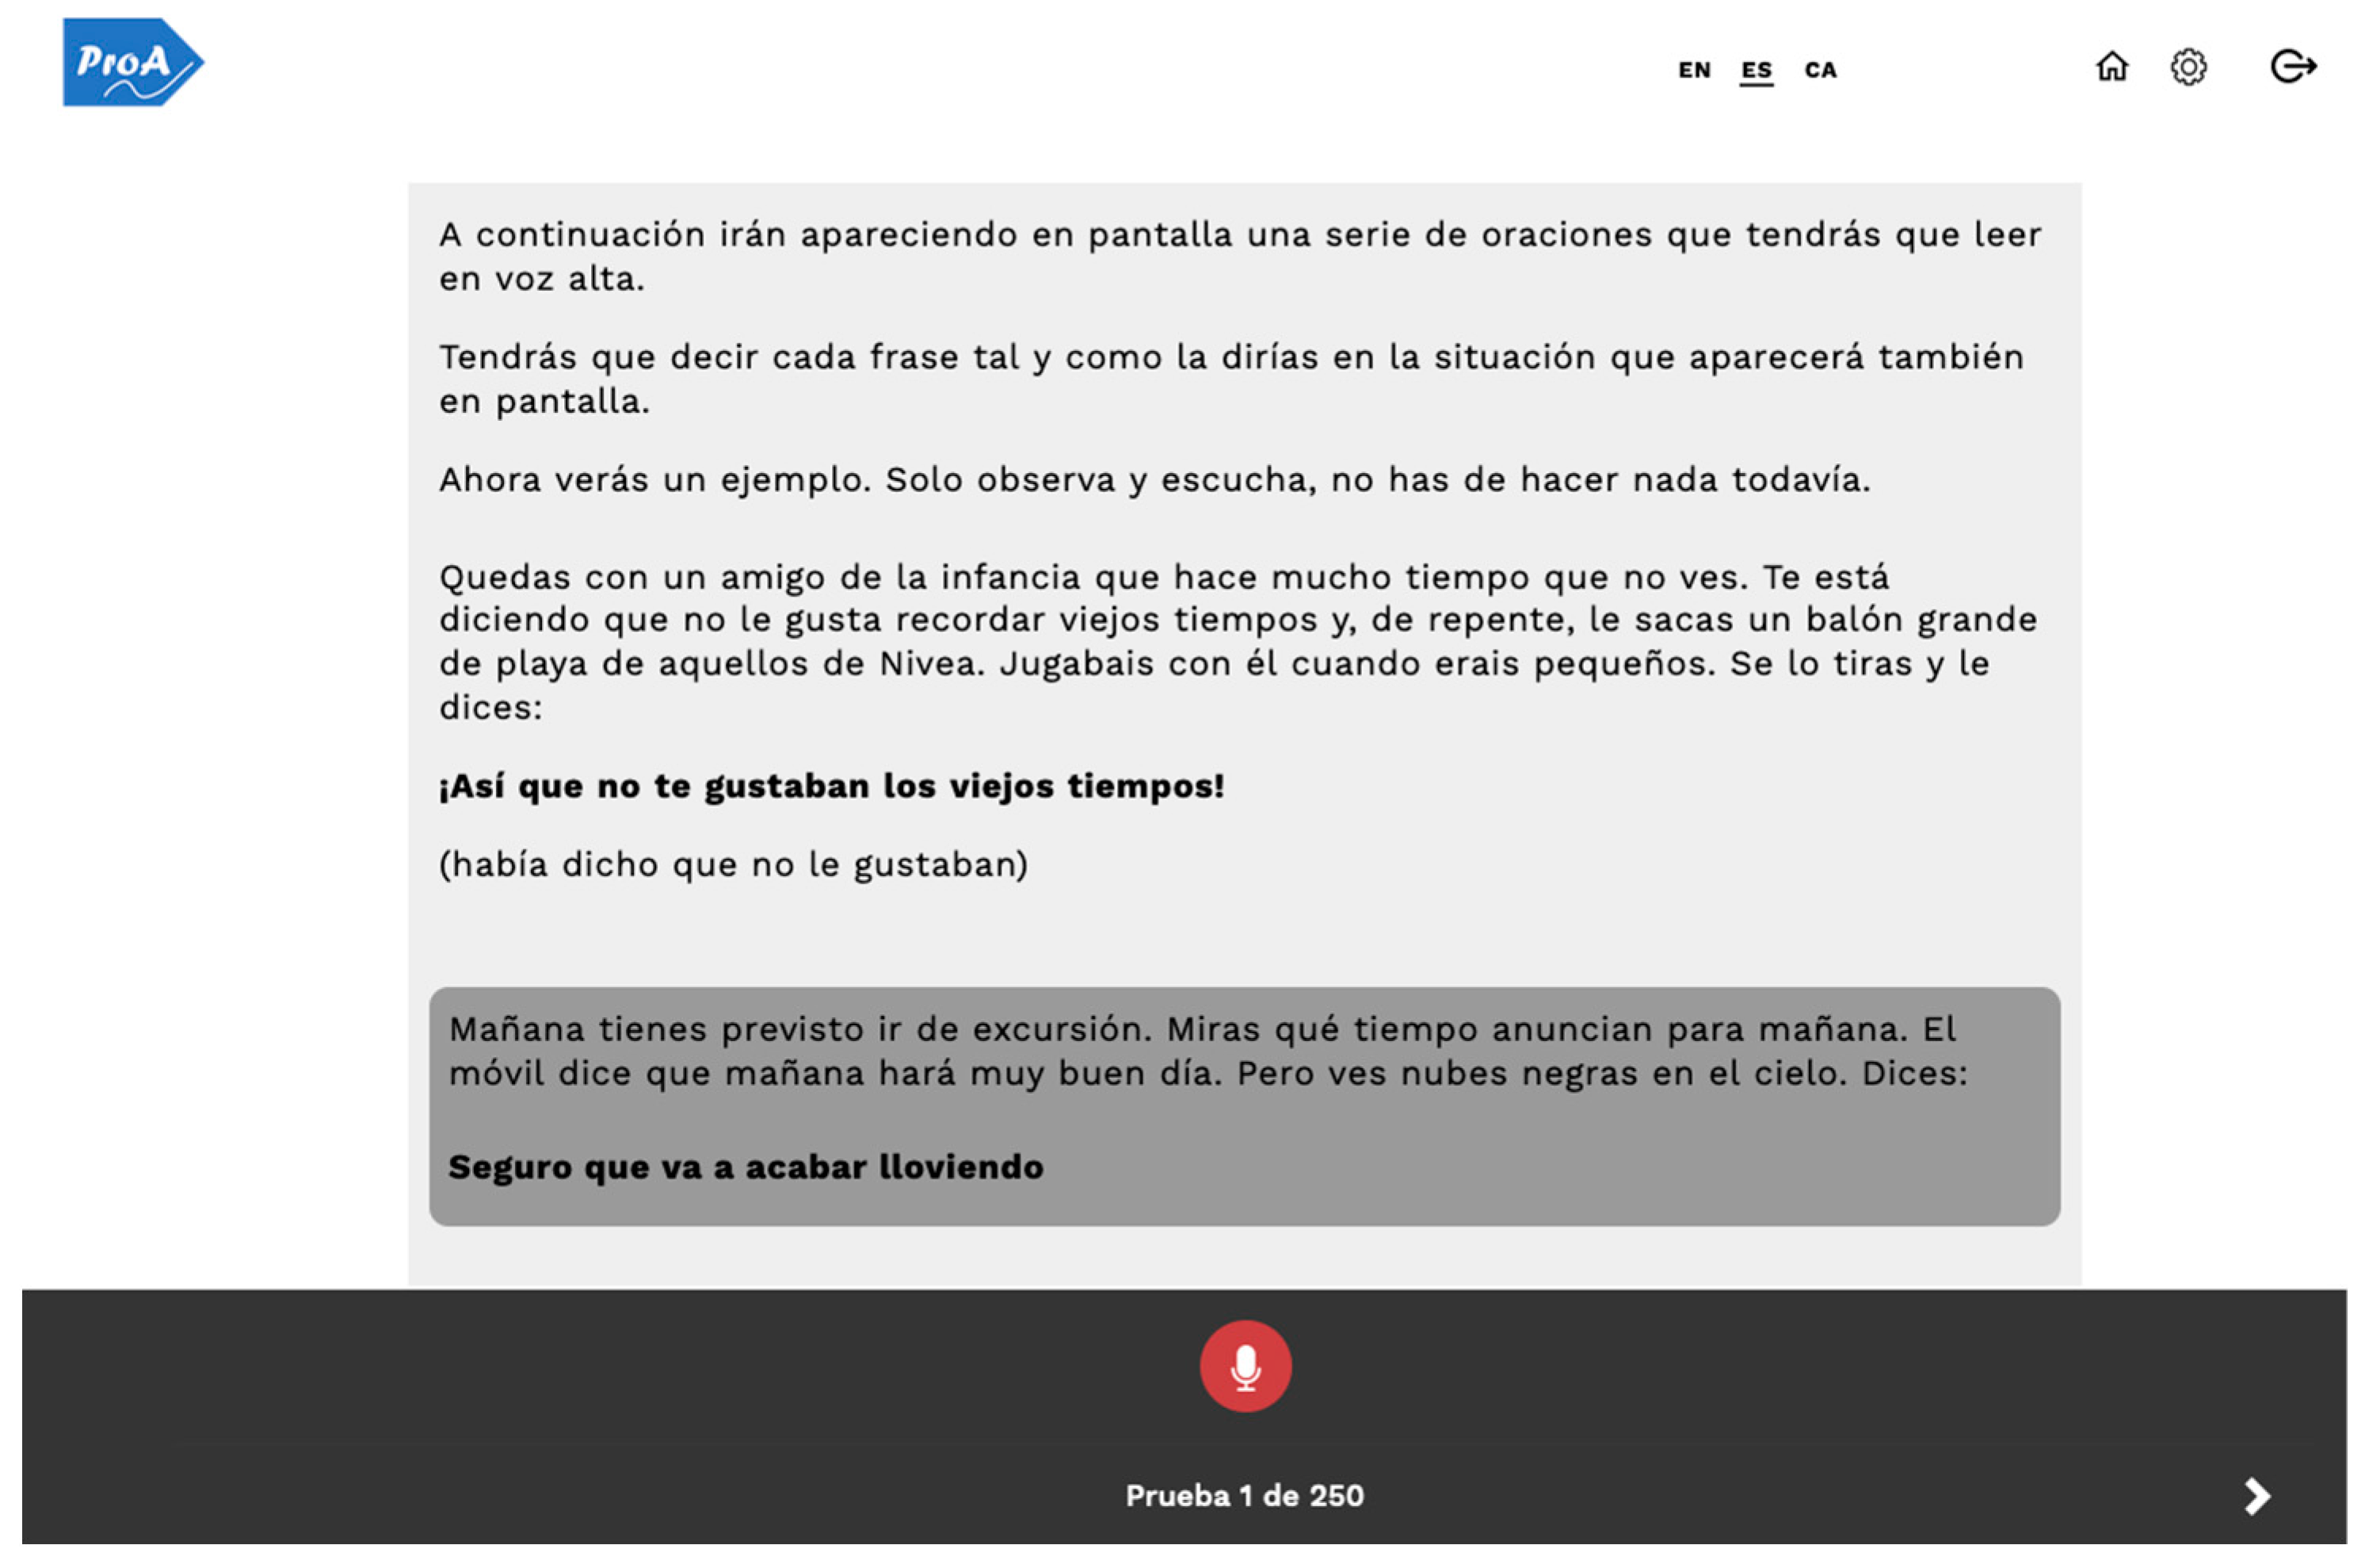
When a speaker chooses the ‘complete test’ option, the first item of the list of pending tests is presented on the screen.
Figure 1 shows an example of how items are displayed in the app.
Once the speaker has read the instructions and the example of the task, he or she can click on the microphone button to start recording. The user can repeat the recording several times; it will not be saved in the server until the user clicks on the corresponding button to go to the next test item. The app has been proven to work successfully with built-in and external microphones connected to several types of devices (desktop computer, laptop, tablet, mobile phone) in several browsers (Firefox, Chrome), but no systematic testing has been carried out. The speaker can stop the completion of the assigned tests at any time and resume by logging again into the app.
2.3. Evaluation Rubrics
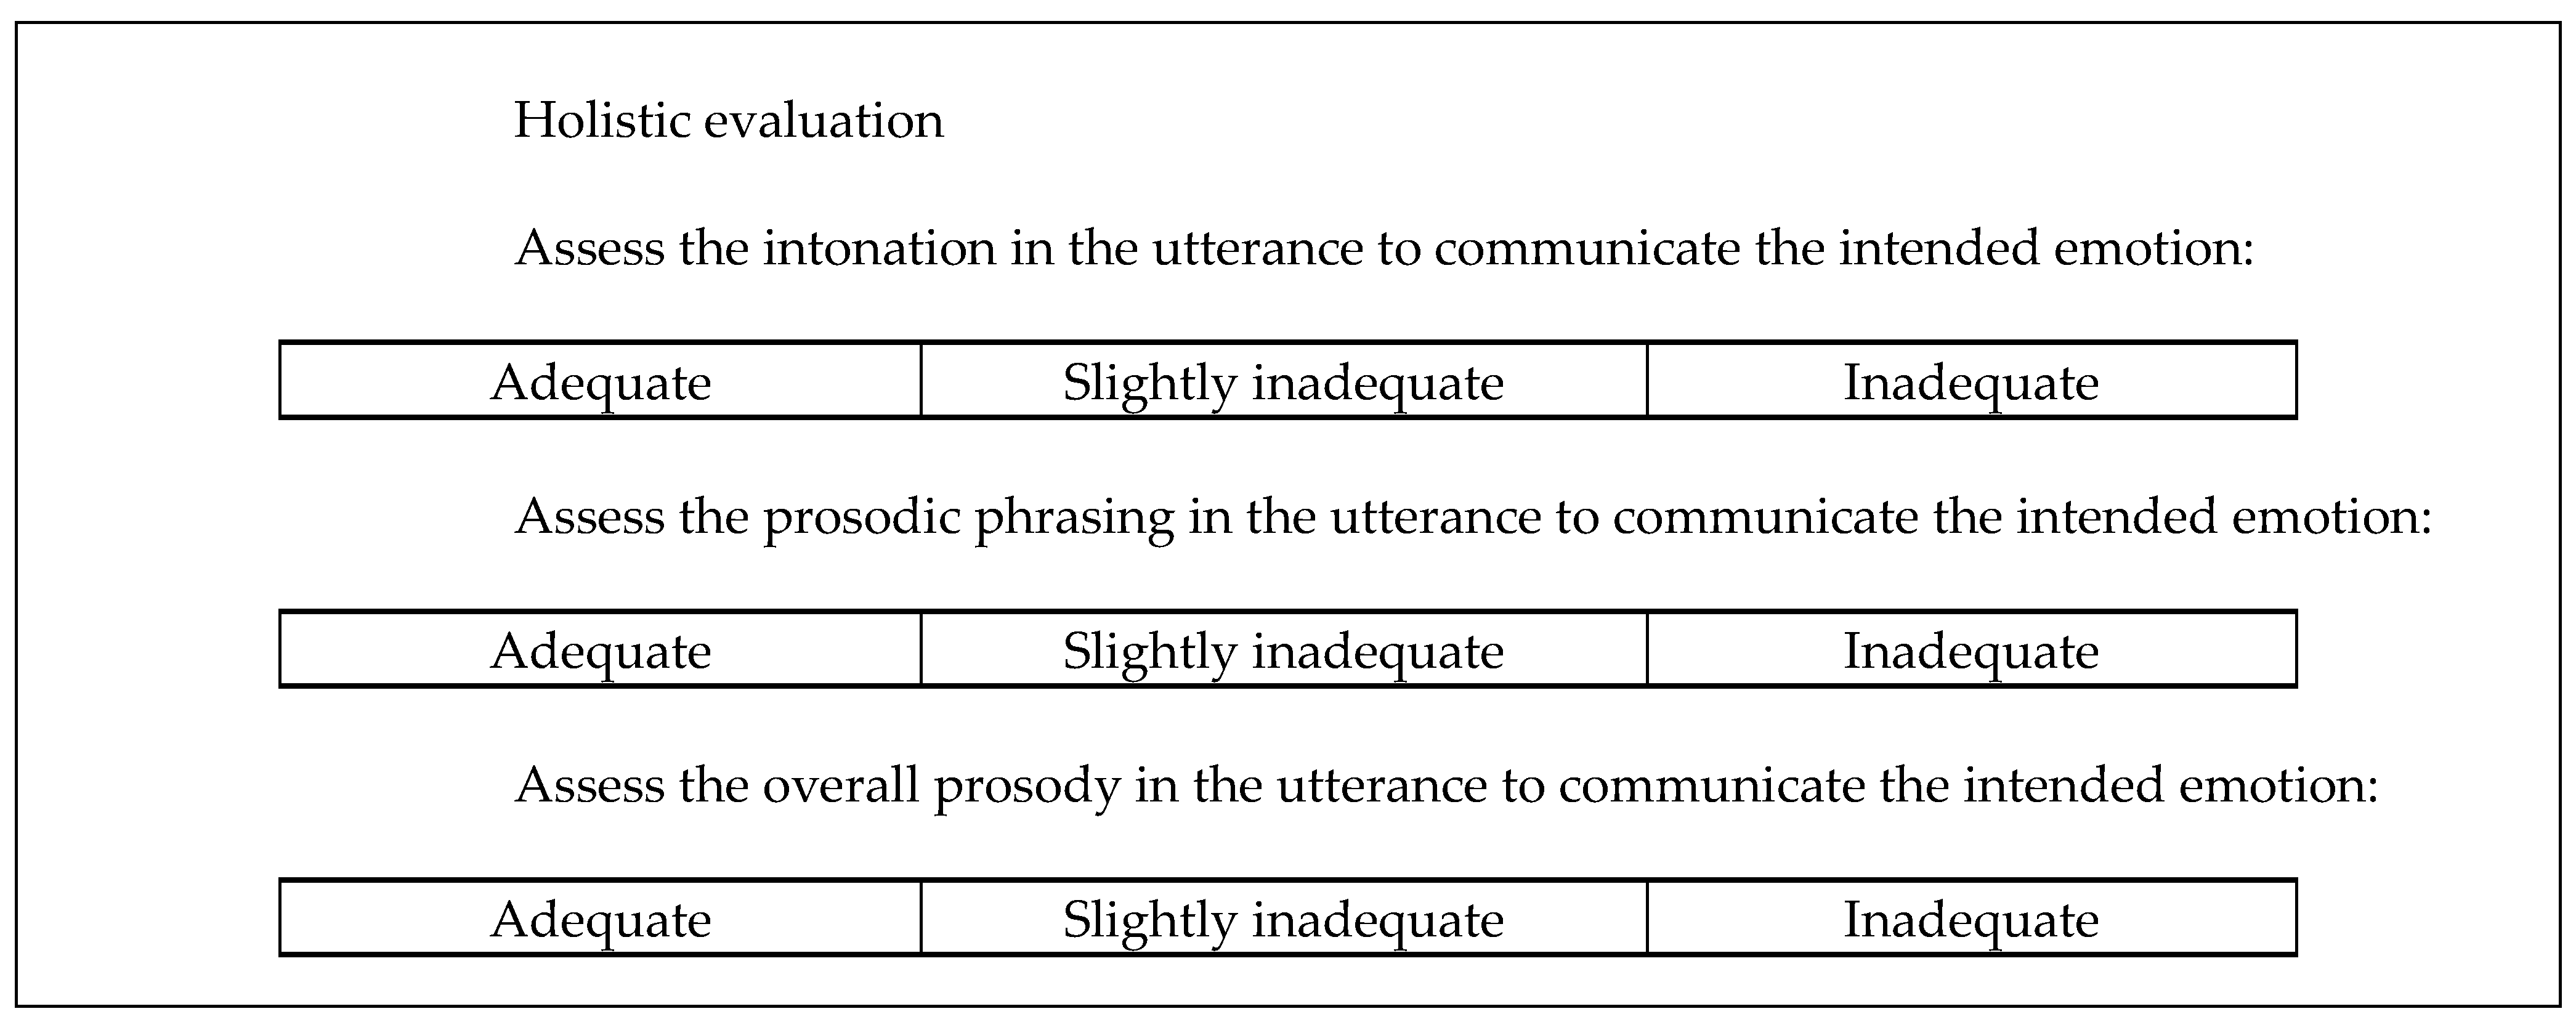
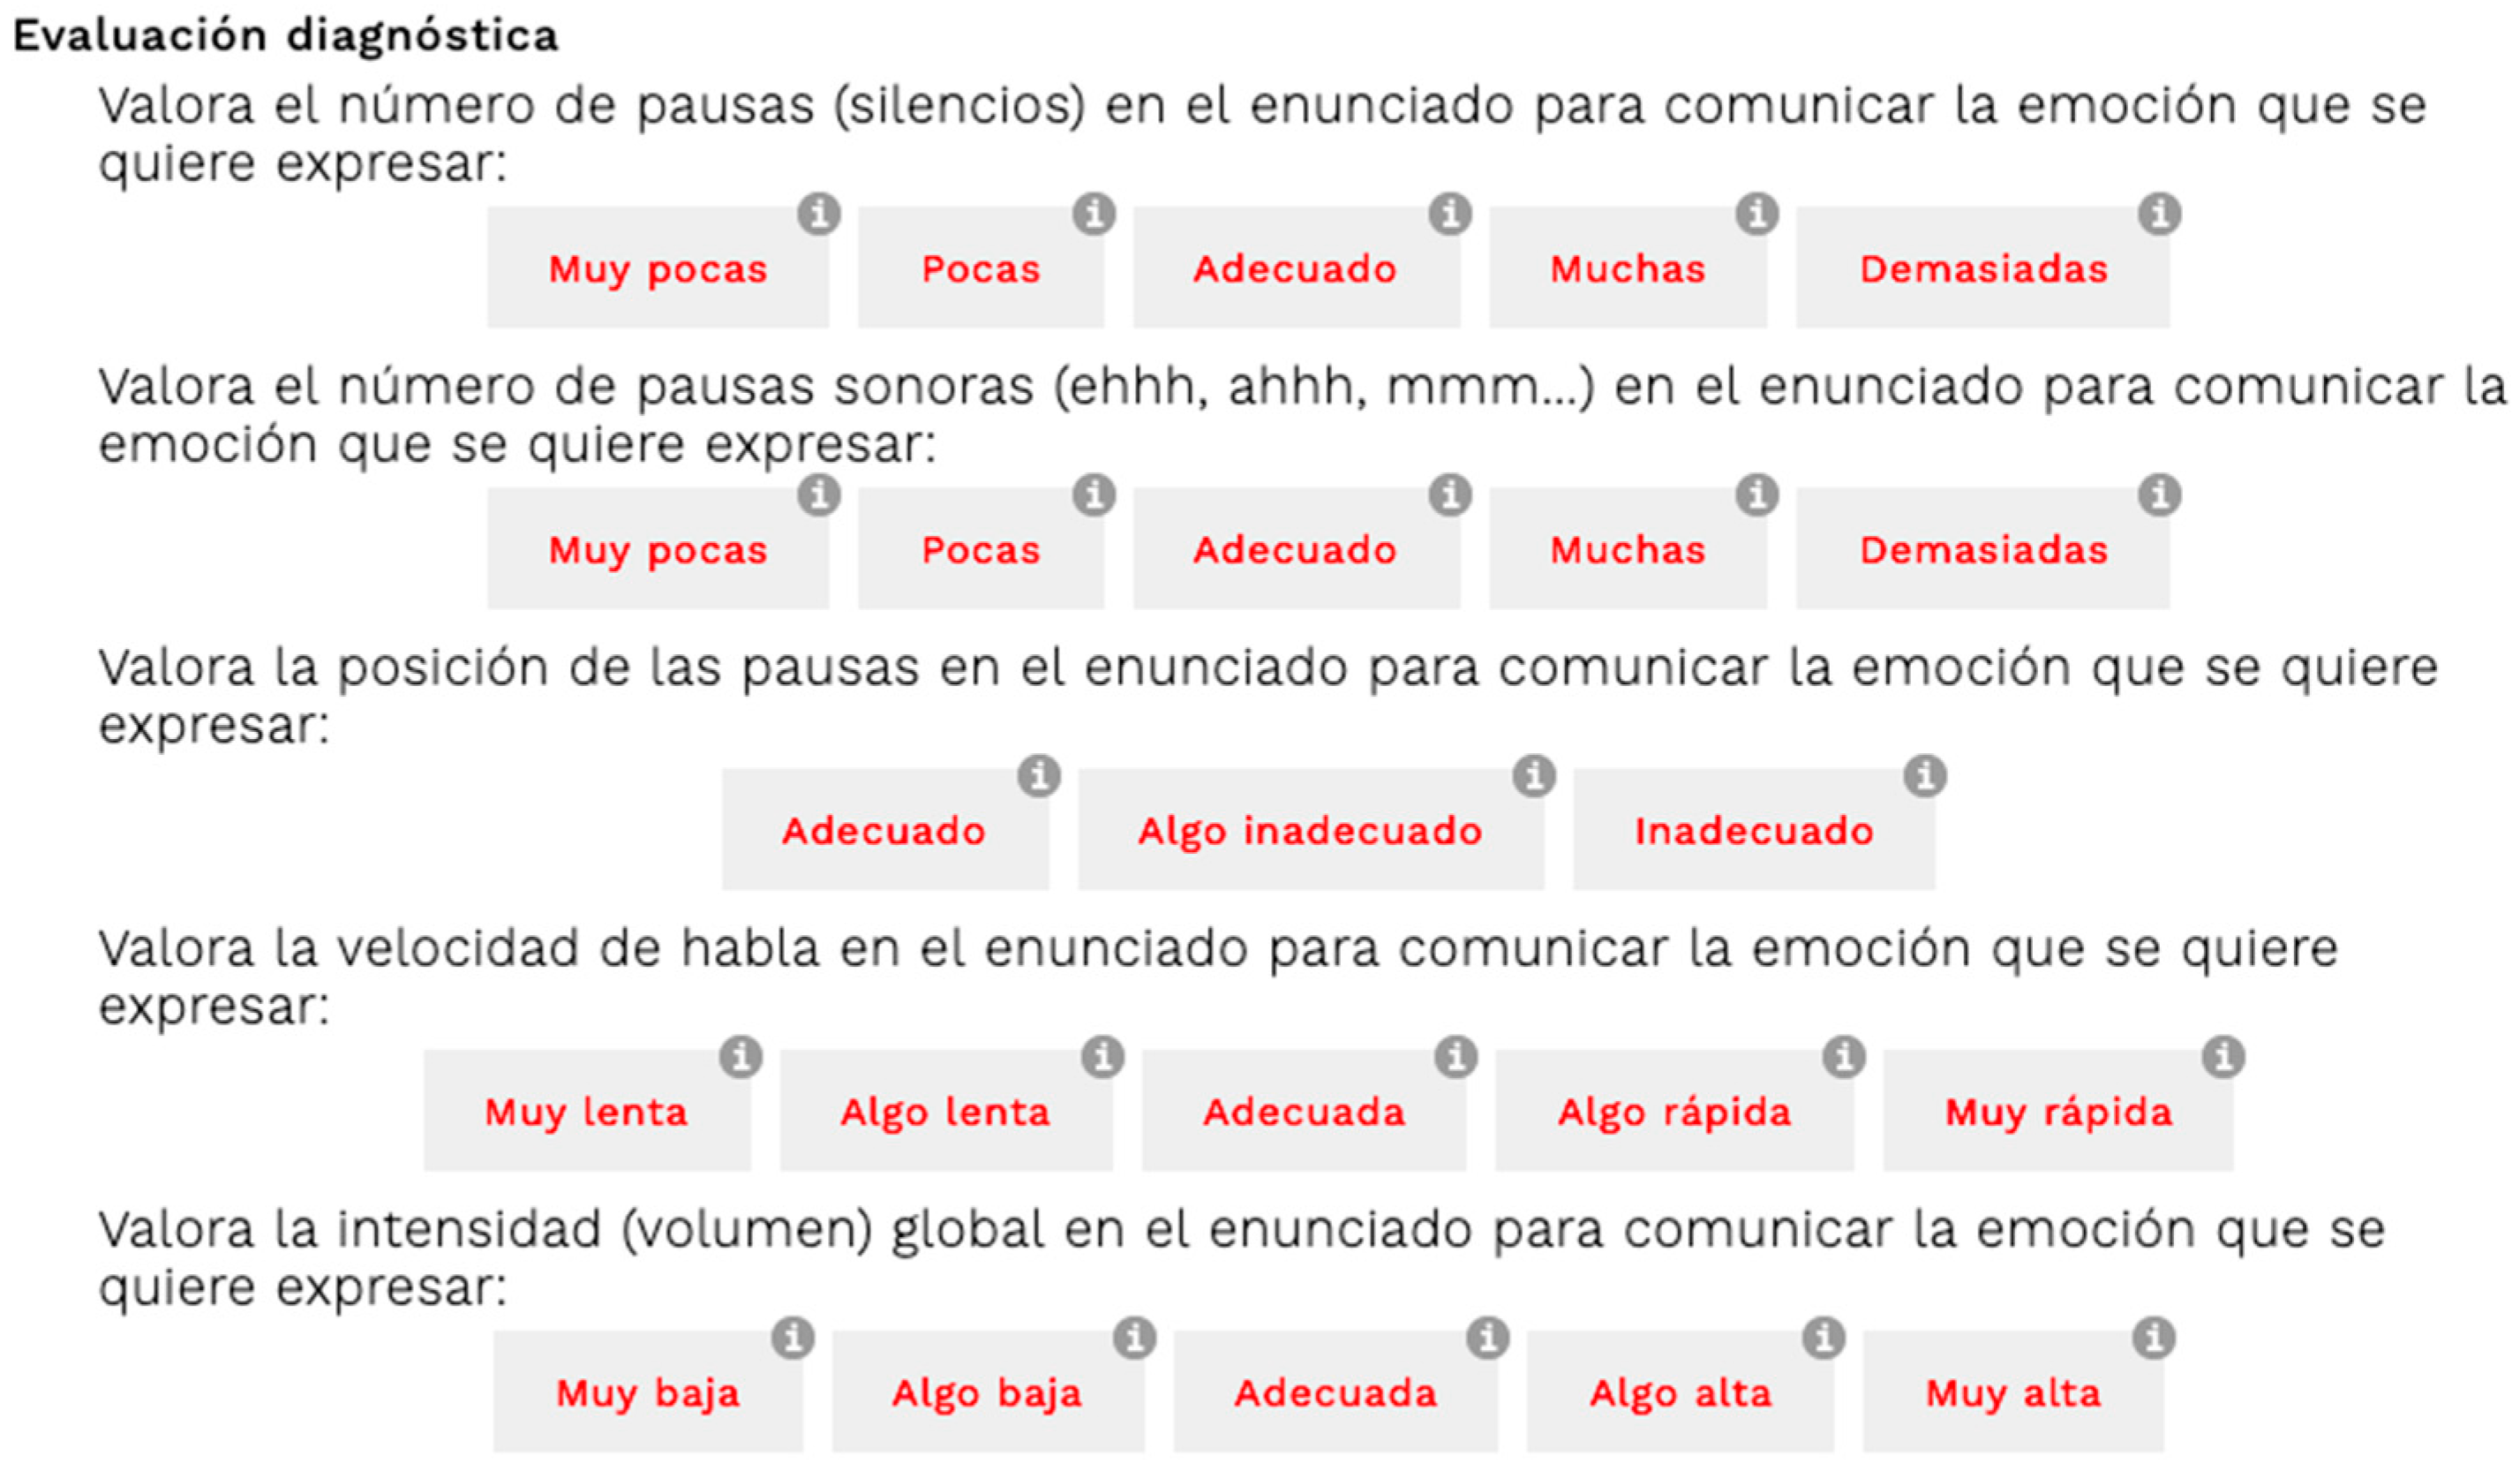
Each ProA evaluation test has its own evaluation rubric associated with it, which has also been developed during the ProA project. Although they are specific for each test, they share a common structure, with three parts: a first part of diagnostic evaluation, which includes a set of questions aiming to evaluate several phonetic parameters related to prosody, such as global intensity, number and position of pauses, or use of boundary tones; a second part of holistic evaluation, with questions conceived to score global prosodic elements (intonation, lexical stress, prosodic phrasing); and a final section of open comments, which allows evaluators to assess those aspects of the prosody of the target production which cannot be evaluated in the previous sections or add specific feedback to the speaker. All the questions included in the diagnostic and holistic sections must be answered using a three- or five-element evaluation scale, as shown in
Figure 2 and
Figure 3.
These rubrics have also been implemented in the ProA app, using the functionalities for rubric creation which are available. To create a new rubric, the administrator must define the questions that will be part of it and provide a descriptor for each possible answer in the scale. Once the rubric has been created, it must be linked to an already-existing test.
When a user with the ‘evaluator’ role accesses the app, a list of pending evaluations is presented. After clicking on one of them, the corresponding evaluation rubric is displayed. First, diagnostic questions are presented (
Figure 2), then holistic questions (
Figure 3) and, finally, the comments section.
Evaluators can listen to the utterances recorded by the speaker as many times as needed during the completion of the rubric. As shown in
Figure 2 and
Figure 3, the evaluator can check the descriptors corresponding to each answer option as help during the evaluation process.
2.4. Evaluation Feedback
As already explained, currently, the app only allows ‘human’ evaluation (that is, completed tests can only be evaluated by human evaluators), although it is expected that, in the future, some automatic scoring modules could be implemented, using the results of the acoustic analyses carried out during the project. However, one of the novel aspects of the app is the procedure used to automatically compute and present the results of an evaluation.
Completed tests can be evaluated by one or several evaluators (allowing then several types of evaluation, such as autoevaluation or coevaluation, in addition to the ‘classical’ evaluation by a teacher). These two types of evaluations are related in the app to different ways of presenting the results of the evaluation and providing feedback.
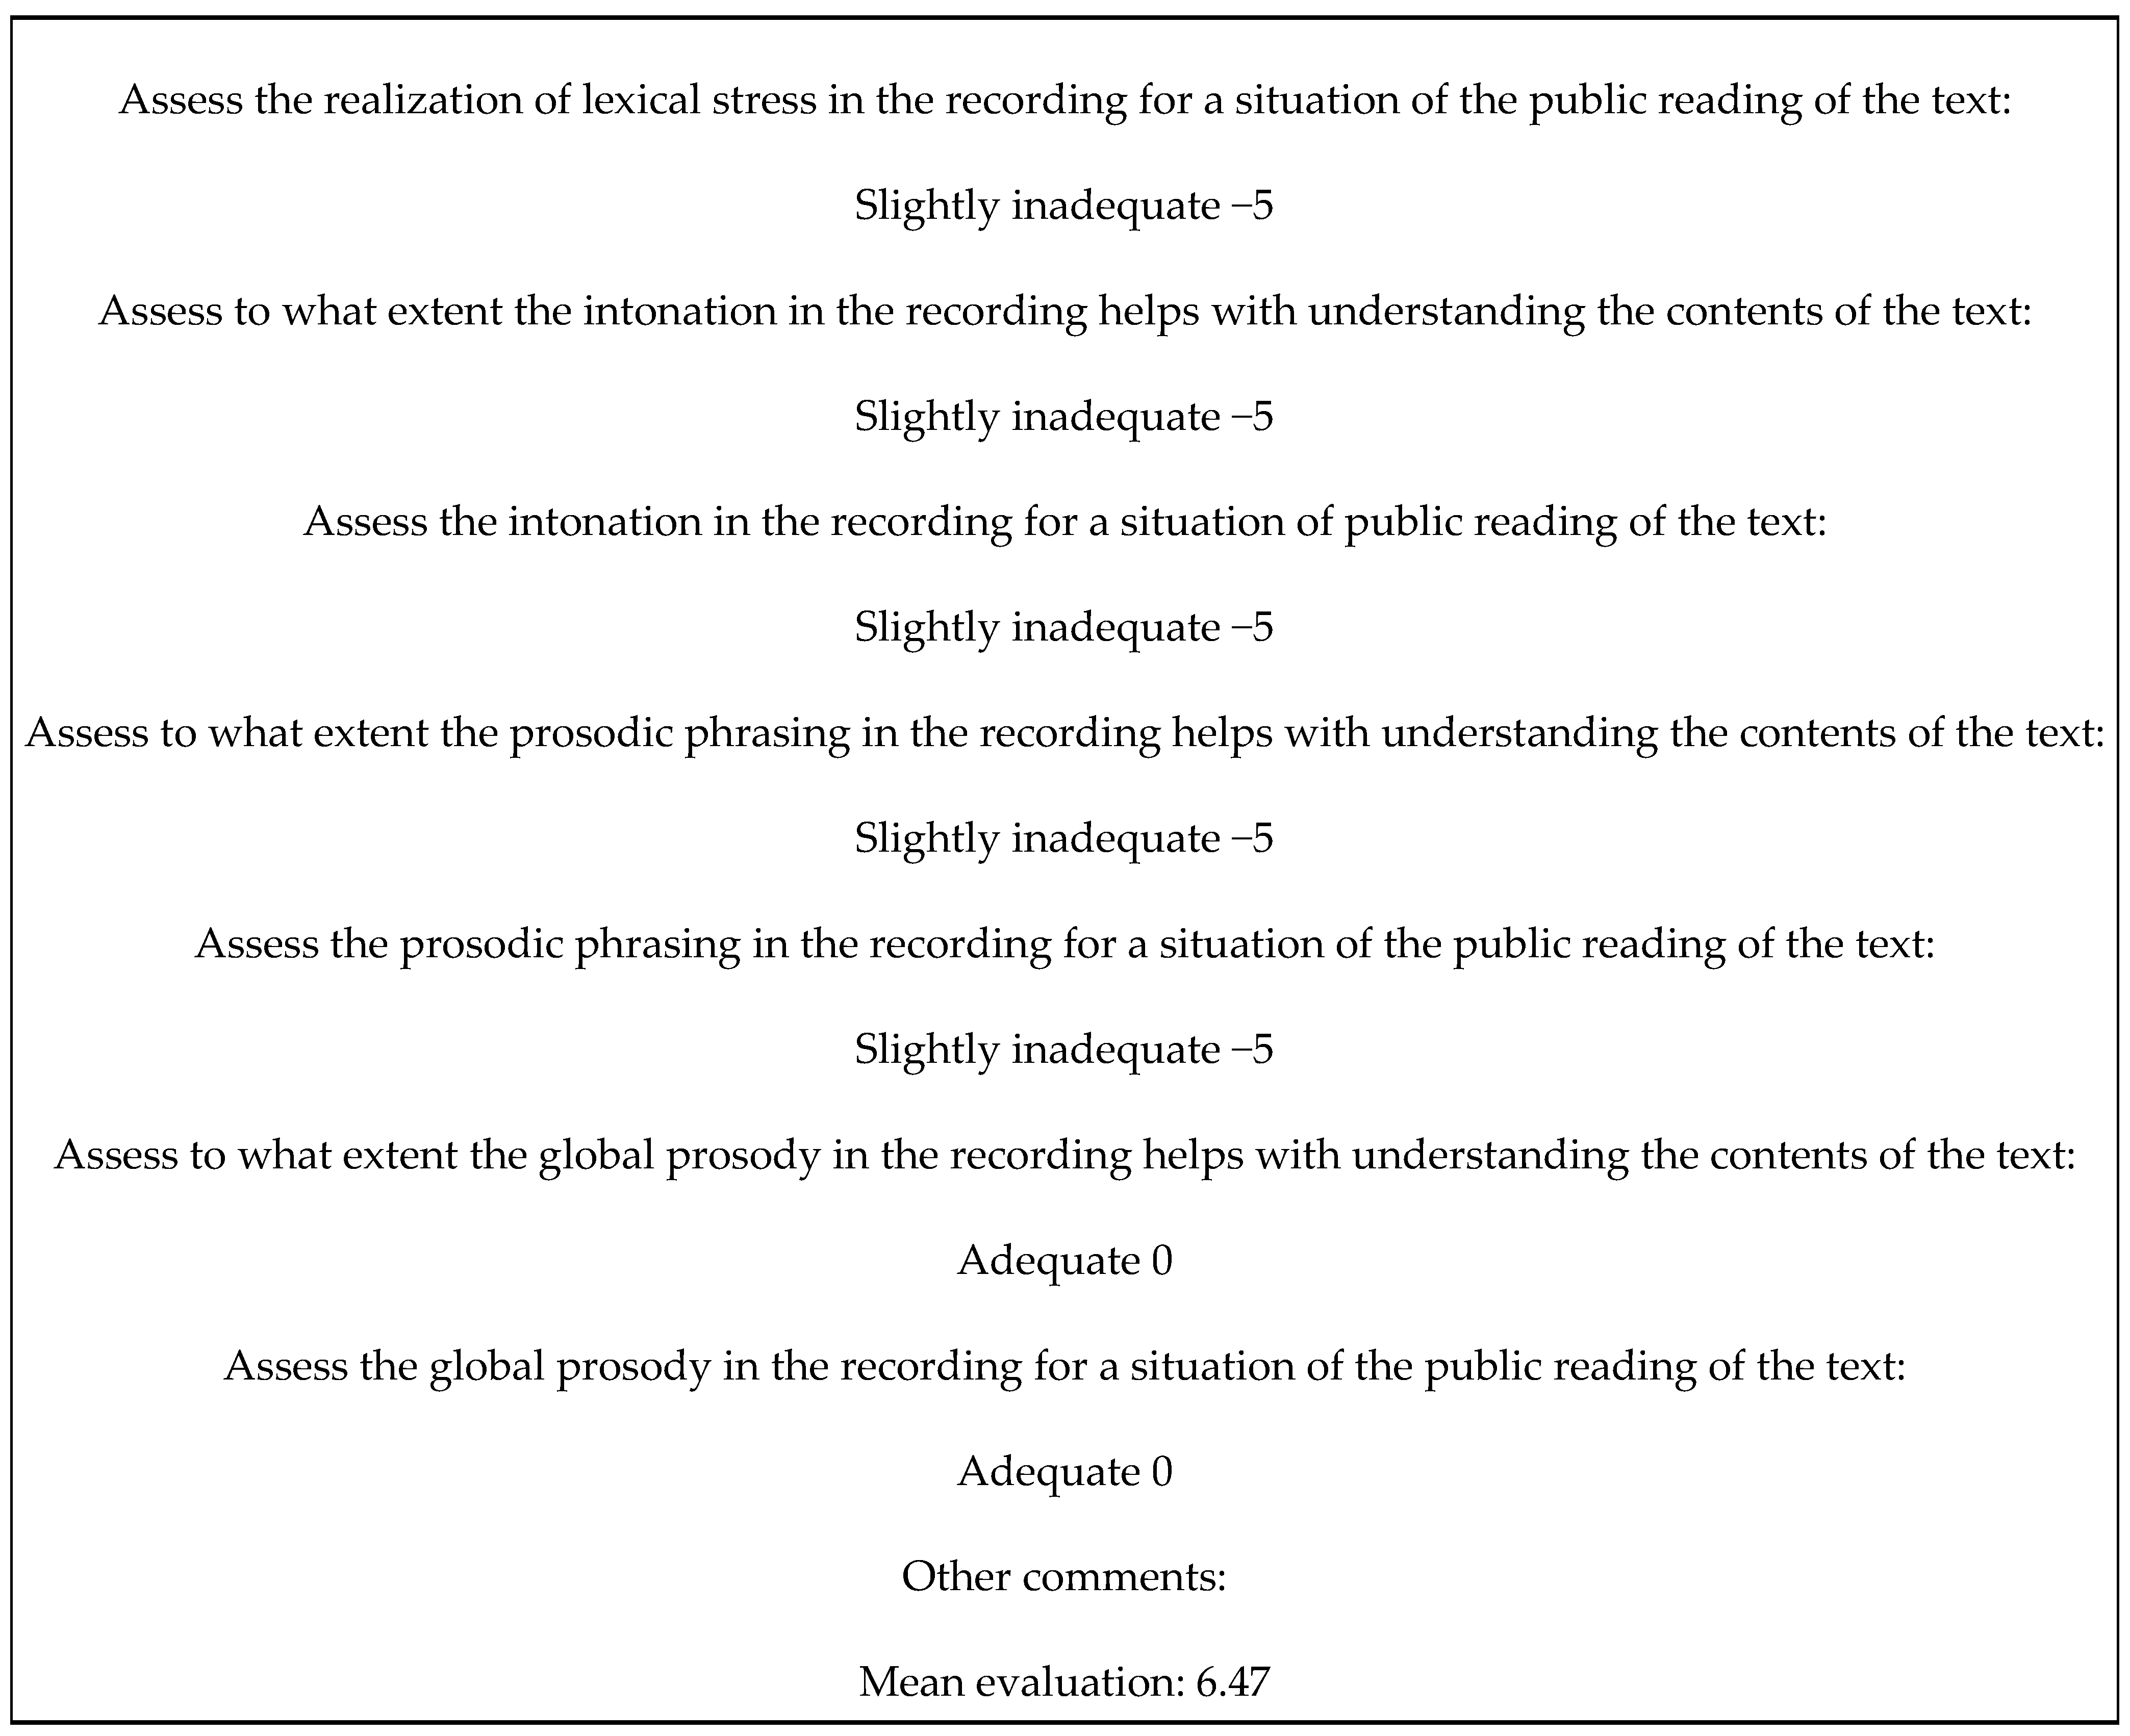
In monoevaluation (evaluation of a single test item by a single evaluator), the app directly shows the answers of the evaluator to the questions included in the rubrics; for each evaluation item, the label corresponding to the option chosen by the evaluator and its associated numeric scoring are displayed, as shown in
Figure 4. The mean score of all items is also provided, as well as the comments of the evaluator.
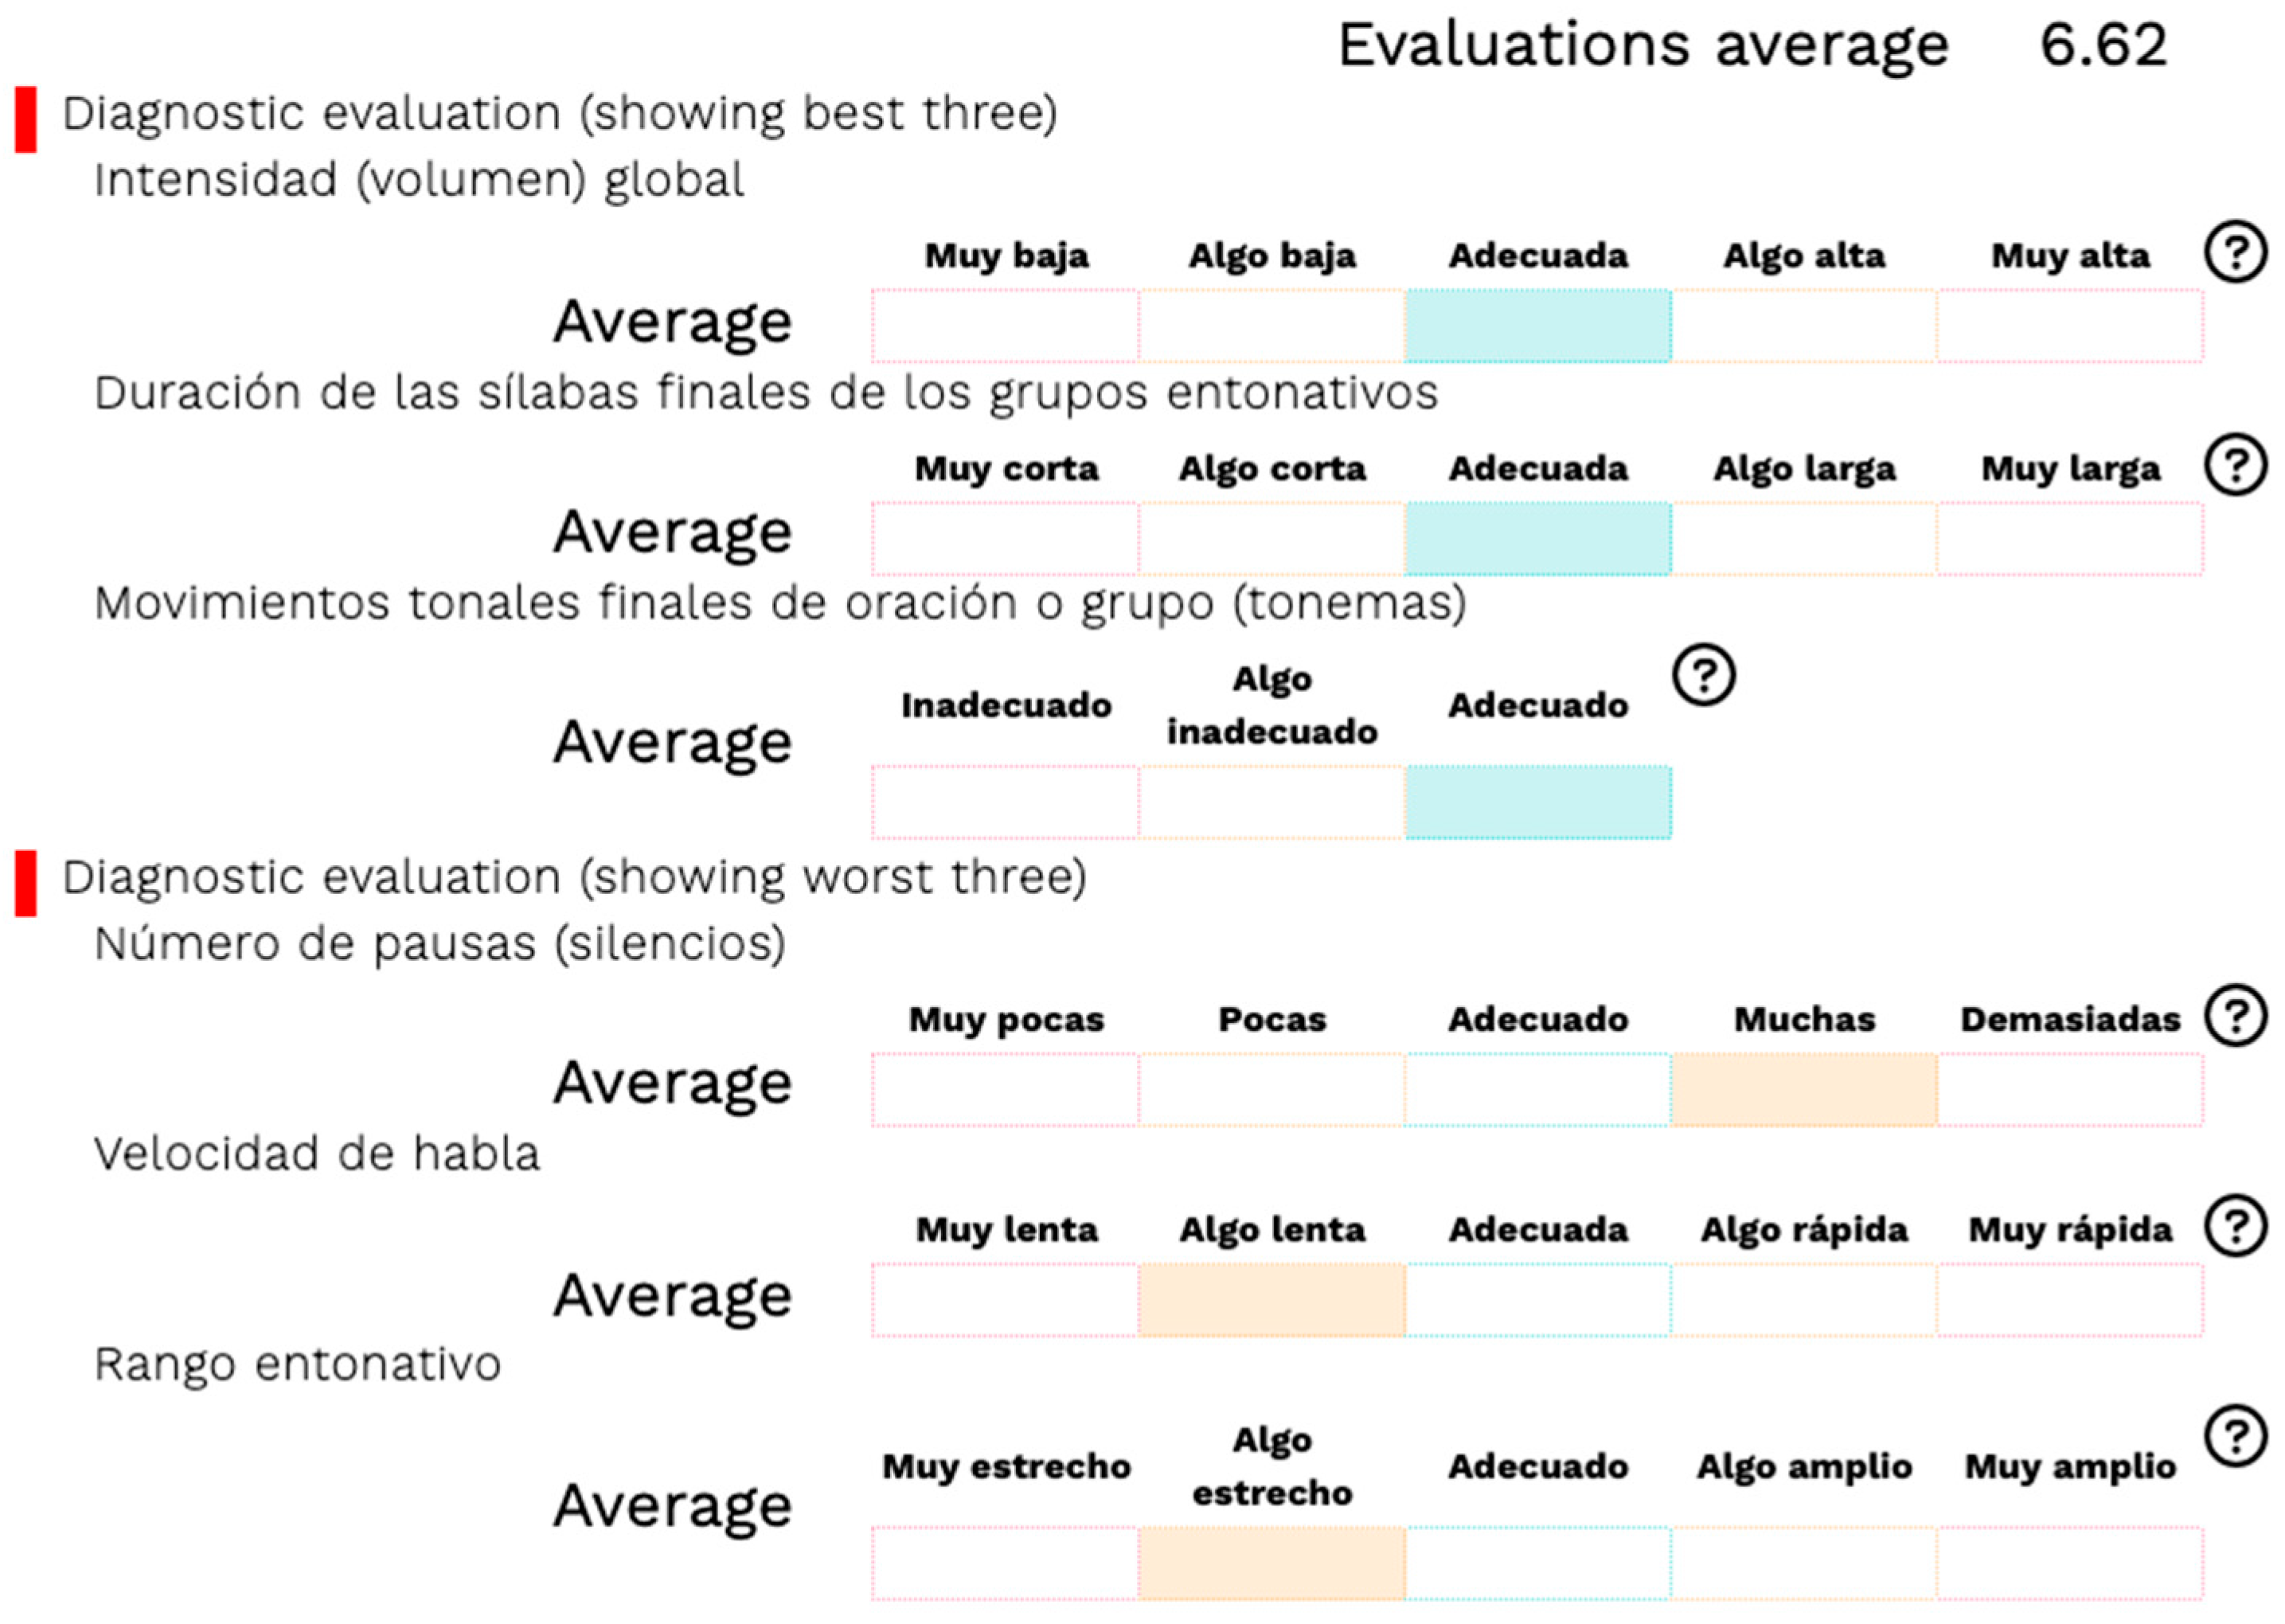
In a multievaluation display (evaluation by different evaluators of a single completed test or evaluations of the same evaluator carried out on several completed tests), a summarized version of the results is presented instead, which provides the mean global score of all the included evaluations, as a global score of the evaluation and a feedback section in which the three best and the three worst evaluation items scored by the evaluator(s) are presented, with a graphical representation of the mean scoring for each one.
Figure 5 presents an example of such a representation.
3. Use Case: Prosodic Evaluation of L2 Spanish Learners and Its Use for the Definition of Acoustic Prosody Assessment Models
The ProA tool has already been used for prosody evaluation purposes: a group of professionals with some relation with prosody and its assessment (Secondary School teachers, lecturers in Audiovisual Communication degrees, phoneticians, L2 Spanish teachers) were asked to assess the prosody of people with different profiles (Secondary School students, undergraduate students of Audiovisual Communication, L2 Spanish students) in order to collect the necessary assessment data for the research purposes of the ProA project. People who have used the tool as evaluators have provided positive feedback about its overall functionalities for diagnostic evaluation of prosody and the implemented tests and rubrics. However, it is still a prototype and not fully ready yet for ‘real’ evaluation situations.
Some of the correctness assessments collected using the ProA tool have been used to explore experimentally the possibilities of defining objective criteria for the evaluation of prosody based on acoustic instead of perceptual parameters that could be applied, for example, to the automatic evaluation of prosody. There is some preliminary evidence on the existence of such a correlation between human judgements and acoustic properties (
Cowie et al. 2002, for example), but much work is still needed, at least in Spanish, to determine to what extent such a correlation can be observed in evaluation processes and to define precise acoustic criteria which allow human or automatic evaluators to establish what is correct and incorrect in prosody. One of these correlation analyses performed within the ProA project, carried out on text readings of Spanish Secondary School students, is presented in (
Garrido et al., forthcoming). In this study, the assessments made by four Secondary School teachers about the speech rate of seven Spanish Secondary School students when reading texts aloud were analyzed and compared with acoustic measurements of the actual speech rate in the evaluated productions. The results of this analysis showed that the assessment of the speech rate in a given reading may be noticeably different when it is made by different evaluators, but despite these differences, there seems to exist some correlation between the assessment results and the acoustic data, a fact that could be interpreted as a piece of evidence that evaluators, despite individual factors which determine their judgements, do pay attention to acoustic properties of the signal when evaluating speech rate. However, the relatively small number of students and evaluators handled in the study makes further studies necessary to validate this hypothesis.
This section presents a pilot study similar to the one described in (
Garrido et al., forthcoming) but carried out with data from L2 Spanish learners. In this case, the goal was to determine to what extent L2 Spanish teachers are consistent in their judgements when evaluating the prosody of L2 Spanish students and if these judgements are actually correlated to acoustic prosodic properties of the speech signal. The analyzed speech material was, in this case, a set of sentences in which L2 Spanish learners had to express several emotions instead of text readings. The analysis of emotional speech is relevant for the evaluation of prosody of L2 Spanish learners since the expression of emotional content through prosody is one of the learning skills established by the curricula of the Instituto Cervantes that L2 Spanish learners should reach during B1–B2 levels.
Acoustic studies on emotional speech in Spanish have shown that emotions are expressed through the modification of a set of parameters, such as boundary tones, pitch range, pitch register, speech rate, prosodic phrasing or overall intensity (
Rodríguez et al. 1999;
Montero et al. 1999;
Francisco Gilmartín et al. 2005;
Garrido 2011;
Martínez and Rojas 2011). An evaluation of the expression of emotions through prosody based on acoustic parameters should then take into account these parameters. For this pilot study, however, only three of these parameters have been evaluated: speech rate, pitch range and overall intensity.
The analysis presented here can be considered a pilot study since it has been carried out with a small number of speakers and evaluators, but it exemplifies the methodology and the possibilities of this research line to define assessment reference values that could be used in automatic evaluation procedures of L2 Spanish.
3.1. Goals and Hypotheses
The research questions that this experiment intended to explore were the following:
Are L2 Spanish evaluators consistent in their judgements when they assess speech rate, pitch range and intensity in the productions of L2 Spanish learners?
Is there a correlation between acoustic measures of speech rate, pitch range and intensity taken in productions of L2 Spanish expressing emotions and the assessment judgements on these parameters?
Is it possible to define acoustic thresholds of correctness for the chosen parameters for each of the considered emotions?
The considered hypotheses for these questions are that, as in (
Garrido et al., forthcoming), there will be some differences among the evaluators’ judgments, but despite this fact, it will be possible to find some relation between the correctness judgements of the teachers and the calculated acoustic data, a fact that would indicate that teachers pay attention to acoustic properties when assessing emotional prosody. Accordingly, the expected answer to the third research question is that it will be possible to establish acoustic correctness thresholds for the analyzed parameters.
3.2. Methodology
To test these hypotheses, two sources of data then had to be collected from the same speech material of L2 Spanish learners: acoustic data about the phonetic parameters considered relevant for the expression of the selected emotions and perceptual data about the correctness of these parameters in the analyzed material. The following subsections describe the speech material, the acoustic analysis procedure, the perceptual assessment carried out by teachers, and the statistical analysis carried out with these data.
3.2.1. Materials
The speech material used for the experiment is made up of 48 recordings of reading sentences made by two L2 Spanish students. This material is a small part of the ProA corpus and was collected using the two versions of the ProA test for the evaluation of emotional speech. Each version of this test is made up of 12 items (24 items overall) representing four different emotions: anger, fear, joy and sadness. In both versions of the test, the target sentences are presented with a text that describes a situation in which the sentence could be uttered to induce the correct expression of the target emotion.
Table 2 presents an example of target sentences for each considered emotion and their accompanying text.
The two L2 Spanish learners who recorded this material were following a B1 Spanish course at the Official Language School of Barcelona. The female speaker (HB) was born in Morocco. She had completed Secondary School and had been living in Barcelona for two years, and her first language was Arabic. The male speaker (AT) was born in Greece. He had completed a Law degree and had been living in Barcelona for one year, and his first language was Greek. It was expected that the fact of having two different first languages, one of them closer to Spanish in phonetics terms (Greek) than the other, would interfere with their prosody in a different way, providing different prosodic realisations that should be assessed differently by the evaluators.
Both speakers completed the test in the sound-treated room of the Phonetics Lab of the University of Barcelona. They did not have previous knowledge of the material they were going to record, and they did not receive specific instructions about how to complete the test, apart from the instructions provided at the beginning of each test, although they were encouraged to ask any question they had before the beginning of each test. They were then not instructed specifically about how to utter the test items. They were also asked to keep, as much as possible, a constant distance between the microphone and their mouths.
3.2.2. Perceptual Evaluation
The described productions of these two students were submitted for evaluation using the ProA tool (version 1.0). Three L2 Spanish teachers, CL, IM and LM, participated in this task: CL (aged 37) and LM (aged 67) are expert L2 Spanish teachers at the Official Language School of Barcelona, hold degrees in Spanish Linguistics, and both were born and have lived in the Barcelona region (Spain); IM (aged 23), however, has less experience in L2 Spanish teaching, mainly in an online environment, holds a degree in Applied Languages, and was born and have lived in the Albacete area (Spain). In total, 48 evaluation items (12 test items × 2 versions of the test × 2 speakers) were assigned to each evaluator after being registered as users in the app with the appropriate role. Evaluators scored each evaluation item using the ProA rubric for this test, which included, among others, three questions about the adequacy to express the target emotion in the utterance through speech rate, pitch range and global intensity, respectively. In all three cases, evaluators had to choose among five possible answers, representing a scale with the ‘adequate’ answer in the middle. However, the options representing inadequate realisations were different for each parameter: muy lenta (‘very slow’), algo lenta (‘slightly slow’), algo rápida (‘slightly fast’) and muy rápida (‘very fast’) for speech rate; muy estrecho (‘very narrow’), algo estrecho (‘slightly narrow’), algo amplio (‘slightly wide’) and muy amplio (‘very wide’) for F0 range; and muy baja (‘very low’), algo baja (‘slightly low’), algo alta (‘slightly high’) and muy alta (‘very high’) for intensity. The answers to these questions have been used as perceptual data for this analysis.
3.2.3. Acoustic Analysis
The acoustic processing of the recorded material involved two steps: a first stage of annotation and segmentation of the material and a second phase of feature extraction. During the annotation phase, the recorded sentences were first processed using WebMaus (
Kisler et al. 2017) to obtain the phonetic transcription of the utterances, time-aligned with the speech waveform, and then with SegProso (
Garrido 2013) to obtain the segmentation into syllables, intonation units and breath groups. The output of these processes was a set of Praat (
Boersma and Weenink 2021) TextGrid files containing the corresponding automatic annotation. These TextGrid files were manually revised by a phonetician to fix eventual errors generated by the automatic tools.
The feature extraction phase involved the computation of the target acoustic parameters in the analyzed utterances: speech rate, pitch range and intensity. Acoustic data were also obtained automatically, using four Praat scripts which calculated speech rate (including pauses, expressed in words per minute), articulation rate (excluding pauses, expressed in phones per second), mean pitch range (expressed in semitones) and mean overall intensity (expressed in decibels). Scripts used to compute speech rate provided mean speech and articulation rates for each utterance, calculated from the word and phone annotation obtained in the previous phase. The script used to calculate pitch range provided initial and final fundamental frequency (F0) ranges for each breath group in the utterances, obtained from the estimated initial and final F0 values of the top and bottom regression lines for F0 peaks and valleys of every breath group. Finally, the script for overall intensity calculation provided the mean intensity for each breath group in the analyzed utterances. No manual revision of the output of these scripts was carried out in this case.
3.2.4. Statistical Analysis
The obtained acoustic and perceptual data were summited for statistical analysis using R (
R Core Team 2021). Several chi-squared and ANOVA tests were carried out to analyze the effect of speaker, evaluator and emotion on the data, and correlation analyses were used to evaluate the degree of correlation between the expert judgements and the acoustic measurements.
3.3. Results
3.3.1. Evaluation Data
Table 3 presents the evaluation answers for the three evaluators, per emotion and speaker, corresponding to the question about the adequacy of the speech rate. As can be observed, both speakers were rated differently by the evaluators, with a majority of evaluations ‘slightly slow’ or ‘very slow’ for all emotions and, overall, in the case of speaker HB, and a majority of ‘adequate’ responses for all emotions in the case of speaker AT. Chi-squared tests revealed significant differences in the evaluation of this parameter per speaker (
Χ2(4,
N = 144) = 61.969,
p < 0.01). In a closer look at the evaluations of the productions of each speaker per emotion, it can be observed that differences are quite small among emotions in both speakers and that they did not appear to be statistically significant in the performed chi-squared tests (
Χ2(9,
N = 72) = 10.284,
p = 0.33 for speaker AT;
Χ2(12,
N = 72) = 11.875,
p = 0.46 for speaker HB).
However, there were significant differences in the ratings of the three evaluators, as can be observed in
Table 4: evaluator CL had a higher tendency to choose the label ‘adequate’ than the other two evaluators, whereas IM preferred the ‘slightly fast’ label and LM had more tendency to choose ‘slow’ assessments than the other two evaluators. The chi-squared test used to evaluate these data showed that these differences were statistically significant (
Χ2(8,
N = 144) = 49.216,
p < 0.01).
Table 5 presents the answers to the question about the adequacy of the pitch range for the three evaluators per emotion and speaker. In this case, there are also noticeable differences between both speakers: speaker AT received mainly ‘slightly narrow’ ratings, whereas speaker HB had mainly ‘slightly wide’ evaluations. Again, the chi-squared test indicated that these differences were statistically significant (
Χ2(4,
N = 144) = 28.773,
p < 0.01). If ratings per emotion are analyzed for each speaker, the evaluators observed differences in the productions of some emotions in the case of speaker AT: in the case of fear and joy, F0 range was mostly evaluated as ‘slightly narrow’, but in the case of anger, the same speaker received a majority of ‘slightly wide’ evaluations, and in the case of sadness, ‘adequate’ was the preferred answer, although a noticeable dispersion of the responses is observed for all emotions. The chi-squared test indicated that these differences were not statistically significant (
Χ2(9,
N = 72) = 16.693,
p = 0.05374). In the case of speaker HB, differences among the evaluations of each emotion are also observed, with a majority of ‘slightly wide’ evaluations in the case of utterances expressing anger, fear and sadness and an equal preference for ‘very narrow and ‘adequate’ evaluations in the case of joy. Again, the responses showed a noticeable and, in some cases, even contradictory dispersion. However, the performed chi-squared test did not indicate significant differences in this case (
Χ2(12,
N = 72) = 10.651,
p = 0.559).
Again, as shown in
Table 6, there were significant differences among the rates of the three evaluators: evaluator CL showed a preference for the ‘adequate’ answer and IM chose mainly the ‘slightly wide’ answer. LM, however, used mainly the ‘slightly narrow’ qualification. The chi-squared test performed on the data indicated that these differences are statistically significant (
Χ2(8,
N = 144) = 48.495,
p < 0.01).
Finally,
Table 7 presents the answers to the question about the adequacy of intensity for the three evaluators per emotion and speaker. In this case, evaluators observed global differences between the intensity of both speakers, with a majority of ‘adequate’ answers in both speakers but a noticeable amount of ‘slightly low’ evaluations in the case of speaker AT, and a significant number of ‘slightly high’ answers in the case of speaker HB. These differences appeared to be statistically significant in the chi-squared test (
Χ2(4,
N = 144) = 28.802,
p < 0.01).
If an analysis of the responses per speaker and emotion is carried out, it can be observed that evaluations are quite similar for all emotions in the case of speaker AT, with a majority of ‘adequate’ evaluations but a significant number of ‘slightly low’ evaluations as well. This distribution of the answers among emotions did not appear to be statistically significant in the chi-squared test (Χ2(9, N = 72) = 10.54, p = 0.31). In the case of speaker HB, however, some differences are observed, with a majority of ‘adequate’ ratings for intensity in utterances expressing fear and sadness, and a preference for the ‘slightly high’ evaluation in the case of utterances expressing anger and joy, but with some dispersion of the data between these two labels in all emotions. Again, the chi-squared test indicated that these differences were not statistically significant (Χ2(12, N = 72) = 127.8359, p = 0.8).
The data presented in
Table 8 about the distribution of the answers per evaluator also show important differences among them, with a preference for the ‘adequate’ label in the case of CL and IM evaluators, and a majority use of the ‘slightly low’ label in the case of the LM evaluator. As in previous cases, the chi-squared test performed on the data revealed that these differences are statistically significant (
Χ2(8,
N = 144) = 75.507,
p < 0.01).
3.3.2. Acoustic Analysis
Table 9 presents the mean speech and articulation rates in the analyzed utterances per emotion and speaker. Clear differences can be observed between speakers, with higher values in general for speaker AT than for speaker HB in both parameters, which ANOVA tests revealed to be statistically significant (
F(1, 142) = 98.19,
p = 0 for speech rate;
F(1, 142) = 382.08,
p = 0 for articulation rate). Within each speaker, the comparison of mean values for each emotion reveals some differences among them, which were not statistically significant in the ANOVA tests for speech rate (
F(3, 68) = 1.87,
p = 0.14 for speaker AT;
F(3, 68) = 1.21,
p = 0.31 for speaker HB) but significant for articulation rate (
F(3, 68) = 6.30,
p = 0 for speaker AT;
F(3, 68) = 9.28,
p = 0 for speaker HB).
Table 10 presents the mean F0 range per emotion and speaker. In this case, significant global differences between speakers are not observed (
F(1, 139) = 0.07,
p = 0.8 in the ANOVA test). However, differences among emotions are observed in both speakers, with higher F0 ranges for anger and fear than for joy and sadness that appeared to be statistically significant in the ANOVA tests (
F(3, 65) = 6.80,
p = 0 for speaker AT;
F(3, 68) = 4.23,
p = 0.01 for speaker HB).
Finally,
Table 11 presents data for mean intensity per emotion and speaker. Differences are observed between speakers, with higher intensity values in general for speaker HB than for speaker AT (
F(1, 142) = 216.95,
p = 0 in the ANOVA test). Within each speaker, some differences among emotions are observed for speaker AT, with slightly higher values for fear and joy than for anger and sadness, which the ANOVA test revealed as statistically significant (
F(3, 68) = 9.23,
p = 0). However, intensity values for each emotion are more similar in the case of speaker HB, and they did not appear to be significantly different in the ANOVA test (
F(3, 68) = 0.83,
p = 0.48).
3.3.3. Analysis of the Relation between Acoustic and Perceptual Data
Two types of data are presented in this section: mean values for each set of acoustic values that received the same evaluation label, and correlation analyses between acoustic data and evaluators’ judgements. They are presented separately for each acoustic parameter.
Table 12 presents the mean values for speech rate associated with each evaluation label, globally and separately for each emotion considered. Three facts can be highlighted from the data presented in the table: first, the tendency of the means to increase according to the evaluation label (for example, in the case of anger, the mean speech rate value corresponding to ‘very slow’ is 136.36 words/min; means associated with the rest of the labels are increasing, until 282.72 words/min in the case of the ‘very fast’ label); second, means associated with the ‘adequate’ label for each emotion are slightly different, with higher values for anger and fear and lower values for joy and sadness; and finally, speech rate values below 200 words per minute tend to be considered too slow, and values beyond 250 words per minute too fast, irrespective of the observed emotion.
Table 13 presents the results of the correlation analysis between speech rate acoustic values and the evaluation labels assigned by the evaluators to each acoustic value. The analysis was carried out on the whole set of data (all emotions and both speakers) and separately for each emotion. The analysis of the table reveals a certain degree of correlation between assessment judgements and acoustic data, with statistically significant results for all emotions and overall, as well.
Table 14 presents the mean values for the articulation rate associated with each evaluation label, globally and separately for each emotion. Again, as for speech rate, a tendency for means to increase with the evaluation label is observed. However, in this case, the means for the ‘adequate’ label among emotions are more similar than for speech rate, and also, some correctness boundaries seem to arise: values below 12 phones per second tend to be considered slow; the upper boundary, however, is less clear in this case.
Table 15 presents the results of the correlation analysis between articulation rate acoustic values and the evaluation labels assigned by the evaluators to each utterance. The analysis of the table shows a significant degree of correlation between assessment judgements and acoustic data, as in the case of speech rate, with statistically significant results for all emotions and overall.
Table 16 presents the mean values for F0 range, expressed in semitones, associated with each evaluation label, globally and separately for each emotion. In this case, the tendency of the mean values to increase with the labels is less clear, but it can sometimes be detected. There are also differences in the mean values for the ‘adequate’ label among emotions, with the highest value for anger and the lowest value for fear, but in this case, the variability of the data makes it difficult to observe some lower or upper correctness boundaries.
The correlation data presented in
Table 17 for F0 range show a poor correlation of this parameter with the evaluation data, not statistically significant in any emotion nor globally.
Finally, as far as intensity is concerned,
Table 18 presents the mean values for this parameter associated with each evaluation label, globally and separately for each emotion. Again, the tendency of mean values to increase with the labels is less clear than for speech and articulation rates, with the exception of the ‘very low’ label, probably due to the low number of cases of this answer. There are also differences in mean values for the ‘adequate’ label among emotions, with the highest value for joy in this case and the lowest value for sadness. For this reason, upper and lower correctness boundaries also seem to be different depending on the emotion.
The correlation data for this parameter, presented in
Table 19, show a varying degree of correlation between acoustic data and evaluations depending on the emotion: joy is the one with the highest correlation and is statistically significant, but the rest show poorer correlation degrees and are not significant in any case. Global correlation, however, does appear to have a significant correlation level despite its relatively low correlation coefficient.
3.4. Discussion
The data presented in the previous section allow us to establish some tentative answers to the research questions established at the beginning of this work; that is, to what extent L2 Spanish evaluators are consistent in their judgements when they assess the productions of L2 Spanish learners, to what extent there is a correlation between the acoustic parameters and their assessment judgements on these parameters, and, finally, if it is possible to define acoustic thresholds of correctness for the chosen parameters for each of the emotions under investigation.
Data presented in
Section 3.3.1 show that assessments of the evaluators present significant differences among them for all the analyzed parameters (speech and articulation rate, pitch range and overall intensity). These differences are especially clear in the case of pitch range, with even some contradictory answers for the same utterance. These results are in accordance with previous analyses carried out with other profiles of evaluators and students (
Garrido et al., forthcoming) and support the idea that evaluation processes are influenced by several factors different to the acoustic properties of the signal.
Despite this fact, data also show that evaluators were able to capture actual acoustic differences between the prosody of both students; this is especially clear in the case of speech rate, in which speaker HB presents lower speech/articulation rate values than AT for all emotions, which are correlated with a higher number of ‘very slow’ and ‘slightly slow’ evaluations in all three evaluators; and in the case of intensity, speaker HB presents, in general, higher values than AT, a fact which seems to have an effect on the evaluator’s assessments, with a higher number of responses ‘slightly high’ for HB and more ‘slightly low’ responses for AT. In the case of pitch range, however, no such type of effect is observed. The performed correlation analysis carried out between assessment data and acoustic features provides additional evidence for this idea, with high correlation values in the case of speech/articulation rate, lower but still significant for some emotions in the case of intensity, and no apparent correlation in the case of F0 range. These results are also in accordance with those presented in (
Garrido et al., forthcoming), in which obtained speech rate values seemed to be correlated to some degree with the evaluator’s assessments. However, the study presented in (
Garrido et al., forthcoming) does not provide data for F0 range and intensity, so no comparison is possible in this case. The explanation for the differences found in the evaluation of these parameters is beyond the scope of this work, but one possible explanation is that some acoustic parameters were more difficult to evaluate than others by evaluators: speech rate or intensity are more understandable concepts than pitch range for an L2 Spanish teacher with no specific training on acoustic phonetics. Maybe a more precise description of these parameters in the evaluation rubrics would be helpful to avoid these hypothetical effects.
According to these results, it seems that the answer for the third research question is that it is possible to define acoustic correctness reference values for each assessment label, at least in the case of speech/articulation rate, as shown in
Table 12. The correctness reference values suggested by the data collected, approximately between 220 and 245 words per minute, are higher than those proposed in (
RAE 2018), between 130 and 200 words/min. They are also higher than the correctness data obtained in (
Garrido et al., forthcoming), using a text reading task as evaluation test and performed by Spanish Secondary School students: the speech rate values evaluated as correct by the evaluators (Secondary School teachers in that case) were around 150–160 words/min. These differences suggest that the correctness boundaries to evaluate emotional speech can be slightly different from those of other speaking styles.
Interestingly, the results obtained also suggest that reference values would be different for each target emotion: reference values obtained for speech rate seem to vary from emotion to emotion, with higher mean values for the ‘adequate’ label in the case of the utterances expressing anger and fear and lower values for sadness. Previous studies on the expression of basic emotions through prosody have already claimed the role of speech rate in expressing different emotions in Spanish (
Rodríguez et al. 1999;
Montero et al. 1999;
Francisco Gilmartín et al. 2005), so it is very likely that correctness criteria may vary from emotion to emotion for this parameter.
The amount of data handled in this pilot study, however, does not yet allow us to obtain reliable values associated with each label. More evaluation assessments for each item are needed indeed, but the results presented here suggest that the methodology applied in this study is adequate to define these types of reference values.
4. Conclusions
In this work, some results of the ProA project have been presented. One of them is the ProA web app for the evaluation of prosody, which facilitates and partially automates the design of tests, their completion and the evaluation of the completed tests by human evaluators. It includes a novel battery of tests for the diagnostic evaluation of prosody in different communicative situations, with different levels of communicative complexity inspired in the CEFR curricula, which make them adequate for their use in L2 Spanish learning. Another novel feature of the app is the inclusion of evaluation rubrics especially designed for diagnostic evaluation, with specific evaluation items for the different phonetic parameters related to prosody, such as pauses, intensity, speech rate or pitch range, which allow evaluators to provide more useful feedback to the evaluated person. Evaluators who have been using it during the evaluation of the material collected in the ProA project have given positive feedback about the tool, the tests and the rubrics but have also suggested some improvement proposals for the future.
The assessments collected with the ProA tool are being used to analyze experimentally the possibilities of defining objective reference values based on acoustic instead of perceptual data that could be used, for example, for automatic evaluation of prosody. The applied methodology is based on the comparison of the perceptual assessments made by human evaluators to specific phonetic properties of the evaluated utterances and specific acoustic parameters related to these phonetic features. A small example of these analyses, including data from the assessment made by three L2 Spanish teachers of a set of utterances with emotional content produced by two L2 Spanish learners, has been presented here. The results of this pilot study, although preliminary, are in line with previous studies carried out with other types of learners and communicative tasks and suggest that despite the different criteria that evaluators seem to apply when evaluating prosody, at least in the case of some parameters (speech rate is the clearest one), they do take into account the acoustic properties of the speech signal during the evaluation process, and they do use some inherent acoustic patterns as reference, which would be different depending on the communicative situation. However, the reference values presented in this study, obtained from a small number of evaluators, should be validated and refined in larger studies.


