Abstract
This study investigated possible gender bias on a vocabulary test, using a method suggested by Andrich and Hagquist to detect “real” differential item functioning (DIF). A total of 443 adult ESL learners completed all 228 items of the Peabody Picture Vocabulary Test (PPVT-IV). The 310 female and 133 male participants were assumed to be of equal competence, corresponding to levels B1 and B2 on the Common European Framework of Reference for Languages. Male participants outscored female participants, possibly due to the multiple-choice format and to the fact that most gender-biased questions favored men rather than women. Finally, our analysis process yielded only seven items out of 228 as showing gender DIF, which is much lower than the numbers reported in the literature for ESL tests. This low figure suggests that the high number of gender-related DIF items reported in previous research might be attributed to the use of DIF detecting methods that do not take into account artificial DIF stemming from the cross-contamination of test items.
1. Introduction
The literature on gender issues in language testing has shed light on a wide array of variables that researchers considered as potential contributors to differences in scores. Our compilation of such variables shows that differences in language test scores between male and female participants of similar competence are generally attributed to three broad categories of factors: motivation and attitudes toward reading, text topics, and the type of questions asked. Those three categories are briefly explained below.
1.1. Motivation and Attitudes
Females consistently outperform males on language tests that involve a wide range of functions or skills, as evidenced in score analyses of large-scale national and international language tests (see James 2010; Breland et al. 2004, for detailed reviews). A common explanation is that many L2 tests consist of reading tests or have a reading component, and female superiority has been observed consistently on reading tests. For example, (Chiu and McBride-Chang 2006) examined the scores of some 200,000 15-year olds from 43 countries on the 2000 Program for International Student Assessment (PISA), an international test of reading literacy (see (OECD 2002) for test details). Their analyses show a significant superiority for girls in every country, which the authors relate to the higher motivation and enjoyment that girls experience with reading, which accounts for 42% of the gender effect, as shown by their multilevel regression analyses. (Lynn and Mikk 2009) also analyzed PISA scores—this time for the 2000, 2003, 2006 versions of the test—and reach similar conclusions. The more positive attitude of females toward reading causes them to read more (Bügel and Buunk 1996; Lee and Schallert 2014; Li et al. 2014). A similar conclusion, that girls are better than boys on reading tests because of their better attitude and higher motivation toward reading, was drawn by other researchers on the basis of various tests in elementary schools (Diamond and Onwuegbuzie 2001; Cloer and Dalton 2001; Tse et al. 2006), middle school and high school (Lee and Schallert 2014; Piasecka 2010), as well as among adults (Afsharrad and Sadeghi Benis 2015).
1.2. Question Themes
Another explanation for the superiority of one gender over the other on language tests that have a reading component concerns the themes on which the texts and questions are based, i.e., whether they deal with male-oriented or female-oriented themes (see Gorjian and Javadifar 2013). Men and women’s alleged differences in their domains of interest would impact their reading comprehension; men would outperform women on topics such as sports and science, and underperform when the readings concern literature, language, or human sciences (Bügel and Buunk 1996; Chavez 2001; Doolittle and Welch 1989; Hyde and Linn 1988; Oakhill and Petrides 2007; O’Reilly and McNamara 2007; Schiefele and Krapp 1996). On a similar note, (Li et al. 2014; Pae 2012) provide overviews of the topics having been associated with gender advantages, and they also conclude that the female advantage resides in topics within the realm of social sciences and the humanities, while the male advantage is associated with “technical aspects of science” (Pae 2012, p. 534).
1.3. Item Types
It is recommended (Birjandi and Amini 2007; Pae 2004) that researchers consider item format and item type in addition to item content, and studies have indeed looked at the type of questions asked on language tests. Such studies rely mostly on the analysis of Differential Item Functioning (henceforth DIF). Results suggest that women should be superior when dealing with questions or items related to emotions and impressions, whereas men are expected to score better when logical inferences are needed, regardless of the topic at hand (Im and Huh 2007; Karami 2011; Pae 2004)1. Also, women appear to be better at identifying the main ideas of a text, while men’s strength seems to reside in spotting details (Im and Huh 2007; Yazdanpanah 2007).
Regarding the type of item on language tests, Breland and his colleagues (2004) reviewed studies on national tests, and note that “Gender differences on free-response writing examinations have tended to favor females” and that “Females also tend to score slightly higher than males on writing tests in populations for whom English is a second language” (p. 1). Breland and his colleagues proceeded to conduct such analyses on TOEFL test scores with a total sample of 69,201 females and 79,963 males from 221 countries with 145 different L1s, and reached the same conclusion. Of particular importance for the present study, is an exception to the overall female advantage on language tests: men show better performance on multiple choice questions, achieving higher scores than women (Breland et al. 1999; Ferber et al. 1983; Lin and Wu 2003) or at least equal to those obtained by women (Boyle 1987; Engin and Ortactepe 2014; Ryan and Bachman 1992). For example, (Breland et al. 1999) found that although females performed better on the essay portion of the TOEFL—and on the test overall—males tended to do better than females on the multiple-choice subtests of the TOEFL. An explanation for that phenomenon is that men with limited language proficiency are more willing to take risks when guessing, which would give them an edge on multiple choice questions (Aryadoust et al. 2011).
In fact, despite some studies that point to the opposite (e.g., Garner and Engelhard 1999), this higher propensity for males to guess answers on multiple-choice tests has been evidenced for a long time (e.g., Harris 1971; Rowley 1974). In a widely-cited meta-analysis of 150 studies on gender differences in risk-taking, (Byrnes et al. 1999) obtained solid evidence that males are more inclined to take risks than females, and that this difference is diminishing over time. This hypothesis about the gradual shrinking of that gap has found support in (Jodouin 2014), who found similar omission rates for both genders on a 2010 Canada-wide assessment. Multiple-choice is the most common format used in language testing (McNamara 2000). That format was adopted for the Peabody Picture Vocabulary Test, which is the language test under investigation in this study.
It could be argued that a high-stakes test would constitute an incentive for females and males alike to do their very best at guessing unknown answers and answering every question, and that perhaps the documented male advantage would only show up on low stakes tests. However, men’s higher willingness to guess makes them leave fewer unanswered items than women, in the case of low-stakes practice questions (Baldiga 2013) as well as for high-stakes tests such as the Psychometric entrance test (PET) for Israeli universities (Ben-Shakhar and Sinai 1991) or other university entrance exams (Pekkarinen 2015).
In addition, some studies suggest that, with equal ability and equal risk taking, men would show better guessing ability than women. For example, (Pekkarinen 2015) shows a male superiority of about 5%, while (Akyol et al. 2016) obtained a male superiority of about 2%, both studies being based on data from more than 15,000 participants.
Even though test creators take precautions to create fair tests by choosing gender-neutral topics and question types, the presence of items that will turn out to favor either men or women seems unavoidable. To that effect, (Li et al. 2014) examined 18 studies on gender DIF which employed a total of six different DIF formulas and found that an average of 23% [0–78] of test items show DIF, and that they favor males and females in equal proportions (although the Mantel-Haenszel DIF yields a higher percentage of female-biased DIF). The reason why an item will favor one gender over the other is not always easy to determine, but what matters is that efforts should be made to limit the number of such items in order to have an instrument that is as fair as possible.
1.4. Detecting Gender Bias through Differential Item Functioning
This study concerns the effective removal/modification of language test items affected by gender bias. To reach that goal, the correct identification of such items is of the utmost importance.
To determine which test items present differences across genders of similar ability, several methods have been used by researchers over the years to detect DIF. Outside the realm of Item Reponse Theory (IRT), two widely used methods that are common in research on language tests are Mantel–Haenszel (Holland and Thayer 1988), and logistic regression (Swaminathan and Rogers 1990).
The Mantel–Haenszel method uses a contingency table to test the independence of group membership (focal and reference) and the answer to a specific item, with respect to the total score. However, that method can only test uniform DIF. As its name suggests, the logistic regression method uses a logistic regression model to predict the correct answer to an item using three independent variables: total score, group membership and interaction between total score and group membership. It is worth mentioning that the logistic regression is more flexible because it can be used to test for both uniform and non-uniform DIF2.
However, (Osterlind and Everson 2009) highlighted a problem which is central to our study: “sometimes, for reasons unknown, calculations of a DIF detection strategy may suggest DIF, where none truly exists” (p. 21). (Hagquist and Andrich 2015) also raise this issue related to the use of common DIF detection methods: “A general problem observed in various DIF analyses, including the MH method, is that some items favouring one group can induce the appearance of DIF in others favouring the other group when in fact no DIF is present” (p. 344). This phenomenon of cross-contamination suggests that the number of DIF items detected by the usual methods tends to be inflated by artificial DIF, which could explain the high average figure of 23% of DIF items mentioned earlier.
To avoid the caveats of artificial DIF, (Andrich and Hagquist 2012; Andrich and Hagquist 2015) propose a method that consists of the resolution of the item that shows the highest amount of DIF, recalculating DIF among the remaining items (or non-resolved items), and repeating the process until the top DIF item shows a p value below the alpha level for significance. The resolving of a DIF item consists of splitting it into two new item sets: one containing only the responses of one group (e.g., the males) and the other containing the responses of the other group (e.g., the females). The rationale behind this process is that once an item with real DIF is resolved, it no longer spreads artificial DIF to other items. This method also presents the advantage of matching the groups under investigation, which is a clear advantage when their sample sizes diverge. (Andrich and Hagquist 2012; Andrich and Hagquist 2015) also demonstrated that the most efficient and logical process for identifying all items with real DIF was that sequential resolved process of the one item which showed the greatest initial DIF, until the absence of significant DIF leaves the researcher with what they label a “pure” set, i.e., a set of items with no DIF. (Hagquist and Andrich 2015) specify that “because the DIF identified is relative to the whole set of items analysed, the process presumes that only a minority of items have real DIF” (p. 345).
The improper identification of DIF items can lead to misinterpretation of the psychometric qualities of a test and to the unnecessary replacement of unbiased items, i.e. items that did not really show DIF. The method suggested by Andrich and Hagquist aims to help researchers and test designers to avoid those consequences by identifying DIF items with higher certainty. This is why, apart from the methods traditionally used to detect DIF, we will apply the Andrich and Hagquist procedure in our analyses.
1.5. The PPVT-IV
The widely known Peabody Picture Vocabulary Test, now in its fourth edition (PPVT-IV, (Dunn and Dunn 2007)) is a classic tool for measuring receptive vocabulary in American English. The test is standardized and regarded by its authors as suitable for testing all age groups, native and non-native speakers of English alike, regardless of English proficiency levels. The test consists of 228 items; for each of them one of four color images has to be selected, after the examiner has said the target word aloud (see Figure 1 for a sample item). The lexical items included in the test are presented in order of increasing difficulty; that is, they are gradually less and less likely to be known by the test-taker. This design makes it possible to start the test at a point appropriate for a certain age group (for normally developing native speakers only) in order to shorten the testing procedure. The recommended starting points for each age are provided by the designers of the test, and are valid only for the testing of native speakers. Although the PPVT-IV is also a tool for measuring the English ability non-native speakers, no starting point is provided for them, given the wide range of possible proficiencies. Having to begin the test with the first item makes the testing of non-native speakers more time-consuming than the native speakers. On the other hand, a common starting point makes group testing possible. The examiner is instructed to stop the test as soon as the test-taker commits eight errors within a 12-word set.
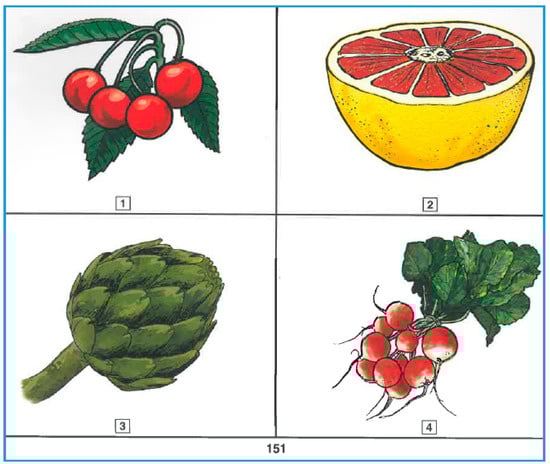
Figure 1.
Item sample from the Peabody Picture Vocabulary Test (PPVT) (citrus).
This test was chosen for our study because it has been used for a long time, in a wide variety of contexts, and it has undergone several newer versions that were as many opportunities to improve its psychometric qualities.
1.6. Item Bias and the PPVT
Although the PPVT has been studied for DIF related to race and income levels, gender-related item bias remains understudied (see Simos et al. 2011). The creators of the PPVT-IV conducted a “national tryout” in the United States, administering a total of 534 candidate items to 1,453 examinees aged 2.5 to 21. Differential item functioning allowed the test designers to remove the items that would favor an ethnic group or a gender, e.g., the word gaff, which showed bias against females. This procedure could suggest that the test contains no gender-biased items. However, only about 100 of the participants were adults. Given the frequent age-by-gender interaction observed in studies on language and cognition (see Ardila et al. 2011) there are reasons to believe that the items that show DIF among children might be different from those that emerge when testing adults. This issue is of relevance for researchers who use the PPVT-IV for testing ESL adults.
1.7. Objective
The primary goal of this study is to identify gender bias on a sample language test (the PPVT-IV) using the method suggested by (Andrich and Hagquist 2012; Andrich and Hagquist 2015) to extract items that show real DIF.
1.8. Hypotheses
Hypothesis 1.
The PPVT-IV scores are expected to be equal across genders.
On the one hand, as seen above, females tend to outperform males on language tests in general. On the other hand, the multiple-choice questions which form the PPVT constitute a format that tends to favor males, as was discussed in the above review of literature. The males’ superior performance on multiple choice tests is expected to counterbalance the female superiority generally expected on language tests.
Hypothesis 2.
The number of gender-DIF items is expected to fall below the 23% average for L2 tests reported in the literature.
The first reason that justifies this hypothesis is that the PPVT is at its fourth version. Subsequent versions of tests tend to increase their psychometric qualities. When adapted for use with other languages, the PPVT also tends to have high psychometric qualities. Examples of adaptations which are apparently successful in this regard include a Greek adaptation of the PPVT-III, which contains only 7% of DIF items (Simos et al. 2011), and a Malagasy version, which contains 8% (Weber et al. 2015). The second reason motivating our expectation of a low number of DIF items is that the method we will use should eliminate artificial DIF, which should help us identify only the items that show real DIF.
2. Material and Methods
2.1. Participants
A total of 443 adult ESL learners participated in our study, of which 70% (n = 310) were female and 30% (n = 133) were male. Females outnumbered males because a vast majority of our participants were from fields of human and social sciences, where males are less numerous3. All were adult university students enrolled in English courses, aged 18 to 46 (mean = 23.2). There was no statistical difference in age between males (mean = 22.1, SD = 4.0) and females (mean = 23.6, SD = 5.9).
Males and females are assumed to be of equivalent proficiency in English, since they belonged to the same language classes, to which they were assigned on the basis of their scores on the same placement tests (scores that were inaccessible to us for reasons of confidentiality). Despite the use of a placement test, there will always be some within-class variance in proficiency—which can even increase or diminish throughout a semester. We assume that this limited variance evens out across genders due to the high number of participants. Our participants’ levels of English corresponded to B1 and B2 on the Common European Framework of Reference for Languages (henceforth CEFR; Council of Europe 2011), with only a few participants at a lower (A2) or higher (C1) level. Being in the same class not only implies that our participants obtained comparable scores on their placement test, but it also means that their teachers judge them to be of equal competence, since a student who seems out of place for being apparently weaker or stronger than his classmates will be transferred to the appropriate level.
All the participants gave their informed consent for inclusion before they participated in the study. The study was conducted in accordance with the Declaration of Helsinki, and the protocol was approved by the ethics review boards of each college and university where testing took place.
2.2. Procedure
As was mentioned earlier, the Peabody was designed with individual testing in mind (one test administrator and one test taker). However, there is no reason why the test cannot be administered to groups of participants, especially if they are non-native speakers of English. In the case of native speakers, as was mentioned before, the procedure involves starting at an age-appropriate point in the test. This method, however, was simply designed to shorten the duration of the tests and make it less tedious for the test taker. With non-native speakers, the examiner has to begin at the beginning, since the appropriate starting point cannot be determined on the basis of the participants’ age. The test can thus easily be administered to a group of non-native speakers, since they all would be beginning at the same point if tested individually.
Concerning the procedure of finishing after a certain number of errors have been made, when the test is completed by a group, every participant continues until the end of the test. The answers can later simply be disregarded from the appropriate point onwards, and the final result obtained in this way is identical to the one that would have emerged from individual testing. However, for research purposes, there is an additional advantage to having every participant continue until the end of the test. Completing the whole test means going beyond the point at which testing would normally end, which ensures that considerable guessing will take place. The obvious benefit of this procedure is that it allows us to test the hypothesis according to which male examinees would be more inclined to make guesses, leading to a higher performance on their part, as mentioned above.
In this study, large numbers of participants were needed, which rendered individual testing unsuitable, as it would require vast amounts of time, while providing no advantage over group testing. Therefore only a small number of our participants completed the test in an individual setting, while an overwhelming majority (97%) were tested in groups of about 20 people, with the test slides projected on a screen in front of the group. The handful of participants who were tested individually (fewer than 10) were tested the same way as those who were tested in groups, with the same answer sheet, at the same pace, and to the same extent, i.e., completed the whole test. Each participant received an answer sheet with all 228 slide numbers and spaces to write down the letter (a, b, c, or d) of the image that corresponded to what they thought was the correct meaning of the word they heard. The examiner made sure that all participants had sufficient time to write down the answer for each item. In this way, each participant’s answers on the entire test were obtained, even though some of the participants would not have reached the end (i.e., item 228) with the procedure normally used for individual testing. The PPVT provides the pronunciation to use for the less common items, and the three experimenters used the American English pronunciation and were instructed on the pronunciation to adopt for words which may have more than one (e.g., lever). The administration of the test was presented and perceived as a mundane event, and participants felt no anxiety about being wrong, and saw no potential gain of any kind in obtaining a high score. Since examiners made sure every examinee had time to respond to each item, total test time varied slightly across groups, and ranged from 22 to 29 min.
2.3. Data Analysis
The data analysis followed multiple steps. First of all, of the 101,004 possible answers (443 participants × 228 items), there were 978 missing answers. The percentage of missing answers on our test was therefore at 0.97%, and is equal across genders. In our data matrices, a score of zero was attributed for those missing answers. Following this imputation, we performed a t test to compare item scores between male and female participants. The next step consisted of investigating the reliability of the PPVT-IV by examining coefficients for Cronbach’s alpha and for the person separation index. The Rasch model (1960) was used. This model computes item difficulty and respondents’ ability, which can be used to assess the psychometric quality of the test. It is becoming a common statistical tool to investigate the presence of phenomena such as gender DIF (e.g., Aryadoust 2018). Finally, we applied a method developed by (Andrich and Hagquist 2012; Andrich and Hagquist 2015) to detected “real” DIF in the PPVT-IV. A two-way analysis of standardized residuals is used to test three hypotheses: (i) the presence of uniform DIF (identified as “Gender” is Table 1, Table 2 and Table 3), (ii) the presence of non-uniform DIF (identified as “Gender-by-class-interval” is Table 1, Table 2 and Table 3), and (iii) if at least one class interval is different from the others (identified as “class interval” is Table 1, Table 2 and Table 3).4

Table 1.
Items with differential item functioning (DIF) before the resolving process (α = 0.05; with Bonferroni correction: α = 0.000081).
Table 2.
Results (α = 0.05; with Bonferroni correction: α = 0.000081) after resolving items 59, 104 and 83.
Table 3.
Results (α = 0.05; with Bonferroni correction: α = 0.000081) after resolving items 59, 104, 83, 221, 147 and 95.
We proceeded by sequentially resolving the item with the highest uniform DIF, by splitting it into male vs. female responses, as explained earlier. We set the alpha value at 0.05 along with a Bonferroni correction (based on the number of items), to minimize the occurrence of type 1 errors where non-DIF items could be identified as DIF items. A Bonferroni correction reduces the alpha value, which should result in fewer items identified as showing DIF. For technical details of that method, the interested reader can consult the relevant publications by its proponents (Andrich and Hagquist 2012; Andrich and Hagquist 2015). The Rasch and DIF analysis were performed using the RUMM2030 software (Andrich et al. 2013).
3. Results
3.1. Psychometric Properties of the Data Matrix
The average item score obtained by men on the whole test was 0.80, which was significantly higher (t = 5.4, p < 0.001, df = 450, SE = 2.11) than that obtained by females, which was 0.76.
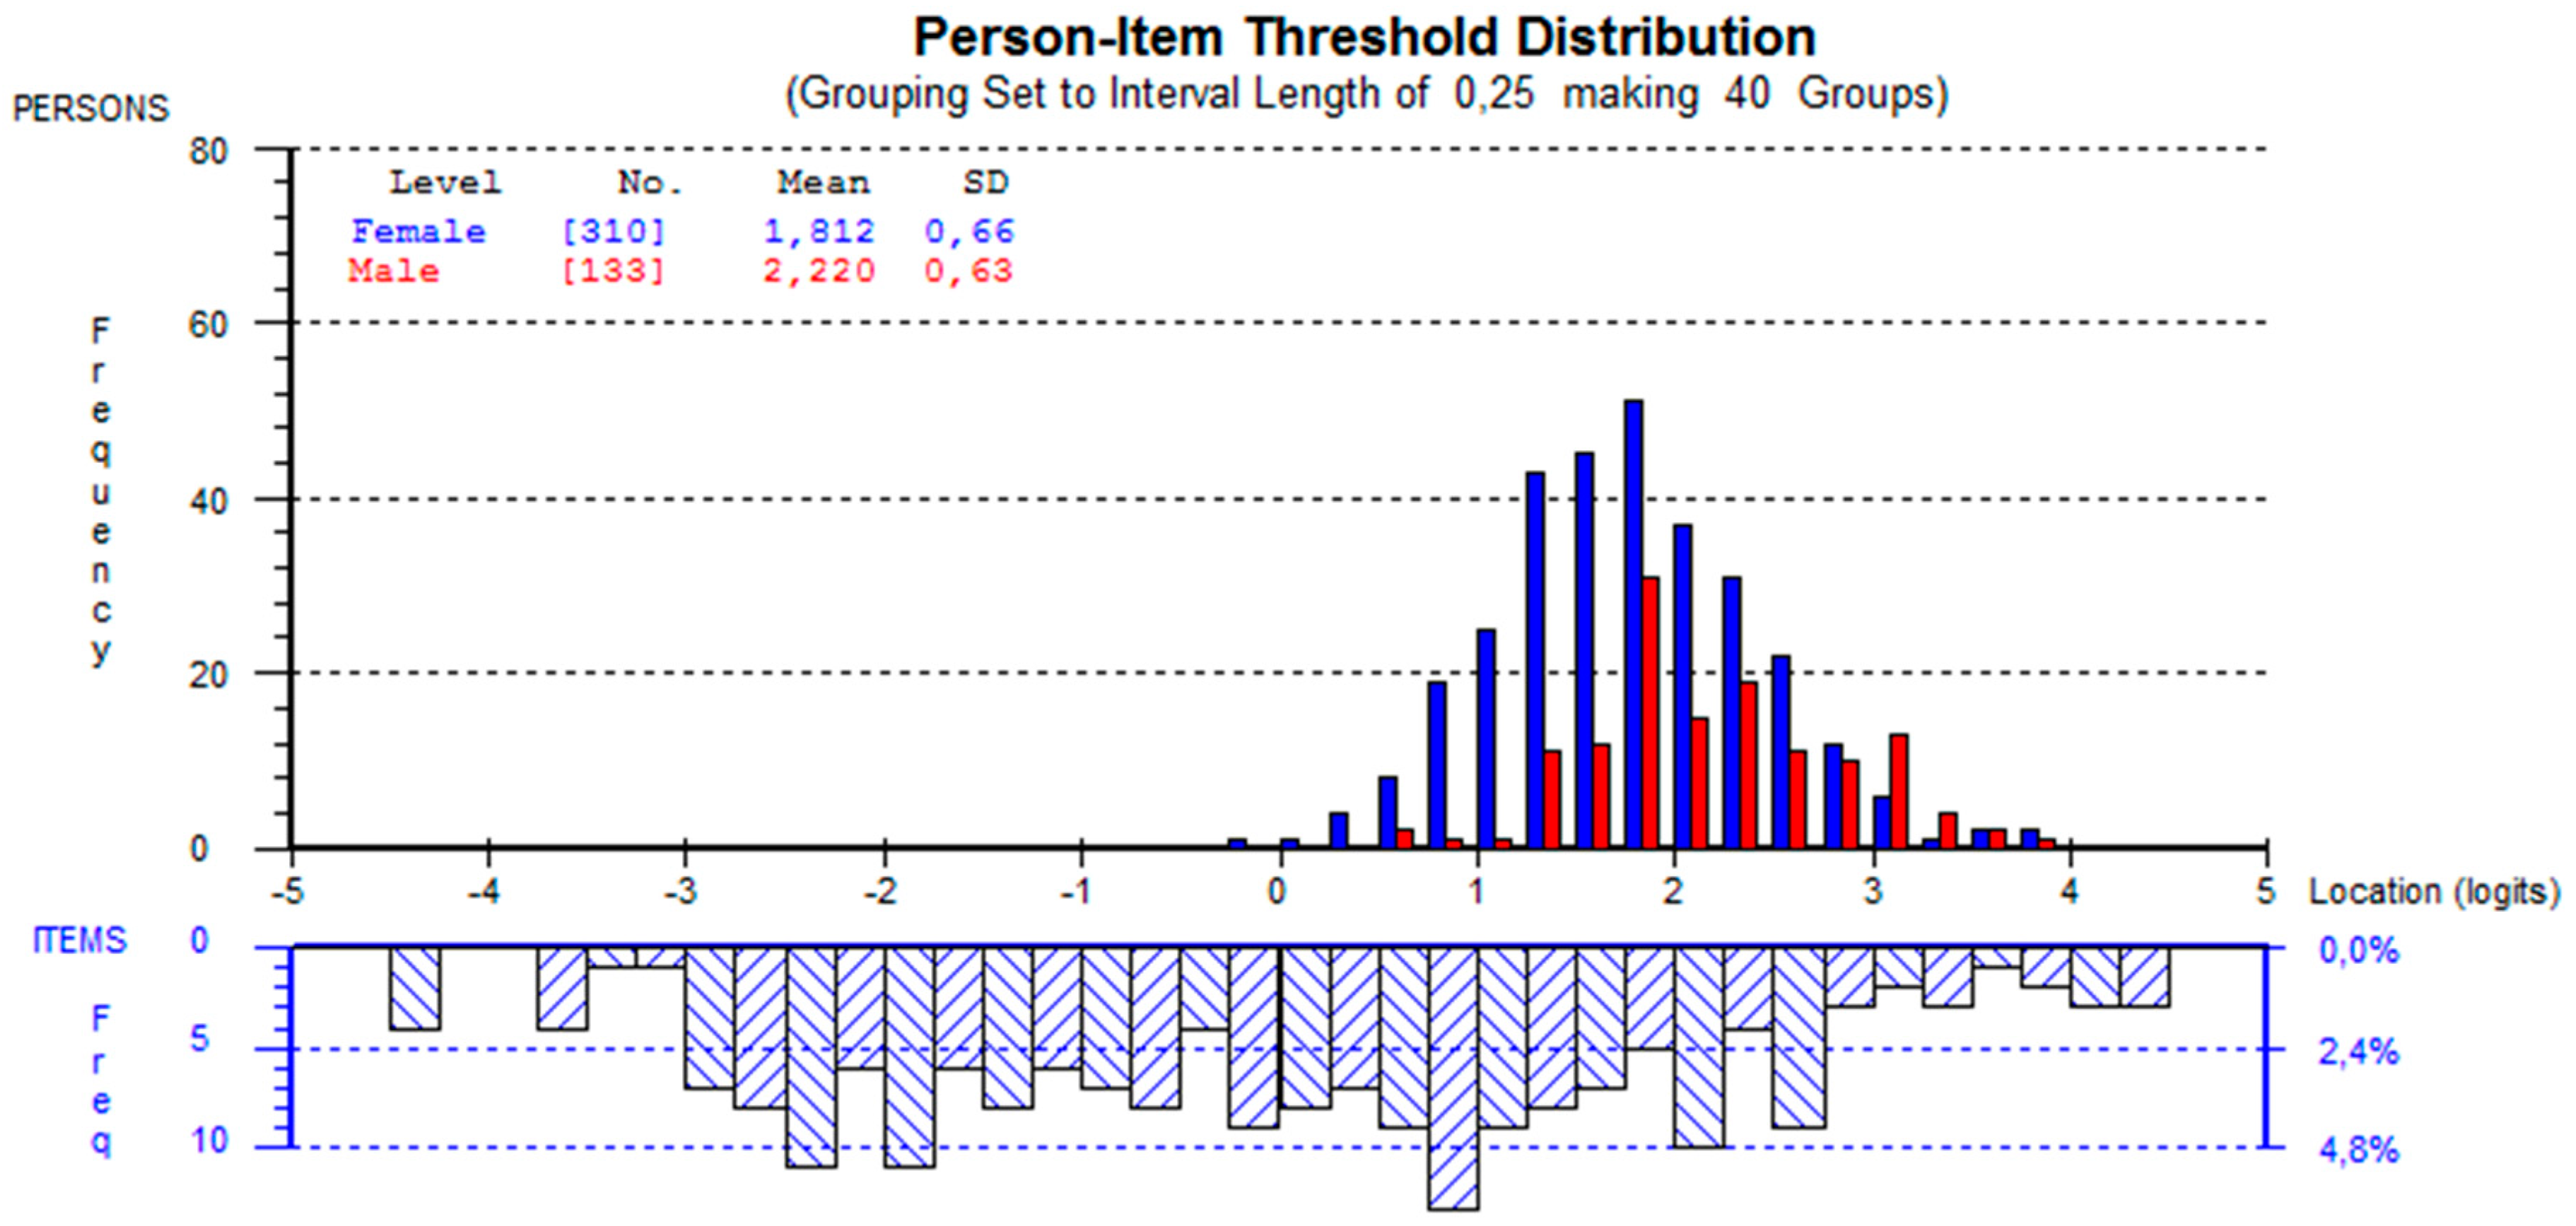
The reliability of the PPVT-IV is high: we obtained a Cronbach’s alpha of 0.91 and a person separation index of 0.91. Based on the log residual test of fit statistics, less than 5% of the test items showed a bad fit after a Bonferroni correction. The person-fit index was also low: only 1.5% of respondents showed a bad fit using the same range of log residual values. Figure 2 below displays the item-person histograms. The histograms suggested that although item difficulties were generally well distributed, the ability of females (represented by the diagonal lines in the person’s histogram) and males (represented by horizontal lines) were generally high, which means that the test contains a high number of easy items for our participants.

Figure 2.
Item person map.
3.2. Analysis of DIF before Resolving Items
When applying the Mantel–Haenszel test to our PPVT-IV scores, 13 items show gender DIF. With logistic regression, 18 items show gender DIF. Both methods agree on 11 items, and alpha values are obtained without a Bonferroni correction. The main argument in favor of using an alternate method—the one proposed by Andrich and Hagquist—is of a logical rather than an empirical nature. It is based on the need to avoid the identification of items affected by false DIF stemming from other items. Confirmation of such avoidance would be in the form of lower numbers of DIF items using Andrich and Hagquist, in comparison to Mantel–Haenszel and to logistic regression.
As mentioned earlier, a problem which is central to our study is that “the exact magnitude of real DIF in one item is distributed as artificial DIF among the remaining items” (Andrich and Hagquist 2012, p. 396). We applied the method proposed by Andrich and Hagquist, that consisted of resolving (instead of eliminating) the item that shows the highest amount of DIF, recalculating DIF among the remaining items, and repeating the process until no significant DIF is detected.
Using the (Andrich and Hagquist 2012; Andrich and Hagquist 2015) method, we originally detected seven items showing DIF. Table 1 presents the items with DIF before the resolving process. The F-values associated with those seven items, along with their p-values below the post-Bonferroni alpha of 0.000081, are shown in the “Gender” columns. We also investigated the presence of non-uniform DIF; as can be seen in the “Gender-by-class interval” columns, all p values are above the alpha level, indicating uniform DIF. Finally, the columns entitled “Class interval” show that in the case of items 59, 147, 95 and 71, at least one of the six class intervals is different from the five others, as suggested by their p-values below the post-Bonferroni alpha level.5
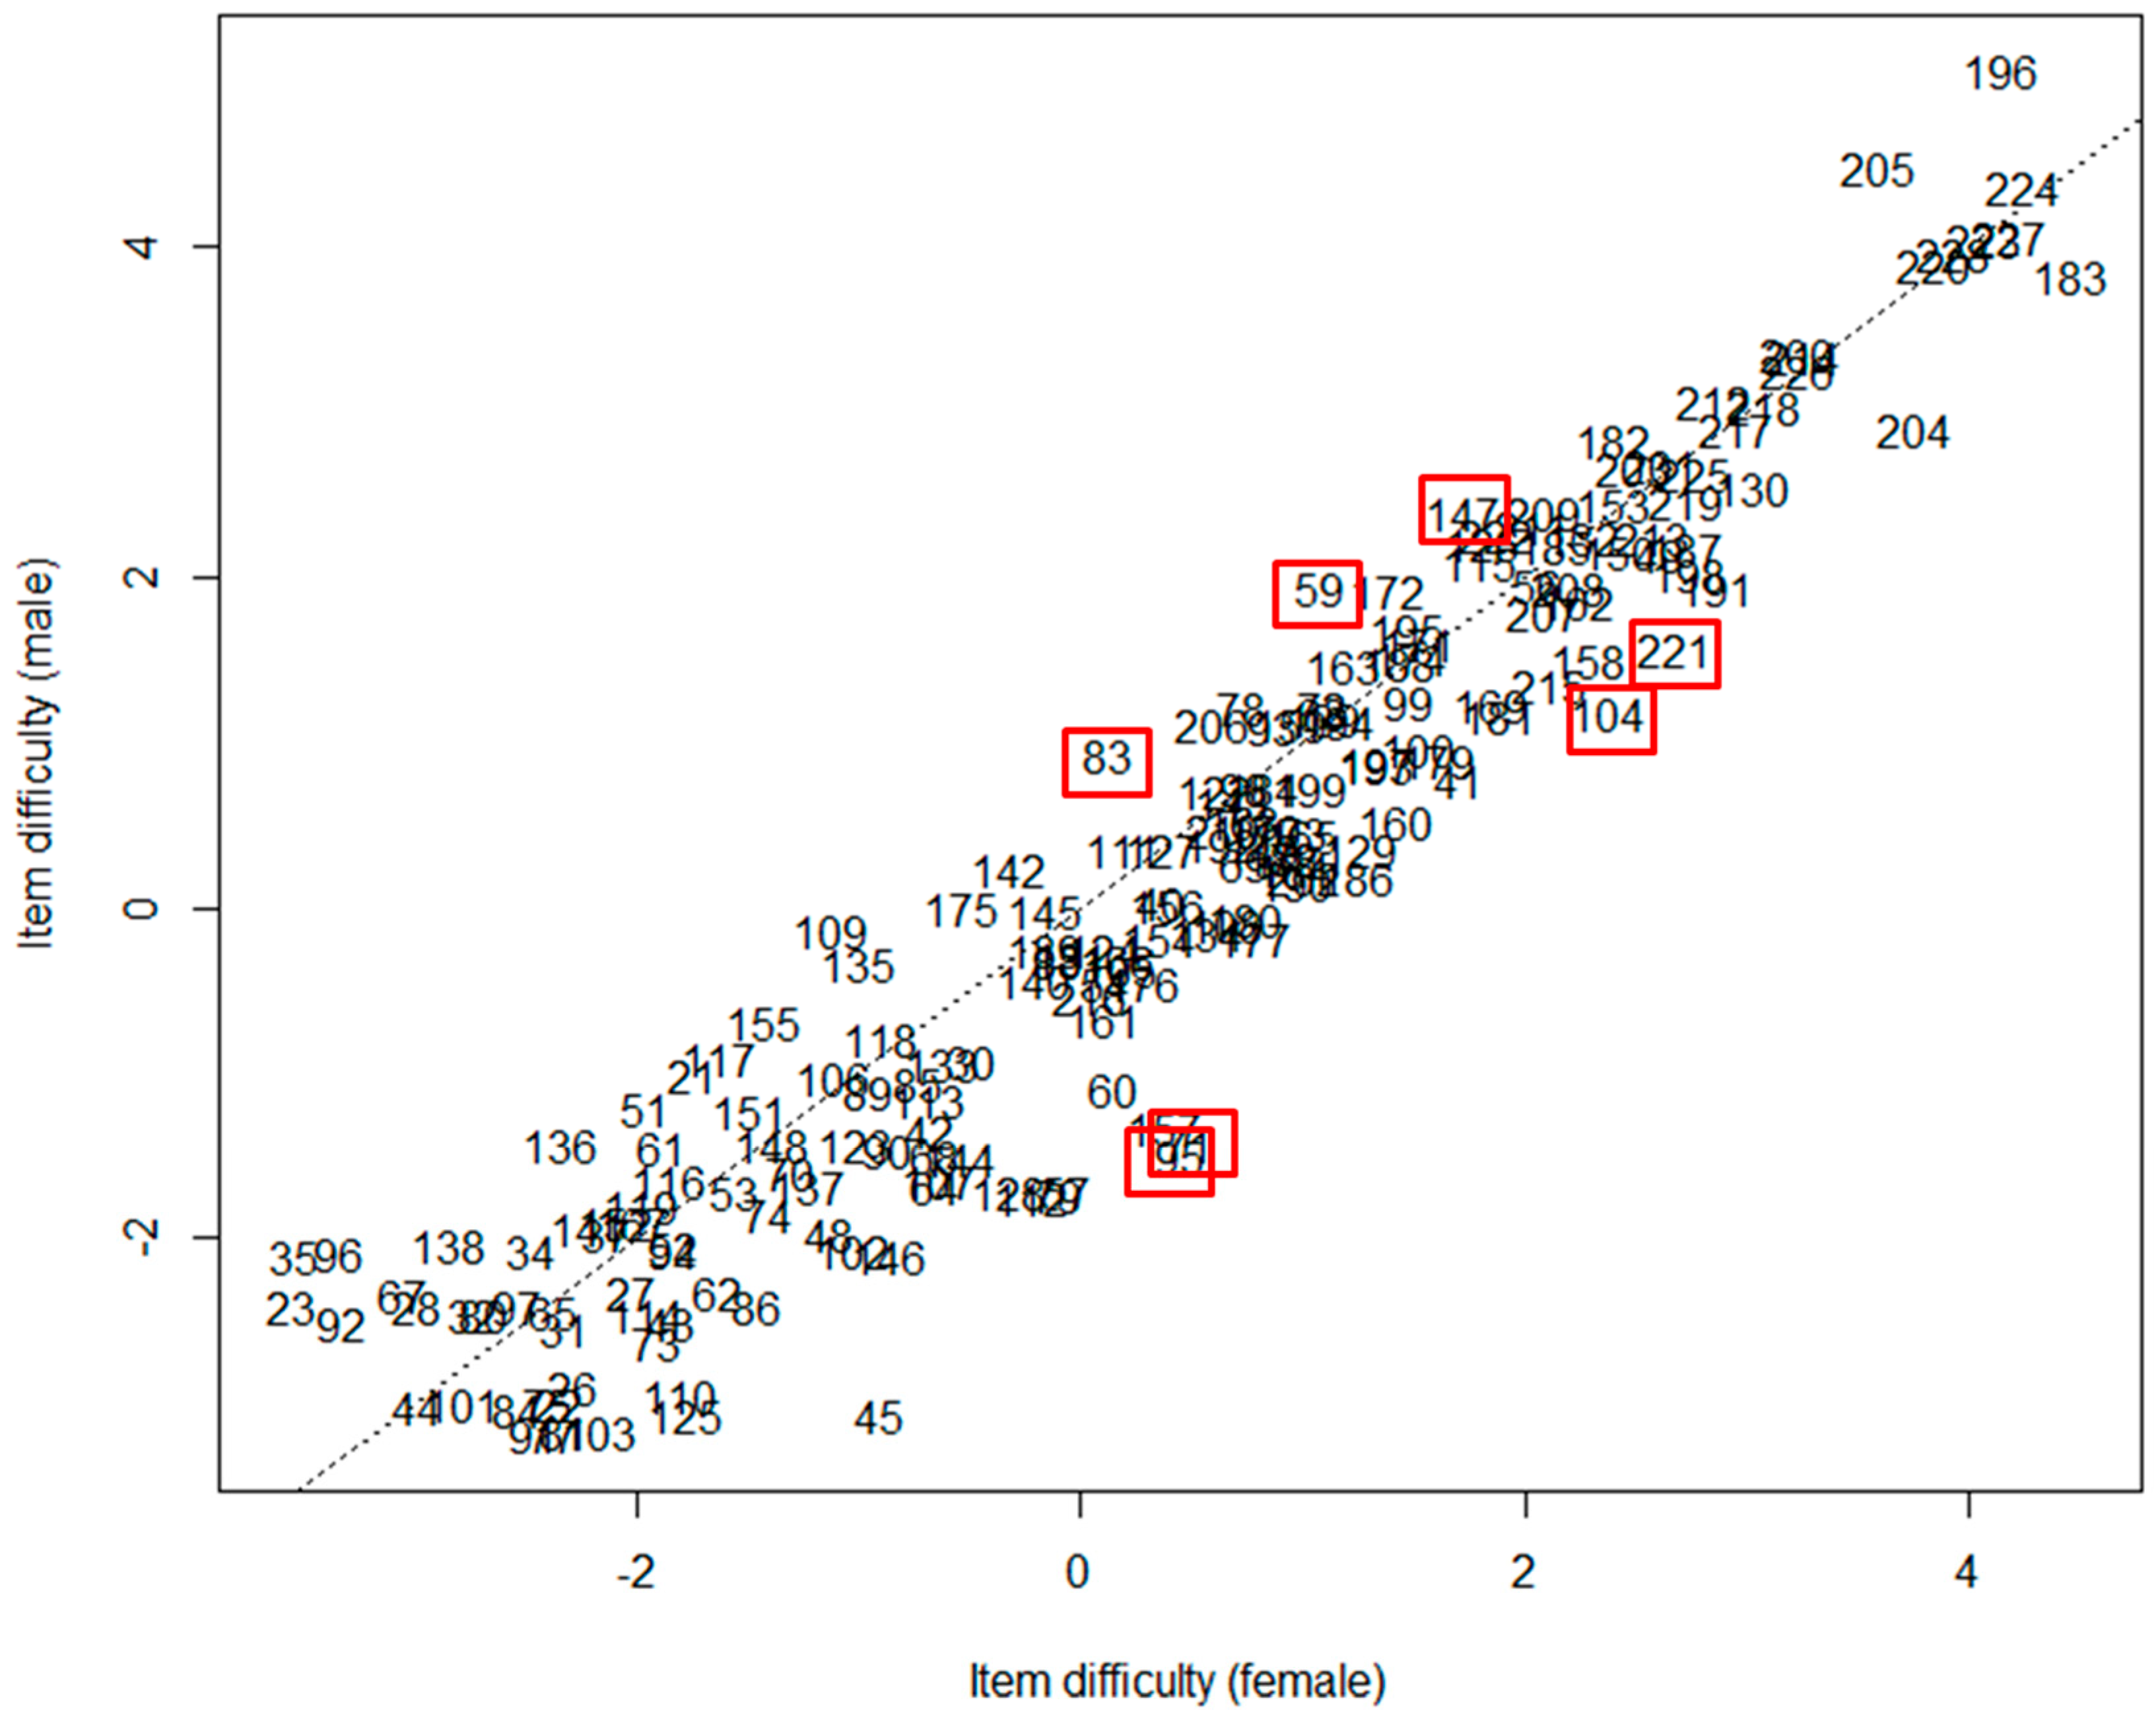
Figure 3 below shows a scatterplot of item difficulty based on gender differences. Equality between item difficulties is represented by the diagonal dashed line. As can be seen, the items we have identified as showing DIF (in boxes on the figure) tend to be located the furthest away from the diagonal.
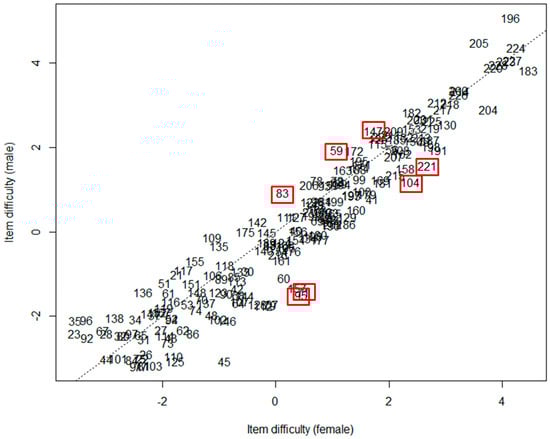
Figure 3.
Gender-based item difficulty (items with differential item functioning (DIF) in boxes).
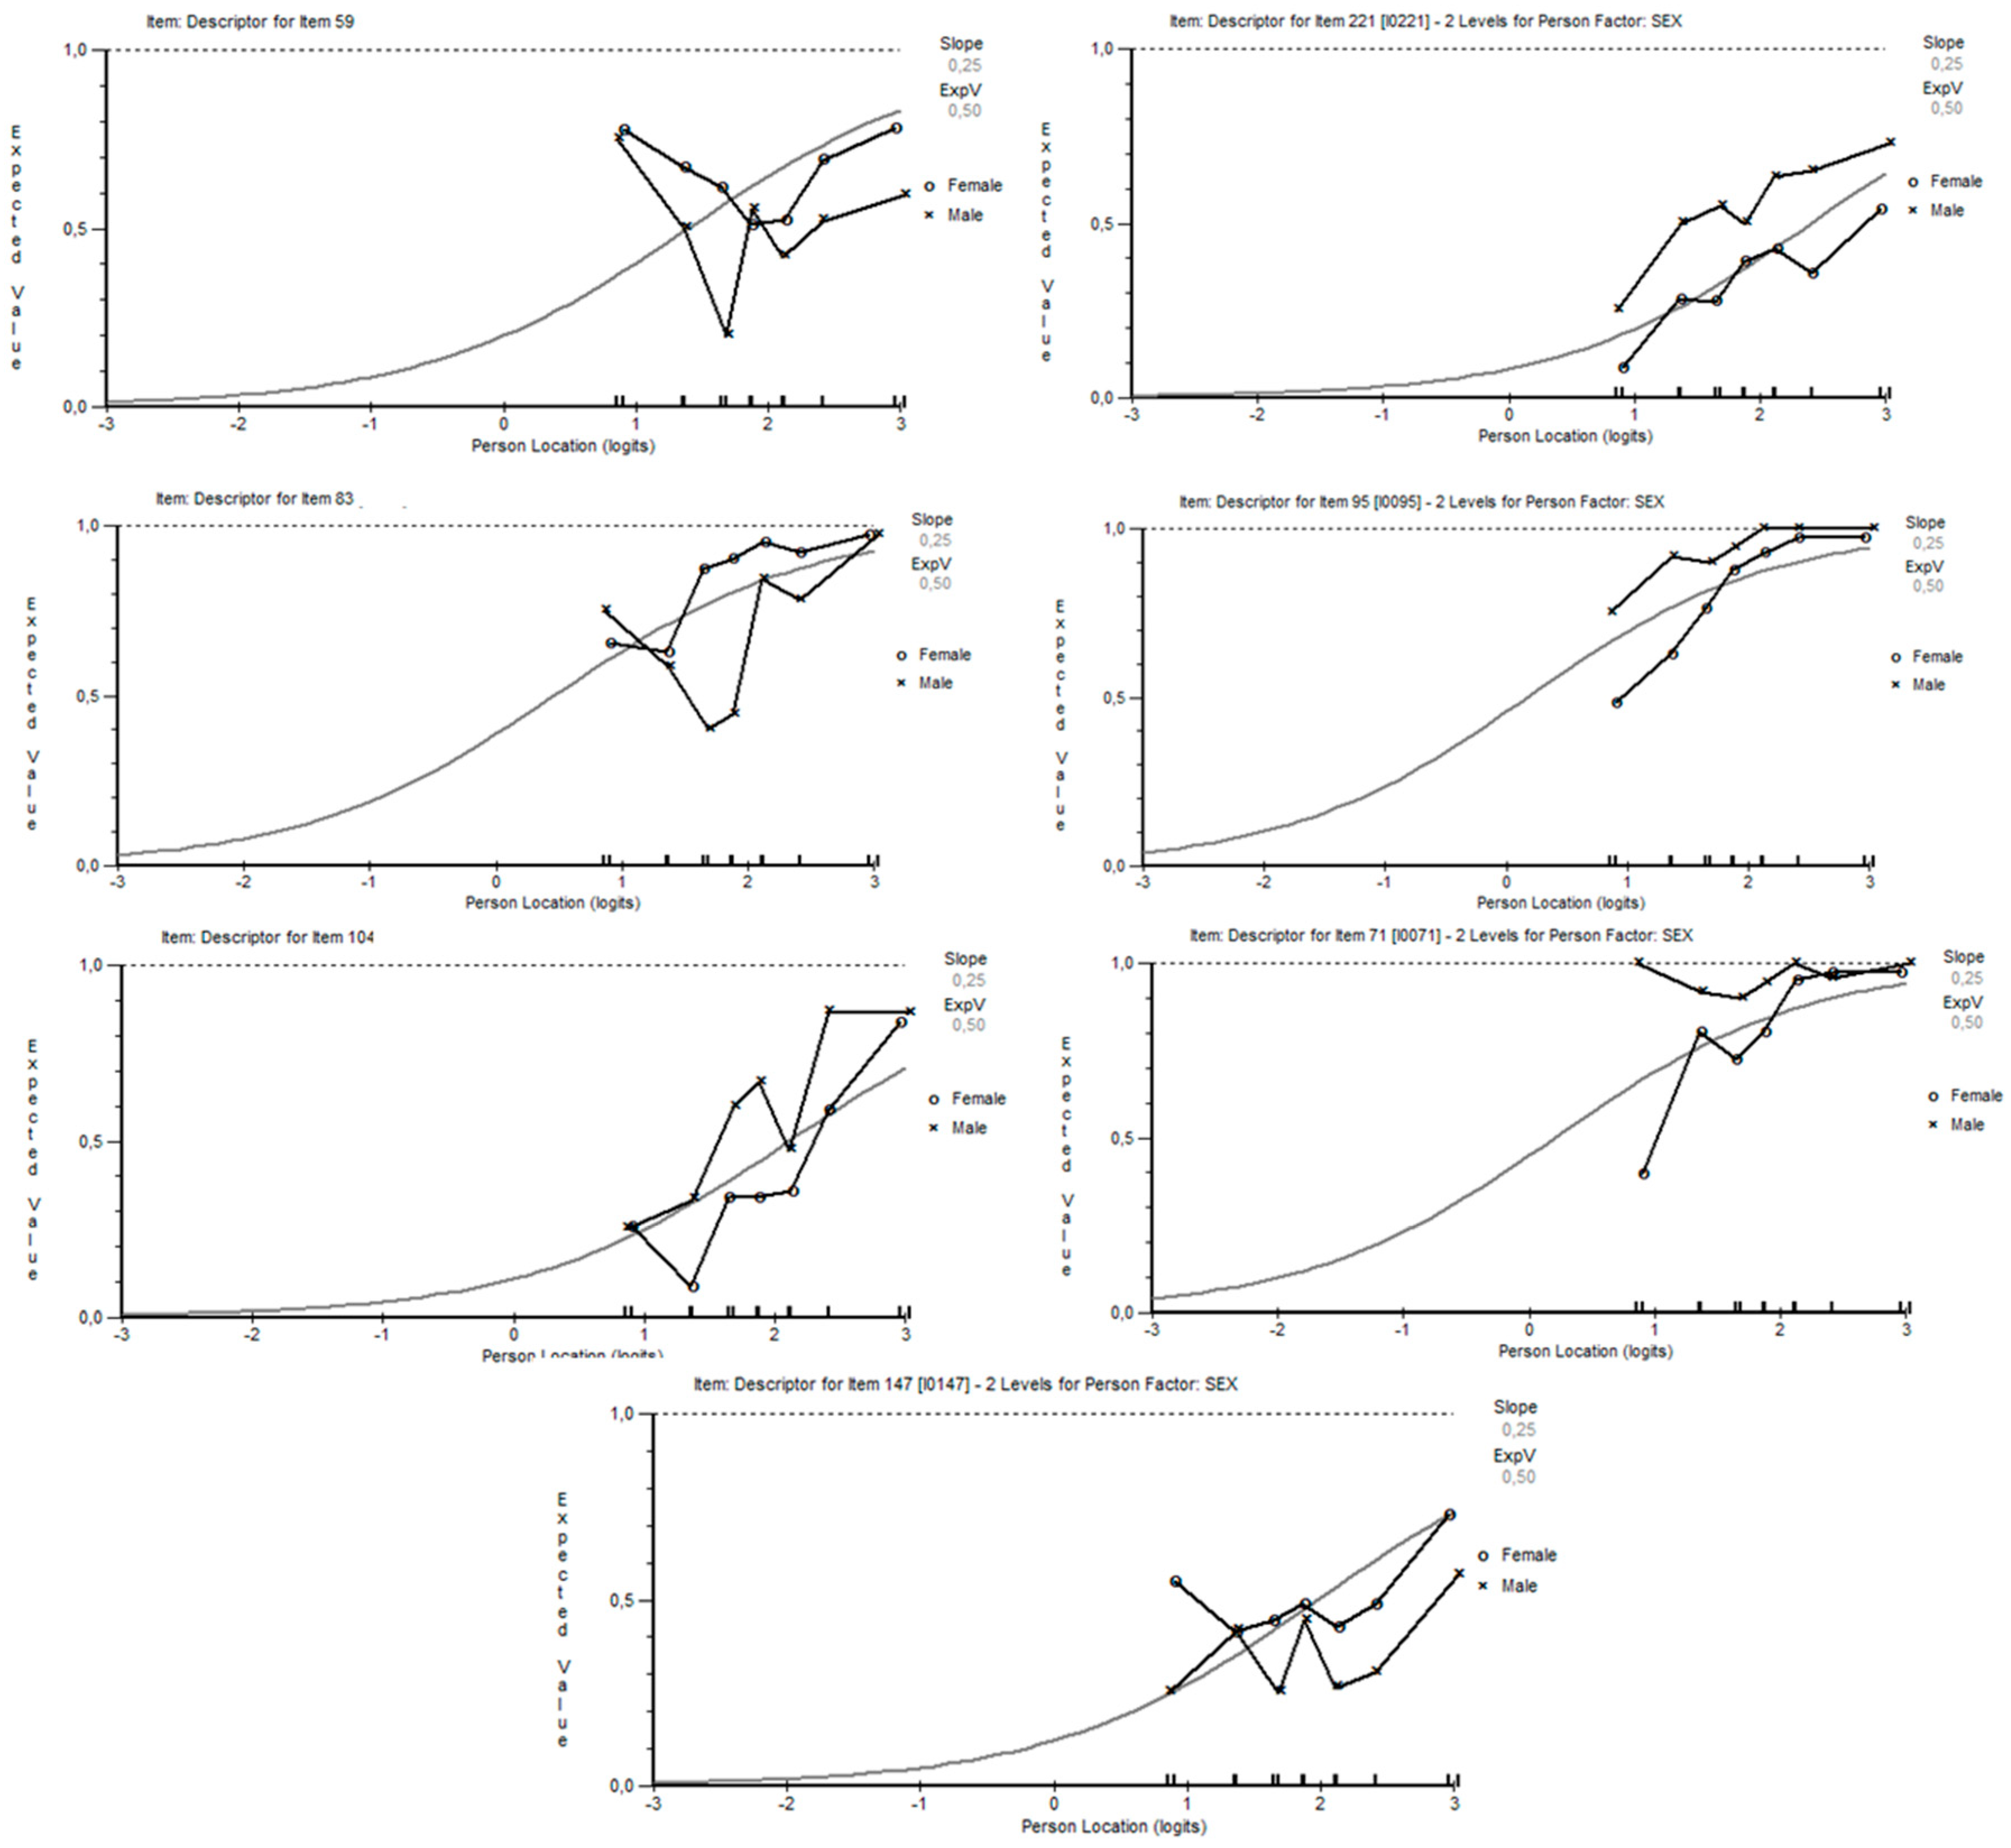
The graphs in Figure 4 show the behavior of gender DIF across seven class intervals along a continuum of score difficulty. We can easily see that items 59, 83, and 147 favor females, because their presence above the curve reflects higher difficulty for males. On the contrary, the other four items in squares (below the curve) suggest that males have a higher probability of providing a right answer for those items.

Figure 4.
Item characteristic curves of DIF items (from left to right: items 59, 221, 83, 95, 104, 71, 147).
3.3. Analysis after Resolving DIF Items: A Quest for Real DIF
Based on the F values of Gender differences from Table 1, Table 2 displays the results after resolving the three items with the highest DIF. As evidenced, even though the p-values are slightly higher, every item falls under the threshold value rejection of α = 0.000081.
Table 3 presents the results when the next three items with the largest DIF are resolved. Again, we see that DIF was detected for item 71. However, the p-value of this item is very close to 0.000081. Once this seventh item gets resolved, no more items show significant DIF.
4. Discussion
As was shown above, using the Andrich and Hagquist method for detecting gender DIF in the PPVT-4 yields a smaller number of items which show DIF than those detected using logistic regression and the Mantel–Haenszel test. This is consistent with that the claim that the Andrich and Hagquist method is superior to the non-IRT methods because it avoids detecting items in which DIF is not really present, but appears to be, due to contamination from items with real DIF. The resolving of DIF items according to the procedure suggested by Andrich and Hagquist thus seems to provide a solution to the problem of artificial DIF. We now proceed to discuss the results in light of the two hypotheses that were formulated.
Hypothesis #1.
The PPVT-IV scores are expected to be equal across genders.
We expected scores for males and females to be statistically equal, assuming that the male-friendly MCQ format would counterbalance the females’ usual superiority on language tests. Since men scored significantly higher than women, our first hypothesis is not supported by our results.
As was mentioned earlier, men are assumed to be better on multiple choice questions because they are more willing to take risks. Fifteen years after Byrnes et al. hypothesized that the male advantage in risk taking was shrinking, (Jodouin 2014) found “that there was no difference in the omission patterns between boys and girls” (p. 72). We add further support for this observation by also obtaining similar response rates for both genders.
Given the very low number of missing answers from our respondents (below 1%) and the fact that this number was equal across genders, in this study females proved to be as willing to take risks as males on that test, casting doubt on the willingness-to-take-risks hypothesis as an explanation. In addition, if higher risk-taking was the explanation, the low percentage of missing answers on our test would prevent male superiority from showing any effect, and would yield the usual pattern of females outperforming males on a language test. However, the opposite occurs, with men scoring higher than women.
Hypothesis #2.
The number of gender-DIF items is expected to fall below the 23% average for L2 tests reported in the literature.
As was mentioned earlier, the 18 studies that were compiled by (Li et al. 2014) contained an average of 23% of DIF items, and were all based a single “traditional” method for detecting DIF. In our case, DIF was assessed using the detection method advocated by (Andrich and Hagquist 2012; Andrich and Hagquist 2015) to eliminate artificial DIF. With a resulting alpha value of 0.000081 after a Bonferroni correction, the method yielded fewer DIF items, as could be expected. Only seven items among the 228 that comprise the PPVT-IV, corresponding to a percentage of gender-DIF items of 3%, supporting our second hypothesis. Three of the seven DIF items favor women, while the other four favor men.
The fact that single, traditional methods of detecting DIF tend to provide higher figures can be well illustrated with the example of the test which is under scrutiny in the present study. As mentioned earlier, when the Mantel–Haenszel test and logistic regression are applied to our PPVT-IV scores, the number of items showing gender DIF is considerable, with either 13 items or 18 items respectively. A likely explanation for the fact that those methods identify a higher number of DIF items is that they do not exclude “artificial DIF” items, i.e., items who appear to show DIF as a result of cross-contamination from real DIF items.
Regarding the nature of the items that show DIF, explaining why certain items will favor a subgroup over the other(s) is not always possible and is often a matter of pure conjecture. Nevertheless, the three items that favor women seem to relate to fashion and clothing: the words vest, waist, and garment are all words that be encountered when shopping for clothes. The items that favor men seems to be of a scientific or technical nature.6
5. Conclusions
Making changes to a standardized test is a delicate and tricky endeavour because each item change might have psychometric repercussions on various levels. Consequently, test designers must be sure that an item presents a weakness that is both real and important enough to justify its replacement. With this consideration in mind, it is imperative to be as certain as possible that the items selected for replacement really show DIF. By not eliminating artificial DIF, methods such as Mantel–Haenszel and logistic regression could overestimate the number of DIF items. As a consequence, test designers could be tempted to replace items that were adequate in the first place. Those methods might also give researchers a distorted view of the psychometric qualities of their test and/or lead them to misinterpret their data. It is thus important to use the method suggested by (Andrich and Hagquist 2012; Andrich and Hagquist 2015), which aims to identify DIF items with higher certainty.
Our analysis reveals very good psychometric qualities of the PPVT-IV with respect to gender bias, with only seven items showing gender-related DIF. We can also conclude that item themes do play some role in favoring gender groups, as the men’s top items are mostly related to science, while the women’s top items pertain to fashion-related themes. Knowing that, in addition to question type, question themes can also cause gender bias, a lingering question concerns whether male and female domains of interest are culture-specific or universal. Future research could examine this question by involving test takers from a wide variety of cultures.
The higher scores obtained by male participants cannot be explained by gender bias. Assuming that the three items favoring women are counterbalanced by three of the items favoring men, there remains only one DIF item (at α = 0.05) out of 228 that would tilt the balance in favor or men. A single item out of 228 is a figure much too low to serve as a possible explanation for any observed difference in scores across genders. Our results confirm the conclusion of previous researchers that male test-takers benefit from a multiple-choice test format. However, our results also suggest that the explanation usually provided in the literature—that of men’s higher willingness to take risk—is not sufficient to explain the advantage males have on the test.
It should be stressed again that, with a mere seven items showing gender DIF, the PPVT-IV is more devoid of gender bias than the average language test. Our results suggest that the test possesses psychometric qualities which ensure that gender bias does not affect results significantly. Nevertheless, when used with adult ESL learners, test administrators should be aware of the handful of items that seem to favor males over females.
Author Contributions
Conceptualization, F.P.; methodology, F.P. and S.B.; validation, J.L.; formal analysis, S.B.; investigation, F.P. and J.L.; data curation, S.B.; writing—original draft preparation, F.P.; writing—review and editing, J.L.; visualization, S.B.; supervision, F.P. and S.B.; project administration, F.P. and J.L.
Funding
This research received no external funding.
Conflicts of Interest
The authors declare no conflict of interest.
References
- American Academy of Arts and Sciences (AAAS). 2018. Gender Distribution of Advanced Degrees in the Humanities. Available online: https://www.humanitiesindicators.org/content/indicatordoc.aspx?i=47 (accessed on 2 May 2019).
- Afsharrad, Mohammad, and Aram Sadeghi Benis. 2015. Differences between monolinguals and bilinguals/males and females in English reading comprehension and reading strategy use. International Journal of Bilingual Education and Bilingualism, 1–18. [Google Scholar] [CrossRef]
- Akyol, Pelin, James Key, and Kala Krishna. 2016. Hit or Miss? Test Taking Behavior in Multiple Choice Exams. Available online: http://mysu.sabanciuniv.edu/events/sites/mysu.sabanciuniv.edu.events/files/units/FASS%20Editor/multiple_choice_exams.pdf (accessed on 2 May 2019).
- Andrich, David, and Curt Hagquist. 2012. Real and artificial differential item functioning. Journal of Education and Behavioral Statistics 37: 387–416. [Google Scholar] [CrossRef]
- Andrich, David, and Curt Hagquist. 2015. Real and artificial differential item functioning in polytomous items. Educational and Psychological Measurement 75: 185–207. [Google Scholar] [CrossRef] [PubMed]
- Andrich, David, Barry Sheridan, and Guanzhong Luo. 2013. RUMM2030: A Windows Interactive Program for Analysing Data with Rasch Unidimensional Model for Measurement. Perth: RUMM Laboratory. [Google Scholar]
- Ardila, Alfredo, Monica Rosselli, Esmeralda Matute, and Olga Inozemtseva. 2011. Gender differences in cognitive development. Developmental Psychology 47: 984–90. [Google Scholar] [CrossRef] [PubMed]
- Aryadoust, Vahid. 2018. Using recursive partitioning Rasch trees to investigate differential item functioning in second language reading tests. Studies in Educational Evaluation 56: 197–204. [Google Scholar] [CrossRef]
- Aryadoust, Vahid, Christine Goh, and Lee Ong Kim. 2011. An Investigation of Differential Item Functioning in the MELAB Listening Test. Language Assessment Quarterly 8: 361–85. [Google Scholar] [CrossRef]
- Baldiga, Katherine. 2013. Gender Differences in Willingness to Guess. Management Science 60: 434–48. [Google Scholar] [CrossRef]
- Ben-Shakhar, Gershon, and Yakov Sinai. 1991. Gender differences in multiple-choice tests: The role of differential guessing tendencies. Journal of Educational Measurement 28: 23–35. [Google Scholar] [CrossRef]
- Birjandi, Parviz, and Mohadeseh Amini. 2007. Differential item functioning (test bias) analysis paradigm across manifest and latent examinee groups (on the construct validity of IELTS) [special issue]. Journal of Human Sciences 55: 1–20. [Google Scholar]
- Boyle, Joseph. 1987. Sex differences in listening vocabulary. Language Learning 37: 273–84. [Google Scholar] [CrossRef]
- Breland, Hunter, Brent Bridgeman, and Mary Fowles. 1999. Writing Assessments in Admission to Higher Education: Review and Framework. Report 99-3. New York: Entrance Examination Board. [Google Scholar]
- Breland, Hunter, Yong-Won Lee, Michelle Najarian, and Eiji Muraki. 2004. An Analysis of TOEFL CBT Writing Prompt Difficulty and Comparability for Different Gender Groups. TOEFL Research Report No. 76. Princeton: Educational Testing Service. [Google Scholar]
- Bügel, Karin, and Bram Buunk. 1996. Sex differences in foreign language text comprehension: The role of interests and prior knowledge. The Modern Language Journal 80: 15–31. [Google Scholar] [CrossRef]
- Byrnes, James, David Miller, and William Schafer. 1999. Gender differences in risk taking: A meta-analysis. Psychological Bulletin 125: 367–83. [Google Scholar] [CrossRef]
- Chavez, Monika. 2001. Gender in the Language Classroom. Boston: Heinle and Heinle. [Google Scholar]
- Chiu, Ming Ming, and Catherine McBride-Chang. 2006. Gender, context, and reading: A comparison of students in 43 countries. Scientific Studies of Reading 10: 331–62. [Google Scholar] [CrossRef]
- Cloer, Thomas, Jr., and Shana R. Dalton. 2001. Gender and grade differences in reading achievement and in self-concept as readers. Journal of Reading Education 26: 31–36. [Google Scholar]
- Council of Europe. 2011. Common European Framework of Reference for Language: Learning, Teaching, Assessment. Strasbourg: Council of Europe. [Google Scholar]
- Diamond, Pollyann, and Anthony J. Onwuegbuzie. 2001. Factors associated with reading achievement and attitudes among elementary-aged students. Research in the Schools 8: 1–11. [Google Scholar]
- Doolittle, Allen, and Catherine Welch. 1989. Gender Differences in Performance on a College-Level Achievement Test. ACT Research Report Series 89-9. Iowa City: American College Testing Program. [Google Scholar]
- Dunn, Lloyd, and Douglas Dunn. 2007. Peabody Picture Vocabulary Test, Fourth Edition. PPVT-4. Minneapolis: Pearson. [Google Scholar]
- Engin, Ayse, and Deniz Ortaçtepe. 2014. Gender differences in item format and skill area: Some evidence from an EFL achievement test. The Journal of Language Teaching and Learning 4: 48–62. [Google Scholar]
- Ferber, Marianne, Bonnie Birnbaum, and Carole Green. 1983. Gender differences in economic knowledge: A reevaluation of the evidence. The Journal of Economic Education 14: 24–37. [Google Scholar] [CrossRef]
- Garner, Mary, and George Engelhard Jr. 1999. Gender differences in performance on multiple-choice and constructed response mathematics items. Applied Measurement in Education 12: 29–51. [Google Scholar]
- Gorjian, Bahman, and Mehdi Javadifar. 2013. Effects of Gender and Passage Content on Multiple-Choice Reading Comprehension Test. Procedia—Social and Behavioral Sciences 84: 723–27. [Google Scholar] [CrossRef]
- Hagquist, Curt, and David Andrich. 2015. Determinants of Artificial DIF—A Study Based on Simulated Polytomous Data. Psychological Test and Assessment Modeling 57: 342–76. [Google Scholar]
- Harris, James. 1971. Aspects of the Guessing Behaviour of Young Irish Subjects on Multiple-Choice Items. Master’s Thesis, University College, Cork, Ireland. [Google Scholar]
- Holland, Paul, and Dorothy Thayer. 1988. Differential item performance and the Mantel-Haenszel procedure. In Test Validity. Edited by Howard Wainer and Henry Braun. Hillsdale: Erlbaum, pp. 129–45. [Google Scholar]
- Hyde, Janet, and Marcia Linn. 1988. Gender differences in verbal activity: A meta-analysis. Psychological Bulletin 104: 53–69. [Google Scholar] [CrossRef]
- Im, Byung-Bin, and Jin-Hee Huh. 2007. Gender Differences in L2 proficiency test by test material. Journal of Pan-Pacific Association of Applied Linguistics 11: 1–15. [Google Scholar]
- James, Cindy L. 2010. Do language proficiency test scores differ by gender? TESOL Quarterly 44: 387–98. [Google Scholar] [CrossRef]
- Jodouin, Hervé. 2014. Differential Omission Rates: Exploring Factors that Influence Omission Rates in a Large-Scale Pan-Canadian Assessment. Ph.D. Thesis, University of Toronto, Toronto, ON, Canada. [Google Scholar]
- Karami, Hossein. 2011. Detecting gender bias in a language proficiency test. International Journal of Language Studies 5: 27–38. [Google Scholar]
- Lee, Juhee, and Diane Schallert. 2014. Literate actions, reading attitudes, and reading achievement: Interconnections Across languages for adolescent learners of English in Korea. The Modern Language Journal 98: 553–73. [Google Scholar] [CrossRef]
- Li, Hongli, Charles Hunter, and T. C. Oshima. 2014. Gender DIF in reading tests: A synthesis of research. In New Developments in Quantitative Psychology. Edited by Roger Millsap. New York: Springer, pp. 489–506. [Google Scholar]
- Lin, Jie, and Fenglan Wu. 2003. Differential Performance by Gender in Foreign Language Testing. Paper presented at the Annual Meeting of the National Council on Measurement in Education, Chicago, IL, USA, April 22–24. [Google Scholar]
- Lynn, Richard, and Jaan Mikk. 2009. Sex differences in reading achievement. Trames 13: 3–13. [Google Scholar] [CrossRef]
- McNamara, Tim. 2000. Language Testing. Oxford: OUP. [Google Scholar]
- O’Reilly, Tenaha, and Danielle S. McNamara. 2007. The impact of science knowledge, reading skill, and reading strategy knowledge on more traditional “high-stakes” measures of high school students’ science achievement. American Educational Research Journal 44: 161–96. [Google Scholar] [CrossRef]
- Oakhill, Jane, and Alison Petrides. 2007. Sex differences in the effects of interest on boys’ and girls’ reading comprehension. British Journal of Psychology 98: 223–35. [Google Scholar] [CrossRef] [PubMed]
- Organization for Economic Cooperation and Development. 2002. Manual for the PISA 2000 Database. Paris: Organization for Economic Cooperation and Development. [Google Scholar]
- Osterlind, Steven, and Howard Everson. 2009. Differential Item Functioning, 2nd ed. Thousand Oaks: Sage. [Google Scholar]
- Pae, Tae-Il. 2004. Gender effect on reading comprehension with Korean EFL learners. System 32: 265–81. [Google Scholar] [CrossRef]
- Pae, Tae-Il. 2012. Causes of gender DIF on an EFL language test: A multiple-data analysis over nine years. Language Testing 29: 533–54. [Google Scholar] [CrossRef]
- Pekkarinen, Tuomas. 2015. Gender differences in behaviour under competitive pressure: Evidence on omission patterns in university entrance examinations. Journal of Economic Behavior and Organization 115: 94–110. [Google Scholar] [CrossRef]
- Piasecka, Liliana. 2010. Gender differences in L1 and L2 reading. In Neurolinguistic and Psycholinguistic Perspectives on SLA. Edited by Janusz Arabski and Adam Wojtaszek. Toronto: Multilingual Matters, pp. 145–58. [Google Scholar]
- Rowley, Glenn. 1974. Which examinees are most favoured by the use of multiple choice tests. Journal of Educational Measurement 44: 423–430. [Google Scholar] [CrossRef]
- Ryan, Katherine, and Lyle Bachman. 1992. Differential item functioning on two tests of EFL proficiency. Language Testing 9: 12–29. [Google Scholar] [CrossRef]
- Schiefele, Ulrich, and Andreas Krapp. 1996. Topic interest and free recall of expository text. Learning and Individual Differences 8: 141–60. [Google Scholar] [CrossRef]
- Simos, Panagiotis, Georgios Sideridis, Athanassios Protopapas, and Angeliki Mouzaki. 2011. Psychometric evaluation of a receptive vocabulary test for Greek elementary students. Assessment for Effective Intervention 37: 34–49. [Google Scholar] [CrossRef]
- Swaminathan, Hariharan, and Jane Rogers. 1990. Detecting differential item functioning using logistic regression procedures. Journal of Educational Measurement 27: 361–70. [Google Scholar] [CrossRef]
- Tse, Shek Kam, Raymond Lam, Wai lp Joseph Lam, Yiu Man Chan, and Ka Yee Loh. 2006. Attitudes and attainment: A comparison of Hong Kong, Singaporean and English students’ reading. Research in Education 76: 74–87. [Google Scholar] [CrossRef]
- Weber, Ann M., Lia C.H. Fernald, Emanuela Galasso, and Lisy Ratsifandrihamanana. 2015. Performance of a receptive language test among young children in Madagascar. PLoS ONE, 10. [Google Scholar] [CrossRef]
- Yazdanpanah, Lilly. 2007. The effect of background knowledge and reading comprehension test items on male and female performance. The Reading Matrix 7: 64–80. [Google Scholar]
| 1 | Although a text about emotions and impressions could be considered as female-oriented (a matter of question theme), a question involving emotions or impressions could be posed about a text that is gender neutral, hence making it a question type variable rather than a question theme variable. |
| 2 | Uniform DIF occurs when an item consistently favors one group over another across all ability levels. Non-uniform DIF occurs when a test item favors one group for a certain range of ability, and the other group for another range of ability. For example, there would be non-uniform DIF if, when testing beginners, women outperform men, but when testing advanced learners, men perform better than women. |
| 3 | For example, in the United States, male students have been less numerous than females in human and social sciences at least since the 1960s (even at the graduate level), and have been representing less 40% of all students since the 1990s (AAAS 2018). |
| 4 | Class interval is the classification of respondents based on their ability. |
| 5 | When testing for class intervals, the null hypothesis (H0) assumes that all class intervals are similar. The alternate hypothesis (H1) is that at least one class interval differs from the others. When the p-value allows us to reject H0, it informs us that at least one class interval differs from the others. Post-hoc tests must then be performed to find which one. |
| 6 | This gender difference in the nature of DIF items becomes more evident if we examine DIF by combining the Mantel-Haenszel test and the logistic regression model, in order to ensure convergence in the data. The two methods agree on 11 items, of which seven tend to put men at an advantage (71-gigantic, 95-swamp, 104-boulder, 158-glider, 160-hatchet, 191-dejected, 221-vitreous), while only four tend to favor women (59-vest, 83-waist, 175-porcelain, 182-apparel). Interestingly, all the items favoring women are fashion-related. |

© 2019 by the authors. Licensee MDPI, Basel, Switzerland. This article is an open access article distributed under the terms and conditions of the Creative Commons Attribution (CC BY) license (http://creativecommons.org/licenses/by/4.0/).