Abstract
Replication is an important aspect of experimental research and it is therefore crucial that participant-level measures (e.g., judgment scores) are reliable. Reliability refers to the precision of measurement and thus informs the replicability of experiments: more precise measurements are more dependable for future reference. Formally defined as the ratio of true score variance to the total variance, reliability can be achieved by fine-tuning the measurement instrument or by collecting a sufficiently large number of observations per participant, as averaging over more items reduces the influence of random item-specific noise and yields a more precise estimate of participants’ true scores. The present paper uses Generalizability Theory to estimate the reliability of participant scores in 52 distinct datasets from studies that used comparable experimental designs to investigate different types of island effects in different languages. Effect sizes (DD-scores) are commonly reported and used for comparative purposes in discussions on island effects. The present paper argues that caution is warranted when island effect sizes are compared: the analyses reveal that participant-level reliability in island experiments is moderate, but that increasing the number of items to six per condition enhances measurement precision.
1. Introduction
Replication of experimental work is integral to the scientific method. Yet, for many different reasons, it is not guaranteed that published experimental research can always be replicated. This phenomenon, dubbed the ‘replication crisis’, has received much recent attention in the social sciences (Shrout & Rodgers, 2018). The field of (psycho)linguistics has not been able to escape from concerns of replication failure either (Sönning & Werner, 2021; Dempsey & Christianson, 2022): as the object of study is an ‘inextricably social phenomenon’, Grieve (2021, p. 1344) argues that variation is often due to unknown or unidentified factors. Such variation impedes the replicability of experiments, even when they are carefully designed. That is, language researchers can take action and, e.g., preregister their experiments to reduce biases (Roettger, 2021), collect data according to established methods (Gibson & Fedorenko, 2013; but see Sprouse & Almeida, 2013), or seek other ways to reduce noise (Christianson et al., 2022), but the nature of the research object will inevitably trouble the waters: unexplained or unknown variation is inherent to linguistic data and will always reduce the reliability of a dataset. Vasishth and Gelman (2021) discuss various ways for language researchers to deal with variation in (psycho)linguistic data, in order for them to nuance their (typically overly strong) claims based on less than reliable measurements. They show that sorting out the variation patterns in experimental datasets is an important component of statistical analysis, even regardless of the outcome of significance tests. For one thing, the variation patterns can be indicative of the replication potential of any outcome.
Specifically, replication of an experiment (under comparable circumstances) ideally yields results similar to those from the original experiment.1 Researchers wish for their measurements to be reliable. The qualification ‘ideally’ is added here, because consistency of results across replications is by no means a given: as alluded to above, countless factors, many of which unavoidable, may somehow influence the measurement procedure and contribute ‘error’ to the scores. This is an issue in the social sciences especially, given that fallibility is inherent to human measurement. But since precise measurements are essential to scientific endeavors, one of the researchers’ primary tasks should be to make an effort to minimize measurement error. One way to improve the precision of measurement is by changing the tools we have in our shed: improving the apparatus and ‘asking the right questions in the right way’. Indeed, there is a growing literature on research methodology in experimental syntax (e.g., Schütze, 1996/2016; Cowart, 1997; see Sprouse & Almeida, 2017; Langsford et al., 2018; Marty et al., 2020; Schoenmakers, 2023, for more recent contributions). Another way to improve the precision of measurement is by increasing the sample size. That is, in sorting out their data, language researchers take average scores over many measurements (e.g., when a linguist wants to generalize beyond a single sentence or the judgments of a single person), on the assumption that the measurement errors will cancel each other out when the dataset is large enough. If, for instance, you want to reliably estimate the speech rate of women from the state of Utah, you are in a better position to do so when you collect multiple speech samples per participant rather than relying on a single observation. The question, then, is: how many observations per participant are needed for an acceptably precise measurement? Or, more specifically for the purposes of experimental syntacticians: how many participants should they ask to rate how many sentences? The answers to these two questions2 depend on the reliability of the measurements and on the specific sources of measurement error. If, for instance, prior research has shown that participants are in perfect agreement about the acceptability of a set of sentences, but there is considerable variability in the acceptability scores of the individual sentences, it is sensible to increase the number of sentences (or vice versa). Note, however, that increasing the sample size (the number of items for participant-level reliability or the number of participants for item-level reliability) only improves measurement precision up to a certain point.
Social scientists often perform statistical power analyses to determine the number of participants required to run a well-powered experiment (Brysbaert, 2019). They wish to run properly powered experiments, but at the same time, testing more participants than is strictly necessary can be considered a waste of time and resources. Statistical power is the probability that an effect that exists in the real world is observed in an experimental study (see also Sprouse & Almeida, 2017), and is computed based on a fixed effect size,3 a set significance level (or alpha), and a chosen number of participants. Keeping the effect size and the significance level constant, a researcher can calculate the number of participants required for an experiment with, say, 80% power. A somewhat less common alternative to improve the statistical power is to increase the number of observations per participant (see Rouder & Haaf, 2018). As noted, the effectiveness of this choice depends on the variability and reliability of the variable: in most cognitive studies, participants are likely to vary to a larger extent than experimental trials. Still, as Brysbaert (2019, p. 19) puts it, “[m]ost cognitive researchers have an intuitive understanding of the requirement for reliable measurements, because they rarely rely on a single observation per participant per condition.” It goes to show that reliability and sample size are important ingredients of a proper power analysis.4
This paper explores the impact of an increase in the number of items on the reliability of participant-level measurements in experimental syntactic research. To that end, it reports on a series of reliability analyses of 52 datasets from experiments designed to test island effects across various languages and configurations. Section 2 provides a brief background on statistical reliability, followed by a discussion of the common operationalization of island experiments in Section 3. In particular, Generalizability Theory (Cronbach et al., 1972; Shavelson & Webb, 1991; Brennan, 2001) is used to estimate the participant-level reliability of the selected datasets. Across these datasets, the reliability is found to be only moderate, with few datasets achieving what is conventionally considered good reliability. This is problematic in light of the fact that researchers tend to report and compare island effect sizes (in terms of the differences-in-differences scores; see, e.g., Sprouse & Villata, 2021, §9.4): such comparisons are risky when the underlying participant-level measurements are not sufficiently reliable, as low participant reliability inflates variability and reduces confidence in the resulting effect sizes. It is therefore important to find ways to improve the reliability of participant-level measurements in these datasets. A crucial observation with regard to the selected experiments is that most of them only tested two items per condition. An advantage of ‘G-Theory’ is that it can perform decision studies, or ‘D-studies’, in which the variance components of a dataset (which are collected in generalizability studies, or ‘G-studies’) are used to estimate an alternative design in which error is minimized (Rajaratnam, 1960; Cronbach et al., 1972; Shavelson & Webb, 1991, chap. 6). D-studies can thus be used to optimize measurement through determining the number of items required to achieve good (participant-level) reliability. Results from a series of D-studies performed on the selected datasets indicate that an increase in the number of items in experimental explorations of island phenomena to six per condition (i.e., 24 items in a 2 × 2 factorial design, using a Latin Square distribution) would considerably improve their reliability.
2. Statistical Reliability
Variability is inherent to human measurement. At the participant level, it can be caused by fatigue, learning effects, diverging uses of the scale, or idiosyncratic judgment criteria (Rietveld & van Hout, 1993). Peer et al. (2021) show that participants recruited on various online platforms are not always attentive, motivated, do not always seem to understand the instructions, or are sometimes otherwise disengaged (see also Christianson et al., 2022, for discussion on participant motivation). However, as Dahl (1979) wittily suggests, seemingly arbitrary factors such as what the participant had for breakfast may also cause variation between participants. At the item level, variation may be due to the combinatorial semantics or pragmatic appropriateness of the stimulus sentences, the use of particularly demanding, ill-suited, unfamiliar, infrequent, lengthy, or archaic lexical items and/or syntactic constructions, but perhaps variation between items might also be due to arbitrary factors such as whether the sentence accidentally sounds like a line from a bad romance novel—that is to say, we can safely assume that there will always be unidentified or random variance in linguistic judgment data due to the nature of experimental research in linguistics (see also Häussler & Juzek, 2021). Put differently, perfect measurement simply does not exist in experimental research on language with human instruments. Therefore, the rationale in experimental research is that, at least for experiments with a large enough sample size, the residual errors will cancel each other out when the data are averaged: the mean score will then be in a better position to accurately represent the ‘true’ (acceptability) score (see Rietveld & van Hout, 1993).5
Classical test theory assumes that observed scores are composed of two distinct components: a true score and an error component. The true score component represents the ‘real’ acceptability of a target sentence, but the observed score will always contain some error. The goal of classical test theory is to estimate the true score as accurately as possible, on the basis of the average scores of a hypothetically infinite number of measurements. The internal consistency, or reliability, can then be calculated by, e.g., the intraclass correlation coefficient (ICC; Shrout & Fleiss, 1979), which represents the ratio of the true score to the total variance, and is obtained through ANOVA. Classical test theory, however, can only incorporate a single general error term. G-Theory, by contrast, was designed to differentiate between multiple sources of error (Cronbach et al., 1972; Shavelson & Webb, 1991; Brennan, 2001). That is, the error component in G-Theory is subdivided into a systematic component, which consists of error attributable to known sources of variation (so-called facets, such as participants and items) and an unsystematic or ‘residual’ component, which consists of error attributable to random and/or unidentified effects as well as the interaction of known sources of variation (which cannot be disentangled, see Shavelson & Webb, 1991). Thus, G-Theory acknowledges that inter-item and inter-participant variation are potential sources of error in the generalization of acceptability measurement and, furthermore, it takes into account that there will always be residual error blurring the picture.
Mathematically, reliability in G-Theory is defined as it is in classical test theory, i.e., as the relative contribution of the true score component to the total variance. However, G-Theory is particularly suitable for reliability analysis in the field of experimental syntax (see Schoenmakers & van Hout, 2024), not only because it can accommodate multiple facets, but also because it can handle the nested experimental designs common to the field (i.e., the Latin Square design, according to which not all participants see all items in all conditions, with the stimulus sentences nested in different conditions). The metric for reliability used in G-Theory is the generalizability coefficient, or ‘G-coefficient’, represented by the Greek letter ρ2. The G-coefficient permits relative inferences about rank-order, like the reliability of the measurements. Reliability is poor when ρ2 < .5, moderate when .5 < ρ2 < .75, good when .75 < ρ2 < .9, and excellent when ρ2 ≥ .9 (Koo & Li, 2016).6
3. A Case Study: Island Effects
The present paper takes experiments that investigate island effects as a case study. Island effects are commonly defined as the super-additivity that arises when a long-distance dependency originates in a particular, so-called ‘island’ construction (Sprouse & Villata, 2021). To test for island effects, experimental researchers typically use a factorial design in which the factors distance (short- vs. long-distance movement) and construction (±island) are crossed, a design that was originally proposed in Sprouse (2007); a sample item which follows this design is given in (1). The rationale behind this particular design is that both the formation of a long-distance dependency and the presence of a complex structure may independently affect acceptability in a negative way, but the island effect refers to the decrease in acceptability that remains when the variation independently attributable to the two factors is accounted for. Island effects are thus represented by an interaction effect. The effect size of these interactions is commonly reported as the differences-in-differences score (Maxwell & Delaney, 2004), or simply DD-score, and can be calculated by subtracting the difference between (1a–c) from the difference between (1b–d), which isolates the additional effect not accounted for by the two fixed factors (Sprouse & Villata, 2021).
| (1) | a. | Who ___ thinks that the lawyer forgot his briefcase at the office? | [short, no island] |
| b. | What do you think that the lawyer forgot ___ at the office? | [long, no island] | |
| c. | Who ___ worries if the lawyer forgot his briefcase at the office? | [short, island] | |
| d. | What do you worry if the lawyer forgot at the office? | [long, island] | |
| (Sprouse et al., 2016, p. 318) | |||
The calculation of DD-scores representing island effect sizes is thus based on each of the conditions in the paradigm. Given that linguistic data are by definition noisy (i.e., reflecting unknown and unidentified variation), reliable measurement at the participant level is essential for a proper interpretation of DD-scores. Yet, reliability coefficients are rarely, if ever, reported in experimental syntactic work, even though researchers routinely compare island effect sizes across experiments, configurations, dependency types, and languages (see, e.g., the discussion of Figure 1 in Pañeda et al., 2020 or Section 9.4 in Sprouse & Villata, 2021). As alluded to in the introduction section, testing a sufficiently large number of items is essential for obtaining reliable participant-level measurements. Most modern experiments test more than a single item, each of which is represented by four minimally different variants, as in (1) (see also Cowart (1997, §3.3) on the design of experimental materials). The items are then usually distributed according to a Latin Square design: each participant is presented with only one variant of each particular item. Thus, a first participant sees the first sentence in condition A, a second participant sees this same sentence in condition B, a third in condition C, a fourth in condition D, et cetera. The first participant is then presented with the second sentence in condition B, the third sentence in condition C, and the fourth sentence in condition D, and so forth. The Latin Square design is illustrated in Table 1. Following this, experiments can be constructed such that every participant sees an equal number of items in a particular condition. With 24 items, for example, each participant would be presented with six items in each condition.

Table 1.
Latin Square design, with the particular conditions of a factorial 2 × 2 design (A, B, C, D) represented in the cells, and with ellipses indicating the recurring pattern for additional items and participants.
But the question remains how many items are needed to obtain sufficiently reliable measurements. As it turns out, there is no consensus on this. Schütze and Sprouse (2014, p. 39) submit that “it is desirable to create multiple lexicalizations of each condition (ideally eight or more)”. In his discussion on the construction of experimental syntactic questionnaires, Cowart (1997, p. 92) provides an example of an experiment that follows a 2 × 2 design with six instances of each sentence type (i.e., 24 items in total). Goodall (2021, p. 13), however, refers to an item set with four sentences per condition in a 2 × 2 design (i.e., sixteen sentences in total) as “a full set […] with only a minimal possibility of error,” and Sprouse’s (2018) course slides maintain that two items per condition suffices:
Experiments investigating island effects consequently differ in the number of items they present to each participant, as will become clear in the next two subsections. These subsections more specifically estimate the participant-level reliability in a collection of existing datasets using generalizability studies and then use decision studies to determine the number of items required for ‘a minimal possibility of error’ and to permit ‘claims about the generalizability of the result to multiple items’.“For basic acceptability judgment experiments I generally recommend that you present 2 items per condition per participant. So for a 2 × 2 design, that means you need 8 items […]. I think that 8 items […] is also sufficient to make (non-statistical) claims about the generalizability of the result to multiple items. So this is a nice starting point for most designs. Of course, if you have reason to believe that participants will make errors with the items, you should present more than 2 items per condition. Similarly, if you need to demonstrate that the result generalizes to more than 8 items, by all means, use more than 8 items. These are just good starting points for basic acceptability judgment experiments.”(Sprouse, 2018, slide 62)
Before moving on to these computations, though, notice that the sample item in (1) displays the factorial design with a (bare) wh-dependency and an adjunct island: the fillers are bare wh-phrases (who, what) and the extraction domain in the island conditions are adjunct clauses (here, if the lawyer forgot (his briefcase) at the office). But island effects have been tested with other types of dependencies and configurations as well. Other dependency types that have been tested in experimental work include relativization, topicalization, and wh-extraction with complex fillers (e.g., which briefcase). Other island configurations that have been experimentally tested include complex NPs, embedded questions, and relative clauses. The resulting combinations of these variables have been tested in a range of languages using particularly similar designs and operationalizations: researchers have conducted translated adaptations of the experimental design in (1), keeping the instrument of measurement relatively constant. Datasets on island effects are therefore particularly suitable as a case study for the reliability analyses performed in this paper.
Note finally that, while various papers have been published that report significant island effects, it is quite possible that many other island experiments have been conducted but were never published because they yielded non-significant or uninterpretable results. Further, as noted, the measurements in the experiments that were published might not be entirely reliable because of inexplicable variation among participants and/or items. This is quite an issue, as the island effect sizes may then be overestimated and, as Loken and Gelman (2017, p. 584) put it, “statistical significance conveys very little information when measurements are noisy.” The next subsection therefore performs participant-level reliability analyses on selected datasets from island experiments.
3.1. Data Selection
A total of 55 distinct datasets was initially included in the analysis, taken from Almeida (2014), Sprouse et al. (2016), Kush et al. (2018, 2019), Pañeda and Kush (2021), Kobzeva et al. (2022), Rodríguez and Goodall (2023), and Schoenmakers and Stoica (2024). However, the default formula used in the models (Section 3.2) yielded singularity issues in three datasets (the English set from Almeida, 2014, the adjunct island set with complex fillers from Kush et al., 2018, and the complex NP dataset from Rodríguez & Goodall, 2023). Singularity issues occur when there is extreme collinearity in the data, so that a given regression coefficient cannot be accurately estimated. That is to say, collinearity is an effect of the imprecision of measurement and it thus interacts with sample size as well (see O’Brien, 2007). As the variance associated with the item facet could not be estimated in these datasets, they were removed from further analysis. The reliability analyses were performed on the remaining 52 datasets.
The selected studies all used the factorial design in (1) to investigate island sensitivity in six different languages, using seven-point scales ranging from (very) bad to (very) good to collect acceptability scores (the details of each experimental design can be found in Table 2). Each study tested a slightly different selection of island types, but four types were commonly tested across experiments and were therefore included in the present analyses: (conditional) adjunct islands, complex NP islands, embedded whether islands, and/or relative clause (RC) islands (note that while the operationalization of the experiments in this sample was clearly not identical across the board, the differences are not an issue for the purposes of the present paper, because no direct comparisons are made). Furthermore, different dependency types were tested in the selected studies, viz., wh-movement of bare wh-phrases and/or full wh-DPs, topicalization, and/or relativization. Note, finally, that the datasets involved in the present analyses were reduced to the factorial design described in Sprouse (2007). Thus, while, e.g., Kobzeva et al. (2022) tested both wh- and RC-dependencies in the same experiment, here these are represented as two distinct datasets: one with wh-dependencies and one with RC-dependencies.
The selected studies varied in the numbers of items tested per dataset. Rodríguez and Goodall (2023) tested the largest number in their experiments, with four items per condition. Pañeda and Kush (2021) followed, testing three items per condition for the whether-island sets, but two items per condition for the adjunct and RC island sets (because these served as controls for their purposes). Sprouse et al. (2016), Kush et al. (2018, 2019), Kobzeva et al. (2022), and Schoenmakers and Stoica (2024) each tested two items per condition, while Almeida (2014) tested only one item per condition.
RC islands were tested in Norwegian and Spanish, but the type of clauses differed between experiments. Kush et al. (2018, 2019), Pañeda and Kush (2021), and Rodríguez and Goodall (2023) tested RC islands where the head was an argument of the matrix verb, as in (2). Kobzeva et al. (2022), by contrast, tested existential relative clauses, as in (3), because corpus data show that such RCs are more common. The main difference is that the sentences in (3) are typically used to introduce a new discourse referent and provide additional (new) information in the RC.
| (2) | a. | {Hva/Hvilken film} snakket regissøren med [et par kritikere som hadde stemt på ___ ]? |
| what/which film spoke director.DEF with a few critics who had voted for | ||
| ‘What/Which film did the director speak with [a few critics that had voted for ___]?’ | ||
| (Kush et al., 2018) | ||
| b. | Antidepressiva kjenner de til [mange psykologer som ville anbefale ___ ]. | |
| antidepressants know they to many psychologists who would recommend | ||
| ‘Antidepressants they know [many psychologists who would recommend ___ ]?’ | ||
| (Kush et al., 2019) | ||
| c. | ¿A quién conociste [al sindicato que apoya ___ ]? | |
| to who knew.2SG to.the union that supports | ||
| (Of) who(m) did you know [the union that supports ___ ]? | ||
| (Rodríguez & Goodall, 2023) | ||
| d. | ¿Qué proyecto tenía el jefe [unos empleados que habían presentado ___]? | |
| what project had the chief some employees that have presented | ||
| Which project did the chief have [some employees that had presented __ ]? | ||
| (Pañeda & Kush, 2021) | ||
| (3) | a. | Hvilket øl var det [mange som bestilte ___ ]? |
| which beer was it many who ordered | ||
| Which beer were there [many people who ordered ___ ]? | ||
| b. | Det var ølet som det var [mange som bestilte ___ ]. | |
| that was beer.DEF that it was many who ordered | ||
| That was the beer that there were [many people who ordered ___ ]. | ||
| (Kobzeva et al., 2022) | ||
Some of the selected studies also tested additional island types, which were not included in the present analyses. Pañeda and Kush (2021) tested where and when interrogative islands, Kobzeva et al. (2022) tested what and where interrogative islands, and Rodríguez and Goodall (2023) tested when and where interrogative islands. These ‘alternative’ embedded question islands show different effects from their more commonly tested counterparts headed by whether and were therefore excluded from analysis. Further, some studies also tested for subject island effects. Subject island effects, however, have been tested using vastly different designs (see, e.g., Kush et al., 2018 for discussion) and were consequently excluded from the analyses as well. Regarding the tested dependency types, Almeida (2014) and Rodríguez and Goodall (2023) also tested cases of left dislocation in Brazilian Portuguese and Spanish. Such configurations are normally not taken to result from movement, however, so this dependency type is not expected to yield island effects. The clitic left dislocation cases were therefore excluded from the analyses as well.
3.2. Data Analysis
R (R Core Team, 2024, version 4.4.0) and the gtheory package (Moore, 2016) were used to run generalizability and decision studies on the selected datasets. All G-studies and D-studies were based on linear mixed effects models which included the fixed effects of distance and construction and their interaction, as well as random by-participant and by-item intercepts (following Huebner & Lucht, 2019).7 The participant facet was set as the object of measurement in the D-studies, in order to estimate the participant-level reliability coefficient. The last two columns in Table 2 display the participant-level reliability for each dataset as well as the participant-level reliability if the number of items were increased to 16, 20, and 24 (corresponding to designs testing four, five, and six items per condition). Good reliability, with ρ2-values over .75 (Koo & Li, 2016), is reached in just fifteen of the 52 (28.8%) original datasets. The reliability of these studies is generally moderate, with an average G-coefficient of .66. If the number of items in each experiment were increased, however, the number of datasets with good reliability would increase to 38 (73.1%, k = 16), 43 (82.7%, k = 20), or 46 (88.5%, k = 24), with average G-coefficients of .78, .82, and .84, respectively. Furthermore, the number of datasets that exhibit excellent reliability (i.e., ρ2 ≥ .90) increases from zero (in the original datasets) to three (5.8%, if k = 16), eight (15.4%, if k = 20), or twelve (23.1%, if k = 24). The increase in reliability per added item is visually presented for each dataset in Figure 1, Figure 2, Figure 3, Figure 4, Figure 5, Figure 6, Figure 7, Figure 8, Figure 9, Figure 10, Figure 11, Figure 12 and Figure 13 (which can be found at the end of this paper). These figures show that a relatively minor adjustment to the experimental design can greatly improve the reliability at the participant level. This effect is especially pronounced when the number of items is small, as even a slight increase can enhance the reliability considerably.
3.3. Discussion of Specific Datasets
The D-studies predict that even with an increase to 24 items, six datasets would fall short of the criterion for good reliability. Among them, Kobzeva et al.’s (2022) RC island dataset with complex wh-movement and Rodríguez and Goodall’s (2023) adjunct island dataset with bare wh-movement would come close to the benchmark for good reliability, with G-coefficients of .73 and .72, respectively. Sprouse et al.’s (2016) Italian adjunct island dataset with an RC-dependency can be considered an outlier, however, with a G-coefficient of .59. Notably, this is the only dataset taken from Sprouse et al. (2016) that did not produce a significant island effect. This non-significance could be indicative of a Type II error, as a low number of items lowers power estimates just like a low number of participants does (see Sprouse & Almeida, 2017).8 The results from the D-study performed on this dataset indicate that 67.5% of the variation is part of the residual error component (i.e., unidentified/inexplicable variation). For comparison, the proportion of residual variation in the (Italian) data with adjunct islands and a wh-dependency was 28.7%; the proportion of residual variation in the English counterpart of the dataset (i.e., with an RC-dependency) was 23.8%.9 The variation in the Italian version of this dataset was thus for the most part not uniquely attributable to participants or items, so an increase in the number of items would not improve reliability much (based on these estimates).
Finally, three of Kush et al.’s (2019) datasets from Experiment 2 would not achieve good reliability with an increase to 24 items, specifically, those datasets with a topicalization dependency and adjunct, complex NP, or whether islands (with G-coefficients of .69, .62, and .69, respectively). Participants in this Experiment 2 were asked to read a brief preamble before assessing the acceptability of the target sentence. Kush et al. also conducted the same experiment without contextualization (Experiment 1), which resulted in much more reliable measurements (see Table 2). However, the authors still noted considerable intertrial variability and inconsistency in these judgments. They suggest, with regard to the embedded question islands in particular, that participants may adapt or recalibrate after seeing a first island violation, so that they are more amenable to it upon a second encounter. The authors conclude that a larger number of observations per participant are needed to investigate this further—a claim that is corroborated by the D-studies reported on here, see Figure 8. Still, the discrepancy between their two experiments is rather striking. It is conceivable that participants in Experiment 2 were not in fact helped by the discourse context, but were instead distracted or confused by it, and consequently performed in a less consistent manner (at least in the cases with an island violation, see Kush et al., 2019). However, the target sentences in Pañeda and Kush’s (2021) experiments, which tested Spanish wh-dependencies in slightly different configurations, were also preceded by a context sentence, and yet these datasets are associated with much better reliability. The impact of contextualization thus seems to remain a methodological question that warrants further investigation. To explore this, however, it is crucial to collect larger numbers of observations per participant (cf. Kush et al., 2018, 2019).
4. General Discussion
Many researchers in experimental syntax implicitly assume that their findings will generalize to new stimulus items, i.e., that their participants are reliable, but the low participant-level generalizability coefficients reported in the previous section indicate that this is not always warranted. Experimental studies investigating island effects usually test a small number of items (per condition), and G- and D-studies demonstrate that the reliability at the participant level is often below what is considered good, and that a simple increase in the number of items (per condition) may considerably improve reliability. What, then, is the ideal number of items? The results from the D-studies indicate that both the average reliability and the number of datasets achieving good or even excellent reliability steadily increase as the number of items per condition rises from four to six. Accordingly, the recommendation is to test six items per condition (i.e., 24 items in a 2 × 2 design) to optimize participant-level reliability.
However, one reason not to test six items per condition is that the overall duration of the experiment would be too long if too many items are tested in it (especially because the number of filler items should be increased accordingly). Therefore, experimental linguists are essentially faced with a trade-off between increased reliability and practical considerations. The real question, then, is what number of items is feasible for participants in linguistic acceptability judgment experiments. The answer to this question depends on many factors, including whether or not participants are reimbursed for their time (and also how well) and whether the target sentences are preceded by a discourse context. Yet, it is worth noting here that each study listed in Table 2 tested multiple dependency or island types in a single experiment. As a case in point, Kush et al. (2018) report on three experiments with a 2 × 2 design, for which they constructed two items per condition, which adds up to eight items in total. However, each experiment included eight items for four (Experiment 1) or five (Experiments 2 and 3) distinct island types (the subject islands were not included in Table 2). Complemented with 48 fillers, Kush et al.’s participants were asked to rate a total of 80 (Experiment 1) or 88 (Experiments 2 and 3) sentences. Alternatively, however, experimental syntacticians could test a single island type per experiment, with more items per condition, so as to improve reliability without overburdening their participants. That is, when participants are presented with six items per condition in a 2 × 2 design, they are asked to read and rate 24 experimental and 48 filler items (maintaining a 1:2 ratio), i.e., 72 items in total. This is fewer than what participants in Kush et al.’s (2018) experiments were asked to do. Assuming that the participants receive adequate compensation and do not have to read lengthy preambles, six items per condition therefore does not seem unreasonable.
5. Conclusions
Ensuring reliability in the social sciences is crucial because human measurement is inherently imprecise. In the study of island effects, variation is already widespread at the surface, arising from cross-linguistic and cross-configurational differences, but also from differences in experimental design and stimuli. But to make meaningful comparisons of the experimental data and island effect sizes in particular, an important first step is to estimate the participant-level reliability of the measurements.
This paper estimated the participant-level reliability in 52 distinct datasets from relatively similar experimental studies (i.e., translated adaptations) on island sensitivity, using Generalizability Theory to estimate the variance components in each dataset. The findings reveal that most datasets exhibit only moderate participant-level reliability. This raises a critical concern: when island effect sizes are reported without considering the reliability, and, in particular, when DD-scores are compared, there is a risk of overestimating the effect sizes due to measurement imprecision. Testing larger item sets, however, would reduce the impact of idiosyncratic item-level noise and better capture the true participant variability, making the experiment less dependent on the peculiarities of the tested items. The present paper shows that even a modest increase in the number of experimental items can substantially improve the reliability at the participant level in island experiments. A series of D-studies, which are designed to estimate measurements in which error is minimized, indicate that participant scores can be measured sufficiently precisely when 24 items are tested in a factorial 2 × 2 design (i.e., six items per condition), distributed under a Latin Square. This is a practical and achievable adjustment to island experimental design: rather than conducting small-scale acceptability judgment experiments on multiple island types, researchers could focus on testing single island types with more items, thereby enhancing the precision of measurement and ultimately strengthening the validity of their findings.

Table 2.
Selected dataset specifics, with dependency type, island type, number of participants n,10 number of items k, generalizability coefficients, and calculated generalizability coefficients for k = 16/20/24. Note that the number of items is determined based on the original 2 × 2 design for the study type (e.g., for RC dependencies only). The target sentences in Kush et al. (2019, Experiment 2) and Pañeda and Kush (2021) were preceded by a context sentence.
| Language | Source | Dep. Type | Island Type | n | k | ρ2 | ρ2 (k = 16 | 20 | 24) | ||
|---|---|---|---|---|---|---|---|---|---|
| Br. Portuguese | Almeida (2014) | bare wh | Interrogative | 13 | 4 | .53 | .82 | .85 | .87 |
| topicalization | Interrogative | 13 | 4 | .45 | .77 | .81 | .83 | ||
| English | Sprouse et al. (2016) | bare wh | Adjuncts | 55 | 8 | .73 | .85 | .87 | .89 |
| Complex NP | 55 | 8 | .57 | .73 | .77 | .80 | |||
| Interrogative | 55 | 8 | .78 | .87 | .90 | .91 | |||
| complex wh | Adjuncts | 56 | 8 | .65 | .79 | .82 | .85 | ||
| Complex NP | 54 | 8 | .71 | .83 | .86 | .88 | |||
| Interrogative | 56 | 8 | .78 | .88 | .90 | .91 | |||
| RC | Adjuncts | 55 | 8 | .76 | .86 | .89 | .90 | ||
| Complex NP | 55 | 8 | .81 | .90 | .92 | .93 | |||
| Interrogative | 55 | 8 | .82 | .90 | .92 | .93 | |||
| Norwegian | Kush et al. (2018) | bare wh (exp.1) | Adjuncts | 94 | 8 | .53 | .69 | .74 | .77 |
| Complex NP | 94 | 8 | .70 | .82 | .85 | .87 | |||
| Interrogative | 94 | 8 | .73 | .85 | .87 | .89 | |||
| bare wh (exp.2) | Adjuncts | 46 | 8 | .63 | .77 | .81 | .84 | ||
| Complex NP | 46 | 8 | .51 | .68 | .73 | .76 | |||
| Interrogative | 46 | 8 | .80 | .89 | .91 | .92 | |||
| RC (argument of matrix verb) | 46 | 8 | .81 | .90 | .91 | .93 | |||
| complex wh | Complex NP | 65 | 8 | .61 | .76 | .80 | .82 | ||
| Interrogative | 65 | 8 | .78 | .87 | .90 | .91 | |||
| RC (argument of matrix verb) | 65 | 8 | .69 | .82 | .85 | .87 | |||
| Language | Source | Dep. type | Island type | n | k | ρ2 | ρ2 (k = 16 | 20 | 24) | ||
| Norwegian (cont.) | Kush et al. (2019) | topicalization (exp. 1) | Adjuncts | 34 | 8 | .68 | .81 | .84 | .87 |
| Complex NP | 34 | 8 | .59 | .74 | .78 | .81 | |||
| Interrogative | 34 | 8 | .65 | .79 | .83 | .85 | |||
| RC (argument of matrix verb) | 34 | 8 | .72 | .84 | .87 | .89 | |||
| topicalization (exp. 2) | Adjuncts | 31 | 8 | .43 | .60 | .65 | .69 | ||
| Complex NP | 31 | 8 | .36 | .53 | .58 | .62 | |||
| Interrogative | 31 | 8 | .43 | .60 | .65 | .69 | |||
| RC (argument of matrix verb) | 31 | 8 | .72 | .84 | .87 | .89 | |||
| Kobzeva et al. (2022) | complex wh | Adjuncts | 45.5 | 8 | .70 | .82 | .85 | .87 | |
| RC (existential constructions) | 46 | 8 | .48 | .65 | .70 | .73 | |||
| RC | Adjuncts | 45.5 | 8 | .66 | .80 | .83 | .85 | ||
| RC (existential constructions) | 46 | 8 | .64 | .78 | .81 | .84 | |||
| Italian | Sprouse et al. (2016) | bare wh | Adjuncts | 47 | 8 | .71 | .83 | .86 | .88 |
| Complex NP | 47 | 8 | .68 | .81 | .84 | .86 | |||
| Interrogative | 50 | 8 | .76 | .86 | .89 | .90 | |||
| RC | Adjuncts | 47 | 8 | .32 | .49 | .54 | .59 | ||
| Complex NP | 47 | 8 | .72 | .84 | .87 | .89 | |||
| Interrogative | 49 | 8 | .65 | .79 | .83 | .85 | |||
| Romanian | Schoenmakers and Stoica (2024) | bare wh | Adjuncts | 103 | 8 | .56 | .72 | .76 | .79 |
| Complex NP | 103 | 8 | .63 | .77 | .81 | .84 | |||
| Interrogative | 101 | 8 | .78 | .88 | .90 | .91 | |||
| Spanish | Pañeda and Kush (2021) | complex wh | Adjuncts (Exp. 1) | 47 | 8 | .75 | .86 | .88 | .90 |
| Adjuncts (Exp. 2) | 49 | 8 | .63 | .77 | .81 | .84 | |||
| Interrogative (whether, know) | 32 | 12 | .82 | .86 | .88 | .90 | |||
| Interrogative (whether, ask) | 32 | 12 | .75 | .80 | .83 | .86 | |||
| RC (Exp. 1) | 47 | 8 | .61 | .76 | .80 | .83 | |||
| RC (Exp. 2) | 49 | 8 | .51 | .67 | .72 | .75 | |||
| Rodríguez and Goodall (2023) | bare wh | Adjuncts | 16 | 16 | .63 | .63 | .68 | .72 | |
| Interrogative (Exp. 1) | 16 | 16 | .82 | .82 | .85 | .87 | |||
| Interrogative (Exp. 2) | 16 | 16 | .71 | .71 | .75 | .78 | |||
| RC (argument of matrix verb) | 16 | 16 | .73 | .73 | .77 | .80 | |||
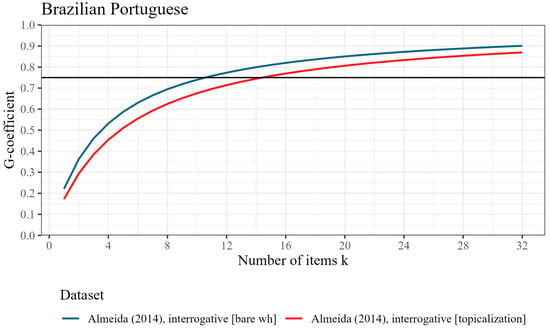
Figure 1.
Participant-level generalizability coefficient (reliability) by number of items tested, based on two datasets from Almeida (2014), for Brazilian Portuguese. The horizontal line represents the threshold for good reliability at ρ2 = .75.
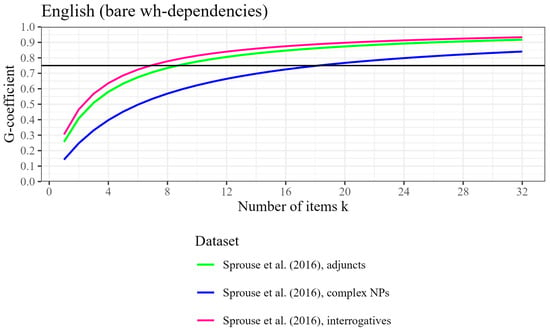
Figure 2.
Participant-level generalizability coefficient (reliability) by number of items tested, based on three datasets from Sprouse et al. (2016) with bare wh-dependencies, for English. The horizontal line represents the threshold for good reliability at ρ2 = .75.
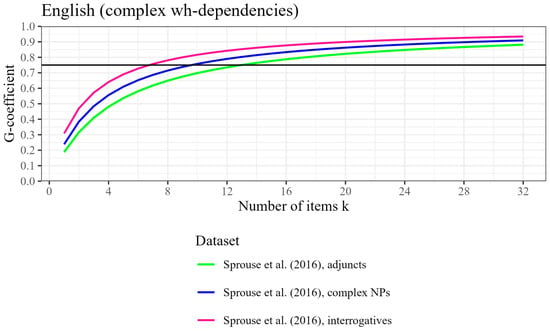
Figure 3.
Participant-level generalizability coefficient (reliability) by number of items tested, based on three datasets from Sprouse et al. (2016) with complex wh-dependencies, for English. The horizontal line represents the threshold for good reliability at ρ2 = .75.
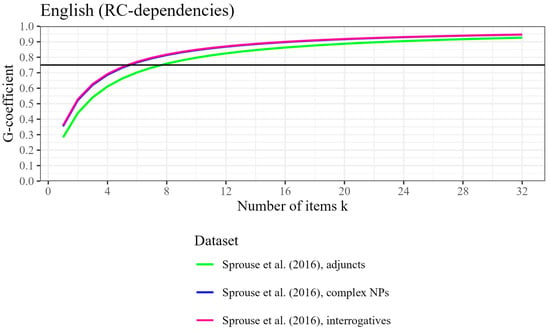
Figure 4.
Participant-level generalizability coefficient (reliability) by number of items tested, based on three datasets from Sprouse et al. (2016) with RC-dependencies, for English. The horizontal line represents the threshold for good reliability at ρ2 = .75.
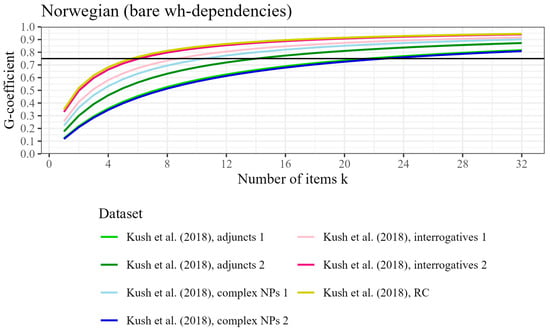
Figure 5.
Participant-level generalizability coefficient (reliability) by number of items tested, based on seven datasets from Kush et al. (2018) with bare wh-dependencies, for Norwegian. The horizontal line represents the threshold for good reliability at ρ2 = .75.
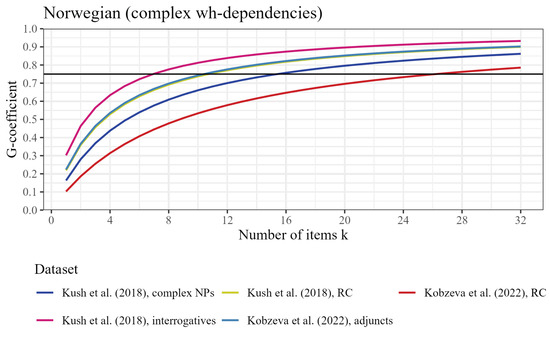
Figure 6.
Participant-level generalizability coefficient (reliability) by number of items tested, based on five datasets from Kush et al. (2018) with complex wh-dependencies, for Norwegian. The horizontal line represents the threshold for good reliability at ρ2 = .75.
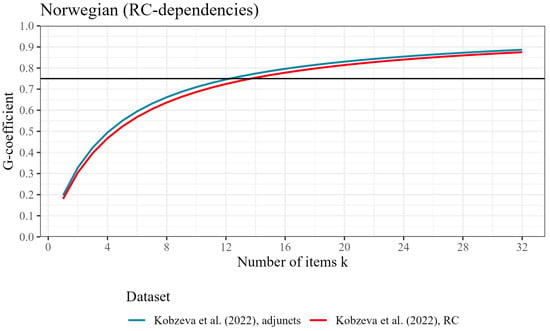
Figure 7.
Participant-level generalizability coefficient (reliability) by number of items tested, based on two datasets from Kobzeva et al. (2022) with RC-dependencies, for Norwegian. The horizontal line represents the threshold for good reliability at ρ2 = .75.
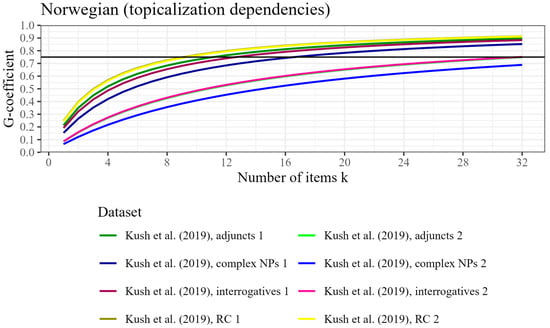
Figure 8.
Participant-level generalizability coefficient (reliability) by number of items tested, based on eight datasets from Kush et al. (2019) with topicalization dependencies, for Norwegian. The horizontal line represents the threshold for good reliability at ρ2 = .75.
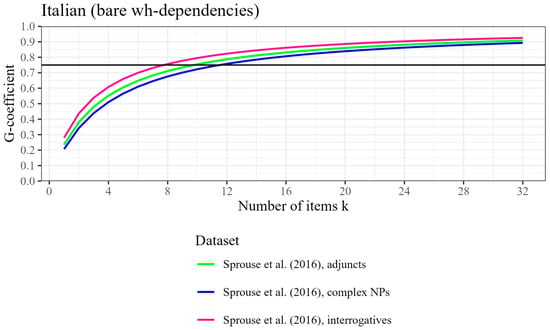
Figure 9.
Participant-level generalizability coefficient (reliability) by number of items tested, based on three datasets from Sprouse et al. (2016) with bare wh-dependencies, for Italian. The horizontal line represents the threshold for good reliability at ρ2 = .75.
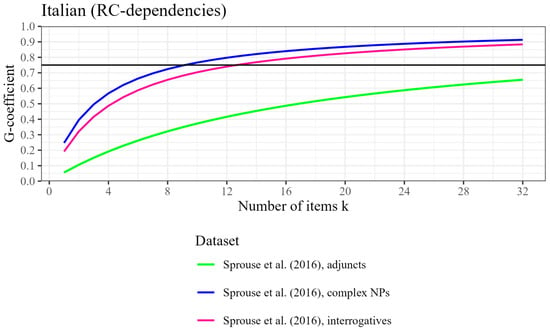
Figure 10.
Participant-level generalizability coefficient (reliability) by number of items tested, based on three datasets from Sprouse et al. (2016) with RC-dependencies, for Italian. The horizontal line represents the threshold for good reliability at ρ2 = .75.
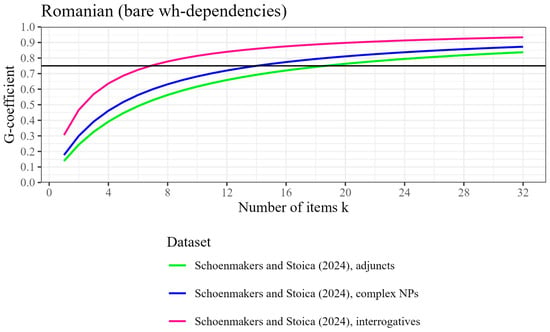
Figure 11.
Participant-level generalizability coefficient (reliability) by number of items tested, based on three datasets from Schoenmakers and Stoica (2024) with bare wh-dependencies, for Romanian. The horizontal line represents the threshold for good reliability at ρ2 = .75.
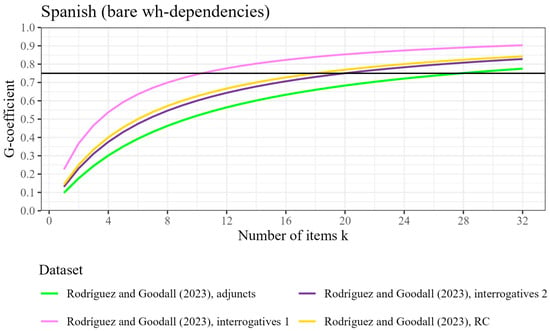
Figure 12.
Participant-level generalizability coefficient (reliability) by number of items tested, based on four datasets from Rodríguez and Goodall (2023) with bare wh-dependencies, for Spanish. The horizontal line represents the threshold for good reliability at ρ2 = .75.
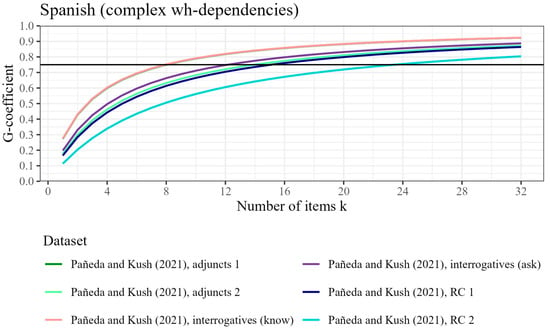
Figure 13.
Participant-level generalizability coefficient (reliability) by number of items tested, based on six datasets from Pañeda and Kush (2021) with complex wh-dependencies, for Spanish. The horizontal line represents the threshold for good reliability at ρ2 = .75.
Funding
This research received no external funding.
Institutional Review Board Statement
Not applicable.
Informed Consent Statement
Not applicable.
Data Availability Statement
New data have not been collected for this paper; all datasets that were analyzed have been collected from existing online repositories or were personally sent to the author. Stripped versions of all the datasets (ratings, participant and item numbers, and conditions) as well as the analysis code output can be found in a dedicated OSF repository (https://osf.io/k4ndm/). Permission to share data from existing datasets that were not previously shared online was granted by the first authors of the original papers.
Acknowledgments
Thanks go out to Cas Coopmans, Roeland van Hout, and Irina Stoica for their comments and feedback on an earlier version of this paper.
Conflicts of Interest
The author declares no conflicts of interest.
Notes
| 1 | It is worth noting that more journals in linguistics have started publishing open access articles and have adopted policies for researchers to publish their stimuli, data, and code online, following the FAIR principles (Findable, Accessible, Interoperable, Reusable) to stimulate reproducibility of existing studies and replication of their findings. Such policies enhance transparency and are inducive of reproducibility, as other researchers can reexamine, reanalyze, or reuse these data (Laurinavichyute et al., 2022). |
| 2 | The two questions concern different types of reliability, namely, item-level and participant-level reliability. These two types correspond to distinct metrics with different interpretations. Item-level reliability pertains to the stability of item effects across replications of the experiment with new participants, whereas participant-level reliability pertains to the stability of participants’ relative scores across replications with new items. The present paper focuses exclusively on participant-level reliability. Note that the two metrics are not interchangeable. |
| 3 | Brysbaert (2019) discusses various problems involved in fixing the effect size for this computation: there are usually only a handful of sufficiently similar studies, and the effect sizes reported in published studies are likely overestimated. |
| 4 | Researchers are encouraged to report the reliability coefficients of their experiments (see also Gelman, 2018), as it would allow other researchers to compare the reliability associated with particular instruments and test features so that they can make more substantiated choices for their own experiments. |
| 5 | Nowadays, experimental linguists mostly use linear mixed effects regression models to test their hypotheses (see Winter, 2019, for an introduction). These models are ‘mixed’ because they include not only the ‘fixed’ factors that were manipulated in the experiment, but also ‘random’ effects, which take into account the fact that the collected data points are not fully independent from each other: there are multiple datapoints for each item (sentence) from more than a single participant. |
| 6 | The guidelines in Koo and Li (2016) are actually for the ICC, but they can also be applied to the G-coefficient, which is essentially a “stepped-up intraclass correlation coefficient” (Brennan, 2001, p. 35). |
| 7 | Random slopes were not included in these analyses for the sake of simplicity and feasibility. Keeping the fixed effects structure constant and invariably including by-participant and by-item intercepts, the experimental design still permits 64 distinct models depending on the presence of the random slopes. That is, there are three possible random slopes (for the effects of distance, construction, and their interaction) which may appear in different combinations for both random facets (participants and items). Running all 64 models to determine which one best supports the data for each dataset would mean running 3328 models. |
| 8 | Both statistical power and reliability are defined in relation to the total variance of the dataset. However, statistical power is computed irrespective of the partitioning of the observed scores into a true and error component whereas reliability is a function of the ratio between the true component and the observed component. The reliability coefficient can consequently vary while statistical power remains unchanged, depending on the relative contributions of these components (see Zimmerman & Zumbo, 2015). |
| 9 | This information as well as the variance components associated with the individual facets can be found in the analysis output in the OSF repository. |
| 10 | In some of the studies, not all participants responded to every item. To handle these unbalanced datasets, the models use the average number of observations per participant when estimating variance components. As a result, the number of participants in this table does not correspond to an actual headcount and can be a decimal value (e.g., 45.5 in Kobzeva et al., 2022). |
References
- Almeida, D. (2014). Subliminal wh-islands in Brazilian Portuguese and the consequences for syntactic theory. Revista de ABRALIN, 13(2), 55–93. [Google Scholar] [CrossRef]
- Brennan, R. (2001). Generalizability theory. Springer. [Google Scholar] [CrossRef]
- Brysbaert, M. (2019). How many participants do we have to include in properly powered experiments? A tutorial of power analysis with reference tables. Journal of Cognition, 2(1), 16. [Google Scholar] [CrossRef] [PubMed]
- Christianson, K., Dempsey, J., Tsiola, A., & Goldshtein, M. (2022). What if they’re just not that into you (or your experiment)? On motivation and psycholinguistics. Psychology of Learning and Motivation, 76, 51–88. [Google Scholar] [CrossRef]
- Cowart, W. (1997). Experimental syntax: Applying objective methods to sentence judgments. SAGE. [Google Scholar]
- Cronbach, L., Gleser, G., Nanda, H., & Rajaratnam, N. (1972). The dependability of behavioral measurements: Theory of generalizability for scores and profiles. John Wiley. [Google Scholar]
- Dahl, Ö. (1979). Is linguistics empirical? A critique of Esa Itkonen’s Linguistics and metascience. In T. Perry (Ed.), Evidence and argumentation in linguistics (pp. 13–45). De Gruyter. [Google Scholar] [CrossRef]
- Dempsey, J., & Christianson, K. (2022). Referencing context in sentence processing: A failure to replicate the strong interactive mental models hypothesis. Journal of Memory and Language, 125, 104335. [Google Scholar] [CrossRef]
- Gelman, A. (2018). Ethics in statistical practice and communication: Five recommendations. Significance, 15(5), 40–43. [Google Scholar] [CrossRef]
- Gibson, E., & Fedorenko, E. (2013). The need for quantitative methods in syntax and semantics research. Language and Cognitive Processes, 28(1–2), 88–124. [Google Scholar] [CrossRef]
- Goodall, G. (2021). Sentence acceptability experiments: What, how, and why. In G. Goodall (Ed.), The Cambridge handbook of experimental syntax (pp. 5–39). Cambridge University Press. [Google Scholar] [CrossRef]
- Grieve, J. (2021). Observation, experimentation, and replication in linguistics. Linguistics, 59(5), 1343–1356. [Google Scholar] [CrossRef]
- Häussler, J., & Juzek, T. (2021). Variation in participants and stimuli in acceptability experiments. In G. Goodall (Ed.), The Cambridge handbook of experimental syntax (pp. 97–117). Cambridge University Press. [Google Scholar] [CrossRef]
- Huebner, A., & Lucht, M. (2019). Generalizability Theory in R. Practical Assessment, Research & Evaluation, 24(5), 5. [Google Scholar] [CrossRef]
- Kobzeva, A., Sant, C., Robbins, P., Vos, M., Lohndal, T., & Kush, D. (2022). Comparing island effects for different dependency types in Norwegian. Languages, 7(3), 97. [Google Scholar] [CrossRef]
- Koo, T., & Li, M. (2016). A guideline of selecting and reporting intraclass correlation coefficients for reliability research. Journal of Chiropractic Medicine, 15(2), 155–163. [Google Scholar] [CrossRef]
- Kush, D., Lohndal, T., & Sprouse, J. (2018). Investigating variation in island effects: A case study of Norwegian wh-extraction. Natural Language & Linguistic Theory, 36(3), 743–779. [Google Scholar] [CrossRef]
- Kush, D., Lohndal, T., & Sprouse, J. (2019). On the island sensitivity of topicalization in Norwegian: An experimental investigation. Language, 95(3), 393–420. [Google Scholar] [CrossRef]
- Langsford, S., Perfors, A., Hendrickson, A., Kennedy, L., & Navarro, D. (2018). Quantifying sentence acceptability measures: Reliability, bias, and variability. Glossa: A Journal of General Linguistics, 3, 37. [Google Scholar] [CrossRef]
- Laurinavichyute, A., Himanshu, Y., & Vasishth, S. (2022). Share the code, not just the data: A case study of the reproducibility of articles published in the Journal of Memory and Language under the open data policy. Journal of Memory and Language, 125, 104332. [Google Scholar] [CrossRef]
- Loken, E., & Gelman, A. (2017). Measurement error and the replication crisis: The assumption that measurement error always reduces effect sizes is false. Science, 355(6325), 584–585. [Google Scholar] [CrossRef]
- Marty, P., Chemla, E., & Sprouse, J. (2020). The effect of three basic task features on the sensitivity of acceptability judgment tasks. Glossa: A Journal of General Linguistics, 5, 72. [Google Scholar] [CrossRef]
- Maxwell, S., & Delaney, H. (2004). Designing experiments and analyzing data: A model comparison perspective (2nd ed.). Psychology Press. [Google Scholar] [CrossRef]
- Moore, C. (2016). gtheory: Apply generalizability theory with R (R package version 0.1.2). Available online: https://cran.r-project.org/src/contrib/Archive/gtheory/ (accessed on 24 October 2025).
- O’Brien, R. (2007). A caution regarding rules of thumb for variance inflation factors. Quality and Quantity, 41(5), 673–690. [Google Scholar] [CrossRef]
- Pañeda, C., & Kush, D. (2021). Spanish embedded question island effects revisited: An experimental study. Linguistics, 60(2), 463–504. [Google Scholar] [CrossRef]
- Pañeda, C., Lago, S., Vares, E., Veríssimo, J., & Felser, C. (2020). Island effects in Spanish comprehension. Glossa: A Journal of General Linguistics, 5, 21. [Google Scholar] [CrossRef]
- Peer, E., Rothschild, D., Gordon, A., Evernden, Z., & Damer, E. (2021). Data quality of platforms and panels for online behavioral research. Behavior Research Methods, 54(4), 1643–1662. [Google Scholar] [CrossRef]
- Rajaratnam, N. (1960). Reliability formulas for independent decision data when reliability data are matched. Psychometrika, 25(3), 261–271. [Google Scholar] [CrossRef]
- R Core Team. (2024). R: A language and environment for statistical computing. R Foundation for Statistical Computing. Available online: https://www.R-project.org/ (accessed on 24 October 2025).
- Rietveld, T., & van Hout, R. (1993). Statistical techniques for the study of language and language behaviour. Mouton de Gruyter. [Google Scholar] [CrossRef]
- Rodríguez, A., & Goodall, G. (2023, March 9–11). Clitic left dislocation in Spanish: Island sensitivity without gaps [Conference presentation]. Annual Conference on Human Sentence Processing 36, Pittsburgh, PA, USA. [Google Scholar]
- Roettger, T. (2021). Preregistration in experimental linguistics: Applications, challenges, and limitations. Linguistics, 59(5), 1227–1249. [Google Scholar] [CrossRef]
- Rouder, J., & Haaf, J. (2018). Power, dominance, and constraint: A note on the appeal of different design traditions. Advances in Methods and Practices in Psychological Science, 1(1), 19–26. [Google Scholar] [CrossRef]
- Schoenmakers, G. (2023). Linguistic judgments in 3D: The aesthetic quality, linguistic acceptability, and surface probability of stigmatized and non-stigmatized variation. Linguistics, 61(3), 779–824. [Google Scholar] [CrossRef]
- Schoenmakers, G., & Stoica, I. (2024). An experimental investigation of wh-dependencies in four island types in Romanian. Glossa: A Journal of General Linguistics, 9, 1–39. [Google Scholar] [CrossRef]
- Schoenmakers, G., & van Hout, R. (2024). The internal consistency of acceptability judgments from naïve native speakers. Nederlandse Taalkunde, 29(1), 82–88. [Google Scholar] [CrossRef]
- Schütze, C. (1996/2016). The empirical base of linguistics: Grammaticality judgments and linguistic methodology. Language Science Press. (Original work published 1996 by University of Chicago Press). [Google Scholar] [CrossRef]
- Schütze, C., & Sprouse, J. (2014). Judgment data. In R. Podesva, & D. Sharma (Eds.), Research methods in linguistics (pp. 27–50). Cambridge University Press. [Google Scholar] [CrossRef]
- Shavelson, R., & Webb, N. (1991). Generalizability theory: A primer. SAGE. [Google Scholar]
- Shrout, P., & Fleiss, J. (1979). Intraclass correlations: Uses in assessing rater reliability. Psychological Bulletin, 86(2), 420–428. [Google Scholar] [CrossRef]
- Shrout, P., & Rodgers, J. (2018). Psychology, science, and knowledge construction: Broadening perspectives from the replication crisis. Annual Review of Psychology, 69, 487–510. [Google Scholar] [CrossRef]
- Sönning, L., & Werner, V. (2021). The replication crisis, scientific revolutions, and linguistics. Linguistics, 59(5), 1179–1206. [Google Scholar] [CrossRef]
- Sprouse, J. (2007). A program for experimental syntax: Finding the relationship between acceptability and grammatical knowledge [Ph.D. dissertation, University of Maryland]. [Google Scholar]
- Sprouse, J. (2018). Experimental syntax: Design, analysis, and application. Lecture slides, last updated on 14 December 2018. Available online: https://www.jonsprouse.com/courses/experimental-syntax/slides/full.slides.pdf (accessed on 1 April 2025).
- Sprouse, J., & Almeida, D. (2013). The empirical status of data in syntax: A reply to Gibson and Fedorenko. Language and Cognitive Processes, 28(3), 1–7. [Google Scholar] [CrossRef]
- Sprouse, J., & Almeida, D. (2017). Design sensitivity and statistical power in acceptability judgment experiments. Glossa: A Journal of General Linguistics, 2, 14. [Google Scholar] [CrossRef]
- Sprouse, J., Caponigro, I., Greco, C., & Cecchetto, C. (2016). Experimental syntax and the variation of island effects in English and Italian. Natural Language & Linguistic Theory, 34(1), 307–344. [Google Scholar] [CrossRef]
- Sprouse, J., & Villata, S. (2021). Island effects. In G. Goodall (Ed.), The Cambridge handbook of experimental syntax (pp. 227–258). Cambridge University Press. [Google Scholar] [CrossRef]
- Vasishth, S., & Gelman, A. (2021). How to embrace variation and accept uncertainty in linguistic and psycholinguistic data analysis. Linguistics, 59(5), 1311–1342. [Google Scholar] [CrossRef]
- Winter, B. (2019). Statistics for linguists: An introduction using R. Routledge. [Google Scholar] [CrossRef]
- Zimmerman, D., & Zumbo, B. (2015). Resolving the issue of how reliability is related to statistical power: Adhering to mathematical definitions. Journal of Modern Applied Statistical Methods, 14(2), 9–26. [Google Scholar] [CrossRef]
Disclaimer/Publisher’s Note: The statements, opinions and data contained in all publications are solely those of the individual author(s) and contributor(s) and not of MDPI and/or the editor(s). MDPI and/or the editor(s) disclaim responsibility for any injury to people or property resulting from any ideas, methods, instructions or products referred to in the content. |
© 2025 by the author. Licensee MDPI, Basel, Switzerland. This article is an open access article distributed under the terms and conditions of the Creative Commons Attribution (CC BY) license (https://creativecommons.org/licenses/by/4.0/).